 Ammar B. Bhandari
 Tulsi P. Kharel
- Crop Production System Research Unit, USDA-ARS, Stoneville, MS, United States
Yield loss due to natural disasters, such as storms with high-speed winds and rainfall, can significantly damage standing corn (Zea mays L.) plants and yield. Using a geospatial approach, the study aimed to estimate green snap wind damage to corn and assess potential yield and economic loss in the Mississippi Delta. Midseason corn (V12–V14) snapping occurred on 8 June 2022. We recorded green snap damage in 13 fields [1.0 to 2.0 hectares (ha−1)] with low (224 kg ha−1) and high (336 kg ha−1) N rates and two different row orientations (north–south and east–west) after the damage. The results indicated no nitrogen rates or row orientation effect on green snap damage. The average yield loss could be ~29.25 kg ha−1, with every 1% increase in green snap wind damage causing significant economic loss to producers. Research methods can help scientists to estimate potential green snap yield loss due to severe winds in the larger fields. Research results can also help estimate potential yield and economic loss to assist producers and other stakeholders in decision-making to prepare for changing weather patterns and unprecedented severe windstorms in the future.
1 Introduction
The United States is the largest producer of corn (Zea mays L.) in the world and produced 3.84 billion metric tons (MT) in 2021. The state of Mississippi (MS) produced a total of 28.20 million MT of corn in 2021 (USDA, NASS, 2022). The Delta region accounts for the major corn-growing area within the state of MS (Dhillon et al., 2022). Crop damage from natural disasters such as flooding, hailstorms, and wind impacting yield is common in corn-growing areas (Elmore and Ferguson, 1999; Bundy et al., 2022). Management practices, varieties, and row wind direction also impact the extent of corn damage and yield loss during extreme weather conditions (Elmore et al., 2003). The yield loss from wind damage can be significant, depending on the windstorm’s extent and the damage’s nature. For instance, Elmore and Ferguson (1999) reported a 1% yield loss for every 1% of stalk breakage. Factors inducing early-season plant growth, such as increased nitrogen rates, pre-plant N, and conventional tillage, also increase the risk and susceptibility to wind damage and breakage (Elmore and Ferguson, 1999; Elmore et al., 2003). Studies have indicated that wind damage occurs mainly in mid-vegetative growth stages from V8 to tasseling, primarily due to a lack of brace root development to provide firm anchorage (Carter and Hudelson, 1988; Elmore and Ferguson, 1999; Elmore and Abendroth, 2006) and rapid elongation of plants with brittle stalk (Nafziger, 2011; Butzen, 2011). Seed companies have used different traits to improve stalk strength and green snap simulators to assess wind damage tolerance in corn (Elmore et al., 2003). However, severe straight-line wind speeds of as high as 96.5 km h−1 may still cause significant damage to corn (Elmore and Abendroth, 2006), regardless of improvement and tolerant varieties (Ransom, 2018).
Wind damage can cause significant losses in monetary value to corn producers. In recent years, acreage loss due to wind damage has increased across the corn-growing region. For example, Bundy et al. (2022) reported that 88% of the qualifying US corn-producing counties experienced increased insurance payment for losses due to excess wind. They also noted that the indemnity from the severe wind-driven corn loss was $261 million in August 2020, mainly due to an event on 10 August 2020, indicating that a single event of wind damage could cause a significant economic loss to producers. Likewise, Mills (2021) found significant corn damage impacting ~97,529 acres in the state of MS, resulting in an estimated ~$160 million economic loss due to adverse weather, with significant damage in the MS delta region. Thus, producers must consider excess wind damage as a critical component in the production system when obtaining crop insurance (Bundy et al., 2022).
Nonetheless, minimal studies have addressed the impact of wind damage on corn yield and potential economic loss to producers in MS. Producers obtain crop insurance to mitigate the possible consequences of crop damage due to weather and climate as a risk management tool (Bundy et al., 2022). However, insurance companies may misrepresent the cause of loss to deceive producers into disclaiming coverage. For example, on 18 April 2022, several corn producers in MS asked a federal court in a lawsuit against the insurer to cover wind damage to their crops (Liberatore, 2022) for misrepresenting the cause of the loss to disclaim coverage. Furthermore, due to the potential impact of changing climatic patterns in recent years (Steiner et al., 2018), extreme precipitation events and intense storms are becoming more frequent in the corn Belt (Lindsey and Thomison, 2022), and it is difficult to predict the damages caused by natural disasters, including damaging winds. Furlanetto et al. (2021) highlighted remote sensing techniques with ground measurement as a reference tool to assess site-specific wind damage over large areas. Therefore, techniques and methodologies are needed to estimate wind damage yield loss at the field scale. A field-based estimation approach presented in this paper will be helpful to producers and stakeholders in estimating potential yield loss in larger areas due to green snap wind damage during severe windstorms. The method used in this paper will also serve as a standard procedure to compare and validate remote sensing-based wind damage assessment in the future.
Additionally, establishing research fields to assess wind damages at a field scale is impossible (Wilhelm et al., 1999), and yield loss and its contribution to yield stagnation and gap have been overlooked in recent studies. For example, Dhillon et al. (2022) indicated a yield stagnation in the last 10 years, and the county-level yield gap ranges from 25.9% to 48.8% in MS. They mentioned remote sensing-based N management, crop rotation, site-specific plant densities, hybrid selection, etc., as agronomic strategies to improve corn production. However, the potential yield loss due to wind damage causing the yield stagnation and gap was not considered a likely contributing factor. Assessing potential wind damage, such as a green snap on corn yield, will provide insights into how extreme precipitation events and unpredictable weather scenarios may cause yield loss and contribute to yield stagnation and gap. Moreover, projecting potential yield and economic loss due to excess wind hazard can assist producers with in-season management decision-making to obtain crop insurance and field management. Nonetheless, based on our knowledge, minimal studies estimate potential corn yield and economic loss to producers due to green snap wind damage. Therefore, the study aimed to assess potential green snap wind damage to corn yield and economic loss.
2 Materials and methods
2.1 Study area
This study was conducted at the USDA-ARS Crop Production Systems Research Unit research farms in Stoneville, MS, in 2022. The study included 13 different corn fields [1.0–2.0 hectares (ha)] in size spread over two different farms: Baker farm (33° 42′ N, 90° 55′ W) and Frankel Farm (33° 44′ N, 90° 87′ W). The fields were hipped, subsoiled, and hipped during the fall of 2021. Potassium fertilizer was applied using potassium chloride at 112 kg ha−1 in November 2021. The row distance was 0.96 and 1.0 m at Baker and Frankel Farm, respectively. The corn variety DKC62-08 with SmartStax trait was planted on 11 and 12 April 2022, at 77,805 seeds ha−1. Nitrogen fertilizer was applied on 13 May 2022, using liquid UAN (32% N) at either 224 kg ha−1 or 336 kg ha−1. Phosphorus was not applied as the average soil test indicated P levels (40 mg kg-1) at 0–15 cm that was optimum in all fields. Recommended preemergence and postemergence herbicide programs were followed to manage weeds. The row distance was 1.0 m, and the row orientation was either north–south or east–west. The field sizes, row directions, nitrogen rates, soil types, soil texture, and soil bulk density of the study areas are listed in Table 1. The soil characteristics were estimated using a soil web survey (https://websoilsurvey.sc.egov.usda.gov/App/HomePage.htm, accessed in March 2022).
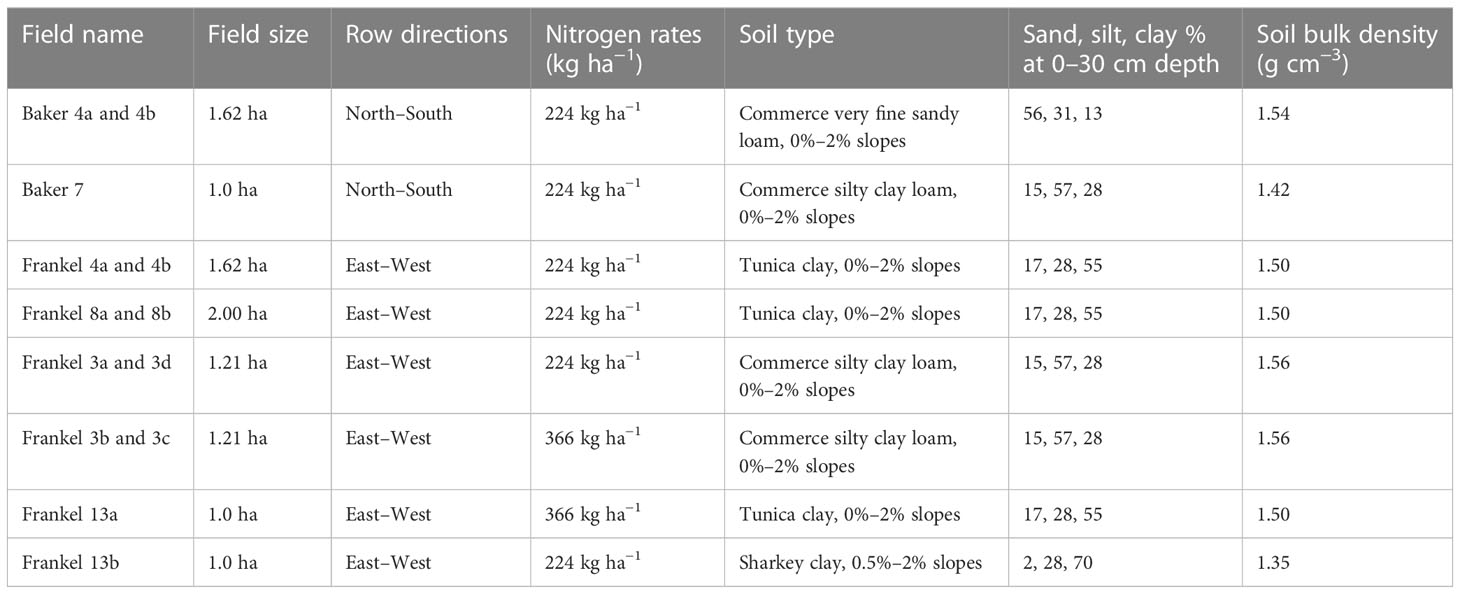
Table 1 Field description, corn rows direction, nitrogen rates, and soil characteristics of the study areas, Stoneville, MS.
2.2 In season corn green snapping damage assessment
According to the National Oceanic and Atmospheric Administration’s National Center for Environmental Information storm events database (NCEI, NOAA, 2022), severe winds occurred on 15 May and 8 June 2022. The wind speed was 88.85 kilometers per hour (km h−1) and 83.3 km h−1 on 15 May and 8 June, respectively. On 15 May, the corn plants had three to five leaf stages (Abendroth et al., 2011), and the corn green snapping damage was insignificant. However, on 8 June, the corn plants were in the 12–14 leaf stage (Abendroth et al., 2011), and the corn green snapping damage was significant. We collected the storm event snapping data on 13 June. We identified and flagged wind-damaged locations (Figures 1A, B) for each field by walking through the cornfield. Each wind damage location (latitude and longitude) was recorded using a Spectra Geospatial SP20 global navigation satellite system (GNSS) unit (Trimble Inc, Sunnyvale, CA, USA) with a sub-meter accuracy. Once all the damaged locations were identified, three locations within each field were randomly selected for damage assessment. Using the SP20 GNSS handheld unit, one additional point within each field was randomly created for a non-damaged location. Hence, within each field, we randomly collected wind-damage assessment data from four locations (referred to hereafter as “sampling points”). Out of four sampling points, three were visually identified wind damage locations, and one was a non-damaged or relatively least damaged area. Hereafter, the damaged plants are those completely snapped at the node or internode below the ear and had minimal chance of recovering.
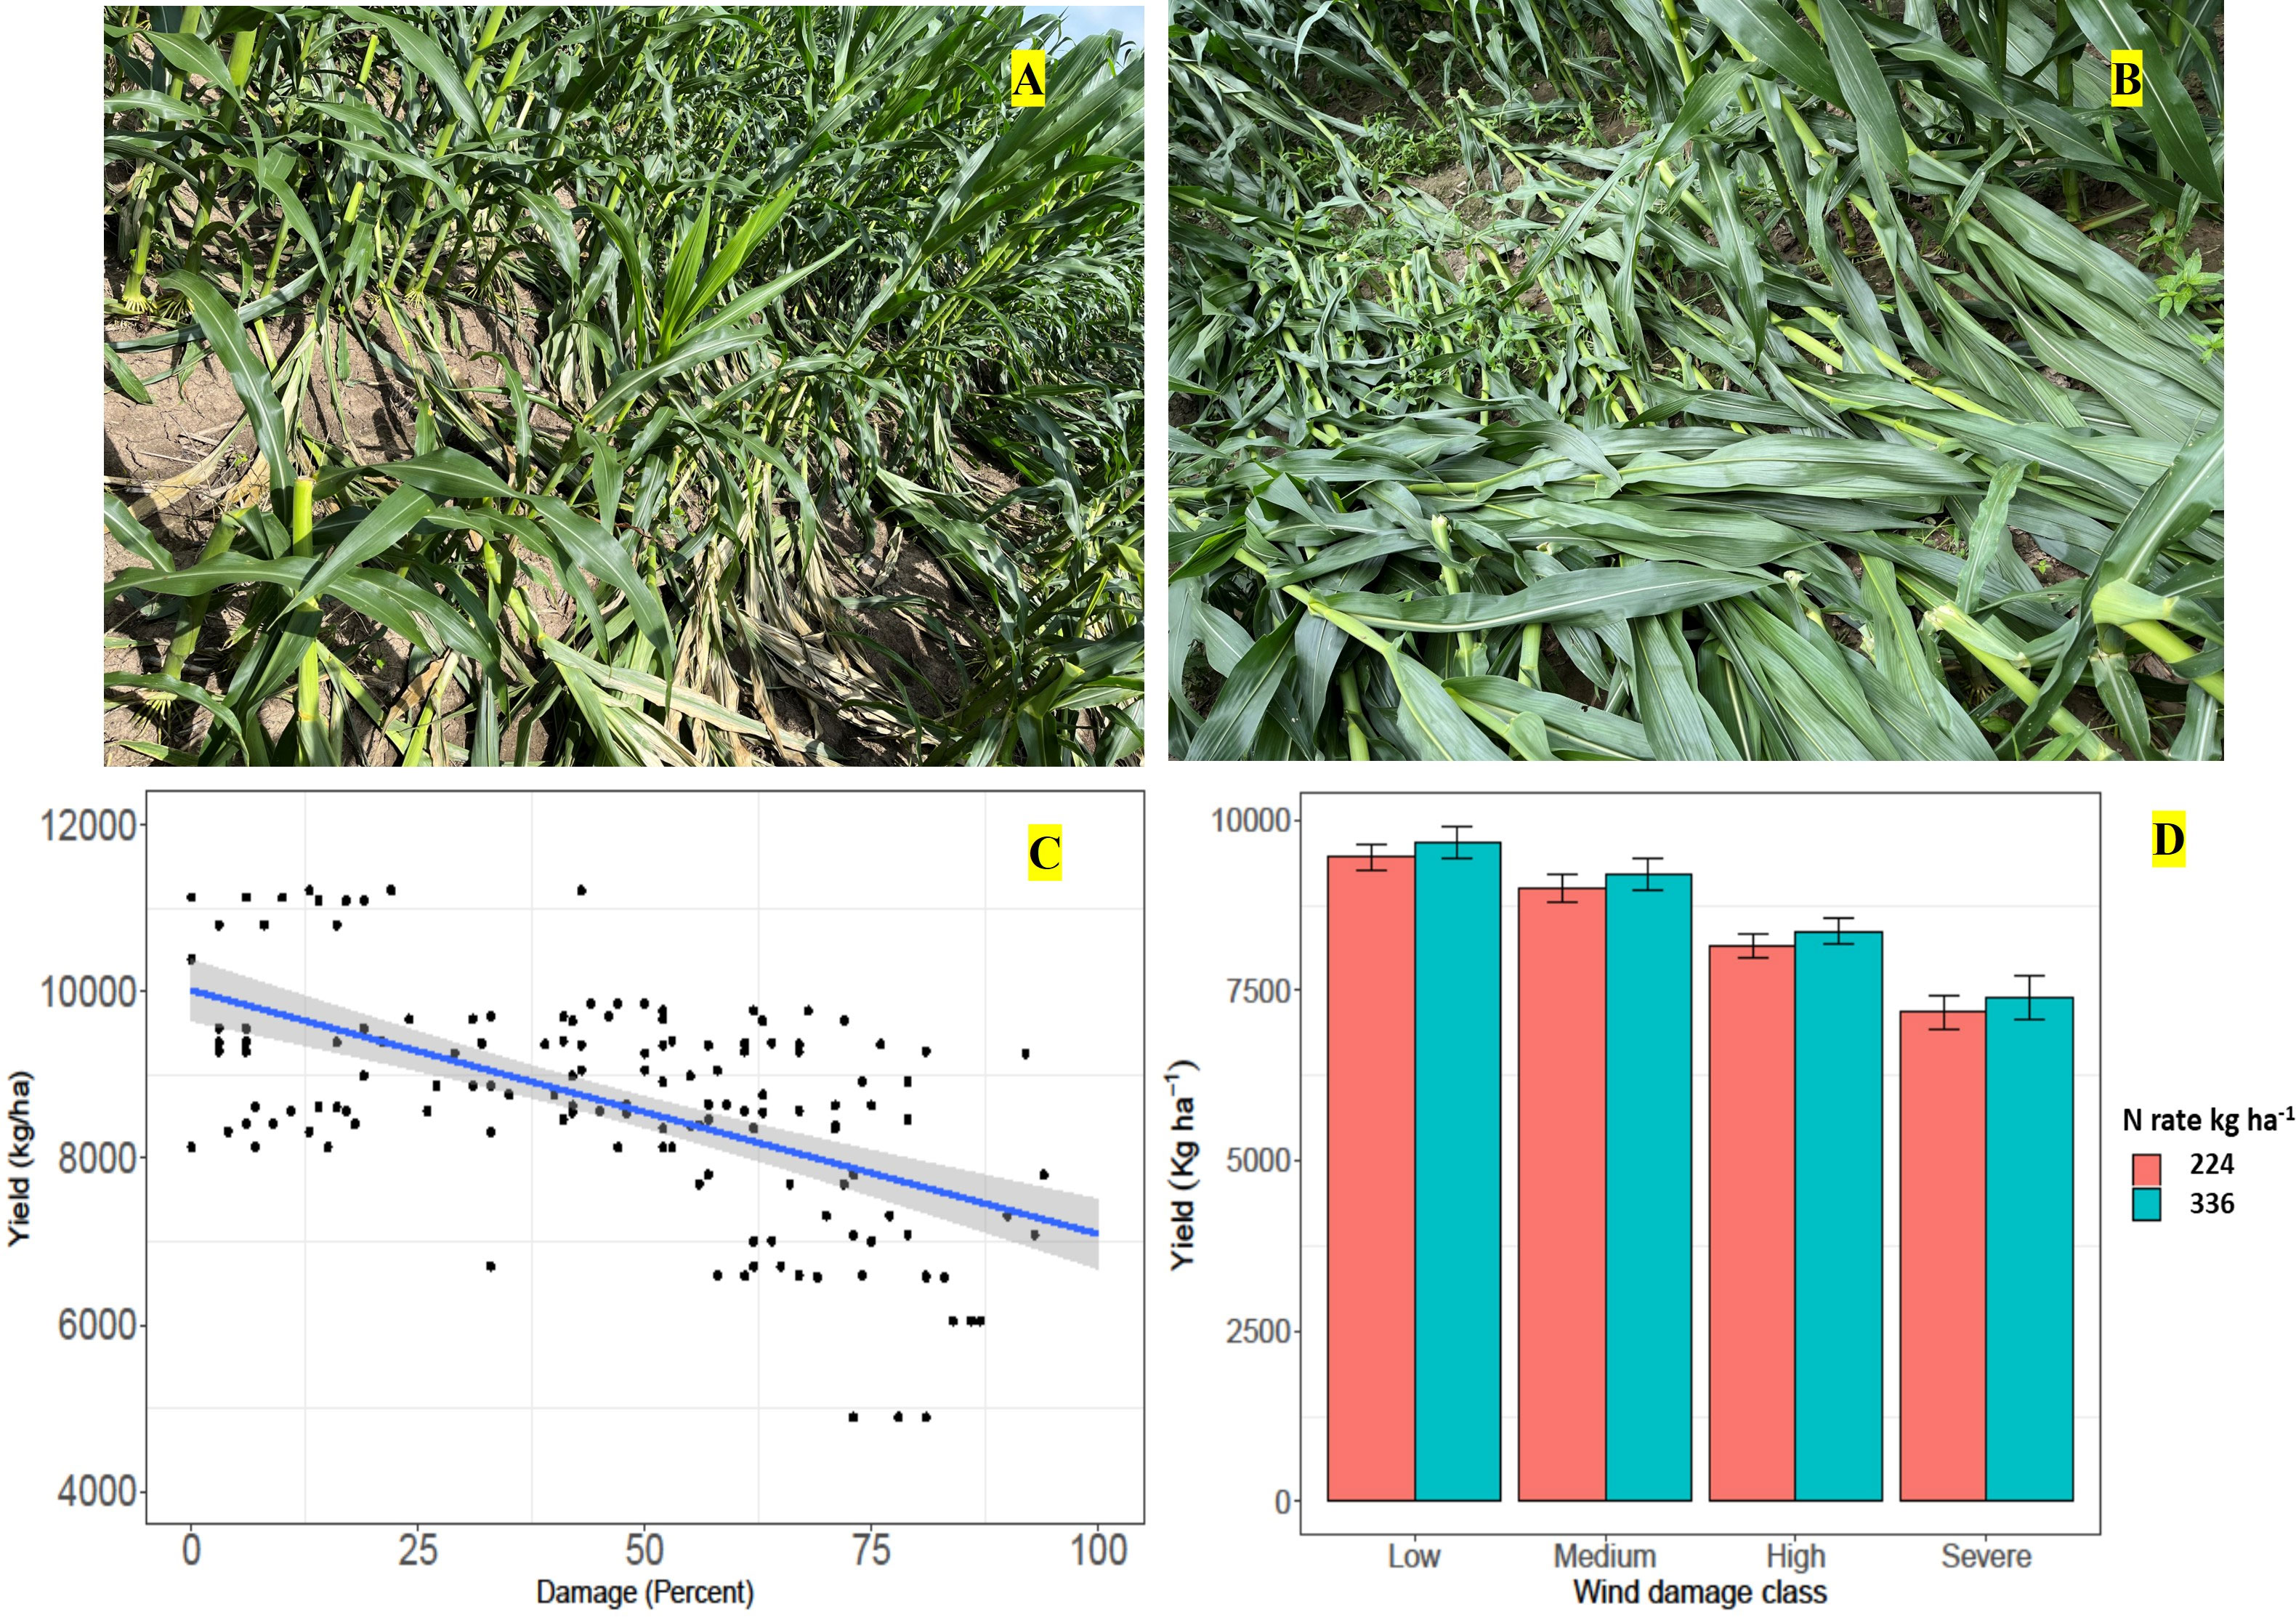
Figure 1 Wind damage %, wind damage class, and N rates in relation to yield loss. (A) Wind damage class—high. (B) Wind damage class—severe. (C) Corn stalk damage % and its linear relationship on measured yield. (D) Least square means of corn yield (bar chart) and their standard error (lines on the top of bar chart) after fixed-effect ANOVA modeling. Different letters above the bar chart represent statistical difference (p ≤ 0.05) in yield (averaged across both nitrogen rates) by each wind damage class (low, <25%; medium, 25%–50%; high, 50%–75%; and severe, >75%).
For wind damage assessment, three rows (1.0 m row spacing) of corn plants and 4.58 m row length were measured at each sampling point. Hence, each sampling point (3 m × 4.58 m) covered a 13.75-m2 area. For each sampling point, green snapped plants and total corn plants (green snapped and standing) were counted. The green snapping damage was recorded as broken at the node or internode and below or above the primary ear. Damage percentage was calculated based on green snapped plants relative to the total number of corn plants on each row.
2.3 Data processing and statistical analysis
Corn was harvested with an 8-row Case IH combine harvester equipped with the Ag Leader (Ag Leader Technology, Ames, IA, USA; https://www.agleader.com/) yield monitor system. Yield data were recorded each second with an average of 1.3 m distance from one point to another yield data point. Yield monitor data were post-processed to clean yield value. Initially, the yield data outside and near the field boundary (headland area) were also removed. After that, data points at the start and end of each pass were also removed. After these three steps, there were 9,247 yield monitor data points throughout the study area. Histograms of yield data were developed in the next step to evaluate yield distribution and the range of high and low yield values. Based on yield distribution within each field, we discarded yield monitor data greater than 17,800 kg ha−1 as outliers, assuming 17.8 Mg ha−1 as the corn yield ceiling in MS (Dhillon et al., 2022). Special consideration was given to the low yield cutoff value so that low yield due to wind damage is not discarded from our dataset (Figure 2). Hence, considering this fact and yield data distribution (histogram) on each field, we discarded the yield value lower than 1,345 kg ha−1. After data cleaning, there were still 9,176 yield data points left for further processing, which indicated that only minimal (71 data points; 0.77% of the total) yield data points were discarded as outliers.
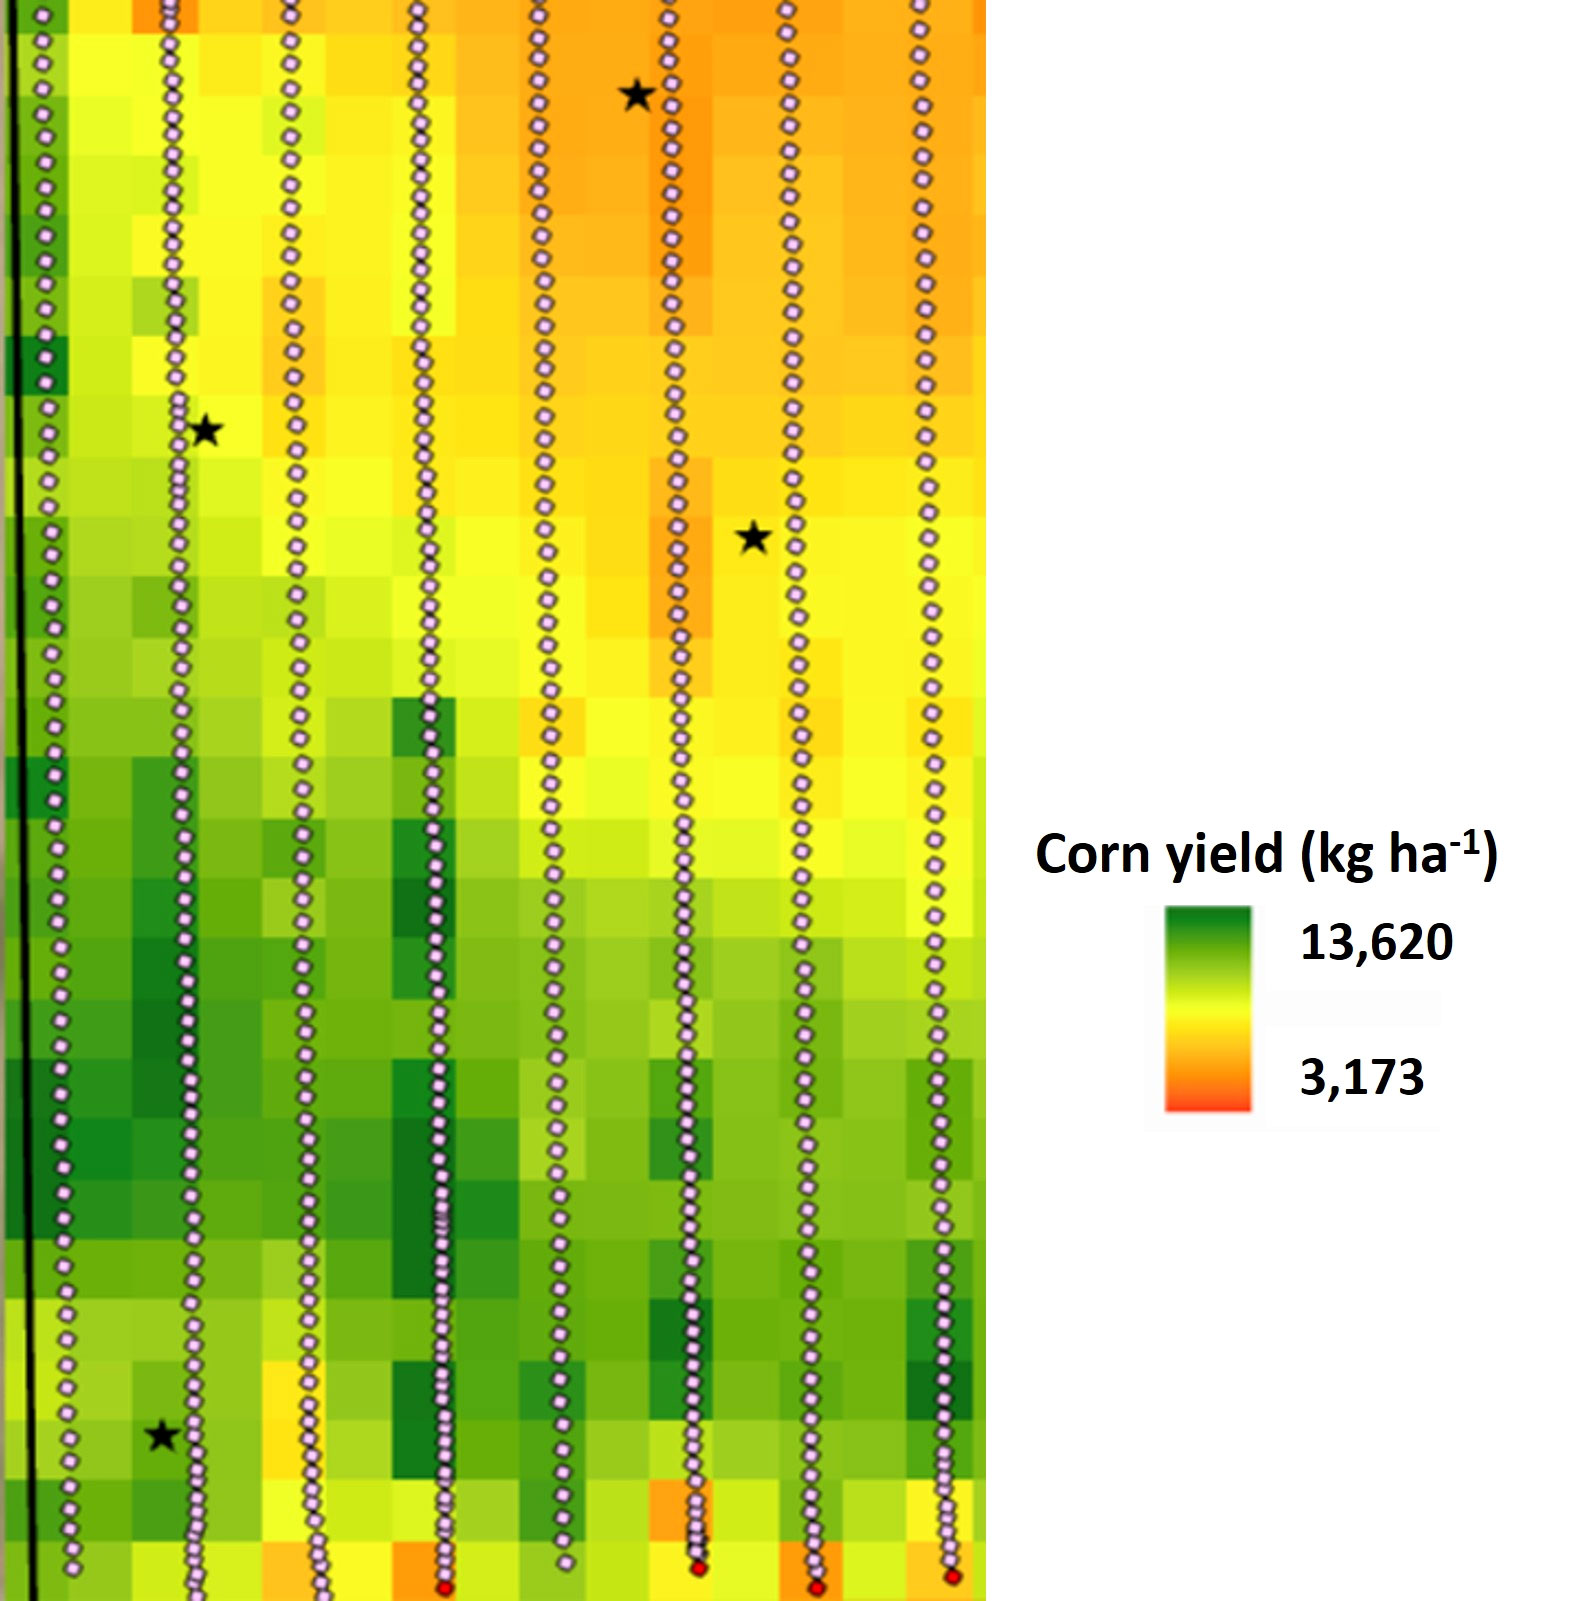
Figure 2 Example dataset from field 8 showing yield monitor data points (after cleaning) with four sampling points marked stars. Yield mapped to each 4 × 4 m square grid using an inverse distance weighted (IDW) method is shown in the background (with legend). Discarded yield data during data cleaning (after minimum and maximum filter was applied) are circled in red (as seen at the lower end of the field map).
Yield monitor point data and wind damage assessment points were recorded in different locations (not overlapping). More specifically, the spatial extent of these two measurements was different. Yield monitor data represent eight rows of combine-head and its travel distance of 1.3 m (8 m × 1.3 m) while wind damage point represents three rows of corn with 4.58 m row length (3 m × 4.58 m). Usually, yield point data are transformed into raster maps using regular grid cells for such comparison. Several methods exist to create point data for raster maps, such as a nearest neighbor, inverse distance weighting (IDW), and kriging. Studies comparing different interpolation methods for yield monitor data recommend IDW as a better or comparable method to complex models needing additional covariates (Bazzi et al., 2015; Souza et al., 2016). In addition, our objective is not to evaluate/compare different interpolation methods in this study; we used one of the simple and commonly used methods, IDW (Isaaks and Srivastava, 1989), to estimate yield value to the wind damage locations. First, each field was divided into 4 m × 4 m square grids to match the sampling point area (3 m × 4.58 m). Each 16-m2 square grid was then filled with an estimated yield value using the IDW method. IDW is an exact local deterministic interpolation method (Watson and Philip, 1985) where the value estimated at each square grid (unsampled area) is the distance-weighted average of values from the sampled area (yield monitor data). IDW estimated yield data were extracted for each sampling point using the stars:st_extract function. All data cleaning and spatial processing were conducted in R (R Core Team, 2021), using “sf” (Pebesma, 2018), “stars” (Pebesma, 2022), and “gstat” (Pebesma, 2004; Gräler et al., 2016) packages. The IDW method was used from the gstat::idw function. The dataset prepared at this stage contained wind damage percentage, yield data, nitrogen rates, row orientations, field name, sampling point, and latitude and longitude.
Damage percent and its relationship with yield were explored using scatter plots and fitting linear models. The analysis of variance (ANOVA) procedure was used to see the effect of nitrogen rate and row orientation on both corn yield and damage percentage. Nitrogen rates and row orientations were used as a fixed effect, while the number of fields was random replication. In the next step, we classified damage percent into four classes. Low, medium, high, and severe damage classes corresponding to <25%, 25%–50%, 50%–75%, and >75% were assigned. ANOVA was run to see how damage classes (low to severe) affected the observed yield value. The statistical significance level was set up at p ≤ 0.05. Statistical computing environment R was used to analyze the datasets and to perform statistical analysis.
3 Results and discussion
3.1 Potential mid-season corn damage and yield loss due to windstorm
The linear regression model showed that average corn yield without green snap damage was 10,016 kg ha−1, and the yield decreased by 29.25 kg ha−1 with every 1% corn green snapping in the field (Figure 1C). The average green snap wind damage was 46% in the study area, translating into ~1,346 kg ha−1 of corn loss. Factoring the average corn price of $255 per metric ton in November 2022 (USDA, NASS, 2022), a total potential monetary value loss by a producer from green snap damage can be ~$343 ha−1. Therefore, the study indicated that during severe windstorms, the green snap damage can result in significant yield and economic loss to producers. Most of the green snap damage (95%) in our study was well below the primary ear with little or no chance of developing an ear, and 99% of the damage was at the node (data not reported). Our research findings showed a 0.29% yield loss (29.25 kg out of 10,061 kg ha−1) for every 1% wind green snap damage. The result was corroborated by Lindsey and Thomison (2022), who reported a 13%–17% yield loss with 50% of corn plants being green snapped. Ransom (2018) also reported an average of 27% yield reduction when plants were green snapped by 75% at the V12 stage. In contrast, Knaak (2011) reported slightly higher (0.5%–0.73%) yield loss for every 1% stalk breakage below the ear due to simulated (hand breaking of corn plants) green snap damage, and Elmore and Ferguson (1999) reported a 1% yield loss for every 1% stalk breakage due to severe wind damage. However, in Elmore and Ferguson’s study, the extent of wind speed (129–161 km h−1) was substantially greater than ours (83–88.85 km h−1), which might have resulted in more corn damage and yield loss. In addition, the standing corn plants in our study might have compensated (Elmore, 2011) for overall yield, resulting in less loss than the percentage of broken plants might suggest (Nafziger, 2011).
We further analyzed data by classifying green snap wind damage percent into low (<25%), medium (25%–50%), high (50%–75%), and severe (>75%) damage classes. The yield loss was significantly different for each damage class, with an average yield of 9,332 and 9,674 kg ha−1 in low-damaged areas with 224 kg ha−1 N and 336 kg ha−1 N rates compared to 7,086 and 7,428 kg ha−1 in severely damaged areas, respectively (Figure 1C). There could be ~2,250 kg ha−1 (23.25%) yield loss when comparing low and severe wind damage classes. The research results indicated that when factoring the average corn price of $255 per metric ton in November 2022 (USDA, NASS, 2022), a total potential monetary value loss by a producer from a severe green snap wind damage can be ~$573 ha−1.
Interestingly, the damages in most fields were isolated and may go unnoticed by producers from outside the field. For instance, we found significantly damaged rows (four to six rows) within a 7- to 10-m area in the fields. After that, another six to eight rows of corn were undamaged. However, we found more similar damaged pockets inside the field. Therefore, producers observing their fields outside may be easily deceived and miss such damages caused by high winds and underestimate the impacts on overall corn yield. Furthermore, on 15 May, the corn plants were at the four to five leaf stage, and the green snap damage was insignificant, indicating that corn growth stage can impact green snap wind damage. However, on 8 June, the corn plants were in the 12 to 14 leaf stage, and the green snap damage was significant. Studies have indicated a higher risk of green snap damage when the corn is in rapid growth between V8 and tasseling (Nafziger, 2011; Butzen, 2011) and when corn plants are not fully lignified to resist snapping (Ransom, 2018). Therefore, the growth stage of corn was also an important factor to be considered when estimating severe wind damage to corn.
Moreover, the U.S. Department of Agriculture (USDA) Risk Management Agency (RMA) administers the federal crop insurance program to assist producers with crop damage (Shields, 2015). Therefore, identifying green snap wind damage and the potential yield loss on time and right after the windstorms is vital for producers in decision-making on crop insurance. If the damage were assessed on time, producers could claim from the crop insurance for their financial safety. It can help avoid crop insurer’s deception and legal challenges. Moreover, crop insurance companies and producers can use the study findings to obtain or claim crop insurance to adapt to unprecedented crop damage due to severe weather (Mieno et al., 2018) and provide an essential financial safety net for producers (Bundy et al., 2022) without jeopardizing them financially.
3.2 Impact high and low nitrogen rates on wind damage
Although not statistically different, results indicated that a higher nitrogen (336 kg ha−1) rate had a lower percentage of damage (41.3%) compared to a lower N (224 kg ha−1) rate (48.2%) (data not reported). It might be due to the minimal impact of nitrogen fertilizer application rates on the growth and development of the corn hybrid used in the study. For instance, visual observations of damage during the growing season on both the high and low nitrogen fertilizer rates in our study were very similar. The average yield was 9,001 kg ha−1 and 8,453 kg ha−1, with higher and lower nitrogen rates, respectively (Figure 1D). The lower yield might be because of lower N application rates (Torbert et al., 2001; Gehl et al., 2005) plus greater wind damage compared (48.22% with low N rates vs. 41.33% with high N rates) to the higher N application rates. In contrast, Elmore and Ferguson (1999) reported more significant stalk breakage with higher nitrogen rates. However, as stated earlier, the extent of wind speed was substantially greater in their study than to ours, which could confound the N rate damage results. Wilhelm et al. (1999) also reported that storm-damaged plants increased from 8% for 0 kg ha−1 to 24% when N fertilization was applied at 80 kg N ha−1, indicating that hybrid, planting date, N fertilization, and their interactions affected the brittle snap.
3.3 Impact of rows orientation on wind damage
We compared results for the fields’ east–west and north–south row orientation and the extent of the wind damage. The results indicated that the row orientation did not affect standing corn plants’ wind damage (p ≥ 0.76). However, Elmore et al., (2003), with much greater storm events (129–161 km h−1) compared to this study, reported that extreme winds perpendicular to rows caused the most severe damage to corn. It also indicated that the storm event strength could be vital in causing corn damage in the field during a severe windstorm. Elmore and Ferguson (1999) also reported more significant storm damage in north–south rows in 1993 but greater damage in east–west in 1994, indicating that the direction of wind affects the extent of damage in corn. Nevertheless, our results indicated that the extent of wind green snap damage during a severe windstorm to mid-season corn plants would not differ by row orientations, warranting more research and re-evaluation.
4 Conclusions
These results indicate that N rates and row orientation had no significant effect on green snap wind damage when severe storms occurred during the mid-growing season in corn. Furthermore, the severity of green snap wind damage was negligible when the corn was at the V3–V5 compared to the V12–V14 growth stages. Therefore, agronomic strategies such as late planting, optimal nutrient management, and tolerant hybrids may help limit wind damage and yield loss. Also, a better understanding of green snapping damage research is needed to select resistant breeding lines to accommodate the changing weather patterns and unprecedented storms in the future to minimize yield loss. More focus and study are also required to estimate how changing weather patterns and unprecedented severe windstorms can damage corn and cause potential yield loss to producers on a larger scale using similar methods as were used in this study. In addition, crop loss assessment due to wind damage, such as green snap, should be part of a production system for making in-season management decisions and continuing efforts to ensure producers’ financial stability and sustainable farm income.
Data availability statement
The original contributions presented in the study are included in the article. Further inquiries can be directed to the corresponding author.
Author contributions
AB: Conceptualization, data curation, formal analysis, investigation, methodology, validation, and writing—original draft. TK: Data curation, formal analysis, investigation, methodology, validation, and writing—review and editing. KR: Writing—review and editing and project administration. All the authors approve the final manuscript for publication.
Conflict of interest
The authors declare that the research was conducted in the absence of any commercial or financial relationships that could be construed as a potential conflict of interest.
Publisher’s note
All claims expressed in this article are solely those of the authors and do not necessarily represent those of their affiliated organizations, or those of the publisher, the editors and the reviewers. Any product that may be evaluated in this article, or claim that may be made by its manufacturer, is not guaranteed or endorsed by the publisher.
References
Abendroth L. J., Elmore R. W., Boyer M. J., Marlay S. K. (2011). Corn growth and development (Ames: PMR 1009. Iowa State Univ.).
Bazzi C. L., Souza E. G., Khosla R., Uribe-Opazo M. A., Schenatto K. (2015). Profit maps for precisión agriculture. Ciencia e investigación agraria 42 (3), 305–330. doi: 10.4067/S0718-16202015000300007
Bundy L. R., Gensini V. A., Russo M. S. (2022). Insured corn losses in the United State from weather and climate perils. J App. Meteoro Clim. 61 (8), 969–988. doi: 10.1175/JAMC-D-21-0245.1
Butzen S. (2011). Crop insights: Brittle snap injury in corn. Pioneer Agronomy Sciences 21 (11), 1–5.
Carter P. R., Hudelson K. D. (1988). Influence of simulated wind lodging on corn growth and grain yield. J. @ Prod. Ag. 1, 295–299. doi: 10.2134/jpa1988.0295
Dhillon J., Li X., Bheemanahalli R., Reed V. (2022). Mississippi state and county level yield gap in corn production. Agri Environ. L. 7, e20092. doi: 10.1002/ael2.20092
Elmore R. (2011) Wind and corn. Available at: https://crops.extension.iastate.edu/cropnews/2011/07/wind-and-corn (Accessed March 2022).
Elmore R., Abendroth L. (2006). “Greensnap in Iowa,” in Integrated Crop Management newsletter IC-498(19) (Iowa: Iowa State University Extension).
Elmore R. W., Ferguson R. B. (1999). Mid-season stalk breakage in corn: hybrid and environmental factors. J. @ Prod. Ag. 12, 293–299. doi: 10.2134/jpa1999.0293
Elmore R. W., Hoffmeister G. Jr., Klein R., Marx D. B. (2003). Corn green snap from extreme wind is influenced by several factors. Crop Manage 2 (1), 1–12. doi: 10.1094/CM-2003-1212-01-RS
Furlanetto J., Ferro N. D., Briffaut F., Carotta L., Polese R., Dramis A., et al. (2021). “Mapping of hailstorm and strong wind damaged crop areas using LAI estimated from multispectral imagery,” in Precision agriculture ‘21 (The Netherlands: Wageningen Academic Publishers), 315–321. doi: 10.3920/978-90-8686-916-9
Gehl R. J., Schmidt J. P., Maddux L. D., Gordon W. B. (2005). Corn yield response to nitrogen rate and timing in sandy irrigated soils. Agron. J. 97, 1230–1238. doi: 10.2134/agronj2004.0303
Gräler B., Pebesma E., Heuvelink G. (2016). Spatio-Temporal Interpolation using gstat. R. J. 8 (1), 204–218. doi: 10.32614/RJ-2016-014
Isaaks E. H., Srivastava R. M. (1989). An Introduction to Applied Geostatistics (New York: Oxford University Press).
Knaak M. (2011) Green snap in corn and effects on yield. Available at: https://masters.agron.iastate.edu/files/knaakmelanie-cc.pdf (Accessed March 10, 2023).
Liberatore J. (2022) Farmers accuse insurer of contrived crop coverage denial (Law360, Insurance Authority). Available at: https://www.law360.com/insurance-authority/articles/1485064/farmers-accuse-insurer-of-contrived-crop-coverage-denial (Accessed March 17, 2023).
Lindsey A., Thomison P. (2022) Corn yield response to damage from strong storms. Corn Yield Response to Damage from Strong Storms (Ohioline) (Accessed March 22, 2023).
Mieno T., Walters C. G., Fulginiti L. E. (2018). Input use under crop insurance: The role of actual production history. A. J. @ Agric. Eco. 100, 1469–1485. doi: 10.1093/ajae/aay040
Mills B. (2021) 2021 Mississippi agricultural crop damage assessment (Publication 3686 (POD-08-21). Available at: http://extension.msstate.edu/sites/default/files/publications/publications/P3686_web.pdf (Accessed March 21, 2023).
Nafziger E. (2011). Damage in corn. Integrated Pest Management: The Bulletin (Illinois: University of Illinois Extension No. 15 Article 5).
National Centers for Environmental Information, National Oceanic and atmospheric Administration (2022). Available at: https://www.ncdc.noaa.gov/stormevents/.
Pebesma E. (2004). Multivariable geostatistics in S: the gstat package. Comp. Geosci. 30, 683–691. doi: 10.1016/j.cageo.2004.03.012
Pebesma E. (2018). Simple Features for R: Standardized support for spatial vector data. R. J. 10 (1), 439–446. doi: 10.32614/RJ-2018-009
Pebesma E. (2022). Stars: spatiotemporal arrays, raster and vector data cubes (R package version 0.6-0). Available at: https://CRAN.R-project.org/package=stars.
Ransom J. (2018) Green snap in corn (North Dakota State University). Available at: www.ag.ndsu.edu/cpr/plant-science/grren-snap-in-corn-07-05-18 (Accessed March 20, 2023).
R Core Team (2021). R: A language and environment for statistical computing (Vienna, Austria: R Foundation for Statistical Computing). Available at: https://www.R-project.org/.
Shields D. A. (2015). Federal crop insurance: Background (Congressional Research Service Report), R40532. Available at: https://crsreports.congress.gov/product/pdf/R/R40532. 23 pp.
Souza E. G., Bazzi C. L., Khosla R., Uribe-Opazo M. A., Reich R. M. (2016). Interpolation type and data computation of crop yield maps is important for precision crop production. J. Pl Nut 39 (4), 531–538. doi: 10.1080/01904167.2015.1124893
Steiner J. L., Briske D. D., Brown D. P., Rottler C. M. (2018). Vulnerability of southern plains agriculture to climate change. Climatic Change 146, 201–218. doi: 10.1007/s10584-017-1965-5
Torbert H. A., Potter K. N., Morrison J. E. Jr. (2001). Tillage system, fertilizer nitrogen rate, and timing effect on corn yields in the texas blackland prairie. Agron. J. 93, 1119–1124.
United States Department Agriculture-NASS, Economics, Statistics, & Market Information System (2022) Agricultural Prices. Available at: https://downloads.usda.library.cornell.edu/usdaesmis/files/c821gj76b/4x51jw70g/pr76gf69s/agpr1222.pdf (Accessed March 9, 2023).
United States Department of Agriculture (2021) National Agricultural Statistics Service: Quick stats (USDA). Available at: https://www.nass.usda.gov/Quick_Stats/ (Accessed March 15, 2023).
Watson D. F., Philip G. M. (1985). A refinement of inverse distance weighted interpolation. Geo-Processing 2, 315–327.
Keywords: green snap, corn yield, economic loss, wind damage, crop insurance
Citation: Bhandari AB, Kharel TP and Reddy KN (2023) Assessing wind damage and potential yield loss in mid-season corn using a geospatial approach. Front. Agron. 5:1195761. doi: 10.3389/fagro.2023.1195761
Received: 28 March 2023; Accepted: 05 July 2023;
Published: 20 July 2023.
Edited by:
Francesco Morari, University of Padua, ItalyReviewed by:
Calogero Schillaci, Joint Research Centre, ItalyNavneet Kumar, University of Bonn, Germany
Copyright © 2023 Bhandari, Kharel and Reddy. This is an open-access article distributed under the terms of the Creative Commons Attribution License (CC BY). The use, distribution or reproduction in other forums is permitted, provided the original author(s) and the copyright owner(s) are credited and that the original publication in this journal is cited, in accordance with accepted academic practice. No use, distribution or reproduction is permitted which does not comply with these terms.
*Correspondence: Ammar B. Bhandari, YW1tYXIuYmhhbmRhcmlAdXNkYS5nb3Y=