 Verónica Berriel*
 Carlos H. Perdomo
- Soil and Water Department, Agronomy College, University of the Republic, Montevideo, Uruguay
Cover crops can increase agricultural sustainability by protecting soil from erosion, increasing biodiversity, and symbiotically incorporating fixed nitrogen (N) into the soil. Nowadays, however, in Uruguay mostly grasses are planted in autumn to protect the soil from erosion. Another option is to study tropical legumes’ performance as cover crops, which can fix substantial amounts of nitrogen in short growing periods, thereby bridging the knowledge gap in Uruguayan agriculture. The main objective was to evaluate and compare the performance of six tropical legumes (Crotalaria juncea, Crotalaria spectabilis, Crotalaria ochroleuca, Cajanus cajan, Dolichos lablab, Mucuna pruriens) and the temperate legume Glycine max. The evaluation focused on aboveground biomass and the N mass derived from fixation (NmdFix), as well as other attributes; three field experiments were conducted on a southern Uruguay farm during the summers of 2017, 2018, and 2019. The growing cycle lengths for the cover crops in 2017, 2018, and 2019 were 117, 130, and 90 days, respectively. The results showed that when planting was done at late December (2017 and 2018 growing cycles), the species with the highest mean biomass yield were Crotalaria juncea (two year average 12.0 Mg ha-1) and Cajanus cajan (11.0 Mg ha-1), but Cajanus cajan (149 kg ha-1) more than doubled the NmdFix mass of Crotalaria juncea (57 kg ha-1). In 2018 biomass yields were much higher than in 2017, with Glycine max (20.0 Mg ha-1) yielding at a similar level to Crotalaria juncea and Cajanus cajan (20.5 and 18.7 Mg ha-1, respectively). Amounts of NmdFix, however, were much higher in Glycine max and Cajanus cajan (263 and 253 kg N ha-1, respectively), than in Crotalaria juncea (91 kg N ha-1). In 2019 planting had to be delayed until early February and only Glycine max maintained acceptable biomass and NmdFix levels. In conclusion, based on its fixing N potential, for late December sowings Cajanus cajan and Glycine max would be the most promising species for cover crop use, while for late January or early February sowings, only Glycine max would an option because the tropical species seriously impaired their productivity when grew longer into the cooler autumn temperatures.
1 Introduction
Cover crops can offer multiple ecosystem services by maintaining growing vegetation between cash crops, but one of their most important functions is to reduce water erosion by cushioning the raindrop impact on the soil surface (López-Vicente et al., 2020; Scavo et al., 2022). This soil-surface protection also reduces crusting, which in turn increases water infiltration and decreases surface runoff (Folorunso et al., 1992). Furthermore, the presence of growing plants can help to prevent nitrate leaching with respect to rotations with fallow periods between crops (Plaza-Bonilla et al., 2015; Kaye and Quemada, 2017; Kaye et al., 2019). The biodiversity increase that the use of cover crops imply with respect to fallow an also lead to weed suppression by a combination of resource competition and allopathic effects of crops either alive or decaying (Weston, 1996; Restuccia et al., 2020), as well as for the physical effect of shading (Fernando and Shrestha, 2023). Their use could also help to reduce nematode infestation, like from the Crotalaria genus and others (McSorley et al., 1994; Karuri, 2022) and pests (Sarrantonio and Gallandt, 2003). Therefore, cover crops could reduce the use of agrochemicals, reducing health risks (Zemmouri et al., 2022), and with the clear economic and environmental advantages that this implies (Weston, 1996; Rosa-Schleich et al, 2019).
One of the main attributes considered when selecting species for cover-crop purposes is high biomass productivity, which is related not only to greater soil protection against erosion but also to a high carbon sequestration capacity, since according to Vergutz et al. (2012), the carbon concentration in plant dry matter is relatively constant and close to 44%. For this reason, at least in Uruguay (Sawchik et al., 2015) and in some regions of Brazil (Cordeiro et al., 2022) species used as cover crops are mostly grasses. Nonetheless, the use of pure legumes or grass-legume mixtures can also bring benefits, by allowing the input of significant nitrogen (N) amounts into the soil-plant system via symbiotic fixation (BNF), which could help to equilibrate the negative N balances that characterize many current agricultural rotations (Houassine et al., 2019). The legume species used as cover crops should also be able to maintain low C/N ratios throughout their termination, so that residue mineralization by soil microorganisms can proceed fast, and results in a net N contribution to the following crop (Rose et al., 2022). Cover-crop termination, on the other hand, should be synchronized with the subsequent-crop planting date, to allow that the timing of maximum nitrogen demand by the subsequent crop coincide with when most of the N in cover-crop biomass is released. In this way, the N-uptake efficiency of cover crop’s N content would be maximized (Cherr et al., 2006). A disadvantage of using cover crops is that they compete for available soil water with the following cash crop. For this reason, under rainfed conditions, the species used for these purposes should present a high-water use efficiency (WUE). Moreover, cover crop termination should also be done early enough to allow replenishment by the rain of soil water reserves before the subsequent crop is planted (Garba et al., 2022). Therefore, complex management adjustments could be needed to comprehensively optimize the different services provided by cover crops and maximize agricultural sustainability (Macedo et al., 2015; Gezahegn et al., 2016; Barel et al., 2019; Rose et al., 2022).
At the local level, the election of species to be used as cover crops should be based on the required attributes according to the specific characteristics of each region (Nielsen and Vigil, 2005; Plaza-Bonilla et al., 2015; Appelgate et al., 2017; Nielsen et al., 2017; Holman et al., 2021). In subtropical Uruguayan conditions, the use of tropical legumes as cover crops could be relevant because these species would be cultivated in summer when solar radiation and photosynthesis rate peak, and thus BNF, which has a high energy cost (Stam et al., 1987; Giller, 2001; Mathesius, 2022) would also be maximized. Under favorable conditions, the N mass fixed by these tropical species could be enough to reduce or even equilibrate the negative N balance of many current agricultural systems (Chikowo et al., 2004; Dantas et al., 2019). These authors reported that the use of Vigna unguiculata (cowpea) and Cajanus cajan (pigeon pea) as cover crops in Zimbabwe resulted in inputs of 28 and 96 kg N ha–1. Balkcom and Reeves (2005), in Alabama (USA), reported that a cover crop of Crotalaria juncea (sunn-hemp) produced on average an equivalent of 58 kg N fertilizer over 3 years. These figures, however, can vary widely even within the same species, depending on several factors, e.g., the amount of N supplied by the soil, available water, phosphorus limitations, toxicities, and management practices (Giller, 2001). In the case of Crotalaria juncea, for instance, it has been reported that the proportion of fixed N can fluctuate between 27% to 91% of its total (Cherr et al., 2006). Variations in the BNF rate could also be a consequence of the diversity of soil types on which these species grow as well as rhizobia variation within a soil type (Peoples et al., 2009; Jaramillo et al., 2020).
Since cover crops compete with cash crops for land, the likelihood of cover crops adoption by farmers would increase if they provided multiple services (Cherr et al., 2006). Our group conducted a controlled study evaluating attributes of Crotalaria juncea, Crotalaria spectabilis, Crotalaria ochroleuca, and Cajanus cajan in pots with southern Uruguayan soil (Berriel et al., 2022a). Results showed that Cajanus cajan ranked highest and Crotalaria juncea ranked lowest in fixed nitrogen amount, despite all species forming effective symbiosis with native rhizobia. Furthermore, Crotalaria juncea showed a higher C/N ratio at termination and a lower WUE than Cajanus cajan, while the other species were in between. Moreover, Cajanus cajan was also on top in terms of a proposed index that evaluated the WUE for BNF, defined as the ratio of mass of N fixed over 13C discrimination (proxy of WUE). Therefore, Cajanus cajan would be the best choice. However, field performance may differ, so these rankings are not definitive.
In today’s Uruguayan agriculture, additional N inputs derived from the atmosphere through biological nitrogen fixation are clearly needed, since continuous cropping is a common practice and crop-pasture rotations are quickly disappearing (García Préchac et al, 2010). Hence, the introduction of tropical legumes as cover crops could help to increase Uruguayan agricultural sustainability, but information about species behavior under field conditions is scarce since only one study that evaluated only biomass has been reported (Macedo et al., 2015). In this context, our research hypothesis posited that the introduction of tropical legumes as cover crops in Uruguayan agriculture will enhance agricultural sustainability through increased biological nitrogen fixation (BNF), carbon sequestration, and water use efficiency (WUE). The objective of this work was to evaluate in the field the performance as cover crops of six tropical legumes (Crotalaria juncea, Crotalaria spectabilis, Crotalaria ochroleuca, Cajanus cajan, Dolichos lablab, Mucuna pruriens) and Glycine max, based not only on their biomass productivity, but also on their behavior in terms of BNF, C sequestration, and WUE, in order to expand the existing knowledge gap by conducting a comprehensive field-based study on the behavior and performance of tropical legumes as cover crops in Uruguayan agriculture, and to provide valuable insights and practical recommendations for the successful adoption of tropical legumes as cover crops in the Uruguayan agricultural system.
2 Materials and methods
Three field experiments were installed on 12/28/2016, 12/21/2017, and 2/1/2019 (one per year) on different locations of a commercial agricultural farm located near the city of Libertad (-34.36 S, -56.33W) in the San José Department of Uruguay. The physico-chemicalcharacteristics of the soil are presented in Table 1.
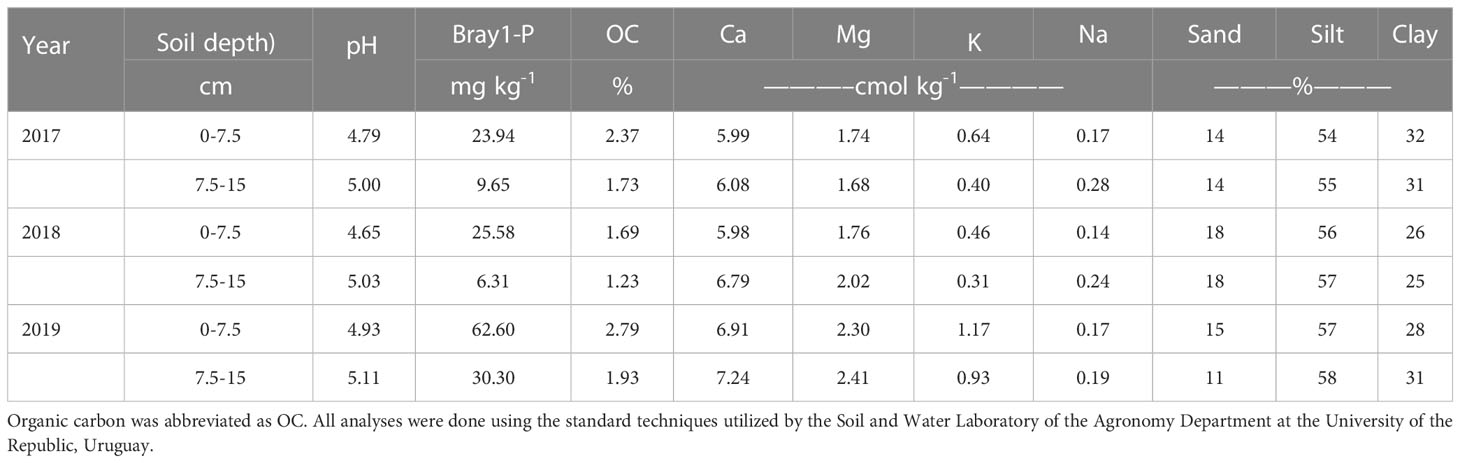
Table 1 Information on several soil physico-chemical characteristics at two depths for the different sites at the three experimental years.
The tropical legumes used across years were Crotalaria juncea L., Crotalaria spectabilis Roth, Crotalaria ochroleuca G. Don., Cajanus cajan L., Dolichos lablab L. and Mucuna pruriens L., and Glycine max L., a temperate legume (hereafter abbreviated as C. juncea, C. spectabilis, C. ochroleuca, C. cajan, D. lablab, M. pruriens and G. max, respectively), but this last species was only evaluated in 2018 and 2019.
The seeds of the tropical legumes were imported each year from the BrSeeds Company of Brazil (https://www.brseeds.com), since they are not available in Uruguay, while the seeds of G. max were locally procured. Tropical legume seeds were not inoculated with rhizobia, because commercial inoculants were not available. In the case of G. max commercial inoculants were available but not used since these fields had a long history of G. max cropping and it was preferred to keep all species under similar management. Planting densities and depths of the tropical legumes were those recommended by this company, while in the case of G. max the local recommendation was used (Table 2). The planting dates of the first two years were determined by the harvest date of the previous commercial crop, while the late planting in 2019 was due to a severe drought that occurred between December 2018 and January 2019. In all years, the same experimental design was used, which was randomized complete block plots with three repetitions, in which the treatments were the different coverages and included maize plots (as 15N isotopic reference). Each plot was 30 m long and 4.6 m wide, and a 1 m separation was left between plots.
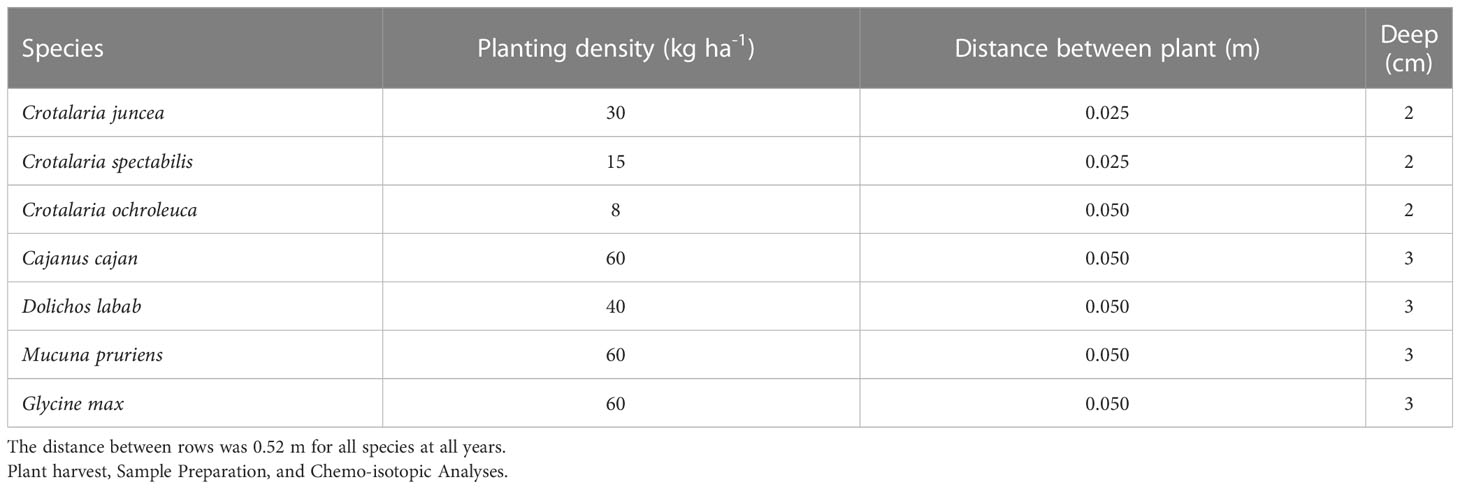
Table 2 Planting densities, distances between plants in a row, and planting depths for the different legume species.
All crops in the field experiment were cultivated using a no-tillage management planting. The planting method employed was direct seeding, where crops were sown in rows at the recommended density and depth (Table 2) using a precision planter (John Deere 1560). Farm personnel using commercial planting equipment did all planting operations according to Table 2. Cover crops were not provided with fertilizers, and irrigation was not utilized throughout the experiment. For weed control, a pre-emergent application of pendimethalin + imazethapyr was applied at a rate of 0.9 and 0.07 kg/ha of active ingredient, respectively.
For each species, harvest was done by cutting all the aboveground biomass within a 2-m2 area of a plot. In 2017 and 2019, there were three harvest events, while in 2018 only two harvests were performed. At each of these harvests (Table 3), a different spot within a plot was randomly selected.
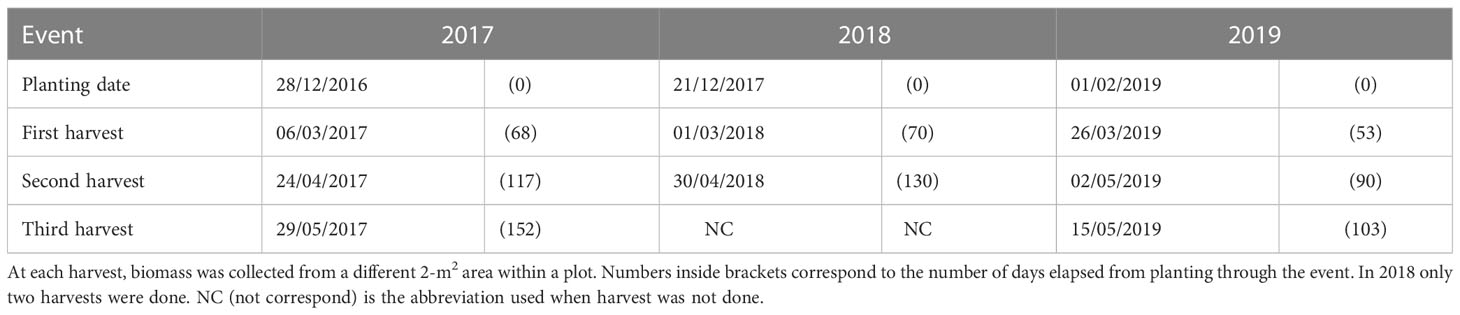
Table 3 Planting and harvest events for the three field experiments installed in 2017, 2018, and 2019 (one per year).
At all these harvests, plants were either at the vegetative stage or at the early reproductive stage. After arriving to the lab, the fresh harvested material was dried at 60 °C until constant weight. A representative plant subsample was then ground twice, first with a fixed and mobile blade mill (Marconi MA-580) until reaching a particle size of less than 2 mm. and subsequently with a rotary mill (SampleTek 200 vial Rotator) until reaching the required granulometric size for isotopic analysis. These processed samples were weighed into tin capsules and sent abroad for Mass Spectrometer determinations, which included total C and N concentrations and their isotopic signature (δ13C and δ15N). In 2017 and 2018, these determinations were done at the Center for Stable Isotopes in the University of New Mexico (http://csi.unm.edu/), while in 2019 they were performed at the Stable Isotope Facility in The University of California Davis (https://stableisotopefacility.ucdavis.edu).
The isotopic delta (δ) notation expressed as parts per thousand (‰) was used for C and N isotopic signatures using the following equation:
Carbon isotope discrimination (∆13C) referenced to the surrounding atmosphere (air) was estimated with the Farquhar et al. (1989) equation, assuming a δ13C value for air of -8‰, with the following equation:
The percentage of N in plant derived from biological N fixation was estimated with the equation from Unkovich (2013) using the following equation:
Where:
pNdFix is the percentage of N in plant derived from biological N fixation.
δ15Nref is the δ15N value of the reference non-fixing plant.
δ15Nfix is the δ15N value of the N fixing plant.
B is the δ15N value of a fixing plant growing without available N in its growth media.
Corn, with a previously determined δ15N value of 8 ‰ was the reference plant used in these experiments. The B values of the other species were those cited in Berriel et al. (2022b).
2.1 Statistical analysis
In these experiments, the treatments were the different legume species arranged in a completely random block design. Data were analyzed using analysis of variance (ANOVA) and Tukey’s Honestly Significant Difference (HSD) test. ANOVA basic assumptions (normality and homoscedasticity) were tested before the analysis. ANOVA analyses were done using the Proc GLIMMIX included in the software SAS® on Demand for Academics (Cary, NC). The effect of each year was analyzed individually. In this particular case, the specified variables were assessed using species as fixed effects and blocks as random effects. Furthermore, a two-year analysis was carried out, where the specified variables were analyzed considering species and year, and their corresponding interaction as fixed effects, while block was treated as a random effect.
Some orthogonal contrasts was used to examine differences between groups in a structured and controlled manner. The orthogonal contrasts allowed for specific comparisons between species across different variables, enabling the identification of specific differences or patterns of interest in the data. The formulations of these contrasts were based on previous information, which indicated that plants of C. juncea and C. cajan were taller and tended to have higher aboveground biomass than the other tropical species, but like that of G. max. With respect to BNF, however, C. juncea presented lower values than C. cajan (Berriel et. al, 2002a). Also, other local unpublished previous information also showed that G. max had a high BNF potential (Mori et al., 2012).
The specific formulation of these contrasts, however, varied over years, because G. max was not planted in 2017. Thus, for variables related to biomass or Carbon content, the evaluated contrasts were “C. juncea, and C. cajan vs others” or “G. max, C. juncea, and C. cajan vs others”. In turn, for N on BNF the evaluated contrast was “C. juncea vs others” or “G. max and C. cajan vs others” depending on whether G. max was part of this analysis or not.
Discriminant analyses were also performed to evaluate the existence of significant differences among species on several variables or attributes. Discriminant analyses were made using both the Proc DISCRIM of SAS and the software XLSTAT (Lumivero, 2023).
The discriminant analysis (DA) estimation process was done in two consecutive steps. In the first run, all the available variables or attributes were introduced, but only those that were statistically significant, according to the Univariate Test Statistic, were retained. Moreover, the statistical significance of the Mahalanobis distance for squared distance to species was also examined, and those that did not statistically differ from each other were grouped. It should be noted that these two previously mentioned tests are part of the standard output of the Proc Discrim of SAS. In the second run, only the species or groups of species and the variables previously identified as relevant were introduced. The result of this second analysis was rechecked to ensure that both the variables and the “species” continued to be significant. In the analyses of 2017, we observed that in the first run C. spectabilis, M. pruriens, and D. lablab did not differ significantly among them. Thus, in the second run, these three species were entered as a group, but C. ochroleuca, C. juncea, and C. cajan were still entered as separate species. Moreover, only the significant variables of the previous run were considered for this second run. The result was that C. ochroleuca and C. juncea did not differ from each other, but they differ from the 3-species group and from C. cajan (not shown). This analysis, however, had a relatively high overall classification error rate, both when the resubstitution (9.72%) or the cross-validation (27.78%) methodology was used. In 2018 G. max was also added to this analysis, and it was observed that in the first run C. spectabilis, M. pruriens, and D. lablab were not different either, for which they were also grouped, as in the previous analysis. In the second run, where only this grouping and the significant variables of the first run were kept. In addition, it was observed that the variables used in the second run of both 2017 and 2018 DAs were the same, except for pNdFix, which had been used in 2018 but not in 2017. The second run of the 2017 DA was run for a third time, but adding pNdFix as a variable, while keeping all the other parameters unchanged.
Another DA was also performed including the common data for 2017 and 2018; that is, not including the G. max data for 2018. In this joint DA, most of the selected variables were based on proportions or percentages and not on masses, as in the two previous DAs. This difference in the selection of the significant variables by the DA was possibly due to the large difference in biomass yield between years, even within the same species.
3 Results and discussion
3.1 Aboveground biomass yield
In 2017, the average monthly temperatures during the experimental period (January to May) were always above the historical average trend for the last 40 years (1976 to 2016) (Figure 1A). In 2018, on the other hand, temperatures from January to March matched well the long-term data, but those from April to May were again above this long-term trend (Figure 1A). In turn, in 2019 only the January and February mean temperatures were below this historical average, while for the rest of the period mean monthly temperatures either exceeded (April and May) or were similar (March) to the long-term trend. Moreover, this 3-year trend of higher temperatures during fall extended until June, already outside the experimental period. Data for the accumulated monthly rainfall showed, instead, a less consistent trend with respect to this long-term average (Figure 1B). In 2017, accumulated rains were lower than the 40-year trend for February, March, and April, but higher in January and May. In 2018, they were lower than the historical February average, slightly lower in January and April, about the same in May, and higher than the long-term average in March. In 2019, with respect to this long-term trend, accumulated rains were lower in February and April, very close in March, higher for January, and much higher in May. In general, this climatic information seems to support the common knowledge that in Uruguayan summer conditions rainfall is a more limiting factor for crop growth than temperature.
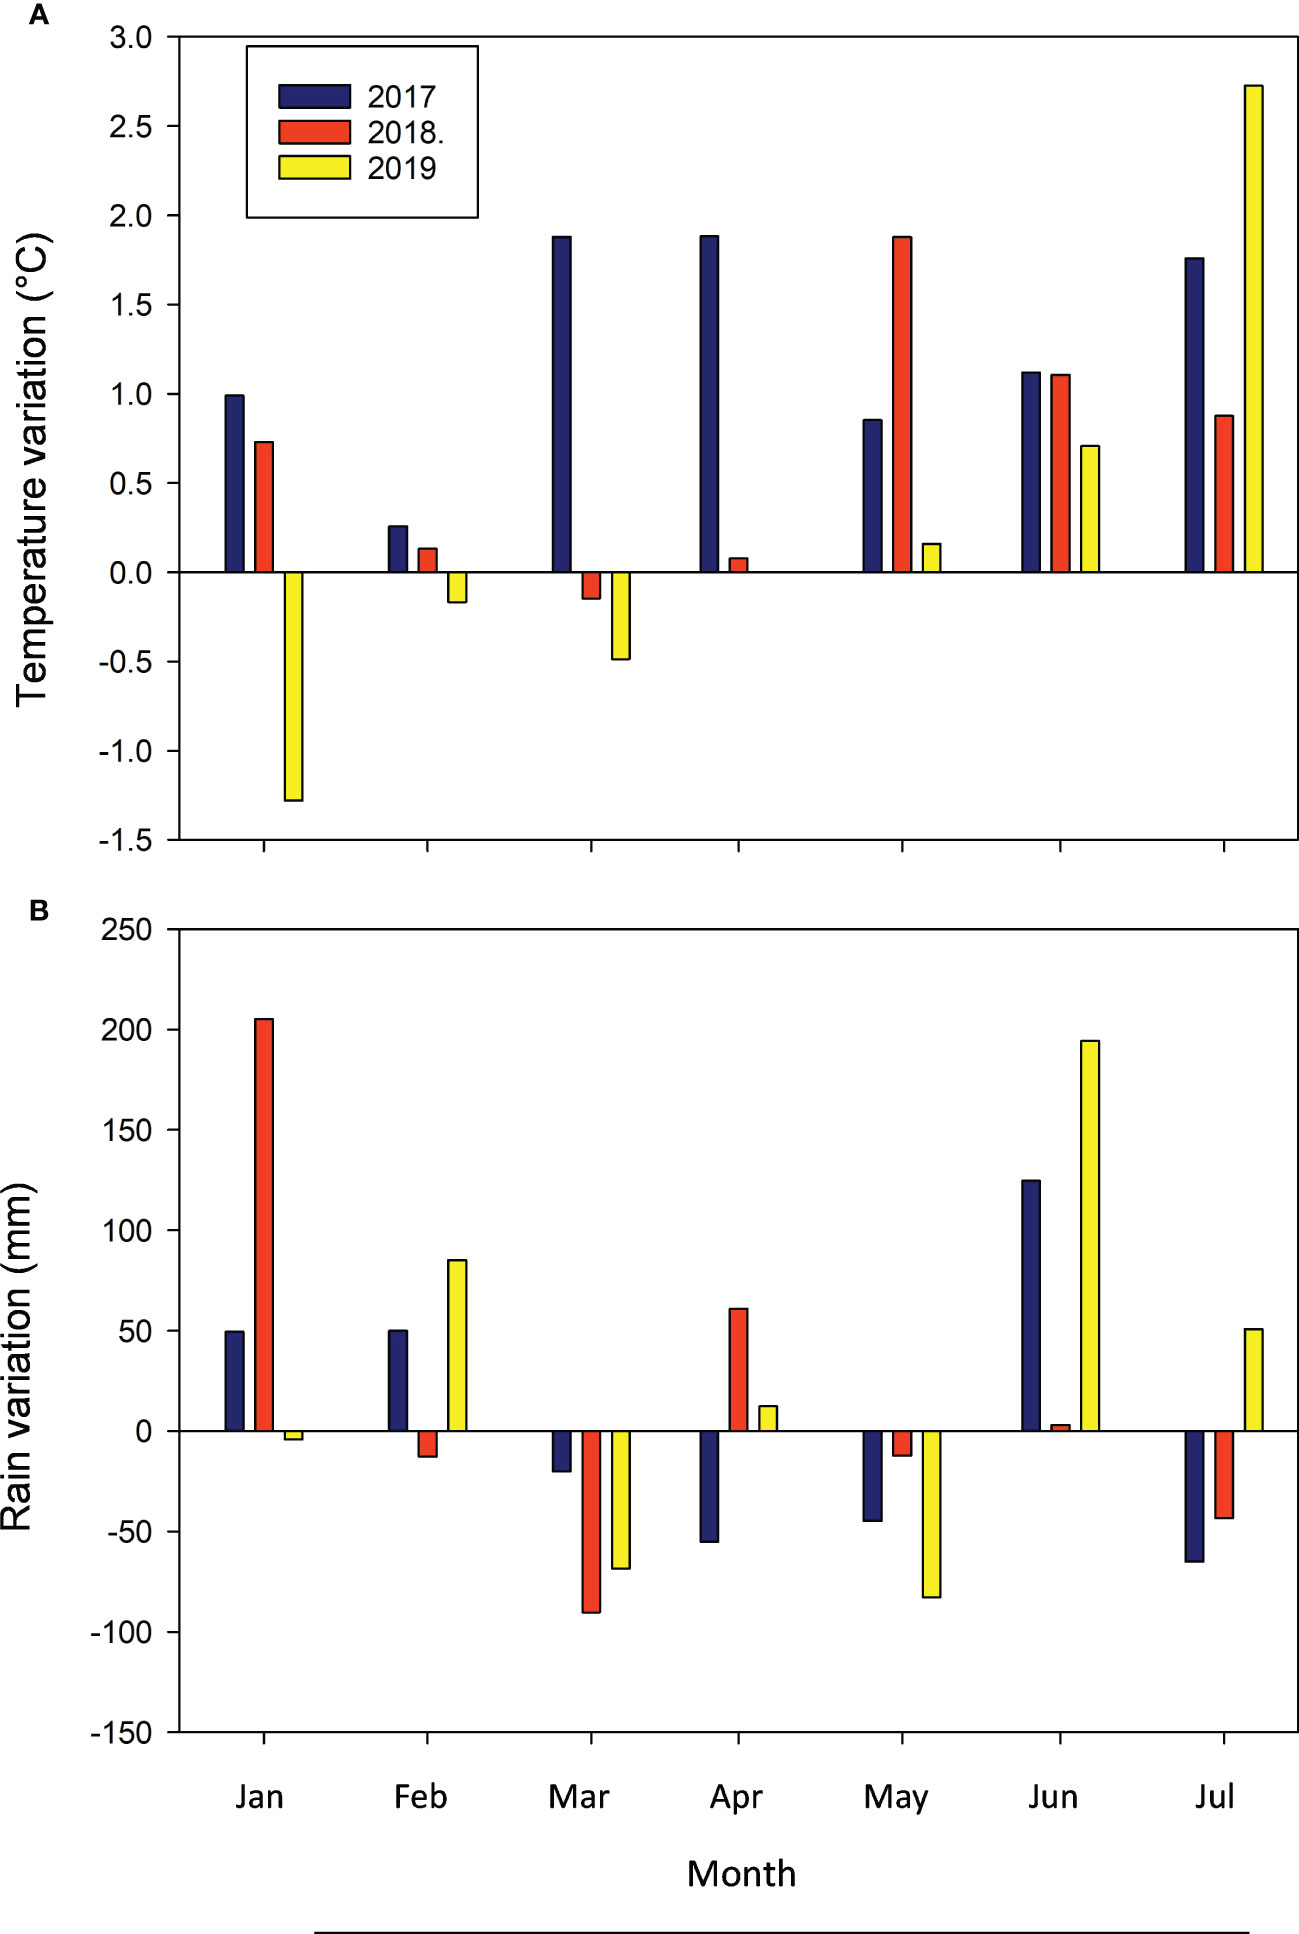
Figure 1 Mean monthly temperature (A) and monthly rain (B) variation with respect to the long-term average (1972-2016) over a 6-m period for the Las Brujas Experimental Station located in the Canelones Department, Uruguay.
Due to weather (Figures 2A–E) and planting date disparities (Figures 2B–F), aboveground biomass yield variations were large over years, and the highest productivity was achieved in 2018, with yields approx. eight times higher than those of 2017. In turn, yields in 2018 were approx. 12 times higher than those in 2019. In 2017, yields were limited by poor weed control and low rainfall in the period from H1 to H2 (Figure 2B). Rainfall during this period is critical because is when crops grow at their highest rate. In 2018, instead, optimal weed control was achieved, and rainfall was ample during the growing cycle. In these first two years, the planting date was at the beginning of summer, the hottest season in Uruguay, and for this reason, these tropical legumes grew mostly in a temperature range like that of their places of origin. It should be noted that for the climatic point of view, the National Institute of Meteorology of Uruguay (INUMET) defines summer season as the period occurs during December, January, and February (INUMET, 2023). In 2019, on the other hand, sowing was carried out a month later that the two previous years, determining that a greater proportion of the growth period of these legumes occurred during fall, a period with lower temperatures (Figure 2F). Thus, during the H1 to H2 period of 2019, the accumulated temperature was 638 °C, while in the two previous years; these values were 877 and 1211 °C (for 2017 and 2018, respectively). Furthermore, in 2019 rainfall was also low (Figure 2F). Thus, yield was low this year due to both lower growing temperatures and water availability.
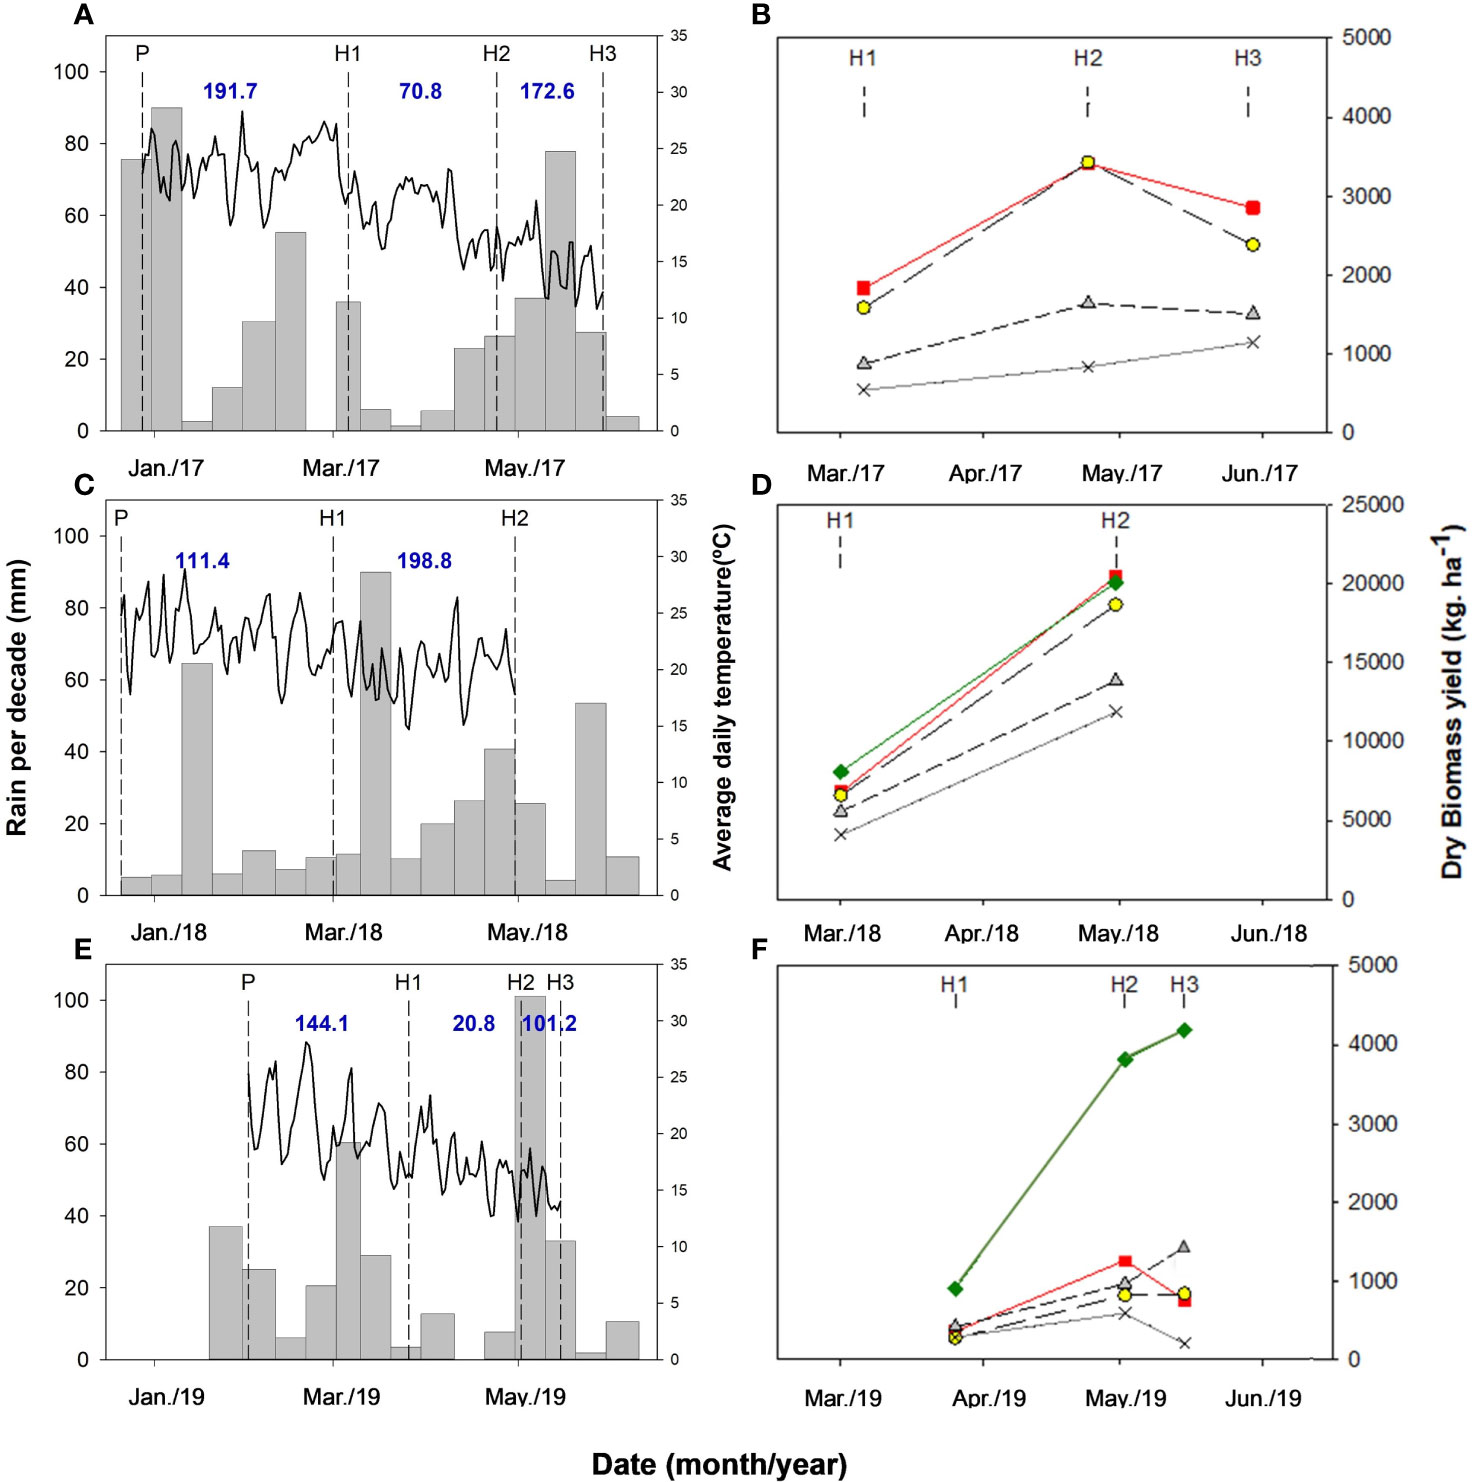
Figure 2 Decadal rainfall (bars) and daily temperature (lines) in (A, C, E) during the crop growth period and yield of the different species evaluated in each harvest in (B, D, F), over the three years of experimentation (2017, 2018, and 2019). The abbreviations P, H1, H2, and H3 represent respectively the sowing date, first, second, and third sampling in each year, although in 2018 only two samplings were carried out. The blue numbers in (A, C, E) represent the accumulated rainfall during each of the growth periods. Note the difference in scale between 2018 (B) and 2017 and 2019 (B, F). In 2019, (C). spectabilis did not grow, so the yield values for this group of species were actually only made up of the other two (Coch and Doli). The solid green, red, and grey lines correspond to Glycine max, Crotalaria juncea, and M. pruriens. The dotted line with a yellow symbol corresponds to C. cajanus C. cajan. The dotted line with a grey symbol corresponds to the mean value of the species Crotalaria spectabilis, Crotalaria ochroleuca, and D. lablab lablab.
In 2017, the tropical legumes with the highest biomass productivity were C. juncea and C. cajan. In 2018, these species were also the most productive, but G. max, a legume of subtropical origin incorporated this year to the research, also yielded high. Another group of tropical legumes integrated by C. spectabilis, C. ochroleuca and D. lablab, with intermediate yield was also identified. Furthermore, M. pruriens, which always was the less productive species, was left in a single group. To facilitate the visualization of differences between groups, in Figures 2B–F, these species with intermediate yields were grouped in a single curve. In 2019, the same criteria were used to group the intermediate yield species, but since C. spectabilis was not implanted, only C. ochroleuca and D. lablab integrated this group. In this late planting year, all species yielded less than in the two previous years, but it is important to note that the drop in G. max yield compared to 2018 was much lower than that suffered by tropical legumes. This lower yield decrease should be expected, since due to its subtropical origin, G. max’s growth should not be greatly affected by the lower autumn temperatures (Figures 2B–F).
Although one of the objectives of cover crop planting is weed suppression (Blomme et al., 2022; Fernando and Shrestha, 2023), the existence of negative impacts of large weed populations on cover crop´s yields is well documented. In this regard, in a meta-analysis carried out by Osipitan et al. (2019) involving more than 20 species, it was found that their productivity was inversely related to weed biomass. A negative effect of lower temperatures during a growing cycle on the yield of tropical legumes would also be expected, since according to Parenti et al. (2021), C. juncea needs above 1000 °C of accumulated temperatures to maximize yields. The decrease in radiation, as noted by Parenti et al. (2021), is another factor that could have contributed to the decline in yields during the late-planting year. The deleterious effects of decreased water availability on plant yields are also well known, as reported by Berriel et al. (2022a), in a study with C. juncea, C. spectabilis, and C. ochroleuca. Furthermore, Macedo et al. (2015) reported for field trials carried out in various Uruguayan zones, that yield variations of C. juncea, C. spectabilis, and M. prureins were clearly associated with the magnitude of rainfall in these zones.
In 2017, the biomass of all legumes exhibited a higher increase between the period from H1 to H2 (6/3 to 24/4 of 2017) than that from P to H1. Afterward, from H2 to H3, the biomass yield began to decline, as shown in Figure 2B. In 2018, only two harvests were done, the last being on 4/30, with no yield decline being observed during this last period (Figure 2D). In 2019, the yield of most legumes also declined between H2 and H3, except for G. max and D. lablab, although for these species yield during this later period increased at a lower rate than between H1 and H2 (Figure 2F).
These results seem to indicate that the optimum termination moment for these tropical legumes cover crops planted at the end of December would be between the end of April and mid-May (approx. 120 dap) because they would stop their growth thereafter, with subsequent biomass loss along with temperature drop. Macedo et al. (2015) did not observe any yield drop in their experiments, but the growth period used by these authors was shorter (approx. 100 d). In addition, these authors reported that in the southern Uruguay climate conditions where they worked, these legumes did not reach flowering. In our experiments, we did not observe flowering in any of these tropical legumes either. In the case of G. max, on the other hand, flowering would be expected and for late G. max planting the growth period could be extended at least until mid-May (approx. 100 d).
Regardless of the big interannual yield variations, statistically significant differences in biomass productivity were observed between legume species in all years and at most of the samplings. Despite having yield and statistical information available for all harvest times, results in Table 4 are only showed for the H2 harvest. In 2017, H2 occurred 117 dap, when the ANOVA revealed that the species effect was significant, but there were no differences between means according to Tukey’s HDS post hoc test (Table 4). Although the most productive species (C. juncea) yielded 2.5 times more than the least productive one (M. pruriens). For that reason, a contrast (Contrast1_17) was also performed to evaluate the statistical significance of the differences between the mean of the two most productive species (C. juncea and C. cajan) with respect to the mean of the rest, which was very significant (Table 4), with a yield difference between both groups of 2.58 Mg ha-1. It should be noted that in the other two samplings (H1 and H3, the statistical results were very similar (not shown).
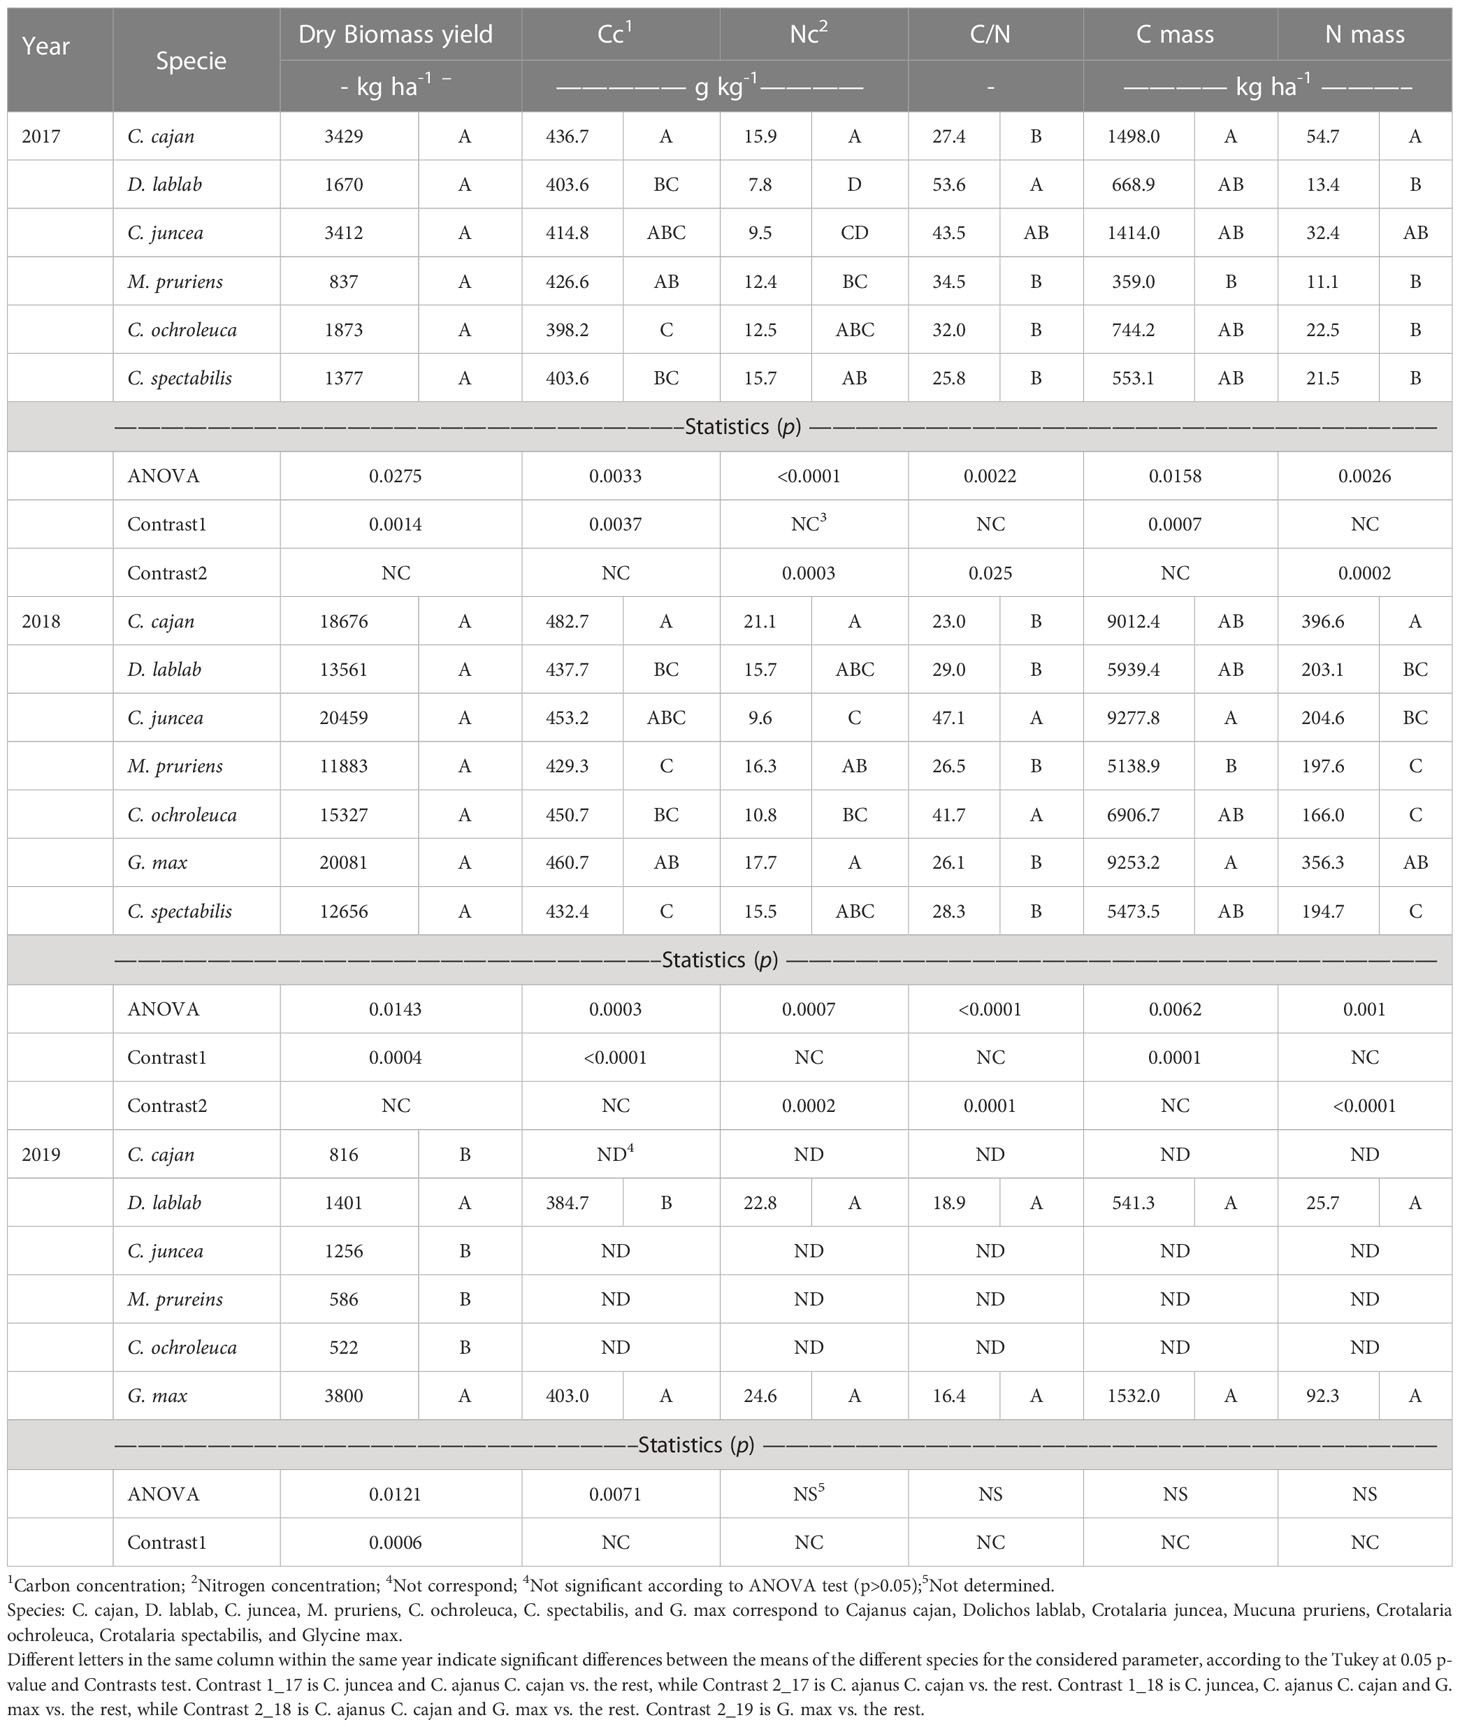
Table 4 Statistics for biomass yield, concentration and mass of C and N of the species for the three years of experimentation.
In 2018, the year with the highest yield, the species effect in H2 was also significant, but once again, no significant differences were found between the means according to Tukey’s post hoc test, despite C. juncea yielding 1.7 times more than M. pruriens (Table 4). In this year, the yield difference between the more productive species (C. juncea, C. cajan, and G. max) and the rest (Contrast1_18) was also statistically significant, with a value of 6.38 Mg ha-1 (Table 4). Similar results were also observed in H1, except at this time Tukey’s test revealed similar significant differences among means (not shown). In the third year (2019) with late planting, C. ochroleuca and M. pruriens were not implanted at all-in-one block, and nor were legumes present in some other cut-by-block combinations. As previously mentioned, G. max had the highest yield, whereas C. juncea and C. cajan experienced a significant decline in yield compared to the previous two years. ANOVA’s result revealed that the specie effect was again significant, but there were no differences by Tukey’s test either, despite G. max yielding approx. 7 times more than C. ochroleuca and M. pruriens, the two species with the lowest yield (Table 4). In 2019, the tested contrast (Contrast1_19) “G. max vs rest” was highly significant (Table 4), and the yield difference between the two groups was 2.88 Mg ha-1. In the first and third harvests of this year, this contrast was also significant, and in H3 G. max was different from the rest according to Tukey’s test (not shown).
The order of productivity of the tropical legumes found in this work was in general terms concordant with the information provided by the seed supplier (BRSEEDS, 2023), despite that this information was obtained from trials carried out in tropical regions of Brazil. According to this report, C. cajan and C. juncea were the most productive species, followed by C. ochroleuca, while C. spectabilis, D. lablab, and M. pruriens would be the least productive in this order. It is worth noting that the yields we obtained in our study for the best year were approximately twice as high as the values cited in this report. This suggests that if planted early in the summer, productivity levels in southern Uruguay could be comparable to those achieved in this Brazilian area. de Jesus Avila-Escobedo et al. (2022), also reported that in the Veracruz region of Mexico the tropical legumes with the highest dry biomass yield were C. juncea and C. cajan and proposed that the higher yields of these two species would be expected, based on their higher height and lowest leaf to stem ratio. Our results also agree with those obtained by Macedo et al. (2015) in three southern Uruguayan areas different from that of our study. In order of biomass productivity, they ranked C. juncea, C. spectabilis, and M. pruriens from high to low and reported yield values within the same order of magnitude as those reported by us.
However, in other Brazilian regions the biomass productivity order per specie could be different, since in very acidic Cerrado soils with pHw values of 4.3, the most productive species at 90 dap was M. pruriens, followed by D. lablab, C. cajan, C. spectabilis, and C. juncea, with yields that varied between 0.41 and 1.53 Mg ha-1 (Teodoro et al., 2011). Under these conditions, yields were clearly lower, but still within the range of those observed in our study in 2019. Our results did not coincide either with those of De Sousa et al. (2019), because for northeastern Brazil they reported that although C. juncea presented the highest biomass productivity, it yielded almost twice that of C. cajan, while C. ochroleuca and C. spectabilis had intermediate yields. Thus, according to these results, the species with the highest biomass yield productivity for early sowings in southern Uruguay would be C. juncea, C. cajan, and G. max. In late sowings, however, at the beginning of February, the only available option would be G. max since all tropical species greatly decreased their yield due to the temperature and radiation decrease associated with the autumn advance. Furthermore, these results also stress the importance of gathering local data to obtain reliable yield information on tropical legume yields in a particular region.
3.2 Carbon and nitrogen content
In 2017, there were differences at H2 in C concentration (Cc) between species, according to Tukey’s test and Contrast1_17 (Table 4). C. cajan was the species with the highest Cc in aboveground biomass, with a relative difference of 10% with respect to C.ochroleuca, the legume species with the lowest value (Table 4). In 2018, there were also differences in Cc among species, according to both Tukey’s test and the Contrast1_18 (Table 4), but the relative differences among species widened, with C. cajan being again the species with the highest Cc, while M. pruriens had the lowest value. The relative difference between both was 11%. This year, all species (except M. pruriens, which remained almost the same) increased their Cc relative to 2017 between 8 and 14%. It should be noted that G. max, which had not been planted before, presented the second-highest Cc value. In 2019, Cc analyses were only carried out in the two species with the highest biomass yield (G. max and D. lablab). The Cc value of G. max was 5% higher than D. lablab’, while G. max’s value was like that of 2018, but that of D. lablab was 9% lower than the average of the two previous years. The species effect in the ANOVA was highly significant (Table 4), and since only two species were compared, neither a further Tukey’s nor a contrast was needed.
The existence of these differences in Cc among legumes species could not have been expected, since according to Vergutz et al. (2012), at least in green leaves, most plant species would have values around 44%, and only conifers would have higher values, close to 50%. According to these authors, there would be no differences between N-fixing and non-fixing species either. These differences could have arisen, however, due to the highest stem-to-leave ratio of C. cajan, but C. juncea also had this characteristic (de Jesus Avila-Escobedo et al., 2022). These authors also reported the existence of differences in Cc among several tropical legume species, but although C. cajan and C. juncea were in the higher group, C. cajan did not stand out. Instead, these differences could be partly related to the nitrogen nutrition status of the plants, because according to Sakai et al. (2006), rice increases its C status with the level of nitrogenous nutrition of the leaves. Concordantly, Ayalew et al. (2022) reported that the inoculation of Vigna unguiculata with Bradyrhizobium increased its Cc by 28% compared to the control without inoculation, and in addition increased its Nc by 31%. It should be noted that, although it was not previously reported, our group found in previous research under controlled conditions a greater Cc in C. cajan (47.5%) compared to C. ochroleuca (45.5%), C. spectabilis (42.3%), and C. juncea (36.8%), and these means were all different according to Tukey’s test (Berriel et al., 2022a).
In the three years of research, there were also important differences in N concentration (Nc) in aboveground biomass between the evaluated species. In 2017, C. cajan and C. spectabilis were the species with the highest values, doubling that of D. lablab, which this year presented the lowest Nc. According to Tukey’s test (Table 2), C. cajan differed from M. pruriens, C. juncea, and D. lablab. When considering that despite its high yield, C. juncea had one of the lower Nc values, and the contrast used for this variable compared only C. cajan vs rest (Contrast_2-17). This contrast was maintained in all the other variables related to N (Table 4). Similarly, the Contrast_1-17 used previously for biomass and Cc was also used in the analyzes of all other C-related variables. This contrast was highly significant, indicating that C. cajan had a higher Nc than the mean of the other species.
In 2018, there also were Nc differences among species, with C. cajan being again the species with the highest value, doubling that of C. juncea, which this year had the lowest value. Alike to what happened with Cc, the species that had the second highest value of Nc was G. max, very close to that of C. cajan. This year, Contrast_2-18 compared these two species against the rest, with statistical significance also being very high (Table 4). This contrast was used to analyze the result of all the other variables that this year involved N. In 2018, relative changes of Nc were also registered with respect to 2017, with relative increases of approx. 100% in D. lablab, 33% in M. pruriens, 31% in C. cajan, and 13% in C. spectabilis, while M. pruriens stayed the same and C. ochroleuca dropped 15%.
In 2019 there were no differences in Nc between G. max and D. lablab, the only two species in which this information had been analyzed. This year, D. lablab had an Nc that almost doubled the mean of the two previous years, while G. max had a 39% higher Nc than in 2018. This result could be related to the lower yields achieved in 2019 with respect to the previous year in G. max and in the two previous years in D. lablab. Nevertheless, in the case of D. lablab, this increase could not only be explained by nutrient concentration due to low yields in 2019, since in 2018 this species had a higher Nc than in 2017, when yields were comparatively lower. In fact, the lowest Nc value of all species was found in D. lablab in this first year, which could have been related to a low competition capacity for N of this species with weeds.
The range of Nc values found in 2017 and 2018 in C. juncea (Table 4) were lower than those reported by Balkcom and Reeves (2005) in two years of experimentation (18.0 and 20.2 g kg-1), for yield levels of 7.3 and 7.8 Mg ha-1, respectively. In turn, de Jesus Avila-Escobedo et al. (2022) reported similar or higher Nc values in the stem and leaves of C. juncea with respect to C. cajan. Our recalculation of their Nc values for the aboveground plant showed that in C. cajan their values were similar to those found in our work, but in the case of C. juncea their values were much higher. Moreover, the range of values reported by Berriel et al. (2022a) under controlled conditions in Uruguay coincided with those found in this work, both for C. juncea and C. cajan. In two other previous trials carried out under controlled conditions in Uruguay (Berriel et al., 2020a; Berriel et al., 2020b) they also found that C. juncea was the species that presented the lowest Nc (but in these experiments C. cajan was not evaluated). In the 2020 trials, it was also observed that C. juncea plants with large and effective nodules had higher Nc values than those with small nodules (Berriel et al., 2020a). The difference in Nc between both groups was 14.0 vs 22.3, with an average of 18.5 g kg-1. Since seeds were not inoculated in any of our experiments, it is possible that the low Nc values of C. juncea observed in the 3 years of experimentation in the field were due to poor nodulation of this species with the native fixing bacteria. Therefore, these results would suggest that the BNF capacity of C. juncea in Uruguayan conditions in all these studies would have been suboptimal.
The Cc and Nc differences among species and years produced important C/N ratio variations. In 2017, only D. lablab with the highest value was different from M. pruriens, C. ochroleuca, C. cajan, and C. spectabilis, while C. juncea with the second highest value did not differ from any species. Contrast_2-17 was significant, and the two species with the highest C/N ratio (D. lablab and C. juncea) almost doubled those with the lower ratio (C. cajan and C. spectabilis). In 2018, the difference between C. cajan (lower value) and C. juncea (higher value) also almost doubled, and they differed according to Tukey’s test, but C. cajan did not differ from G. max (second lowest value), M. pruriens, C. spectabilis, and D. lablab. For its part, C. ochroleuca had the second highest value and did not differ from C. juncea. Contrast_2_18 that compared C. cajan and G. max vs rest was highly significant. With respect to 2017, in 2018 the two species with the highest value increased their C/N ratio by 8 and 39%, respectively, while C. spectabilis remained almost unchanged. The other species reduced this relationship by 46% (D. lablab), 26% (M. pruriens), and 16% (C. cajan). In 2019, the C/N ratios of D. lablab and G. max were not different according to ANOVA’s result, being both values much lower than the average of the two previous years (Table 4).
Knowing the value of the C/N ratio is useful because it is indicative of both the mineralization rate of a crop residue and its N contribution to the next crop. When plants have C/N ratios lower than the theoretical limit of 24/1 to 25/1, they tend to decompose quickly and contribute with N to the next crop (net mineralization), while above this range their decomposition is slower and they cause net immobilization (Allison, 1966; Clark et al., 1997; Kuo et al., 1997; Kuo and Jellum, 2002). However, the largest net effects to one side or the other would tend to occur with C/N ratios less than 15/1 and greater than 33/1 (Black, 1968; Allison, 1973).
According to this criterion, in 2017 all species had C/N values above 25/1, but while C. spectabilis, C. cajan, and C. ochroleuca were below 33/1, C. juncea and D. lablab were well above (Table 2). In 2018 the values of most legumes except C. juncea and C. ochroleuca decreased, but only C. cajan was below 25:1, while C. juncea and C. ochroleuca were above 33:1. In 2019, both crops presented values much lower than 25:1, which could have occurred due to late planting and the shorter growth cycle, determining that both species were less mature at harvest. The lower C/N value found for C. cajan in this work did not coincide with the results of de Jesus Avila-Escobedo et al. (2022) for the state of Veracruz, Mexico. They reported, that in the first production cycle (2019-20) the C/N ratio of C. cajan was like that of C. juncea (31.2 and 26.1, respectively), but both values were higher than those of the other evaluated summer legumes, including D. lablab and C. ochroleuca. In the second cycle, (2020-21) C. cajan was the species with the highest ratio (33.7), while the values of C. juncea, D. lablab, and C. ochroleuca were 24.4, 20.9, and 17.8, respectively. Therefore, the high C/N ratios found for C. juncea in 2017 and 2018 in Uruguay could be again a consequence of the nodulation problems of this species already discussed.
As a result of the biomass and Cc variations between species, there were important differences in the C mass (Cm) fixed through the photosynthesis process. In 2017, however, according to Tukey’s test only M. pruriens (lowest) differed from C. cajan, but the means of C. cajan and C. spectabilis (second lowest) were not different although the mean Cm value of the first species was 2.7 times higher (947 kg ha-1) than that of the second (Table 4). The Contrast1_17 was significant, being the mean Cm value of C. cajan and C. juncea 2.5 times higher (875 kg C ha-1) than the mean of the rest. In 2018 both the biomass production and the Cc values had increased compared to 2017, therefore, the Cm means of the different species increased between six and fourteen times with respect to the values of the previous year, but this increase was greater in the species with lower values in 2017. Although in 2018, Tukey’s test only differentiated C. juncea and G. max from M. pruriens the high statistical significance of Contrate1-18 indicated that C. juncea, G. max, and C. cajan accumulated on average 3317 kg ha-1 or 1.6 times more Cm than the rest. In 2019, there were no statistically significant differences between G. max and D. lablab, even though the first species accumulated 2.8 times or 991 kg ha-1 more Cm than D. lablab.
de Jesus Avila-Escobedo et al. (2022) reported for the first production cycle of their Veracruz study (2019-20) Cm values of C. juncea and C. cajan in the same order of magnitude as those reported in our 2018 work, and as in our case, these two species had values much higher than those of C. ochroleuca and D. lablab. On the other hand, in the second production cycle (2020-21), all the species had lower values, although higher than those observed in our 2017 work, although in this second cycle the species with the highest Cm value was D. lablab. These results obtained in both Mexico and Uruguay indicate that the use of CC based on high-productivity summer legumes such as C. juncea and C. cajan could contribute to mitigating climate change due to their ability to sequester C. According to de Jesus Avila-Escobedo et al. (2022) the greater C sequestration capacity of these species would be due in part to the greater proportion of the stem in the total biomass, a result also reported by other authors (Rojas-Velázquez et al, 2020; Guopeng et al., 2020). Nevertheless, in our case it should be noted that G. max, a species of subtropical origin, also had aboveground Cm values similar to those of C. juncea and C. cajan.
The N mass also varied between species in 2017. According to Tukey’s test, the two species with the highest values, C. cajan and C. juncea, did not differ according to Tukey’s test, but only C. cajan differed from the rest. The Nm value of C. cajan was 1.7 times greater than that of C. juncea (Table 4). Correspondingly, the Contrast1-17 was highly significant, implying that the Nm of C. cajan was higher than the average of the rest. As what happened for Cm, in 2018 all species had higher Nm than in 2017, which was due both to higher biomass in all species and to a higher Nc in some. In 2018 C. cajan accumulated 2.4 times or 230 kg ha-1 more Nm than C. ochroleuca, the species with the lowest figure. The second crop with the highest Nm was G. max (Table 4). In 2018, according to Tukey’s test, the means of the two species with the highest Nm differed significantly from the rest, and the result of Contrast2-18 indicated that the mean Nm value of C. cajan and G. max was higher than that of the other species (Table 4). In 2019, there were no statistically significant differences in Nm between G. max and D. lablab, the only two species analyzed this year, even though the mean Nm of G. max was 3.6 times or 67 kg ha-1 higher than that of D. lablab (Table 4).
In 2017, the Nm of the two species with the highest values (C. cajan and C. juncea) were lower than those reported by de Jesus Avila-Escobedo et al. (2022) for the two production cycles analyzed by these authors. Nevertheless, the maximum value reported here for C. cajan in 2018 was in the same order of magnitude as the highest values reported by these authors for C. juncea and C. cajan in Mexico in the cycle of greatest productivity (2019-20). In addition, the Nm of G. max for 2018 in Uruguay was like that of C. cajan. These results indicate that, despite the climatic differences, the Nm at cover crop’s termination of some tropical or subtropical legumes in Uruguay could attain similar values to those reached in more tropical regions. On the other hand, in the case of C. juncea, the Nm value reached in Uruguay in 2018 was much lower than that reported by de Jesus Avila-Escobedo et al. (2022) in their most productive cycle, although this value was higher than the values reported by Balkcom and Reeves (2005) for the state of Alabama (USA). It should be noted, however, that in this work from Alabama, the observed Nc values had been higher than those from Uruguay, but the biomass production had been much lower. Therefore, these results also seem to indicate that the N productivity of C. juncea in Uruguay could be limited due to the problems of this species of establishing an effective symbiosis with soil native nitrogen-fixing bacteria.
3.3 Biological nitrogen fixation
The N mass derived from fixation (NmdFix) varied between species in the three years of the experiment. In 2017, the result of Tukey’s test indicated that the species with the highest value was C. cajan, and the Contrast 2-17 revealed that this value was higher than the average of the rest (Table 5). In 2018, the outcome was similar, but the two species with the highest NmdFix according to both Tukey’s test and Contrast 2-18 were G. max and C. cajan, which had much larger values than the rest (Table 5). In 2019, ANOVA’s result also revealed a large difference in NmdFix between G. max and D. lablab.
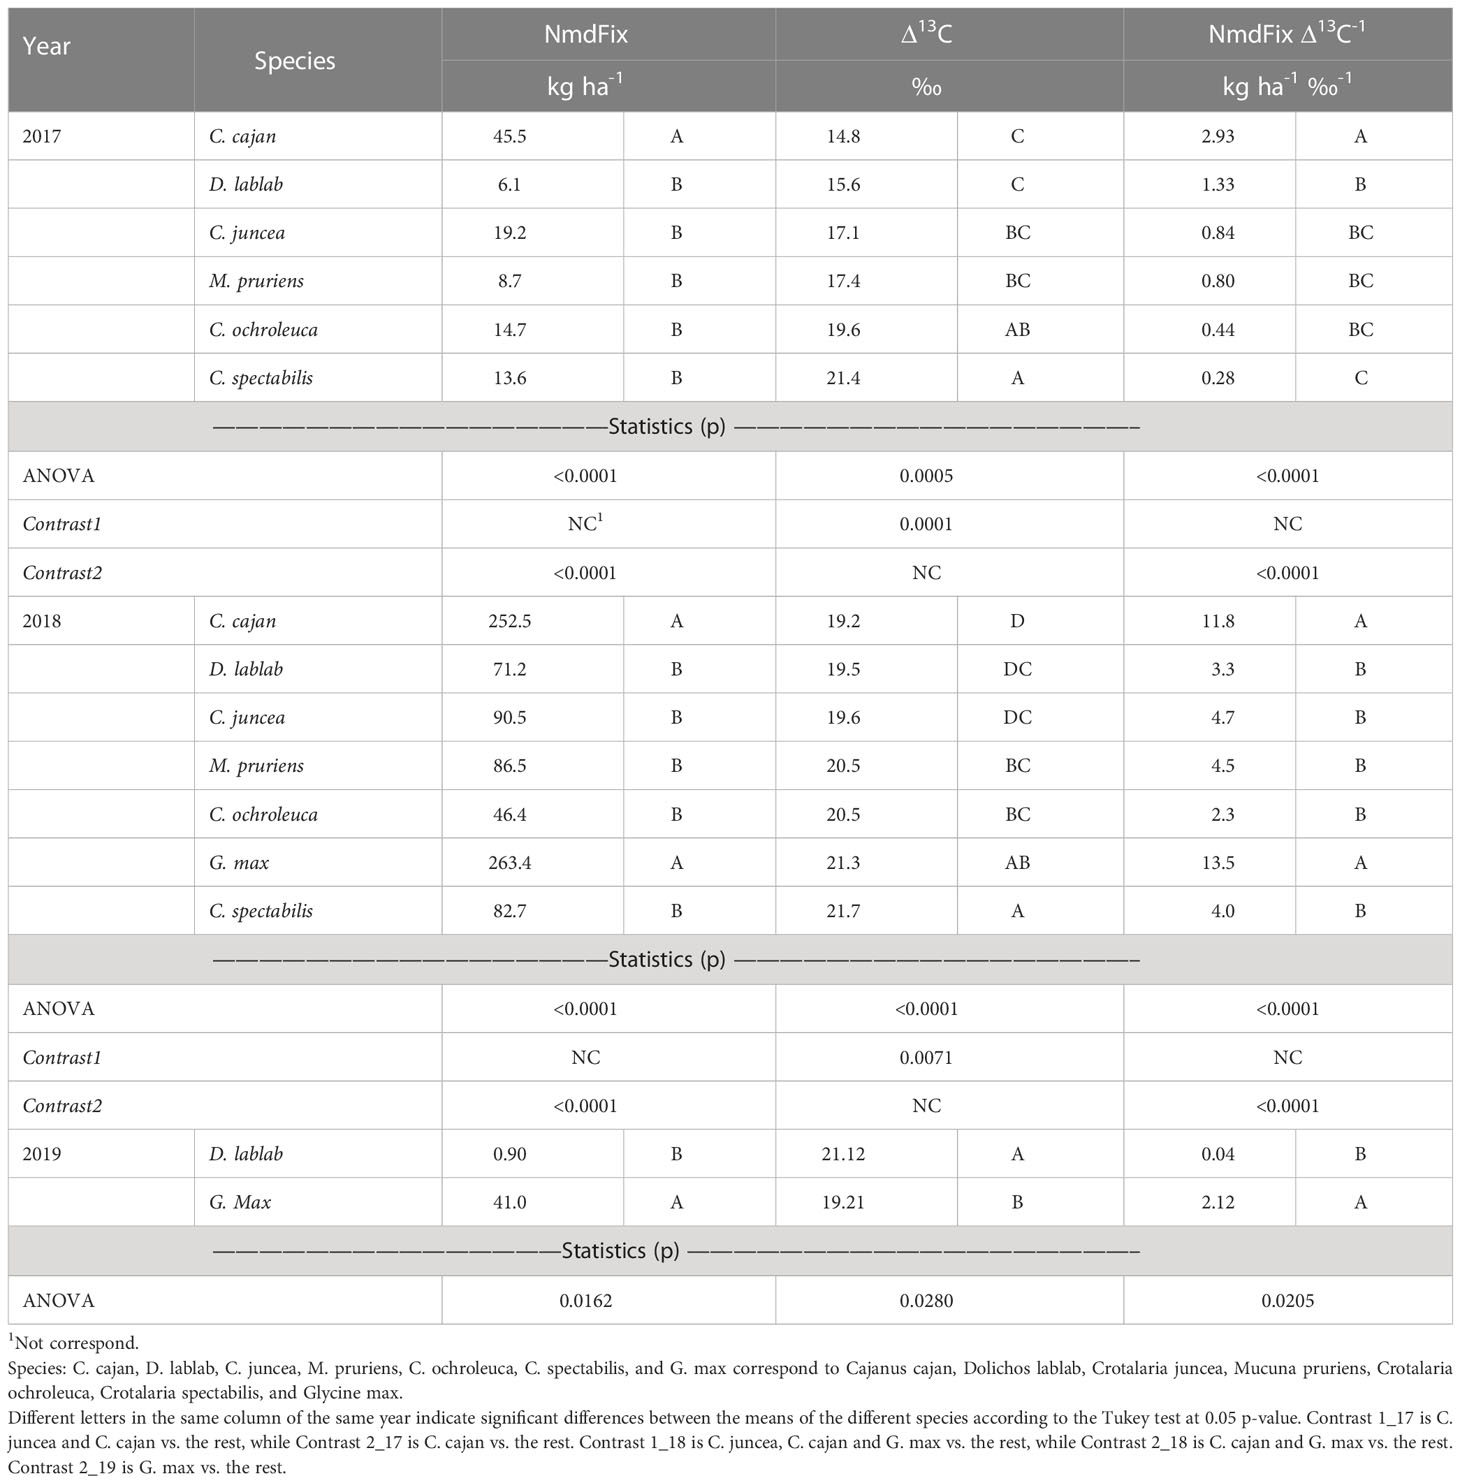
Table 5 Statistics for mass of N derived from symbiotic fixation (NmdFix), carbon isotope discrimination (Δ13C), and water efficiency index (NmdFix Δ13C-1) of the species evaluated in the three years of experimentation.
In Uruguay, working under controlled conditions with C. cajan, C. juncea, C. spectabilis, and C. ochroleuca, Berriel et al. (2022a) also found similar trends, especially for the first two mentioned species. In the case of pNdFix no differences among species were detected, although, without water restrictions, C. juncea had the lowest mean with a value close to 50%, while in the other species, the values were close to 100%. In contrast, when the variable under consideration was NmdFix, the values of C. cajan and C. ochroleuca were higher than those of C. spectabilis and C. juncea. These results confirm that without inoculation with symbiotic fixing bacteria, as in the experiment of Berriel et al. (2022a) and here, C. cajan would have in southern Uruguay a higher N fixing potential than most of the other tropical legumes tested. Field observations also showed that C. cajan’s roots had more nodules, which were also larger and reddish than those in the other species. In contrast, NmdfFix values of C. juncea were much lower than those of C. cajan, as well as deficient modulation, confirming the previous finding of Berriel et al. (2022a) that this species presents inoculation problems with native fixing bacteria. To this respect, Macedo et al. (2015) reported that previous attempts to inoculate in Uruguay several tropical legume species with strains of Bradyrhizobium spp from Brazil produced poor results in terms of the number of nodulated plants and numbers of nodules per plant, in all evaluated species, although the most acceptable result was observed in C. juncea. Moreover, recent findings of Berriel et al. (2021) showed that a rhizobia strain isolated from C. ochroleuca was highly effective at nodulating C. cajan, C. juncea, and C. spectabilis, and could be used in the future to produce inoculants to enhance BNF of these and other tropical legumes.
The high BNF potential of G. max found here is not surprising, since in Uruguay this species is commonly planted as a cash crop and is usually inoculated with commercial inoculants when sown for this purpose. In our experiment, however, the convenience for this inoculation is not clear, since in 2018, when the maximum values of NmdFix were attained G. max was not inoculated, but in 2019 when it was inoculated, these values were much lower because of other limitations.
3.4 Water use efficiency for biomass and biological N fixation
In 2017, C. juncea and C. cajan, in this order, where the species with the lowest Δ13C, that is, with the highest WUE, and differed according to Tukey’s to the other species except for C. ochroleuca and C. spectabilis. The result of the Contrast1_17 indicated that the mean Δ13C of C. juncea and C. cajan was lower than that of the other species. In 2018, instead, C. cajan had one of the highest Δ13C values, and according to Tukey’s Test its mean differed from those of M. pruriens, G. max, and C. juncea. Despite this high relative Δ13C of C. cajan this year, the Contrast1-18 that had been proposed beforehand was significant, indicating that C. cajan, C. juncea, and G. max had on average a lower Δ13C or higher WUE than the average of the rest (Table 5). It should also be noted that the Δ13C values of 2018 were higher than those of 2017, probably because rains in the second year were more abundant, especially from H1 to H2. In 2019, with limited water availability, but with possibly lower atmospheric demand due to the planting delay, there was also according to the ANOVA’s results a difference between G. max and D. lablab, and the first species was again the one with the highest WUE (Table 5).
In this work, C. juncea had the lowest Δ13C value in the two years in which this attribute was evaluated, being the species with the higher WUE. Contrastingly, C. cajan only presented a high WUE in 2017, when water availability was limited, which could be the result of more plastic behavior of this species, being capable to close its stomata only when circumstances require. Under controlled conditions, though, Berriel et al. (2022a) obtained different results, since C. cajan was the species with the lowest Δ13C value, but C. juncea had the highest. Thus, Δ13C outcomes under controlled conditions should be interpreted with caution because they could diverge from those attained in the field. Some of the results observed in another study under controlled conditions by Berriel et al. (2020b), however, partially matched those observed under field conditions. Specifically, similarly to what was observed here in both 2017 and 2018, Berriel et al. (2020a) found that when water availability increased, the Δ13C values of all species also tended to increase, which indicated that plants maintained their stomata open longer.
The statistical analysis results of the proxy used to evaluate WUE for BNF (NmdFix Δ13C-1) were very similar and significant over the 3 years of study. In this case, as the value of the index increases, the efficiency also increases. In 2017, C. cajan was the most efficient species, while in 2018 they were G. max and C. cajan, while in 2019 G. max was more efficient than D. lablab (Table 5). In addition, the magnitudes of these differences were always large, but the highest values of this proxy and the largest differences were found in 2018, due to the higher biomass productivity, and consequently the higher NmdFix reported for this year.
According to Berriel et al. (2022a), the NmdFix/Δ13C ratio can be used as a WUE proxy for N fixation only for species in which Δ13C is more correlated with transpired water than with photosynthetic rate. In the present study, the high relative value of this index for C. cajan was due to a high value of the numerator, while in the case of G. max, it was mainly a result of the high NmdFix value and a low value of carbon discrimination. Moreover, in Berriel et al. (2022a), it had been observed that when water availability increased, the value of this proxy decreased, which was due to a relatively higher increase in transpired water in relation to the NmdFix increase. In this work, however, the water availability surge of 2018 vs 2017 increased this proxy, due to the relatively higher NmdFix enlargement in relation to the transpired water rise. Therefore, this proxy could be useful for species comparisons within the same year and location, and for species planted on the same date. In contrast, all other comparisons when variations in any of these factors occurs should be cautiously considered.
3.5 Analyses on several variables over two years
Since the planting dates of 2017 and 2018 were similar, we attempted to analyze all variables across the two years with similar planting date with an ANOVA across these two years. G. max was not included because it was present only in 2018. We found, however, that due to the difference in magnitude of the results in these two years, the species x year interaction was statistically significant for most of the variables, except for biomass. Therefore, this analysis on the original scale was only performed for these two variables (Table 6). Thus, the data for the other variables were transformed to a logarithmic scale and reanalyzed. Still, it was observed that for Cc, Nc, and C/N ratio, as well as for the two WUE proxies, the interaction was still significant, and thus, these variables were omitted.
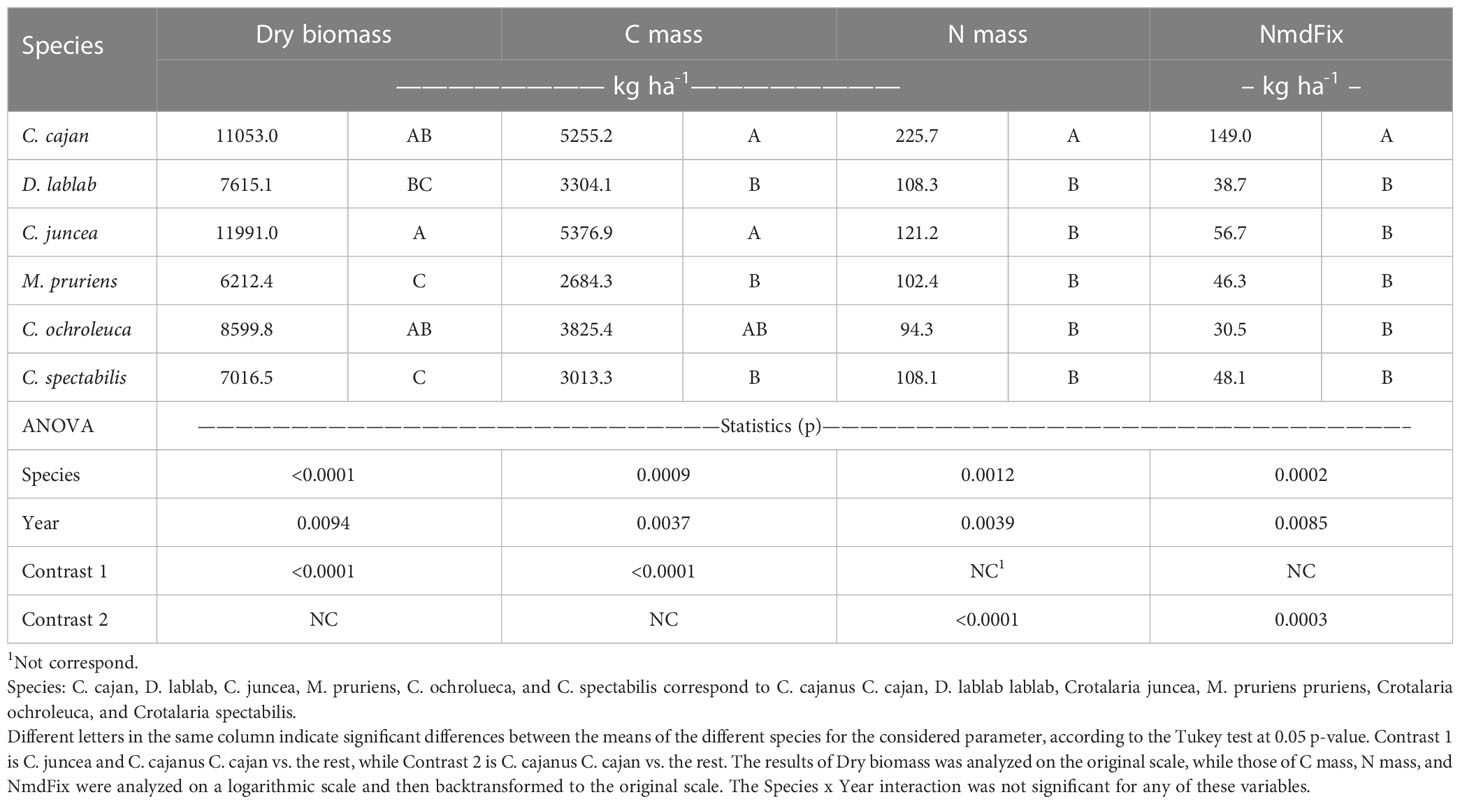
Table 6 Statistics for the dry mass, concentration and mass of C and N, and mass of N derived from symbiotic fixation (NmdFix) of the species evaluated for two years of experimentation analyzed across years 2017 and 2018 with a similar planting time.
The results obtained for the variables finally included, basically confirmed the previous results (Table 6), showing that, despite the considerable differences between years, C. cajan and C. juncea had on average, consistently higher biomass, and Cm values than the rest, yielding more than Mg ha-1 of biomass and sequestering more than 2 Mg ha-1 of C. However, when the variables related to N (Nm and NmdFix) were analyzed across these two years; it was observed that C. cajan clearly outperformed the rest, including C. juncea, although these absolute differences should be considered with caution because they were affected by scale transformations. In any case, on average for these two years, the mean NmdFix value of C. cajan was 3.4 times or 105 kg N ha-1 higher than the average of the rest. These results are relevant, because most local researchers in this area currently concentrate their research and diffusion efforts on C. juncea, although, in our experiment without inoculation, this species showed a lower BNF potential than C. cajan. This situation, of course, could change if effective rhizobia strain capable of modulating with C. juncea is identified. With respect to C sequestration, however, these two species outperformed the rest (Macedo et al., 2015, Álvarez pers. comm., 2023).
3.6 Discriminant analyses
In 2017, the DA successfully discriminated three species clusters (Figure 3A): C. cajan, Group 1 (consisting of C. juncea and C. ochroleuca), and Group 2 (composed of C. spectabilis, D. lablab, and M. pruriens). The classification was perfect, with 100% of the observations correctly classified and no errors in cross-validation. These results indicate that the analyzed species in that year were completely separated into distinct groups using the selected discriminant variables. In 2018, the observations from the five clusters: C. cajan, C. juncea, C. ochroleuca, G. max, and others (consisting of C. spectabilis, D. lablab, and M. pruriens) were classified without any errors, demonstrating that these species remained clearly separated from each other and could be accurately discriminated (Figure 3B). The edaphoclimatic conditions in that year maximized the differences between species.
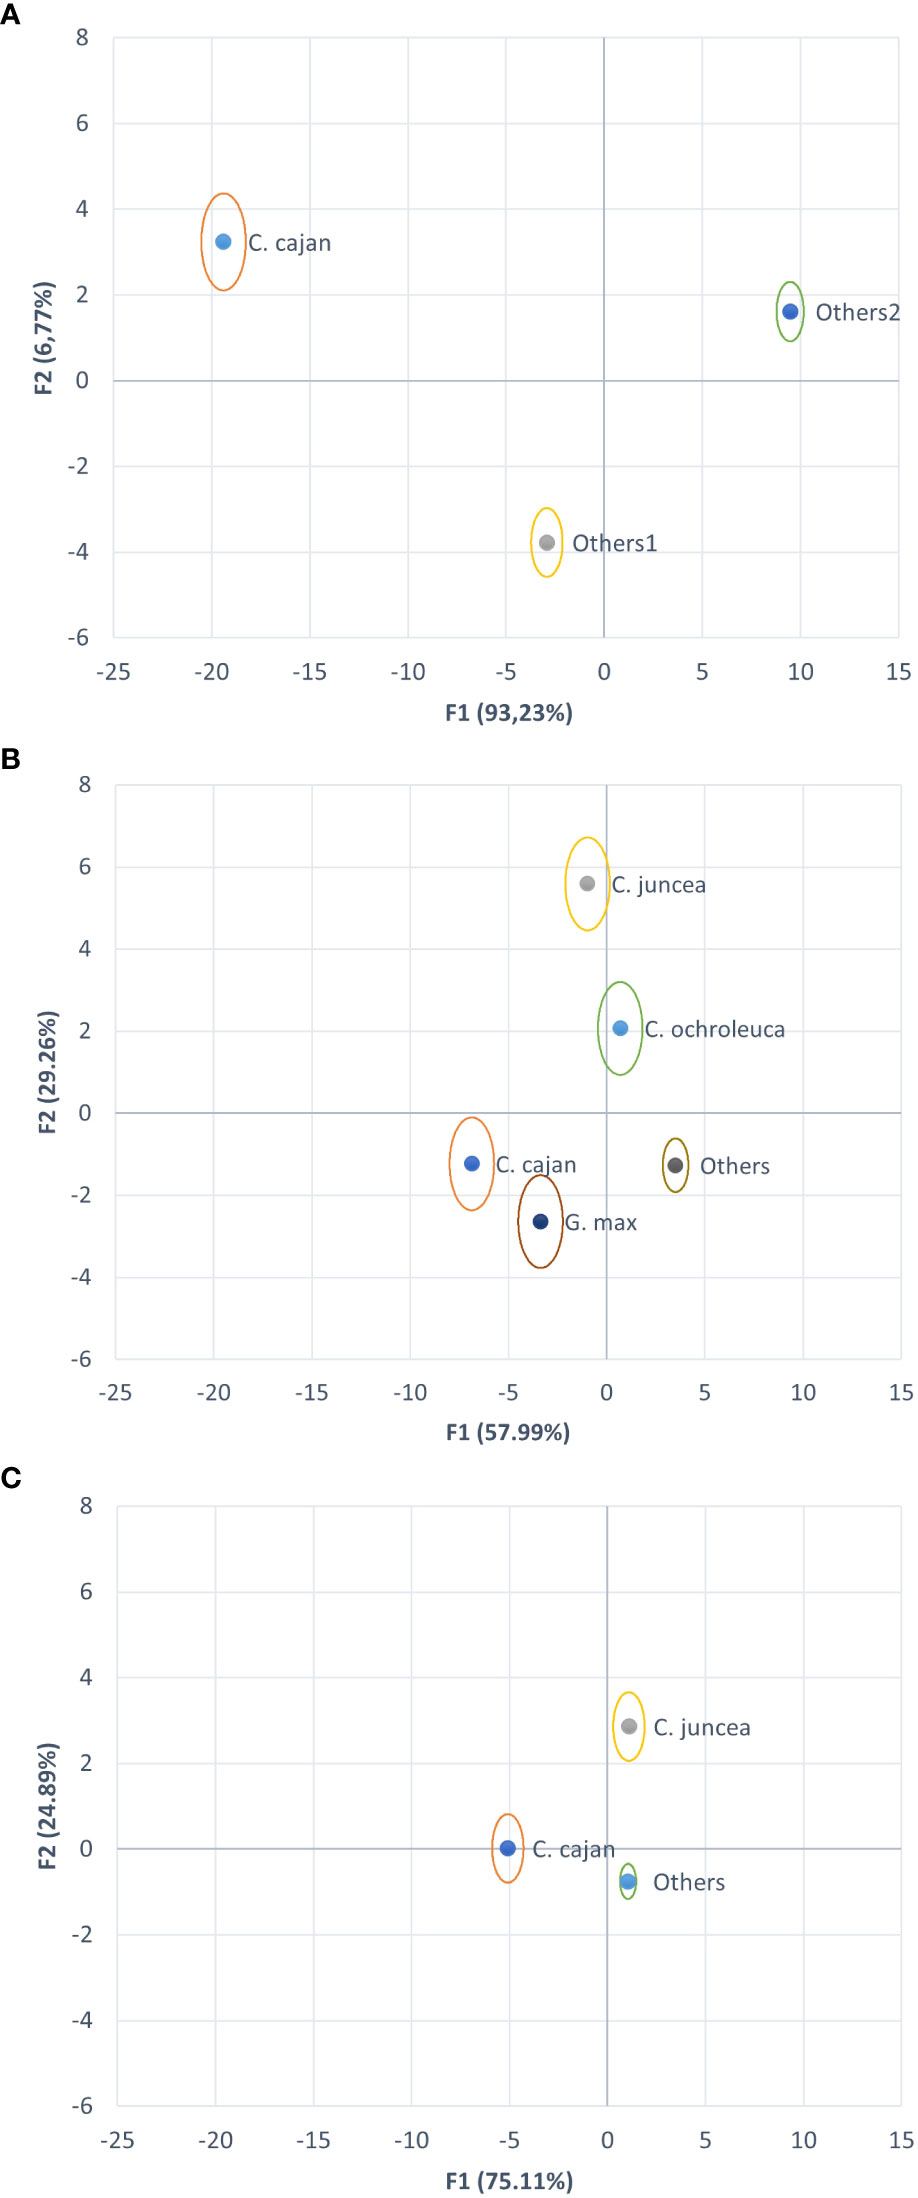
Figure 3 Biplot of the discriminant analysis considering the variables Dry Matter, Carbon mass, Nitrogen mass, proportion of Nitrogen derived from biological fixation (pNdFix), δ15N and mass N fixed (NmdFix) for each year separately; and using the variables Nitrogen and Carbon concentration, δ15N, carbon isotope discrimination, (pNdFix) and water efficiency index (NmdFix/carbon isotope discrimination) when both years were grouped together. (A) Year 2017, centroids of species C. C. cajan, others 1 (C. juncea and C. ochroleuca), and others 2 (C. spectabilis, D. lablab, and M. pruriens); (B) Year 2018, centroids of species C. C. cajan, C. juncea, C. ochroleuca, G. max and others (C. spectabilis, D. lablab, and M. pruriens); (C) Years 2017-2018, centroids of species: C. C. cajan, C. juncea, others (C. ochroleuca, C. spectabilis, D. lablab, and M. pruriens).
Data obtained from 2017 and 2018 for C. cajan, C. juncea, and a cluster formed by C. ochroleuca, C. spectabilis, D. lablab, and M. pruriens (Figure 3C). This combined analysis was also successful, with a classification error rate of 0% using the two mentioned methodologies. This indicates that the combination of data from different years allowed for accurate classification of the species. However, it is important to note that in this combined analysis, the variables selected as significant differed compared to the previous two analyses. Instead of being based on masses, the significant variables were mainly based on proportions or percentages. These changes in the selected variables can be attributed to the differences in biomass performance between years, even within the same species. The variations in the selected variables reflect the distinctive characteristics of the data in each year and highlight the importance of considering the specific conditions of each period when performing the discriminant analysis.
In conclusion, this study highlights the potential of legumes as summer cover crops in southern Uruguay, generating significant benefits in agroecosystems. Specifically, cover crops based on C. cajan and G. max can contribute significantly to nitrogen input through BNF. It is worth noting that C. cajan demonstrates high levels of nitrogen fixation without the need for rhizobia inoculation, even in soils with no previous history of this crop. These two species, along with C. juncea, excel in biomass production and carbon sequestration, although C. juncea has much lower potential to contribute nitrogen through BNF to the soil-plant system compared to the first two. However, ongoing research is investigating the possibility of enhancing C. juncea’s BNF potential by inoculating its seeds with rhizobia strains extracted from C. cajan or C. ochroleuca. Overall, the other evaluated species seem to have lower productivity potential in all these aspects. Furthermore, due to its subtropical origin, G. max would be the only viable option for late summer planting. However, it is important to mention that since G. max is currently the main agricultural crop in Uruguay, its use as a cover crop would not provide the same ecosystem services that other species could offer in terms of reducing pest, disease, and weed infestations. For that reason, C. cajan stands out as the most promising nitrogen-fixing cover crop for Uruguay.
Data availability statement
The raw data supporting the conclusions of this article will be made available by the authors, without undue reservation.
Author contributions
The authors confirm contribution to the paper as follows: Study conception and design: VB and CP. Data collection: VB. Analysis and interpretation of results: VB and CP. Draft manuscript preparation: VB and CP. All authors contributed to the article and approved the submitted version.
Funding
Authors are grateful to the funding of grants from Udelar-CAP (PhD grant for Verónica Berriel), Project Agencia Nacional de Investigación e Innovación de Uruguay – Fondo María Viñas 125492, Project IAEA ARCAL RLA5077, Biotechnology Postgrade Faculty of Science, Udelar, and Sistema Nacional de Investigadores.
Acknowledgments
The authors would like to express their sincere gratitude to Juan Manuel Berriel, Gonzalo Galindo, Santiago Álvarez, and Alejandro Puchiele for their invaluable assistance in the collection of data and samples during the field trials over the years. Additionally, thanks are extended to Leticia Martínez for her collaboration in soil characterization. Moreover, the contribution of Guillermo Cardellino, who made it possible to carry out the field trials, and of Pablo Porley, for his constant support throughout the experiments over the years, is recognized.
Conflict of interest
The authors declare that the research was conducted in the absence of any commercial or financial relationships that could be construed as a potential conflict of interest.
Publisher’s note
All claims expressed in this article are solely those of the authors and do not necessarily represent those of their affiliated organizations, or those of the publisher, the editors and the reviewers. Any product that may be evaluated in this article, or claim that may be made by its manufacturer, is not guaranteed or endorsed by the publisher.
References
Allison F. E. (1966). The fate of nitrogen applied to soils. Adv. Agron. 18, 219–258. doi: 10.1016/S0065-2113(08)60651-3
Appelgate S. R., Lenssen A. W., Wiedenhoeft M. H., Kaspar T. C. (2017). Cover crop options and mixes for upper midwest corn–soybean systems. Agron. J. 109 (3), 968–984. doi: 10.2134/agronj2016.08.0453
Ayalew T., Yoseph T., Cadisch G. (2022). Carbon assimilation and water-use efficiency in cowpea varieties inoculated with bradyrhizobium, measured using 13C natural abundance. J. Plant Interact. 17 (1), 853–860. doi: 10.1080/17429145.2022.2075943
Balkcom K. S., Reeves D. W. (2005). Sunn-hemp utilized as a legume cover crop for corn production. Agron. J. 97 (1), 26–31. doi: 10.2134/agronj2005.0026
Barel J. M., Kuyper T. W., Paul J., de Boer W., Cornelissen J. H., De Deyn G. B. (2019). Winter cover crop legacy effects on litter decomposition act through litter quality and microbial community changes. J. Appl. Ecol. 56 (1), 132–143. doi: 10.1111/1365-2664.13261
Berriel V., Monza J., Perdomo C. H. (2020a). Cover crop selection by jointly optimizing biomass productivity, biological nitrogen fixation, and transpiration efficiency: application to two crotalaria species. Agronomy 10 (8), 1116. doi: 10.3390/agronomy10081116
Berriel V., Monza J., Perdomo C. (2022b). Comparison of b values obtained by two methodologies that use soil as a substrate and their influence on the estimation of the proportion of nitrogen fixed by legumes. bioRxiv, 1–18. doi: 10.1101/2022.06.17.496592
Berriel V., Morel M. A., Filippi C. V., Monza J. (2021). Draft genome sequence of bradyrhizobium sp. strain Oc8 isolated from crotalaria ochroleuca nodule. Curr. Res. Microbial Sci. 2, 100074. doi: 10.1016/j.crmicr.2021.100074
Berriel V., Perdomo C., Monza J. (2020b). Carbon isotope discrimination and water-use efficiency in crotalaria cover crops under moderate water deficit. J. Soil Sci. Plant Nutr. 20, 537–545. doi: 10.1007/s42729-019-00142-8
Berriel V., Perdomo C. H., Signorelli S., Monza J. (2022a). Crop performance indexes applied to legume used as summer cover crops under water deficit conditions. Agronomy 12 (2), 443. doi: 10.3390/agronomy12020443
Blomme G., Ntamwira J., Ocimati W. (2022). Mucuna pruriens, crotalaria juncea, and chickpea (Cicer arietinum) have the potential for improving productivity of banana-based systems in Eastern democratic republic of Congo. Legume Sci. 4 (4), e145. doi: 10.1002/leg3.145
BRSEEDS (2023) Summer sedes legumes. Available at: https://www.brseeds.com/loja/catalogo-248016-19-leguminosas.
Cherr C. M., Scholberg J. M. S., McSorley R. (2006). Green manure approaches to crop production: a synthesis. Agron. J. 98 (2), 302–319. doi: 10.2134/agronj2005.0035
Chikowo R., Mapfumo P., Nyamugafata P., Giller K. E. (2004). Woody legume fallow productivity, biological n 2-fixation and residual benefits to two successive maize crops in Zimbabwe. Plant Soil 262, 303–315. doi: 10.1023/B:PLSO.0000037053.05902.60
Clark A. J., Decker A. M., Meisinger J. J., McIntosh M. S. (1997). Kill date of vetch, rye, and a vetch–rye mixture: II. soil moisture and corn yield. Agron. J. 89 (3), 434–441. doi: 10.2134/agronj1997.00021962008900030010x
Cordeiro C. F. D. S., Rodrigues D. R., Silva G. F. D., Echer F. R., Calonego J. C. (2022). Soil organic carbon stock is improved by cover crops in a tropical sandy soil. Agron. J. 114 (2), 1546–1556. doi: 10.1002/agj2.21019
Dantas E. F., de Freitas A. D. S., de Lyra M. D. C. C. P., de Rosalia e Silva Santos C. E., de Carvalho Neta S. J., de Arruda Santana A. C., et al. (2019). Biological fixation, transfer and balance of nitrogen in passion fruit ('Passiflora edulis' sims) orchard intercropped with different green manure crops. Aust. J. Crop Sci. 13 (3), 465–471. doi: 10.21475/ajcs.19.13.03.p1559
de Jesus Avila-Escobedo M., Peralta-Antonio N., Montiel-Vicencio G., Trejo-Téllez L. I., Rebolledo-Martinez A., Sanchez-Garcia P. (2022). Screening of potential legume to be used as green manure in tropical areas of Mexico. J. Soil Sci. Plant Nutr. 22 (3), 3172–3188. doi: 10.1007/s42729-022-00876-y
De Sousa D. C., Medeiros J. C., Lacerda J. D. J., Rosa J. D., Boechat C. L., De Sousa M. D. N. G., et al. (2019). Dry mass accumulation, nutrients and decomposition of cover plants. J. Agric. Sci. 11 (5), 152–160. doi: 10.5539/jas.v11n5p152
Farquhar G. D., Ehleringer J. R., Hubick K. T. (1989). Carbon isotope discrimination and photosynthesis. Annu. Rev. Plant Biol. 40 (1), 503–537. doi: 10.1146/annurev.pp.40.060189.002443
Fernando M., Shrestha A. (2023). The potential of cover crops for weed management: a sole tool or component of an integrated weed management system? Plants 12 (4), 752. doi: 10.3390/plants12040752
Folorunso O. A., Rolston D. E., Prichard T., Loui D. T. (1992). Soil surface strength and infiltration rate as affected by winter cover crops. Soil Technol. 5 (3), 189–197. doi: 10.1016/0933-3630(92)90021-R
Garba I. I., Fay D., Apriani R., Yusof D. Y. P., Chu D., Williams A. (2022). Fallow replacement cover crops impact soil water and nitrogen dynamics in a semi-arid sub-tropical environment. Agriculture Ecosyst. Environ. 338, 108052. doi: 10.1016/j.agee.2022.108052
García Préchac F., Ernst O., Arbeletche P., Pérez Bidegain M., Pritsch C., Ferenczi A., et al. (2010). Intensificación agrícola: oportunidades y amenazas para un país productivo y natural. Colección Art. 2, 1–106.
Gezahegn A. M., Abd Halim R., Yusoff M. M., Abd Wahid S. (2016). Decomposition and nitrogen mineralization of individual and mixed maize and soybean residue. MAYFEB J. Agric. Sci. 2, 28–45.
Giller K. (2001). Forage legumes in pastures and leys. in Nitrogen fixation in tropical cropping systems (Wallingford UK: CABI). pp. 187–211.
Guopeng Z., Weidong C., Jinshun B., Changxu X., Naohua Z., Songjuan G., et al. (2020). Co-Incorporation of rice straw and leguminous green manure can increase soil available nitrogen (N) and reduce carbon and n losses: an incubation study. Pedosphere 30 (5), 661–670. doi: 10.1016/S1002-0160(19)60845-3
Holman J. D., Assefa Y., Obour A. K. (2021). Cover-crop water use and productivity in the high plains wheat–fallow crop rotation. Crop Sci. 61 (2), 1374–1385. doi: 10.1002/csc2.20365
Houassine D., Latati M., Rebouh N. Y., Gérard F. (2019). Phosphorus acquisition processes in the field: study of faba bean cultivated on calcareous soils in Algeria. Arch. Agron. Soil Sci. 66 (2), 168–181. doi: 10.1080/03650340.2019.1605166
INUMET (2023) Summer climatology (dic-jan-feb) in Uruguay 1981 -2010. Available at: https://www.inumet.gub.uy/reportes/dcd/verano.pdf.
Jaramillo D. M., Dubeux J. C. Jr., Vendramini J. M., Queiroz L. M., Santos E. R., Ruiz-Moreno M., et al. (2020). Establishment techniques affect productivity, nutritive value and atmospheric N2 fixation of two sunn hemp cultivars. Grass Forage Sci. 75 (2), 153–158. doi: 10.1111/gfs.12472
Karuri H. (2022). Root and soil health management approaches for control of plant-parasitic nematodes in sub-Saharan Africa. Crop Prot. 152, 105841. doi: 10.1016/j.cropro.2021.105841
Kaye J., Finney D., White C., Bradley B., Schipanski M., Alonso-Ayuso M., et al. (2019). Managing nitrogen through cover crop species selection in the US mid-Atlantic. PloS One 14 (4), e0215448. doi: 10.1371/journal.pone.0215448
Kaye J. P., Quemada M. (2017). Using cover crops to mitigate and adapt to climate change. A review. Agron. Sustain. Dev. 37, 1–17. doi: 10.1007/s13593-016-0410-x
Kuo S., Jellum E. J. (2002). Influence of winter cover crop and residue management on soil nitrogen availability and corn. Agron. J. 94 (3), 501–508. doi: 10.2134/agronj2002.5010
Kuo S., Sainju U. M., Jellum E. J. (1997). Winter cover cropping influence on nitrogen in soil. Soil Sci. Soc. America J. 61 (5), 1392–1399. doi: 10.2136/sssaj1997.03615995006100050016x
López-Vicente M., Calvo-Seas E., Álvarez S., Cerdà A. (2020). Effectiveness of cover crops to reduce loss of soil organic matter in a rainfed vineyard. Land 9 (7), 230. doi: 10.3390/land9070230
Lumivero (2023). XLSTAT statistical and data analysis solution. (New York, USA). Available at: https://www.xlstat.com/es.
Macedo I., Otaño C., Barrios E., Beyhaut E., Rossi C., Sawchick J., et al. (2015). Annual summer legumes as cover crop options in agricultural systems. INIA Urug J. 43, 50–54.
Mathesius U. (2022). Are legumes different? origins and consequences of evolving nitrogen fixing symbioses. J. Plant Physiol. 276, 153765. doi: 10.1016/j.jplph.2022.153765
McSorley R., Dickson D. W., De Brito J. A., Hewlett T. E., Frederick J. J. (1994). Effects of tropical rotation crops on meloidogyne arenaria population densities and vegetable yields in microplots. J. Nematol. 26 (2), 175.
Mori C., Berriel V., Perdomo C. (2012). Biological fixation of Nitrogen by natural abundance: new method to estimate isotopic fractionation (In Spanish). XIX Latin American Congress and XXIII Argentine Congress of Soil Science, Mar del Plata, Argentina.
Nielsen D. C., Lyon D. J., Miceli-Garcia J. J. (2017). Replacing fallow with forage triticale in a dryland wheat-corn-fallow rotation may increase profitability. Field Crops Res. 203, 227–237. doi: 10.1016/j.fcr.2016.12.005
Nielsen D. C., Vigil M. F. (2005). Legume green fallow effect on soil water content at wheat planting and wheat yield. Agron. J. 97 (3), 684–689. doi: 10.2134/agronj2004.0071
Osipitan O. A., Dille J. A., Assefa Y., Radicetti E., Ayeni A., Knezevic S. Z. (2019). Impact of cover crop management on level of weed suppression: a meta-analysis. Crop Sci. 59 (3), 833–842. doi: 10.2135/cropsci2018.09.0589
Parenti A., Cappelli G., Zegada-Lizarazu W., Sastre C. M., Christou M., Monti A., et al. (2021). SunnGro: a new crop model for the simulation of sunn hemp (Crotalaria juncea l.) grown under alternative management practices. Biomass Bioenergy 146, 105975. doi: 10.1016/j.biombioe.2021.105975
Peoples M. B., Brockwell J., Herridge D. F., Rochester I. J., Alves B. J. R., Urquiaga S., et al. (2009). The contributions of nitrogen-fixing crop legumes to the productivity of agricultural systems. Symbiosis 48, 1–17. doi: 10.1007/BF03179980
Plaza-Bonilla D., Nolot J. M., Raffaillac D., Justes E. (2015). Cover crops mitigate nitrate leaching in cropping systems including grain legumes: field evidence and model simulations. Agriculture Ecosyst. Environ. 212, 1–12. doi: 10.1016/j.agee.2015.06.014
Restuccia A., Scavo A., Lombardo S., Pandino G., Fontanazza S., Anastasi U., et al. (2020). Long-term effect of cover crops on species abundance and diversity of weed flora. Plants (Basel). 9 (11), 1506. doi: 10.3390/plants9111506
Rojas-Velázquez M., Rodríguez-Ortiz J. C., Alcalá-Jáuregui J. A., Díaz-Flores P. E., Carballo-Méndez F. J., Zúñiga Valenzuela E. (2020). Ensayo en invernadero de abonos verdes sobre las propiedades del suelo, producción de acelga e implicaciones ambientales. Rev. mexicana Cienc. agrícolas 11 (4), 945–951.
Rosa-Schleich J., Loos J., Mußhoff O., Tscharntke T. (2019). Ecological-economic trade-offs of diversified farming systems–a review. Ecol. Economics 160, 251–263. doi: 10.1016/j.ecolecon.2019.03.002
Rose T. J., Parvin S., Han E., Condon J., Flohr B. M., Schefe C., et al. (2022). Prospects for summer cover crops in southern Australian semi-arid cropping systems. Agric. Syst. 200, 103415. doi: 10.1016/j.agsy.2022.103415
Sakai H., Hasegawa T., Kobayashi K. (2006). Enhancement of rice canopy carbon gain by elevated CO2 is sensitive to growth stage and leaf nitrogen concentration. New Phytol. 170 (2), 321–332. doi: 10.1111/j.1469-8137.2006.01688.x
Sarrantonio M., Gallandt E. (2003). The role of cover crops in north American cropping systems. J. Crop production 8 (1-2), 53–74. doi: 10.1300/J144v08n01_04
Sawchik J., Siri G., Ayala W., Barrios E., Bustamante M., Ceriani M., et al. (2015). “The threatened agricultural system: what do cover crops and/or short pastures contribute?,” in IV national symposium on agriculture (Paysandú, Uruguay).
Scavo A., Fontanazza S., Restuccia A., Pesce G. R., Abbate C., Mauromicale G. (2022). The role of cover crops in improving soil fertility and plant nutritional status in temperate climates. A review. Agron. Sustain. Dev. 42 (5), 93. doi: 10.1007/s13593-022-00825-0
Stam H., Stouthamer A. H., van Verseveld H. W. (1987). Hydrogen metabolism and energy costs of nitrogen fixation. FEMS Microbiol. Rev. 3 (1), 73–92. doi: 10.1111/j.1574-6968.1987.tb02453.x
Teodoro R. B., Oliveira F. L. D., Silva D. M. N. D., Favero C., Quaresma M. A. L. (2011). Agronomic aspects of leguminous to green fertilization in the cerrado of the high jequitinhonha valley. Rev. Bras. Ciec. do Solo 35, 635–640. doi: 10.1590/S0100-06832011000200032
Unkovich M. (2013). Isotope discrimination provides new insight into biological nitrogen fixation. New Phytol. 198 (3), 643–646. doi: 10.1111/nph.12227
Vergutz L., Manzoni S., Porporato A., Novais R. F., Jackson R. B. (2012). Global resorption efficiencies and concentrations of carbon and nutrients in leaves of terrestrial plants. Ecol. Monogr. 82 (2), 205–220. doi: 10.1890/11-0416.1
Weston L. A. (1996). Utilization of allelopathy for weed management in agroecosystems. Agron. J. 88 (6), 860–866. doi: 10.2134/agronj1996.00021962003600060004x
Keywords: cover crops, tropical legumes, biomass yield, biological nitrogen fixation, water use efficiency
Citation: Berriel V and Perdomo CH (2023) Cajanus cajan: a promissory high-nitrogen fixing cover crop for Uruguay. Front. Agron. 5:1214811. doi: 10.3389/fagro.2023.1214811
Received: 30 April 2023; Accepted: 06 June 2023;
Published: 23 June 2023.
Edited by:
María Florencia Del Papa, Universidad Nacional de La Plata, ArgentinaReviewed by:
Mourad Latati, Higher National Agronomic School, AlgeriaAurelio Scavo, University of Catania, Italy
Copyright © 2023 Berriel and Perdomo. This is an open-access article distributed under the terms of the Creative Commons Attribution License (CC BY). The use, distribution or reproduction in other forums is permitted, provided the original author(s) and the copyright owner(s) are credited and that the original publication in this journal is cited, in accordance with accepted academic practice. No use, distribution or reproduction is permitted which does not comply with these terms.
*Correspondence: Verónica Berriel, dmJlcnJpZWxAZmFncm8uZWR1LnV5