 Francisco Cafaro La Menza
 Walter Daniel Carciochi
- 1Facultad de Ciencias Agrarias, Universidad Nacional de Mar del Plata, Balcarce, Buenos Aires, Argentina
- 2Consejo Nacional de Investigaciones Científicas y Técnicas, IPADS Balcarce, Mar del Plata, Buenos Aires, Argentina
Catch crops (CCs) are crops that grow between two cash crops, accumulating nutrients in their biomass and later releasing them through the decomposition of their residues. To our knowledge, no study has compared the nutrient-related traits of different CCs species. This comparison is essential for understanding the possible roles of CCs in agroecosystems and for optimizing adjustments of fertilizer rates. This study aims to: i) synthesize characteristics of the CCs, such as aboveground dry matter accumulation, nutrient [carbon (C), nitrogen (N), sulfur (S), and phosphorus (P)] concentration and accumulation, and C:nutrient ratios, ii) explore factors defining the mentioned characteristics, and iii) discuss their implications on the ecosystem services provided. By analyzing data from 52 studies, (98 site-years) in the Argentinean Pampas, we observed that grasses (excluding ryegrass) accumulated the greatest aboveground dry matter (6.08 ± 0.22 t ha-1, mean ± SE) and C (2.60 ± 0.13 t ha-1), making them suitable for protecting the soil surface from erosion, suppressing weeds, and improving C balances. Conversely, vetch accumulated the highest nutrient content (118 ± 5.3, 15 ± 1.5, and 14 ± 1.2 kg ha-1 for N, S, and P, respectively) with the lowest C:nutrient ratio (means of 15:1, 152:1, and 147:1 for N, S, and P, respectively), making it a suitable choice for recycling nutrients and providing extra N. Mixtures presented intermediate characteristics between the monocultures, allowing a balanced provision of the mentioned ecosystem services. Furthermore, the results showed that dry matter accumulation affected the nutrient-related traits analyzed, and it was related to different factors, such as CCs sowing and termination dates or precipitation. The analysis highlights the importance of selecting CCs species based on the desired ecosystem service and provides valuable information for producers as well as for modeling C balances and nutrient cycling.
1 Introduction
Many agricultural regions worldwide cultivate only one crop per year, resulting in long fallow periods with low soil cover and without vegetation (Pinto et al., 2017). This condition causes low resource use efficiency, potential water and wind erosion, and negative carbon (C) balances, contributing to reduced soil organic matter contents (Caviglia and Andrade, 2010; Caviglia et al., 2013; Andrade et al., 2017). The decrease in organic matter levels affects nutrient supply to crops through mineralization (Carciochi et al., 2018; Reussi Calvo et al., 2018; Sainz Rozas et al., 2019). Moreover, the absence of permanent crops limits nutrient recycling in most agroecosystems. For instance, water excesses during winter fallows lead to nutrient losses from the soil through leaching (Gabriel et al., 2013; Frasier et al., 2017), particularly for soil mobile nutrients such as nitrogen (N) (as NO3-) and sulfur (S) (as SO4-2). Additionally, erosion and runoff, promoted by the lack of soil coverage, can increase losses of low-mobile nutrients such as phosphorus (P) (De Baets et al., 2011). To mitigate nutrient losses, farmers have adopted the practice of planting crops that grow between two cash crops, reducing or eliminating fallow periods (Thorup-Kristensen et al., 2003; Rinnofner et al., 2008). These crops are known as “cover crops”, “green bridge crops”, or “catch crops” (CCs), and are not grazed (unlike forage crops), incorporated into the soil (unlike green manures), or harvested (unlike cash crops) (Thorup-Kristensen et al., 2003; Rinnofner et al., 2008; Sievers and Cook, 2018; Crespo et al., 2022; Seitz et al., 2022).
The term “CCs” is commonly used because these crops accumulate nutrients in their biomass and subsequently release them through the decomposition of their residues (Valkama et al., 2015; Kang et al., 2018). In this way, CCs play a pivotal role in nutrient recycling, diminishing nutrient losses during fallow periods and supplying nutrients to the succeeding cash crop in the sequence. This role holds various environmental and economic implications. For instance, CCs have the potential to reduce the need for N fertilizers, thereby lowering greenhouse gas emissions and mitigating eutrophication from N leaching and P runoff (Abdalla et al., 2019; Alvarez et al., 2022). Additionally, CCs could lessen dependence on external inputs such as fertilizers, thereby reducing production costs. Consequently, CCs contribute to enhancing nutrient use efficiency and establishing sustainable agroecosystems over time, helping to close nutrient cycles (Restovich et al., 2012; Daryanto et al., 2018).
The quantity and timing of nutrients supplied from CCs residues to the succeeding cash crop depend on factors such as the species, the accumulated biomass, and the C:nutrient ratio of the decomposing residue (Restovich et al., 2012; Sievers and Cook, 2018). Nevertheless, CCs may also reduce nutrient availability through immobilization, adversely affecting the nutrition of the following crop (Jahanzad et al., 2016; Sievers and Cook, 2018; Otte et al., 2019; Carciochi et al., 2021a). Besides that, CCs incorporate C into the soil, leading to an increase in soil organic C content (Duval et al., 2016; Jian et al., 2020). If the CC is a legume, it could incorporate N by biological fixation and allow for a reduction in the N fertilizer rate in the main crop. Furthermore, CCs help control weeds, improve soil structure, and diminish soil erosion and evaporation (Schipanski et al., 2014; Rimski-Korsakov et al., 2015). Conversely, some reported negative effects of CCs include reductions in cash crop productivity, often linked to the consumptive water use of CCs, particularly in semiarid environments (Blanco-Canqui et al., 2015), or the occasional increase in greenhouse gas emissions following their termination (Basche et al., 2014).
The Argentinean Pampas region covers ca. 60 Mha and accounts for 90% of the country’s grain production (Lavado and Taboada, 2009; SAGyP, 2023). Commercial arable agriculture based on nutrient extraction has been used for decades generating negative nutrient balances and soil degradation, which were magnified by the widespread cropping of soybean (Glycine max. (L.) Merr.) (Lavado and Taboada, 2009; Wyngaard et al., 2022). In the last 20 years, winter CCs have been slowly adopted by farmers as a possible tool for improving soil quality (Rimski-Korsakov et al., 2015; Alvarez et al., 2017). Currently, a survey conducted by the SAGyP (2023) indicates a 318% increase in the area with CCs (from 110,000 ha to 350,000 ha) in the Pampas region from 2019 to 2022. This makes the Argentinean Pampas an appropriate area to analyze the potential impact of CCs on nutrient cycling and C balance in agroecosystems.
All the benefits provided by CCs to the agroecosystems are known as “ecosystem services”. So far, the existing information about CCs in the Argentinean Pampas has been summarized by Alvarez et al. (2017) and Rimski-Korsakov et al. (2015), who focused on their effect on some ecosystem services, such as improvements in chemical and physical soil properties, crop yields, and water availability after their termination. However, no study has yet summarized CCs characteristics (i.e., dry matter and nutrient accumulation, and quality of the residues) and the possible effect on nutrient (N, S, and P) availability for the succeeding crop and C contribution to the soil. This is crucial for fine-tuning fertilizer rates, which enhances economic profits and minimizes environmental externalities, and for understanding the CCs ability to supply C while maintaining or improving the soil C balance. Therefore, for the CCs species mainly used in the Argentinean Pampas, we aim to i) synthesize characteristics of the CCs such as aboveground dry matter accumulation, nutrient (N, S, and P) concentration and accumulation, and C:nutrient ratio, ii) explore factors defining the mentioned characteristics, and iii) discuss their implications on the ecosystem services provided to the agroecosystems.
2 Materials and methods
2.1 Study area
The climate of most of the region is humid-temperate without a dry season. Annual average temperatures range between 14°C in the south to 18°C in the north. Annual precipitation has a large inter-annual variability, ranging from 500 mm year-1 in the southwest to 1100 mm year−1 in the northeast. Therefore, Köppen classification categorizes the region as “Cfa,” indicating a warm and temperate rainy climate (C). The precipitation is uniformly distributed throughout the year “f”, and the temperature during the warmest month is equal to or greater than 22°C, defining the thermal condition as “a” (Beck et al., 2018). The most representative great groups of soils are Argiudolls and Hapludolls (Rubio et al., 2019). Soil organic C shows a strong association with rainfall and the pH ranges from 6 to 7 in well-drained agricultural soils (Berhongaray et al., 2013).
At present, around 76% of the Argentinean Pampas is under cropping with soybean, maize (Zea mays L.), wheat (Triticum aestivum L.), barley (Hordeum vulgare L.), and sunflower (Helianthus annuus L.) being the main crops (SAGyP, 2023). Continuous cultivation of grain crops is common, and pastures or annual forages tend to disappear from rotations (Alvarez et al., 2014). The average yields of maize, soybean (1st crop), soybean (2nd crop), sunflower, wheat, and barley in this region over the last 10 years are 6.7 t ha-1, 2.8 t ha-1, 2.1 t ha-1, 2.0 t ha-1, 2.8 t ha-1, and 2.4 t ha-1, respectively (SAGyP, 2023). Notably, these values can be more than double in the most productive regions for each crop. Additionally, almost 90% of the agricultural production is under no-till system (ReTAA, 2023).
Crop fertilization rates in Argentina depend on the crop. According to ReTAA (2022); ReTAA (2023), soybean receives an average fertilization rate of 6 to 10 kg P ha-1, and N fertilization is uncommon for this crop. In maize the average rates applied are 73 kg N ha-1 and 13 kg P ha-1, whereas in sunflower are 20 kg N ha-1 and 10 kg P ha-1. For winter crops such as wheat and barley, fertilizer rates range from 60 to 100 kg N ha-1 and 13 to 20 kg P ha-1. Over the past two decades, the reduction in the proportion of grasses in crop rotations has led to decreased organic matter content in the soils (Wyngaard et al., 2022). Additionally, cation extraction with crop harvest has led to acidified soils (Sainz Rozas et al., 2011; Sainz Rozas et al., 2019; Larrea et al., 2023). Currently, most soils in the Argentinean Pampas do not exhibit potassium deficiencies, although isolated cases have been reported in the northeastern part of the region (Sainz Rozas et al., 2019; Larrea et al., 2023). Regarding micronutrients, the levels in the region are generally above critical thresholds, although there have been reports of zinc deficiency in some areas (Sainz Rozas et al., 2019; Larrea et al., 2023).
2.2 Data collection
A database with 52 studies was generated from papers published in journals and national and international conferences between the years 2004 and 2022. We conducted an online search in Scopus and Google Scholar using the keywords: “Cover crops”, “Green bridge”, “Catch crops”, “Green manures”, “Argentinean Pampas”, “Carbon”, “Nitrogen”, “Phosphorus”, “Sulfur” and “Nutrients”, both in Spanish and English. A total of 1160 studies were found with the following search equation that was applied to the title, abstract, and keywords of the publications: “Argentinean pampas” OR “Argentine pampas” and “cover crops” OR “green bridges” OR “catch crops” OR “green manures” AND “nitrogen” OR “sulfur” OR “phosphorus” OR “nutrients” OR “carbon”. Works from the proceedings of conferences/congresses of the Argentinean Soil Science Association (from 2004 to 2022) were also included. Technical bulletins from the Argentinean National Institute of Agricultural Technology and undergraduate and postgraduate theses in repositories from different universities were included in the search. In this way, it was avoided international journal publication bias, which usually published experiments with statistically significant differences among treatments. We carefully made sure to exclude any doubtful or unreliable information that could lead to misleading data. Therefore, the first step after the online search was to filter publications by title and keywords, removing 884 studies (Supplementary Figure 1). The second step was to filter by abstract, removing 936 studies in total. Finally, we filter by full text and selected 52 studies that met the following conditions: 1) were carried out under field conditions and specifying the species of CC used, 2) described characteristics of the CCs (accumulated aboveground dry matter, concentration of C, N, S and/or P in aboveground dry matter, C:nutrient ratios) and 3) specified sowing and termination dates. Therefore, 98 site-years were finally included in the dataset (Supplementary Table 1) covering a large part of the Argentinean Pampas region, where CCs are typically used Figure 1 (Pinto et al., 2017).
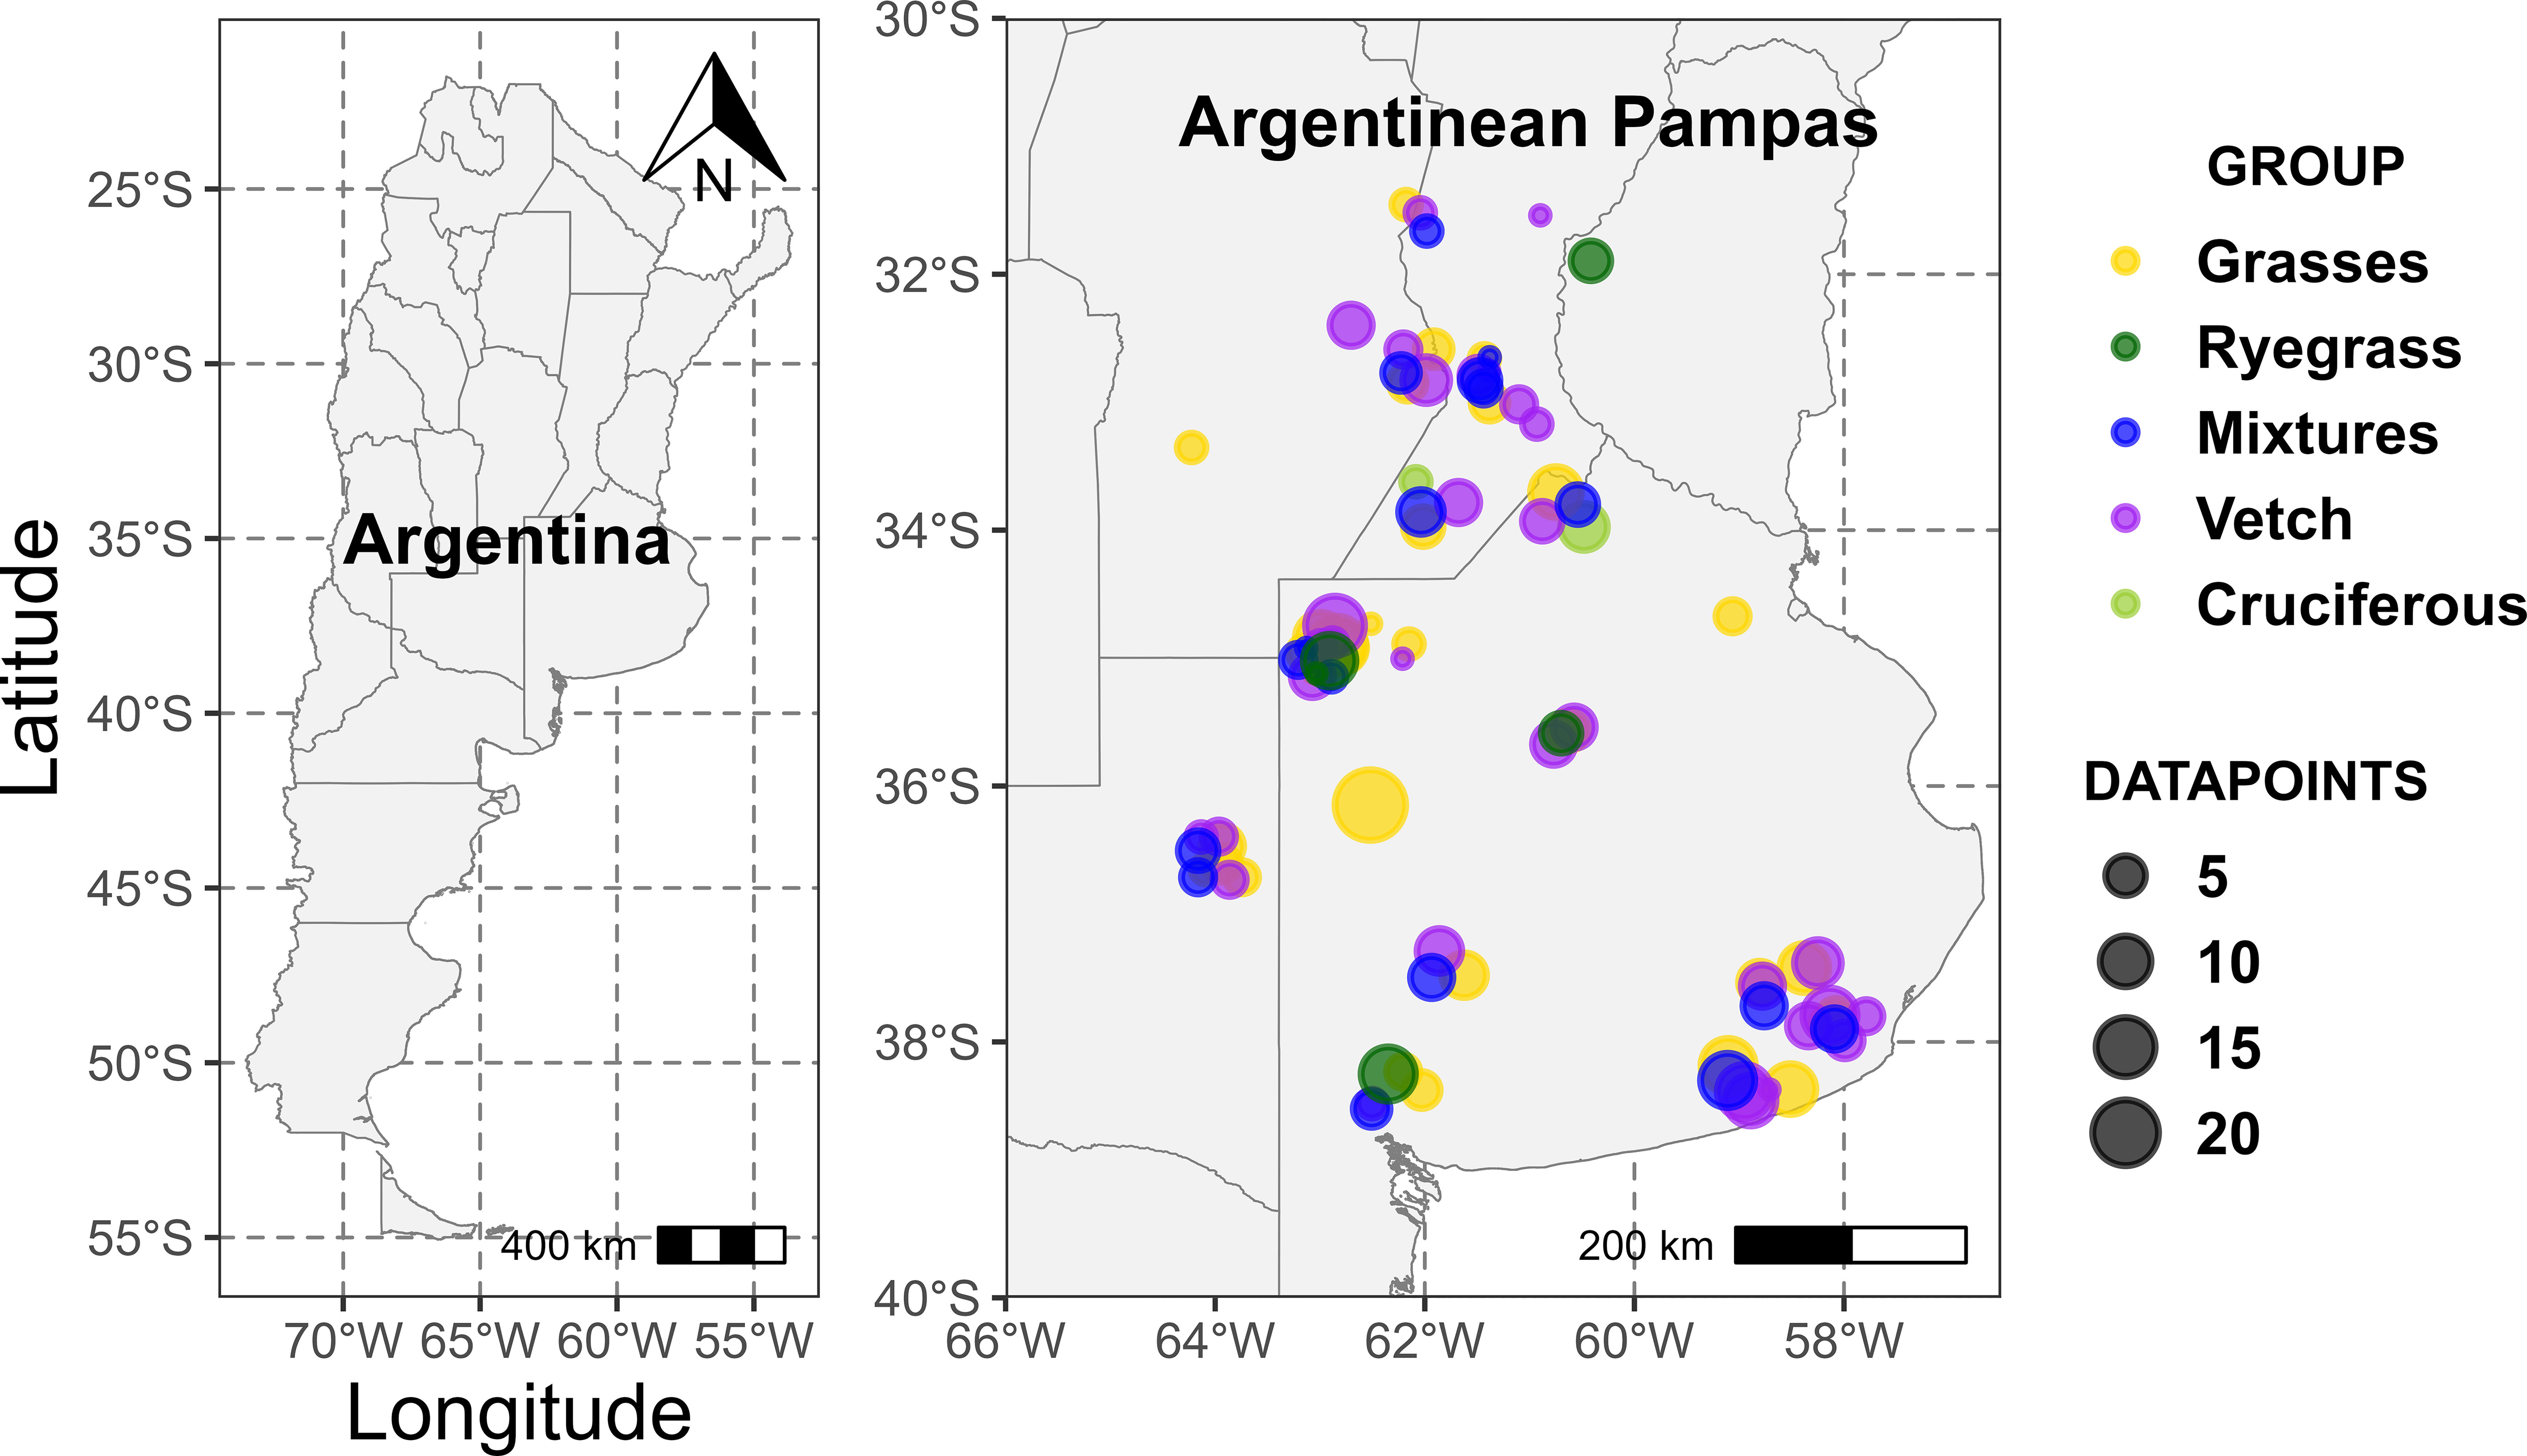
Figure 1 Location of the surveyed studies (n = 52; points differ a little from the actual location to avoid overlapping).
The information was obtained from texts, tables, and figures, using in the last case the software Get Data Graph Digitizer version 2.26.0.20 (Federov, 2013). From the collected variables, new parameters were calculated. Nutrient accumulation was computed by multiplying the nutrient concentration by the amount of aboveground dry matter. When C:nutrient ratios were not reported but the concentrations of C and nutrients were available, we calculated the ratios by dividing the concentrations of C by the concentrations of the respective nutrients.
Publications usually reported data from one single experiment, but in some cases, results from two or more experiments were included. The soils were Mollisols: Argiudolls and Hapludolls (Supplementary Table 1). In general, the experimental design used was randomized complete blocks with factorial, split-plot, or split-split-plot arrangement and 3 or 4 replicates. In all cases, data were collected from non-fertilized CCs, and their termination was accomplished through herbicide application, and in some cases, by rolling.
Five CC groups were considered for the analysis of the variables: grasses (excluding ryegrass (Lolium sp.)), ryegrass, vetch (Vicia sp.), cruciferous, and mixtures. Ryegrass was analyzed as a separate group from grasses based on a first analysis that we performed among all the grasses species, which showed significant differences between ryegrass and the other grasses on aboveground dry matter and C accumulation (data not shown). Grasses include oat (Avena sativa L.), barley, wheat, and common rye (Secale cereale L.). Mixtures consisted of vetch with oat or common rye. Cruciferous included rapeseed (Brassica napus L.) and radish (Raphanus sativus L.). Vetch was the only legume selected because the data available for other legume species were insufficient.
2.3 Data analysis
Aboveground dry matter accumulation, C, N, S, and P concentration and accumulation, and C:nutrient ratios were analyzed. Due to the low data availability on S and P for ryegrass (n=2) and lack of data for cruciferous, these nutrients were not analyzed in the mentioned CCs groups. The Levene’s test was performed using the car package in R 4.2.2 software (Fox and Weisberg, 2011) for testing homogeneity of variance across CC groups. As variances were not homogenous, a model comparison was performed by the gls function from the nlme package in the R 4.2.2 software (R Core Team, 2022), adding the weights = varIdent function (Pinheiro et al., 2017). Then, an ANOVA was performed for that model using the anova function from the stats package (R Core Team, 2022). When differences among CCs groups were detected, pairwise comparisons were performed using a Tukey test (p-value < 0.05).
To explain the variability observed in aboveground dry matter, a correlation analysis was performed between this variable and location, management (sowing and termination date), crop cycle duration, and the weather information available (accumulated precipitations during the CCs growing season). For this purpose, the cor.test procedure included in the R software was used. Finally, we analyzed the relationship between i) nutrient (N, S, and P) concentrations and aboveground dry matter, by fitting negative power functions that typically explain this relationship (Carciochi et al., 2018; Ciampitti et al., 2022), and ii) C:nutrient ratios and aboveground dry matter by fitting simple linear models. All these analyses were not conducted for ryegrass and cruciferous due to the low data availability.
3 Results
3.1 Database characterization
Catch crops were sown from early-March to late-June (without extreme dates) (Supplementary Figure 2A) and termination dates ranged from late-July to late-November (without extreme dates) (Supplementary Figure 2B). Consequently, the median CC cycle duration was 163, 162, 172, 175, and 155 days for grasses, ryegrass, mixtures, vetch, and cruciferous, respectively (Supplementary Figure 2C). Seeding rates were 25-120 kg ha-1 for grasses, 7-20 kg ha-1 for ryegrass, 7-50 kg ha-1 for oat or common rye plus 12-40 kg ha-1 vetch on mixtures, 7-45 kg ha-1 for vetch, and 5-20 kg ha-1 for cruciferous.
3.2 Aboveground dry matter and carbon accumulation
Aboveground dry matter presented a large variability both among groups and within each group, ranging from 0.38 to 17.60 t ha-1 (Figure 2A). The aboveground dry matter interquartile range (IQR) was 3.96-7.95 t ha-1 for grasses, 1.63-4.33 t ha-1 for ryegrass, 4.18-8.14 t ha-1 for mixtures, 2.80-5.41 t ha-1 for vetch, and 1.23-2.44 t ha-1 for cruciferous. Overall, aboveground dry matter was greater for mixtures and grasses (mean ± SE 6.21 ± 0.36 and 6.08 ± 0.22 t ha-1, respectively) compared to vetch, ryegrass, and cruciferous (mean ± SE 4.09 ± 0.18, 3.25 ± 0.39, and 2.45 ± 0.59 t ha-1, respectively).
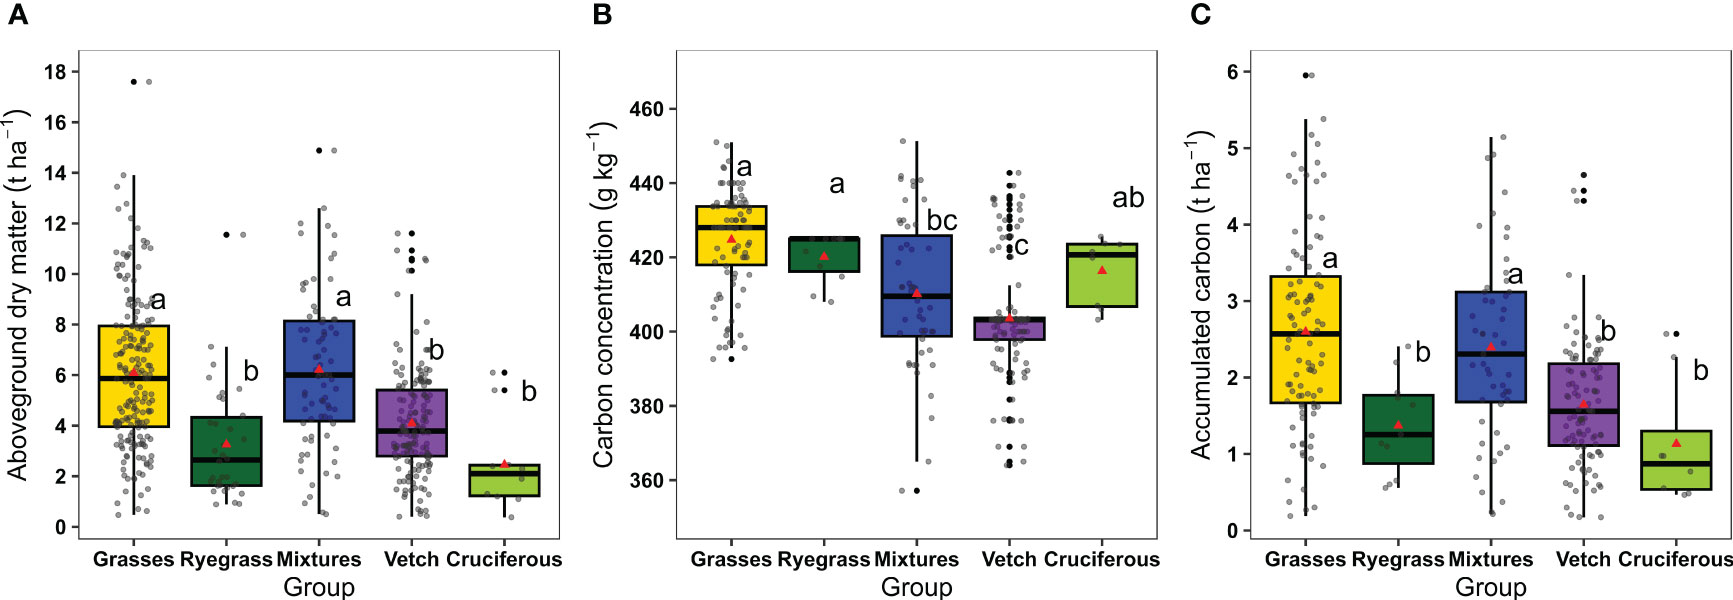
Figure 2 (A) Aboveground dry matter accumulated in grasses (n=188), ryegrass (n=34), mixtures (n=75), vetch (n=158), and cruciferous (n=10), (B) carbon concentration and (C) carbon accumulation in aboveground dry matter of grasses (n=97), ryegrass (n=11), mixtures (n=51), vetch (n=107), and cruciferous (n=8). Boxplots represent the 5th and 95th (whiskers), 25th (lower edge of the box) and 75th (top edge of the box) percentiles. The line inside the boxes represents the median and the red triangle inside the boxes represents the mean. Same letters indicate not significant differences among means of catch crop groups for each variable described using Tukey multiple comparison test (p-value < 0.05).
The variability of the accumulated aboveground dry matter within each CC group (except cruciferous with little information available, n=10) was related to some of the variables analyzed (location, management, and precipitations). Aboveground dry matter accumulation was weakly correlated to the location (only positive correlations with longitude for ryegrass and vetch), positively correlated to the termination date (in all the groups), crop cycle duration (in grasses, mixtures, and vetch), and precipitation during the growing season (in grasses and ryegrass), while it was negatively correlated to the sowing date in vetch (Table 1). Moreover, based on linear relationships between aboveground dry matter accumulation and each variable, we observed that: i) one-day delay in the termination date caused 31.5 kg ha-1 (grasses; p-value<0.001), 22.0 kg ha-1 (ryegrass; p-value=0.049), 54.4 kg ha-1 (mixtures; p-value<0.001), and 30.9 kg ha-1 (vetch; p-value<0.001) of extra aboveground dry matter accumulation; ii) a longer cycle duration led to 23 to 28 kg ha-1 day-1 of additional aboveground dry matter accumulation in grasses (p-value<0.001), mixtures (p-value=0.006), and vetch (p-value<0.001), and iii) each millimeter of precipitation generated 6.5 kg ha-1 and 18.5 kg ha-1 more aboveground dry matter accumulation in grasses (p-value<0.001) and ryegrass (p-value=0.005), respectively.
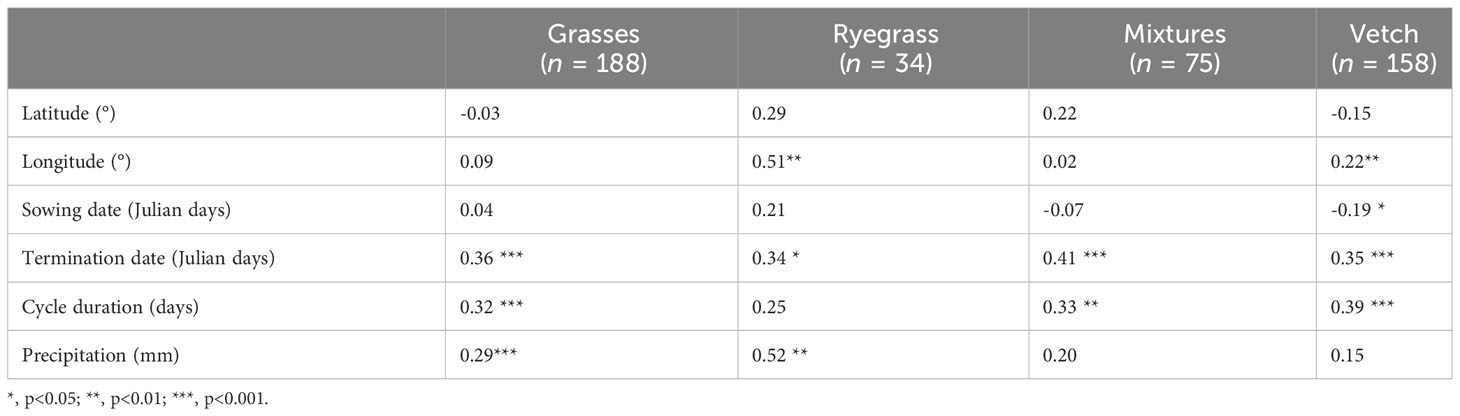
Table 1 Pearson´s correlation coefficients between aboveground dry matter (t ha-1) and the location (latitude and longitude), sowing and termination date, crop cycle duration, and precipitation during the growing season for grasses, ryegrass, mixtures, and vetch.
Carbon concentration across groups ranged from 357 to 451 g kg-1 (Figure 2B). The lowest values were observed in vetch and mixtures (mean ± SE 404 ± 1.6 and 410 ± 2.8 g kg-1, respectively), whereas grasses, ryegrass, and cruciferous presented the highest values (mean ± SE 425 ± 1.4, 420 ± 2.0, and 416 ± 3.3 g kg-1, respectively). On the other hand, accumulated C in aboveground dry matter ranged from 0.17 to 5.95 t ha-1, and similarly to aboveground dry matter, grasses and mixtures achieved the highest values (mean ± SE 2.60 ± 0.13 and 2.39 ± 0.17 t ha-1, respectively), whereas vetch, ryegrass, and cruciferous the lowest (mean ± SE 1.65 ± 0.08, 1.37 ± 0.19 and 1.13 ± 0.29 t ha-1, respectively) (Figure 2C).
3.3 Nitrogen, sulfur, and phosphorus accumulation and C:nutrient ratios
Nitrogen concentration, accumulation, and C:N ratio were different among CC groups (Figures 3A–C). Vetch presented the highest N concentration (mean ± SE 29.6 ± 0.8 g kg-1), accumulation (mean ± SE 118.4 ± 5.3 kg ha-1), and the lowest C:N ratio (mean of 15.3:1). On the contrary, grasses presented the lowest N concentration (mean ± SE 12.9 ± 0.6 g kg-1), accumulation (mean ± SE 69.6 ± 4.5 kg ha-1) [not differing from ryegrass (mean ± SE 58.9 ± 10.6 kg ha-1) or cruciferous (mean ± SE 57.0 ± 21.1 kg ha-1)], and the greater C:N ratio (44.4:1) [not differing from ryegrass (29.3:1)]. Nitrogen concentration in cruciferous (mean ± SE 18.3 ± 2.3 g kg-1) and mixtures (mean ± SE 17.8 ± 1.1 g kg-1) was intermediate between vetch and grasses, as well as the C:N ratio (25.4:1 and 27.1:1, respectively).
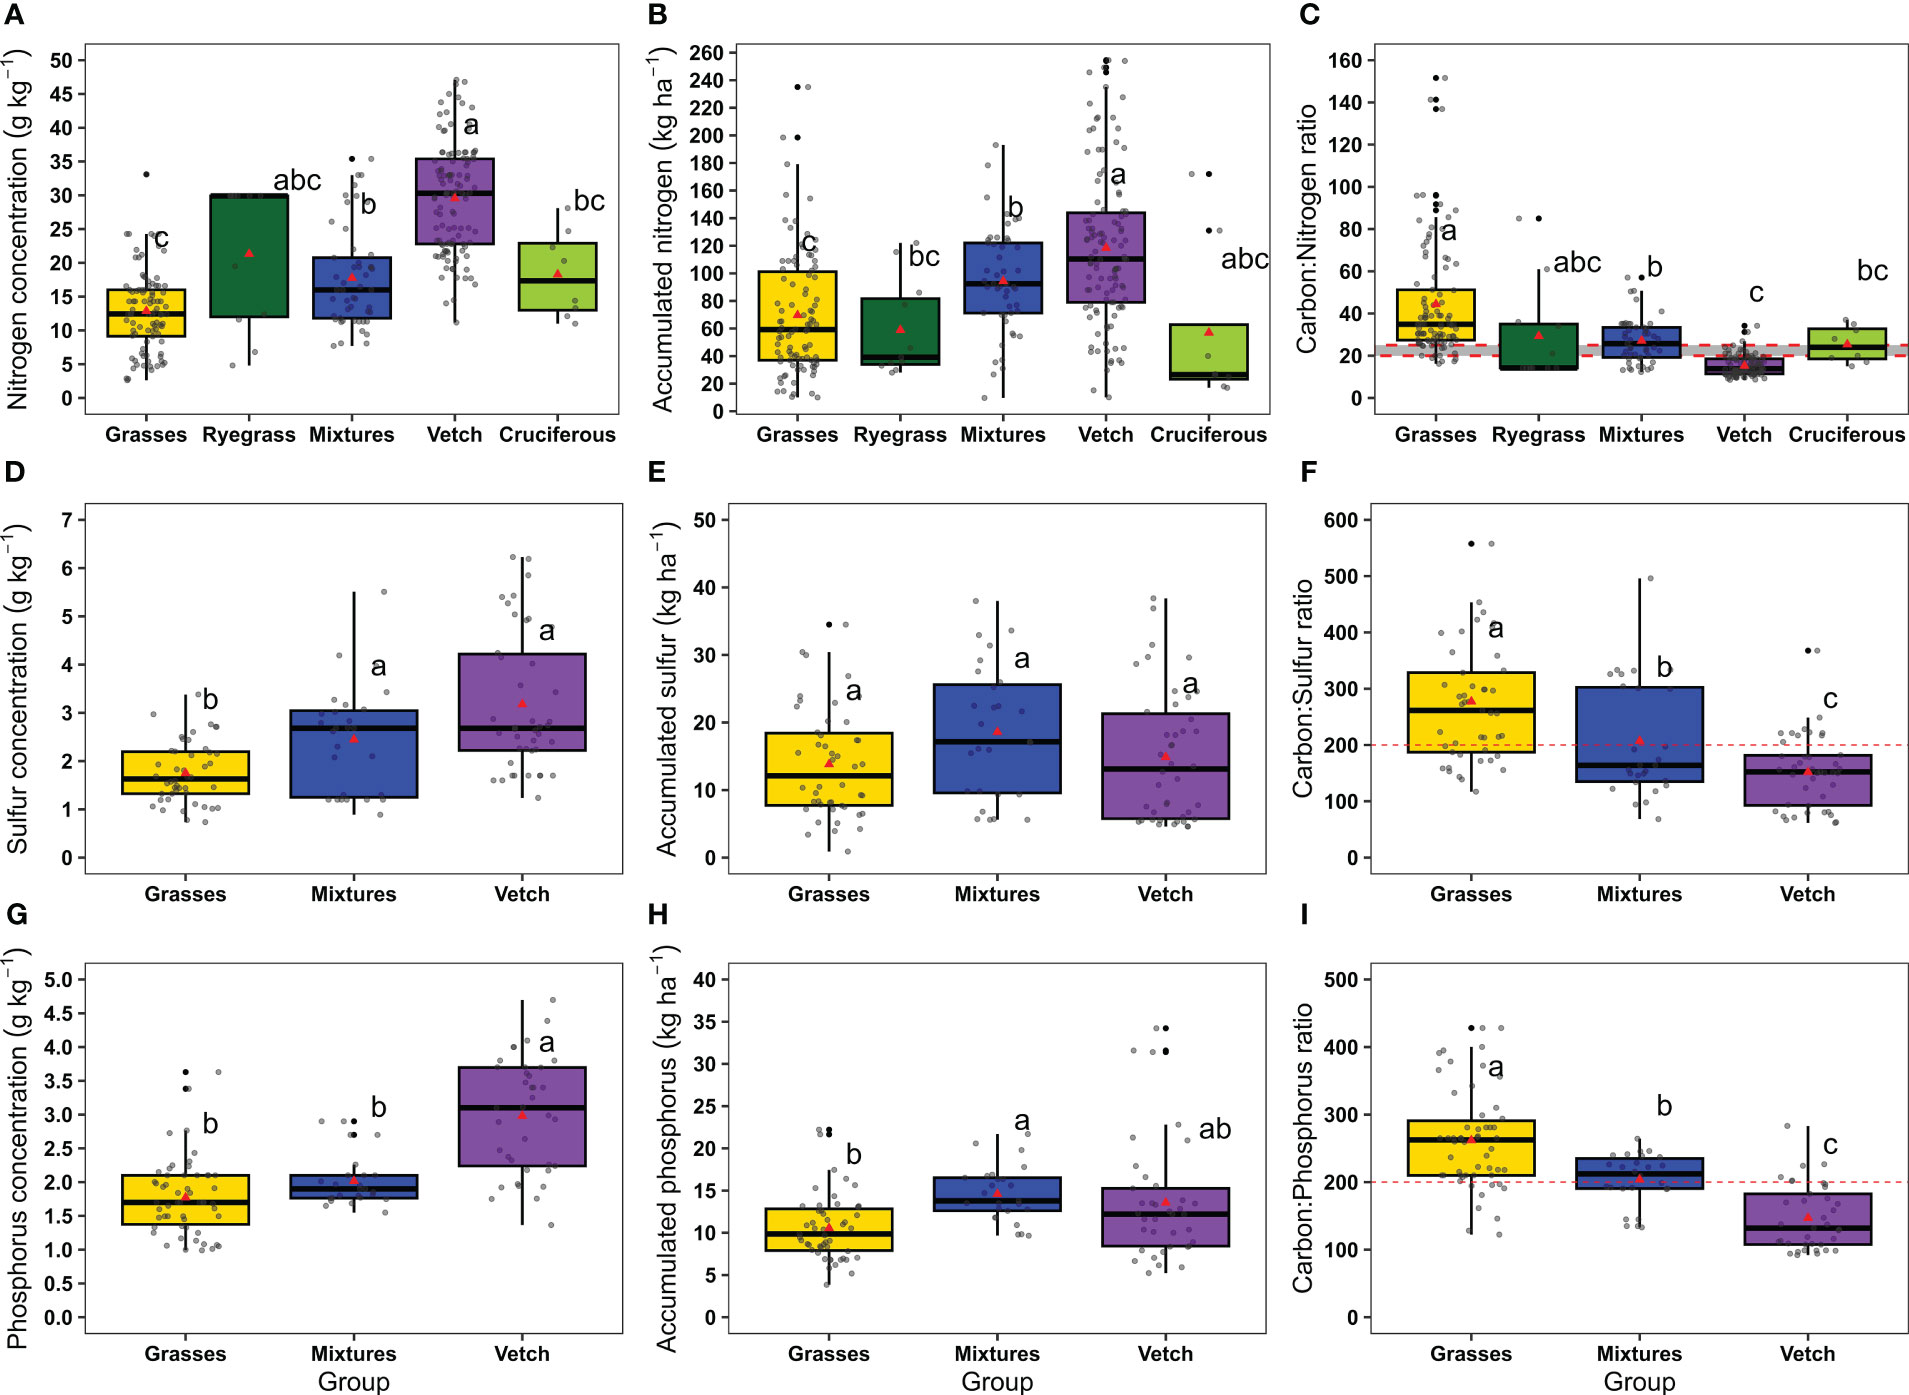
Figure 3 (A) Nitrogen concentration, (B) accumulated nitrogen and (C) C:N ratio in grasses (n=94), ryegrass (n=11), mixtures (n=49), vetch (n=114), and cruciferous (n=8). (D) Sulfur concentration, (E) accumulated sulfur and (F) C:S ratio in grasses (n=46), mixtures (n=27) and vetch (n=42). (G) Phosphorus concentration (H) accumulated phosphorus and (I) C:P ratio in grasses (n=54), mixtures (n=27) and vetch (n=37). Boxplots represent the 5th and 95th (whiskers), 25th (lower edge of the box) and 75th (top edge of the box) percentiles. The line inside the boxes represents the median and the red triangle inside the boxes represents the mean. Dashed red lines in (C, F, I) represent the thresholds below which mineralization is likely to occur for C:N, C:S and C:P ratios, respectively (Eriksen et al., 2004; Halvin et al., 2005; Sievers and Cook, 2018). Same letters indicate not significant differences among means of catch crops groups for each variable described using Tukey multiple comparison test (p-value < 0.05).3.4Nutrient concentration and C:nutrient ratios relationships with aboveground dry matter.
Sulfur concentration varied from 0.7 to 6.2 g kg-1 and followed the order: vetch (mean ± SE 3.2 ± 0.2 g kg-1) > mixtures (mean ± SE 2.5 ± 0.2 g kg-1) > grasses (mean ± SE 1.8 ± 0.1 g kg-1) (Figure 3D). There were no differences among CC groups on accumulated S (mean ± SE 13.8 ± 1.2, 18.6 ± 1.2, 14.9 ± 1.5 for grasses, mixtures and vetch, respectively) (Figure 3E). The C:S ratio presented a minimum of 61.7:1 and a maximum of 604.1:1 and followed inverse order to S concentration: grasses (277.3:1) > mixtures (207.3:1) > vetch (151.9:1) (Figure 3F).
Phosphorus concentration varied between 1.0 and 4.7 g kg-1 and, as observed for S, followed the order: vetch (mean ± SE 3.0 ± 0.14 g kg-1) > mixtures (mean ± SE 2.0 ± 0.08 g kg-1) > grasses (mean ± SE 1.8 ± 0.08 g kg-1) (Figure 3G). Mixtures accumulate, on average, more P than grasses (mean ± SE 14.6 ± 0.7 vs. 10.7 ± 0.5 kg ha-1) and vetch showed an intermediate P accumulation (not differing from mixtures, mean ± SE 13.6 ± 1.2 kg ha-1) (Figure 3H). The C:P ratio followed the order: grasses (261.9:1) > mixtures (203.8:1) > vetch (147.0:1) (Figure 3I).
We explored the relationships between nutrient concentrations and C:nutrient ratio versus aboveground dry matter to better comprehend changes in the formers and to obtain predictive models. Nitrogen concentration in all the CCs groups and P concentration in grasses and mixtures were negatively related to aboveground dry matter, whereas there was no relationship between S concentration and aboveground dry matter (Figures 4A–C). From the negative power models fitted, it could be deduced a greater reduction in N concentration as aboveground dry matter increases for grasses and mixtures (decay rate = 0.25 and 0.24) than for vetch (decay rate = 0.09) (p=0.046). It should be noted that even though it was possible to fit models between N concentration and aboveground dry matter, their explanatory power was low (r2<0.27). For P, no significant differences between grasses and mixtures were observed in the decay rate of concentration as a function of aboveground dry matter (p=0.150). Concerning C:nutrient ratios (Figures 4D–F), the C:N ratio was positively and linearly related to aboveground dry matter for the three CCs groups evaluated. As C concentration did not change with the amount of aboveground dry matter accumulated (p>0.05), the C:N behavior was opposite to that observed for N concentration [i.e., C:N increment per kg ha-1 of aboveground dry matter was greater in grasses and mixtures (2.97 and 2.36, respectively) than in vetch (0.75)]. A positive linear relationship was also observed for C:P ratio and aboveground dry matter in grasses and mixtures, whereas C:S ratio was not related to aboveground dry matter.
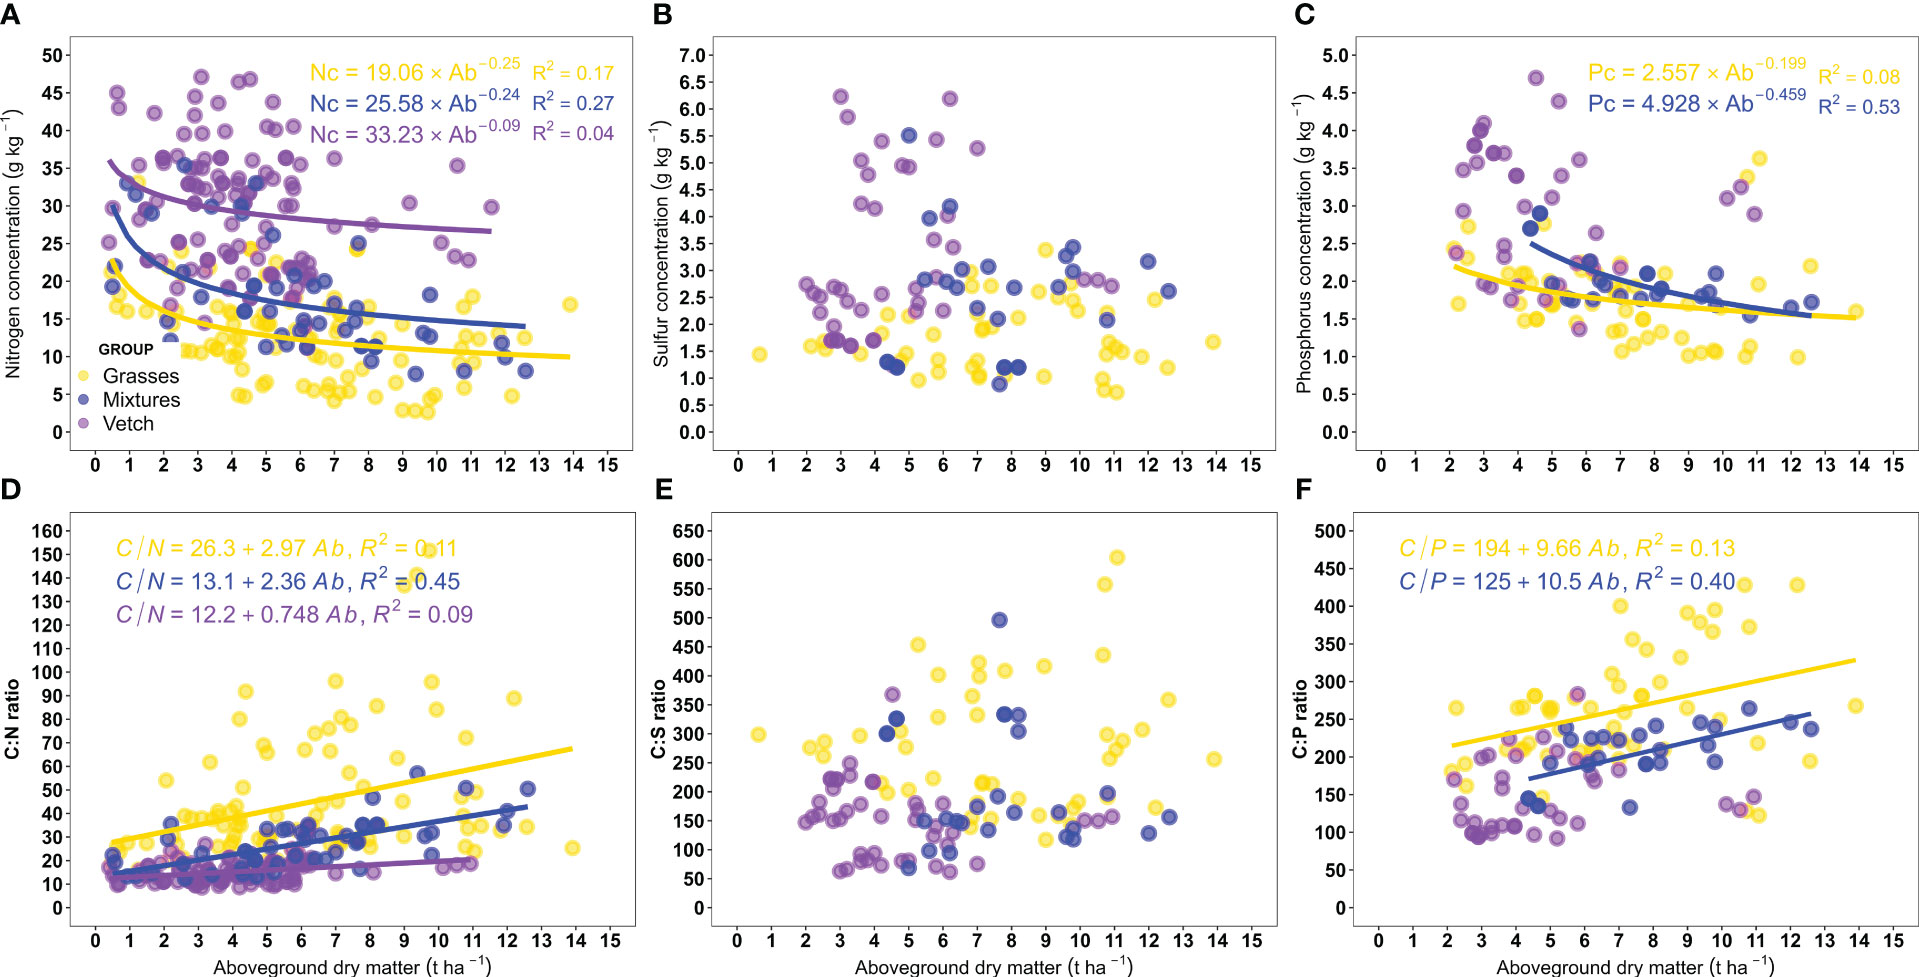
Figure 4 Relationship between aboveground dry matter and (A) nitrogen (N), (B) sulfur (S), and (C) phosphorus (P) concentrations, and (D) carbon (C):N, (E) C:S, and (F) C:P ratios. The lines represent significant models for each group (p < 0.05). For N (panels A, D) n= 114, 49, and 94, for S (panels B, E) n= 42, 27, and 46, and for P (panels C, F) n= 37, 25, and 54, for vetch, mixtures, and grasses, respectively.
4 Discussion
Previous studies summarized the effect of CCs on soil water availability, soil erosion control, soil physical and chemical properties, and weed suppression, among others (Schipanski et al., 2014; Rimski-Korsakov et al., 2015; Alvarez et al., 2017; Daryanto et al., 2018; Blanco-Canqui and Ruis, 2020). To the best of our knowledge, this is one of the first investigations that synthesizes and analyzes a large dataset containing 98 site-years, allowing us to i) explore the variability on C, N, S, and P accumulation and the C:nutrient ratio in the aboveground dry matter of different CCs species, ii) identify factors explaining these variables, and iii) associate them with ecosystem services. Our study showed that grasses presented the highest biomass and C accumulation, as well as higher C:nutrient ratios. In contrast, vetch accumulated high amounts of nutrients with low C:nutrient ratios, while mixtures presented intermediate conditions between their monocultures (i.e., grasses and vetch). This is highly relevant to select the appropriate CCs species based on the desired ecosystem service and to encourage the inclusion of CCs in cropping systems with negative nutrient balances and soil degradation, such as those in the Argentinean Pampas region (Lavado and Taboada, 2009).
The C:nutrient ratio of CCs residues plays a significant role in the mineralization-immobilization turnover. In this context, C:N ratios below 20 to 25:1 (Sievers and Cook, 2018), and C:P and C:S ratios below 200:1 (Eriksen et al., 2004; Halvin et al., 2005) suggest net nutrient mineralization. Hence, it is important to consider these thresholds to predict the impact of CCs on nutrient availability and the duration of soil coverage. When C:nutrient ratios suggest mineralization, net nutrient contributions to the following crop are expected, as well as a rapid decline in soil coverage over time. Conversely, in cases of immobilization, microorganisms take up nutrients from the soil to decompose the residues, thereby diminishing nutrient availability for the subsequent crop, and soil coverage is extended for a long period (Eriksen, 2008; Murungu et al., 2011; Sievers and Cook, 2018).
The overall high aboveground dry matter and C accumulation and high C:nutrient ratio in grasses indicate that they would be an appropriate option when the goal of CCs is to enhance C sequestration and maintain or even improve soil organic C stocks (Schipanski et al., 2014; Daryanto et al., 2018). In this context, after five years of using CC, Duval et al. (2016) reported greater increments in soil organic C concentration with grasses (wheat and oat) than with vetch, being the C changes in the topsoil associated with the quantity of C input. Although grasses were not the CC group with the highest nutrient accumulation, the significant amount of nutrient uptake suggests that they could prevent N and S losses, mainly through leaching, and in the case of P, through runoff (Eriksen et al., 2004; De Baets et al., 2011; Restovich et al., 2012; Gabriel et al., 2013). Moreover, the high C:nutrient ratio suggests very slow residue decomposition, leading to prolonged soil surface coverage (Eriksen, 2008; Murungu et al., 2011). Therefore, grasses would also be a suitable option for i) protecting the soil surface, reducing soil losses through water and wind erosion (De Baets et al., 2011; Vincent-Caboud et al., 2019); ii) promoting weed suppression during the CC and cash crop growing seasons (Finney et al., 2017; Vincent-Caboud et al., 2019), and iii) reducing water losses through evaporation after their termination (Restovich et al., 2012; Alfonso et al., 2020). However, it should be highlighted that the high C:nutrient ratios would cause nutrients immobilization, increasing the fertilizer rates required to satisfy the succeeding cash crop demand (Eriksen et al., 2004; Lupwayi et al., 2007; Murungu et al., 2011; Carciochi et al., 2021b).
Vetch presented the highest nutrient accumulation, indicating its key role in reducing nutrient losses during fallow periods and the associated environmental externalities (Gabriel et al., 2013; Frasier et al., 2017). Nitrogen losses by N2O emissions and NO3- leaching have been questioned when analyzing the whole sequence vetch-cash crop. Meta-analyses conducted for the northern hemisphere indicate that legume CCs increase N2O emissions compared to other species (Basche et al., 2014; Muhammad et al., 2019). However, studies conducted in the Argentinean Pampas showed no significant differences in N2O emissions with or without CCs, including vetch (Vangeli et al., 2022; Petrasek et al., 2023). Regarding NO3- leaching, lower NO3–N content in soil was reported after vetch and other CCs, compared with a fallow condition, suggesting lower potential N losses through this mechanism (Restovich et al., 2012; Frasier et al., 2017). In addition, as 60% of the N in vetch comes from biological N fixation (Enrico et al., 2020), it is noteworthy that substantial N inputs to the systems are expected (IQR = 47.4 to 86.3 kg N ha-1). The highest nutrient accumulation, along with the lowest C:nutrient ratio, suggests that vetch could rapidly release significant amounts of N, P, and S that would be available to the succeeding crop in the sequence (Eriksen, 2008; Murungu et al., 2011; Sievers and Cook, 2018; Vincent-Caboud et al., 2019). However, the observed variability in nutrients accumulation indicated that they should be quantified in each growing condition and, in combination with the nutrient requirement of the crops, adjust the nutrient rates to apply via organic or inorganic fertilizer, in order to achieve the sustainability of the agroecosystem.
As expected, mixtures containing grasses and vetch presented intermediate CCs characteristics between the respective monocultures, which agreed with previous studies (Restovich et al., 2012; Ketterings et al., 2015; Thapa et al., 2018). Therefore, mixtures could provide the different ecosystem services mentioned in a balanced way (Finney et al., 2016; Frasier et al., 2017; Vincent-Caboud et al., 2019). Especially in this CC group, the definition of their nutrient characteristics is crucial to predict the role of mixtures in the agroecosystems. For example, mixtures with low biomass accumulation, and thus low C:nutrient ratios, act as a nutrient source for the succeeding crop in the sequence, while high biomass and its associated high C:nutrient ratios, will cause nutrient immobilization and a prolonged protection of the soil surface because of their lower rate of decomposition (Eriksen et al., 2004; Lupwayi et al., 2007; Finney et al., 2016; Vincent-Caboud et al., 2019). Notably, nutrient-related traits are not only determined by biomass accumulation but also by the proportion of each species in the mixture (Hayden et al., 2014; Poffenbarger et al., 2015). Unfortunately, the available information was insufficient to include this variable in our analysis. However, we are aware that the proportion of each species should be considered to predict the behavior of mixtures (i.e., whether they are more similar to vetch or grasses) associated with the discussed ecosystem services.
As determined by Thapa et al. (2018), our observations indicate that biomass accumulation defines the magnitude of the ecosystem service provided by each CC group. In agreement with previous studies (Ketterings et al., 2015; Mirsky et al., 2017; Thapa et al., 2018), we detected factors such as the termination date, CC cycle duration, and precipitation during the CC growing season that determined the CC biomass accumulation. The location of the analyzed sites weakly explained CCs biomass accumulation, but detailed studies on CCs spatial variability are encouraged to be conducted. Contemplating the mentioned factors affecting biomass accumulation is a key point as they will influence nutrient concentrations, accumulations, and C:nutrient ratios, impacting the ecosystem services discussed. It should be highlighted that this study did not assess the C and nutrient accumulation in the roots of CCs which are known to significantly impact on the C and nutrients input to the system (Couëdel et al., 2018; Villarino et al., 2021), which deserves to be analyzed in future studies. It is worth noting that a high aboveground dry matter accumulation would not always be desirable. For example, we observed that C:nutrient ratios in grasses and mixtures increased as the dry matter accumulation also did, which would cause nutrient immobilization (Lupwayi et al., 2007; Vincent-Caboud et al., 2019). Additionally, long CCs cycle durations and late termination dates might reduce water availability for the succeeding cash crop, severely diminishing grain yield in semi-arid areas or in years with low precipitation (Meyer et al., 2019).
5 Conclusion
This synthesis-analysis offers a comprehensive understanding of nutrient and C characteristics of different CCs species grown in the Argentinean Pampas region, surpassing previous studies conducted in specific site-years. Grasses, except for ryegrass, accumulated high biomass and C, whereas vetch accumulated the highest nutrient content with the lowest C:nutrient ratios, and mixtures presented balanced characteristics. Our findings highlight the importance of selecting CCs species based on the intended ecosystem service. The information provided in this study is useful for predicting nutrient contributions from CCs to the succeeding crop and estimating the potential input of C to agroecosystems. Additional information on species such as ryegrass, cruciferous, and legumes other than vetch is limited, emphasizing the need to generate more data on these CCs.
Data availability statement
The original contributions presented in the study are included in the article/Supplementary Material, further inquiries can be directed to the corresponding authors.
Author contributions
FC and WC organized the database, performed the statistical analyses, and wrote the manuscript. All authors contributed to the article and approved the submitted version.
Funding
The author(s) declare financial support was received for the research, authorship, and/or publication of this article. This work was supported by Universidad Nacional de Mar del Plata (AGR694/23 and PI-inicial-2021) and Fondo para la Investigación Científica y Tecnológica (PICT 2019-00485).
Acknowledgments
We wish to thank Drs. G. Studdert and I. Rodríguez for their critical reading of the manuscript.
Conflict of interest
The authors declare that the research was conducted in the absence of any commercial or financial relationships that could be construed as a potential conflict of interest.
Publisher’s note
All claims expressed in this article are solely those of the authors and do not necessarily represent those of their affiliated organizations, or those of the publisher, the editors and the reviewers. Any product that may be evaluated in this article, or claim that may be made by its manufacturer, is not guaranteed or endorsed by the publisher.
Supplementary material
The Supplementary Material for this article can be found online at: https://www.frontiersin.org/articles/10.3389/fagro.2023.1244057/full#supplementary-material
References
Abdalla M., Hastings A., Cheng K., Yue Q., Chadwick D., Espenberg M., et al. (2019). A critical review of the impacts of cover crops on nitrogen leaching, net greenhouse gas balance and crop productivity. Global Change Biol. 25 (8), 2530–2543. doi: 10.1111/gcb.14644
Alfonso C., Barbieri P. A., Hernández M. D., Lewczuk N., Martínez J. P., Echarte M. M., et al. (2020). Water productivity in soybean following a cover crop in a humid environment. Agric. Water Manage. 232, 106045. doi: 10.1016/j.agwat.2020.106045
Alvarez C., Álvarez C. R., Alves B. J., Costantini A. O. (2022). Soil nitrous oxide emissions in a maize (Zea mays L.) crop in response to nitrogen fertilisation. Soil Res. 60 (8), 782–791. doi: 10.1071/SR21094
Alvarez R., Steinbach H. S., De Paepe J. (2014). A regional audit of nitrogen fluxes in pampean agroecosystems. Agric. Ecosyst. Environ. 184, 1–8. doi: 10.1016/j.agee.2013.11.003
Alvarez R., Steinbach H. S., De Paepe J. L. (2017). Cover crop effects on soils and subsequent crops in the pampas: A meta-analysis. Soil Tillage Res. 170, 53–65. doi: 10.1016/j.still.2017.03.005
Andrade F., Taboada M., Lema D., Maceira N., Echeverría H., Posse G., et al. (2017). Los desafíos de la agricultura Argentina. Satisfacer las futuras demandas y reducir el impacto ambiental (Argentina: INTA Ediciones).
Basche A. D., Miguez F. E., Kaspar T. C., Castellano M. J. (2014). Do cover crops increase or decrease nitrous oxide emissions? A meta-analysis. J. Soil Water Conserv. 69 (6), 471–482. doi: 10.2489/jswc.69.6.471
Beck H. E., Zimmermann N. E., McVicar T. R., Vergopolan N., Berg A., Wood E. F. (2018). Present and future Köppen-Geiger climate classification maps at 1-km resolution. Sci. Data 5 (1), 1–12. doi: 10.1038/sdata.2018.214
Berhongaray G., Alvarez R., De Paepe J., Caride C., Cantet R. (2013). Land use effects on soil carbon in the argentine pampas. Geoderma 192, 97–110. doi: 10.1016/j.geoderma.2012.07.016
Blanco-Canqui H., Ruis S. J. (2020). Cover crop impacts on soil physical properties: A review. Soil Sci. Soc Am. J. 84, 1527–1576. doi: 10.1002/saj2.20129
Blanco-Canqui H., Shaver T. M., Lindquist J. L., Shapiro C. A., Elmore R. W., Francis C. A., et al. (2015). Cover crops and ecosystem services: Insights from studies in temperate soils. Agron. J. 107 (6), 2449–2474. doi: 10.2134/agronj15.0086
Carciochi W. D., Crespo C., Eliceche M., Barbieri P. A. (2021a). Nitrogen and sulfur recycling and diagnostic in cover crop-maize systems. J. Soil Sci. Plant Nutr. 21, 801–812. doi: 10.1007/s42729-020-00402-y
Carciochi W. D., Massigoge I., Lapaz Olveira A., Reussi Calvo N. I., Cafaro La Menza F., Sainz Rozas H. R., et al. (2021b). Cover crop species can increase or decrease the fertilizer-nitrogen requirement in maize. Agron. J. 113, 5412–5423. doi: 10.1002/agj2.20791
Carciochi W. D., Wyngaard N., Divito G. A., Cabrera M. L., Reussi Calvo N. I., Echeverría H. E. (2018). A comparison of indexes to estimate corn S uptake and S mineralization in the field. Biol. Fertil. Soils 54, 349–362. doi: 10.1007/s00374-018-1266-9
Caviglia O., Andrade F. (2010). Sustainable intensification of agriculture in the Argentinean Pampas. Capture and use efficiency of environmental resources. Americas J. Plant Sci. Biotechnol. 3, 1–8.
Caviglia O., Sadras V., Andrade F. (2013). Modelling long-term effects of cropping intensification reveals increased water and radiation productivity in the South-eastern Pampas. Field Crops Res. 149, 300–311. doi: 10.1016/j.fcr.2013.05.003
Ciampitti I., van Versendaal E., Rybecky J. F., Lacasa J., Fernandez J., Makowski D., et al. (2022). A global dataset to parametrize critical nitrogen dilution curves for major crop species. Sci. Data 9, 1–11. doi: 10.1038/s41597-022-01395-2
Couëdel A., Alletto L., Tribouillois H., Justes É. (2018). Cover crop crucifer-legume mixtures provide effective nitrate catch crop and nitrogen green manure ecosystem services. Agric. Ecosyst. Environ. 254, 50–59. doi: 10.1016/j.agee.2017.11.017
Crespo C., Corral R. A., Diez S. N., Delgado S. G., Dominguez G. F., Agostini M. A., et al. (2022). Green bridge crops to manage corn nitrogen nutrition in the Southeastern Argentinean Pampas. Soil Tillage Res. 218, 105311. doi: 10.1016/j.still.2021.105311
Daryanto S., Fu B., Wang L., Jacinthe P. A., Zhao W. (2018). Quantitative synthesis on the ecosystem services of cover crops. Earth-Science Rev. 185, 357–373. doi: 10.1016/j.earscirev.2018.06.013
De Baets S., Poesen J., Meersmans J., Serlet L. (2011). Cover crops and their erosion-reducing effects during concentrated flow erosion. Catena 85, 237–244. doi: 10.1016/j.catena.2011.01.009
Duval M. E., Galantini J. A., Capurro J. E., Martinez J. M. (2016). Winter cover crops in soybean monoculture: Effects on soil organic carbon and its fractions. Soil Tillage Res. 161, 95–105. doi: 10.1016/j.still.2016.04.006
Enrico J. M., Piccinetti C. F., Barraco M. R., Agosti M. B., Eclesia R. P., Salvagiotti F. (2020). Biological nitrogen fixation in field pea and vetch: Response to inoculation and residual effect on maize in the Pampean region. Eur. J. Agron. 115. doi: 10.1016/j.eja.2020.126016
Eriksen J. (2008). Chapter 2 Soil Sulfur Cycling in Temperate Agricultural Systems. In: Advances in Agronomy (Academic Press). 102, 55–89. doi: 10.1016/S0065-2113(09)01002-5
Eriksen J., Thorup-Kristensen K., Askegaard M. (2004). Plant availability of catch crop sulfur following spring incorporation. J. Plant Nutr. Soil Sci. 167, 609–615. doi: 10.1002/jpln.200420415
Federov S. (2013) GetData graph digitizer. Available at: http://getdata-graph-digitizer.com/.
Finney D. M., Murrell E. G., White C. M., Baraibar B., Barbercheck M. E., Bradley B. A., et al. (2017). Ecosystem services and disservices are bundled in simple and diverse cover cropping systems. Agric. Environ. Lett. 2, 170033. doi: 10.2134/ael2017.09.0033
Finney D. M., White C. M., Kaye J. P. (2016). Biomass production and carbon/nitrogen ratio influence ecosystem services from cover crop mixtures. Agron. J. 108, 39–52. doi: 10.2134/agronj15.0182
Fox J., Weisberg S. (2011). An R companion to applied regression. 2nd ed (Thousand Oaks CA: Sage publications).
Frasier I., Noellemeyer E., Amiotti N., Quiroga A. (2017). Vetch-rye biculture is a sustainable alternative for enhanced nitrogen availability and low leaching losses in a no-till cover crop system. F. Crop Res. 214, 104–112. doi: 10.1016/j.fcr.2017.08.016
Gabriel J. L., Garrido A., Quemada M. (2013). Cover crops effect on farm benefits and nitrate leaching: Linking economic and environmental analysis. Agric. Syst. 121, 23–32. doi: 10.1016/j.agsy.2013.06.004
Halvin J. L., Beaton J. D., Tisdale S. L., Nelson W. (2005). Soil fertility and fertilizers: An introduction to nutrient management. 7th ed (New Jersey: Pearson Educational, Inc., Upper Saddle River).
Hayden Z. D., Ngouajio M., Brainard D. C. (2014). Rye-vetch mixture proportion tradeoffs: Cover crop productivity, nitrogen accumulation, and weed suppression. Agron. J. 106, 904–914. doi: 10.2134/agronj2013.0467
Jahanzad E., Barker A. V., Hashemi M., Eaton T., Sadeghpour A., Weis S. A. (2016). Nitrogen release dynamics and decomposition of buried and surface cover crop residues. Agron. J. 108 (4), 1735–1741. doi: 10.2134/agronj2016.01.0001
Jian J., Du X., Reiter M. S., Stewart R. D. (2020). A meta-analysis of global cropland soil carbon changes due to cover cropping. Soil Biol. Biochem. 143. doi: 10.1016/j.soilbio.2020.107735
Kang L., Fan B., Chen S., Chen Q. (2018). Fertigation combined with catch crop maximize vegetable yield and minimize N and P surplus. Nutrient Cycling Agroecosystems 112, 87–99. doi: 10.1007/s10705-018-9932-8
Ketterings Q. M., Swink S. N., Duiker S. W., Czymmek K. J., Beegle D. B., Cox W. J. (2015). Integrating cover crops for nitrogen management in corn systems on Northeastern U.S. dairies. Agron. J. 107, 1365–1376. doi: 10.2134/agronj14.0385
Larrea G., Wyngaard N., Eyherabide M., Calvo N. R., Puricelli M., Barbieri P., et al. (2023). Cation nutrient reserves decline markedly under intensive cropping of Pampas Mollisols. Catena 223, 106916. doi: 10.1016/j.catena.2023.106916
Lavado R. S., Taboada M. A. (2009). The Argentinean Pampas: A key region with a negative nutrient balance and soil degradation needs better nutrient management and conservation programs to sustain its future viability as a world agroresource. J. Soil Water Conserv. 64, 150–153. doi: 10.2489/jswc.64.5.150A
Lupwayi N. Z., Clayton G. W., O’Donovan J. T., Harker K. N., Turkington T. K., Soon Y. K. (2007). Phosphorus release during decomposition of crop residues under conventional and zero tillage. Soil Tillage Res. 95, 231–239. doi: 10.1016/j.still.2007.01.007
Meyer N., Bergez J. E., Constantin J., Justes E. (2019). Cover crops reduce water drainage in temperate climates: A meta-analysis. Agron. Sustain. Dev. 39. doi: 10.1007/s13593-018-0546-y
Mirsky S. B., Ackroyd V. J., Cordeau S., Curran W. S., Hashemi M., Reberg-Horton S. C., et al. (2017). Hairy vetch biomass across the eastern United States: Effects of latitude, seeding rate and date, and termination timing. Agron. J. 109, 1510–1519. doi: 10.2134/agronj2016.09.0556
Muhammad I., Sainju U. M., Zhao F., Khan A., Ghimire R., Fu X., et al. (2019). Regulation of soil CO2 and N2O emissions by cover crops: A meta-analysis. Soil Tillage Res. 192, 103–112. doi: 10.1016/j.still.2019.04.020
Murungu F. S., Chiduza C., Muchaonyerwa P., Mnkeni P. N. S. (2011). Decomposition, nitrogen and phosphorus mineralization from winter-grown cover crop residues and suitability for a smallholder farming system in South Africa. Nutr. Cycl. Agroecosystems 89, 115–123. doi: 10.1007/s10705-010-9381-5
Otte B., Mirsky S., Schomberg H., Davis B., Tully K. (2019). Effect of cover crop termination timing on pools and fluxes of inorganic nitrogen in no-till corn. Agron. J. 111 (6), 2832–2842. doi: 10.2134/agronj2018.10.0699
Petrasek M. R., Piñeiro G., Bonvecchi V. E., Yahdjian L. (2023). Are service crops an alternative for mitigating N2O emissions in soybean crops in the Argentinian Pampas? J. Environmental Quality 52 (2), 258–269. doi: 10.1002/jeq2.20445
Pinheiro J., Bates D., R Core Team. (2023). nlme: Linear and Nonlinear Mixed Effects Models. R package version 3.1-164. Available at: https://CRAN.R-project.org/package=nlme.
Pinto P., Fernández Long M. E., Piñeiro G. (2017). Including cover crops during fallow periods for increasing ecosystem services: Is it possible in croplands of Southern South America? Agric. Ecosyst. Environ. 248, 48–57. doi: 10.1016/j.agee.2017.07.028
Poffenbarger H. J., Mirsky S. B., Weil R. R., Maul J. E., Kramer M., Spargo J. T., et al. (2015). Biomass and nitrogen content of hairy vetch-cereal rye cover crop mixtures as influenced by species proportions. Agron. J. 107, 2069–2082. doi: 10.2134/agronj14.0462
R Core Team (2022) A language and environment for statistical computing. Available at: https://www.r-project.org/.
Restovich S. B., Andriulo A. E., Portela S. I. (2012). Introduction of cover crops in a maize-soybean rotation of the Humid Pampas: Effect on nitrogen and water dynamics. F. Crop Res. 128, 62–70. doi: 10.1016/j.fcr.2011.12.012
ReTAA (2022) Relevamiento de tecnología aplicada. Informe mensual N° 63: Fertilización 21/22. Available at: https://www.bolsadecereales.com/imagenes/retaa/2022-12/248-retaamensualn%C2%BA63-fertilizacion21.22.pdf.
ReTAA (2023) Relevamiento de tecnología aplicada. Informes y datos. Available at: https://www.bolsadecereales.com/tecnologia-informes.
Reussi Calvo N. I., Wyngaard N., Orcellet J., Sainz Rozas H. R., Echeverría H. E. (2018). Predicting field-apparent nitrogen mineralization from anaerobically incubated nitrogen. Soil Sci. Soc Am. J. 82, 502–508. doi: 10.2136/sssaj2017.11.0395
Rimski-Korsakov H., Alvarez C. R., Lavado R. S. (2015). Cover crops in the agricultural systems of the Argentine Pampas. J. Soil Water Conserv. 70, 134A–140A. doi: 10.2489/jswc.70.6.134A
Rinnofner T., Friedel J. K., De Kruijff R., Pietsch G., Freyer B. (2008). Effect of catch crops on N dynamics and following crops in organic farming. Agron. Sustain. Dev. 28, 551–558. doi: 10.1051/agro:2008028
Rubio G., Pereyra F. X., Taboada M. A. (2019). Soils of the Pampean Region. In: The Soils of Argentina. World Soils Book Series. Rubio, G., Lavado, R., Pereyra, F. (eds) (Cham: Springer). doi: 10.1007/978-3-319-76853-3_6
SAGyP (2023) Estimaciones agrícolas. Available at: https://www.magyp.gob.ar/sitio/areas/estimaciones/tableros/.
Sainz Rozas H. R., Echeverria H. E., Angelini H. P. (2011). Niveles de carbono orgánico y pH en suelos agrícolas de las regiones pampeana y extrapampeana Argentina. Ciencia del suelo 29 (1), 29–37.
Sainz Rozas H. R., Eyherabide M., Larrea G. E., Martinez Cuesta N., Angelini H. P., Reussi Calvo N. I., et al. (2019). “Relevamiento y determinación de propiedades químicas en suelos de aptitud agrícola de la región pampeana,” in Simposio de Fertilidad 2019, 8 y 9 de mayo de 2019. (Rosario, Santa Fe, Argentina: Fertilizar).
Schipanski M. E., Barbercheck M., Douglas M. R., Finney D. M., Haider K., Kaye J. P., et al. (2014). A framework for evaluating ecosystem services provided by cover crops in agroecosystems. Agric. Syst. 125, 12–22. doi: 10.1016/j.agsy.2013.11.004
Seitz D., Fischer L. M., Dechow R., Wiesmeier M., Don A. (2022). The potential of cover crops to increase soil organic carbon storage in German croplands. Plant Soil 488, 157–173. doi: 10.1007/s11104-022-05438-w
Sievers T., Cook R. L. (2018). Aboveground and root decomposition of cereal rye and hairy vetch cover crops. Soil Sci. Soc Am. J. 82, 147–155. doi: 10.2136/sssaj2017.05.0139
Thapa R., Poffenbarger H., Tully K. L., Ackroyd V. J., Kramer M., Mirsky S. B. (2018). Biomass production and nitrogen accumulation by hairy vetch–cereal rye mixtures: A meta-analysis. Agron. J. 110, 1197–1208. doi: 10.2134/agronj2017.09.0544
Thorup-Kristensen K., Magid J., Jensen L. S. (2003). Catch crops and green manures as biological tools in nitrogen management in temperate zones. Adv. Agronomy 79, 227–302. doi: 10.1016/S0065-2113(02)79005-6
Valkama E., Lemola R., Känkänen H., Turtola E. (2015). Meta-analysis of the effects of undersown catch crops on nitrogen leaching loss and grain yields in the Nordic countries. Agriculture Ecosyst. Environ. 203, 93–101. doi: 10.1016/j.agee.2015.01.023
Vangeli S., Restovich S., Posse G. (2022). Cover crop species affect N2O emissions at hotspot moments of summer crops. Front. Soil Sci. 2, 903387. doi: 10.3389/fsoil.2022.903387
Villarino S. H., Pinto P., Jackson R. B., Piñeiro G. (2021). Plant rhizodeposition: A key factor for soil organic matter formation in stable fractions. Sci. Adv. 7, 1–14. doi: 10.1126/sciadv.abd3176
Vincent-Caboud L., Casagrande M., David C., Ryan M. R., Silva E. M., Peigne J. (2019). Using mulch from cover crops to facilitate organic no-till soybean and maize production. A review. Agron. Sustain. Dev. 39. doi: 10.1007/s13593-019-0590-2
Keywords: cover crops, species, nitrogen, phosphorus, sulfur, carbon
Citation: Cafaro La Menza F and Carciochi WD (2023) Catch crops in the Argentinean Pampas: a synthesis-analysis on nutrient characteristics and their implications for a sustainable agriculture. Front. Agron. 5:1244057. doi: 10.3389/fagro.2023.1244057
Received: 14 July 2023; Accepted: 28 November 2023;
Published: 06 December 2023.
Edited by:
Paulo Sergio Pavinato, University of São Paulo, BrazilReviewed by:
Partson Mubvumba, United States Department of Agriculture, United StatesEmily C. Cooledge, Bangor University, United Kingdom
Tiago Tezotto, University of São Paulo, Brazil
Copyright © 2023 Cafaro La Menza and Carciochi. This is an open-access article distributed under the terms of the Creative Commons Attribution License (CC BY). The use, distribution or reproduction in other forums is permitted, provided the original author(s) and the copyright owner(s) are credited and that the original publication in this journal is cited, in accordance with accepted academic practice. No use, distribution or reproduction is permitted which does not comply with these terms.
*Correspondence: Francisco Cafaro La Menza, ZnJhbmNpc2NvLmNhZmFAZ21haWwuY29t; Walter Daniel Carciochi, d2FsdGVyY2FyY2lvY2hpQGhvdG1haWwuY29t