 Angelika Miriam Gabler1†Julia Gebhard2Marie-Christin Norwig1
 Bernadette Eberlein2Tilo Biedermann2
 Knut Brockow2
 Katharina Anne Scherf1,3*
- 1Leibniz-Institute for Food Systems Biology at the Technical University of Munich, Freising, Germany
- 2Department of Dermatology and Allergy Biederstein, TUM School of Medicine, Technical University of Munich (TUM), Munich, Germany
- 3Department of Bioactive and Functional Food Chemistry, Institute of Applied Biosciences, Karlsruhe Institute of Technology (KIT), Karlsruhe, Germany
Wheat-dependent exercise-induced anaphylaxis (WDEIA) is a cofactor-induced wheat allergy. Gluten proteins, especially ω5-gliadins, are known as major allergens, but partially hydrolyzed wheat proteins (HWPs) also play a role. Our study investigated the link between the molecular composition of gluten or HWP and allergenicity. Saline extracts of gluten (G), gluten with reduced content of ω5-gliadins (G-ω5), slightly treated HWPs (sHWPs), and extensively treated HWPs (eHWPs) were prepared as allergen test solutions and their allergenicity assessed using the skin prick test and basophil activation test (BAT) on twelve patients with WDEIA and ten controls. Complementary sodium dodecyl-sulfate polyacrylamide gel electrophoresis (SDS-PAGE), high-performance liquid chromatography (HPLC), and mass spectrometry (MS) analyses revealed that non-gluten proteins, mainly α-amylase/trypsin inhibitors (ATIs), were predominant in the allergen test solutions of G, G-ω5, and sHWPs. Only eHWPs contained gliadins and glutenins as major fraction. All allergen test solutions induced significantly higher %CD63+ basophils/anti-FcεRI ratios in patients compared with controls. BAT using sHWPs yielded 100% sensitivity and 83% specificity at optimal cut-off and may be useful as another tool in WDEIA diagnosis. Our findings indicate that non-gluten proteins carrying yet unidentified allergenic epitopes appear to be relevant in WDEIA. Further research is needed to clarify the role of nutritional ATIs in WDEIA and identify specific mechanisms of immune activation.
Introduction
Wheat-dependent exercise-induced anaphylaxis (WDEIA) is a cofactor-induced wheat allergy. It is generally considered to be rare. In Japanese adolescents, the prevalence of food-dependent exercise-induced anaphylaxis predominantly to wheat was 0.017%. However, as these patients tolerate wheat in the absence of association with cofactors, WDEIA may not be recognized in many patients and they are often given the diagnosis of idiopathic anaphylaxis instead (1–3).
Patients with WDEIA may react to intact gluten proteins and/or partially hydrolyzed wheat proteins (HWPs) (4–6). Besides others, Yokooji et al. and Hiragun et al. reported allergic reactions in patients with WDEIA to HWPs in facial soap (6, 7). HWPs are made of gluten subjected to chemical or enzymatic partial hydrolysis to obtain foaming and emulsifying properties for use in foods and cosmetics (6, 8, 9). Depending on the treatment, HWPs differ significantly from one another regarding their functional properties and molecular composition (8, 10–12). Partial hydrolysis may lead to exposure of pre-existent allergenic epitopes otherwise buried within protein aggregates or to the formation of new epitopes, e.g., through deamidation (6, 7). The increase in solubility of HWPs compared with native gluten also affects allergen passage through the skin or the small intestine (6, 7, 13).
About 80% of patients with WDEIA have specific IgE (sIgE) against ω5-gliadins, the major allergens in WDEIA (14), but sensitization to other wheat gluten proteins, such as high- and low-molecular-weight glutenin subunits (HMW-GS and LMW-GS) or α- and γ-gliadins has also been reported (15–20). Water- or salt-soluble non-gluten proteins, such as lipid-transfer proteins (LTPs) associated with baker's asthma, were also suggested to play a role in WDEIA (21–23). Pastorello et al. found sIgE against α-amylase/trypsin inhibitors (ATIs) in WDEIA patients' sera (24), but the role of nutritional non-gluten proteins as causative agents for WDEIA is currently underexplored.
Approaches to diagnose WDEIA include clinical history, skin prick test (SPT), measurement of sIgE against ω5-gliadins, and oral gluten challenge combined with cofactor as golden standard (4). Due to the risk of a serious anaphylactic reaction during the challenge tests, there is a need to establish alternatives. The in vitro basophil activation test (BAT) using well-defined allergen test solutions (ATSs) may be suitable, because basophil activation is directly related to the allergenicity of a test substance (25–28). The BAT is already used to diagnose and investigate IgE-mediated allergies, e.g., allergy against antibiotics (29) or bee and wasp venom (30). Schwager et al. evaluated the allergenic potential of natural and recombinant peanut oleosins using the BAT on peanut-allergic and peanut-sensitized patients in comparison with a control group. A complex cocktail of 12 antibodies was used to identify basophils. The activation marker of identified basophils was CD63 (31). The same group improved the BAT workflow for reliable results with a time saving approach to make it suitable for clinical routine. Inter alia, they compared the approach of Schwager et al. with a simplified approach using CD63 (activation marker) and CD203c and FcεRIα (identification markers). As they found no significant differences between the results of both strategies, they showed that the necessary simplification to make BAT applicable in clinical routine is possible and reliable. Furthermore, Behrends et al. used different peanut allergens in the BAT, such as oleosins and defensins, Der p 2, Bet v 1, Ara h 8, Ara h 14, and Ara h 15 (31, 32). One important aspect of both studies is the application of single peanut allergens in the BAT. These were either isolated and purified from raw and in-shell roasted peanuts or recombinantly expressed in Escherichia coli (31, 32). The robust and optimized BAT setup using these single allergens allowed the differentiation between peanut-allergic and peanut-sensitized individuals (32).
Mehlich et al. tested alpha-gal sensitized patients in comparison with healthy controls for their basophil reactivity to commercial alpha-gal allergens and pork kidney extract. Thereby, CCR3 was assessed as an identification marker and CD63 as an activation marker for basophils. Similar to the peanut-BAT, they were able to differentiate between patients with alpha-gal syndrome and asymptomatic alpha-gal sensitization within the sensitized patient group using BAT (33).
Chinuki et al. used the BAT to examine the allergenicity of a HWP product in 10 WDEIA patients. The HWP had been produced by acid hydrolysis, but further details on its molecular composition were not provided (5, 34).
We already demonstrated that BAT using CCR3 as identification marker and CD63 as activation marker for basophils allowed the discrimination of patients with WDEIA from controls. ATSs made from peptic hydrolysates of ω5-gliadins, HMW-GS and total gluten showed the best sensitivity and specificity at optimal cut-off (20). Although these three peptic hydrolysates work very well in BAT, one drawback of using those ATSs is that they cannot be easily prepared in routine clinical practice, because the procedure involves elaborate gluten fractionation and digestion (20).
Therefore, we aimed to provide aqueous ATS from gluten samples with different molecular properties that can be easily made for use in BAT. We included four ATSs to cover a wide range of variability in molecular composition. These ATSs were prepared as saline extracts from one representative sample of wheat gluten (G) and of slightly hydrolyzed wheat proteins (sHWPs) and extensively hydrolyzed wheat proteins (eHWPs) selected from our previous work (10). The fourth sample was produced from flour of wheat variety Pamier, a wheat/rye translocation line with an 89% lower content of ω5-gliadins (G-ω5; 2.40 mg/g), the main allergen in WDEIA, in comparison with representative gluten (G; 22.3 mg/g) (35). If G-ω5 truly induced lower allergenic responses, products made of this variety might be nutritionally beneficial for patients with WDEIA. We combined allergenicity assessment using SPT and BAT with the characterization of allergenic proteins in the ATS to identify which proteins are present in those saline ATSs.
Methods
Materials
Gluten and HWPs were from Hermann Kröner GmbH (Ibbenbüren, Germany), Tate & Lyle PLC (London, UK), and Manildra Group (Gladesville, Australia). G in the present study corresponds to G1, G-ω5 to G4, sHWP to HWP7, and eHWP to HWP3 (7). All reagents and chemicals were from Sigma Aldrich (Darmstadt, Germany), Merck (Darmstadt, Germany), Carl Roth (Karlsruhe, Germany), Honeywell (Offenbach, Germany), J. T. Baker (Arnhem, The Netherlands), and Fresenius Kabi Deutschland GmbH (Bad Homburg, Germany). Water was purified with an Arium 611VF water purification system (Sartorius, Goettingen, Germany). Pepsin (from porcine mucosa, 10 FIP U/mg), trypsin (from bovine pancreas, TPCK treated, 10.000 BAEE U/mg protein), α-chymotrypsin (from bovine pancreas, TLCK-treated, ≥40 U/mg protein), and thermolysin (from Geobacillus stearothermophilus, 30–175 U/mg protein) were purchased from Sigma Aldrich (Darmstadt, Germany) and Merck (Darmstadt, Germany).
Allergen Test Solutions
To prepare saline ATS for BAT, the sample (eHWP: 25 mg, sHWP: 100 mg, G: 100 mg, and G-ω5: 100 mg) was weighed into a 2 ml tube followed by addition of glass beads for better homogenization and 1 ml 0.9% isotonic NaCl solution. The suspension was homogenized by vortex mixing for 1 min, stirring for 20 min at room temperature, and ultrasonic treatment for 3 min. After centrifugation (2,300 × g, 15 min, 20°C), the supernatant was filtered (0.45 μm, regenerated cellulose, GE Healthcare, Chicago, IL, USA) and the protein/peptide concentrations measured at 205 nm by a micro volume UV/VIS spectrophotometer NanoDrop One (Thermo Fisher Scientific, Carlsbad, CA, USA). The ATS from eHWP was diluted 1:5 (v/v) with 0.9% isotonic NaCl solution to adjust protein/peptide concentrations of all ATS for BAT experiments.
Several supernatants of G, G-ω5, and sHWP were prepared, pooled, and lyophilized for ultra-performance liquid chromatography (UPLC)-TripleTOF-MS analysis. The lyophilized powder was carefully homogenized with mortar and pestle and weighed into 2 ml tubes (6 mg). eHWP was used directly (4 mg), because it was completely soluble in isotonic NaCl solution.
Study Population
Twelve patients with a clinical history of WDEIA based on positive oral food challenge (5 women, 7 men, 26–60 years, median age: 48 years) and 10 individuals without a history of any wheat-related disorder were included in the study as healthy controls (9 women, 1 male, 25–76 years, median age: 44 years). Five of the control subjects were atopic. Further details on the study population are reported in Gabler et al. (20). The study protocol was approved by the ethics committee of the Technical University of Munich and all participants gave written informed consent before being included in the study.
Skin Prick Test
Skin prick test was carried out on the forearm with gluten (G, G-ω5) and hydrolyzed wheat proteins (eHWPs and sHWPs). Histamine dihypochloride solution (10%) from ALK-Abello (Hørsholm, Denmark) served as a positive control and isotonic NaCl solution from Fresenius Kabi Deutschland GmbH (Bad Homburg, Germany) as a negative control. The SPT was defined as positive, when the wheal diameter caused by the tested substance was ≥3 mm larger than the diameter of the negative control (4).
Basophil Activation Test
Flow CAST (Bühlmann Laboratories AG, Schönenbuch, Switzerland) was used for quantitative determination of in vitro basophil activation, as described previously (20). Anti-FcεRI-mAb and N-formyl-methionyl-leucyl-phenylalanine were used as positive controls. Flow cytometry was performed using a FACSCalibur system (Becton-Dickinson Immunocytometry System, Heidelberg, Germany) with a 488 nm, 15 mW and a 635 nm, 10 mW argon laser. Basophils were gated as low side scatter CCR3/side scatterlow. CCR3 was used as identification marker for basophils and CD63 as basophil activation marker, labeled with anti-CCR3-phycoerythrin mAb and anti-CD63-fluorescein-isothiocyanate, respectively. BD CellQuest (Becton-Dickinson Immunocytometry System) was used to analyze the data. At least 450 basophils were counted per measurement (13, 28). The following BAT parameters were studied: basophil activation (%CD63+ basophils) expressed as percentage of basophil granulocytes expressing CD63 divided by the total number of counted basophil granulocytes per single measurement and %CD63+ basophils/anti-FcεRI ratio as quotient of the basophil activation (%CD63+ basophils) triggered by ATS and by the anti-FcεRI mAb as positive control (33).
Sodium Dodecyl-Sulfate Polyacrylamide Gel Electrophoresis
Sodium dodecyl-sulfate polyacrylamide gel electrophoresis was carried out according to Lagrain et al. (36). In brief, lyophilized ATS (G, G-ω5, sHWP) and eHWP (used directly, because of complete solubility in isotonic NaCl) were incubated with reducing extraction buffer for 12 h at room temperature, heated to 60°C for 10 min and centrifuged (5,000 × g, 20°C, 5 min). A homogeneous NuPAGE 10% polyacrylamide Bis-Tris gel (10 mm × 1 mm wells) (Invitrogen, Carlsbad, CA, USA) was used with a MOPS running buffer. The PageRuler Unstained Protein Ladder served as a molecular mass (Mr) standard (Thermo Fisher Scientific). The running time was 30 min at 200 V and 115 mA. Protein bands on the gel were fixed with 12% trichloroacetic acid (w/w) (30 min), stained with Coomassie blue (30 min) and destained in two steps. The gels were scanned using the Gel Doc EZ Imager (Bio-Rad Laboratories, Munich, Germany) and the Image Lab software (Bio-Rad Laboratories) (10, 37).
Gel Permeation HPLC
Two different gel permeation (GP)-HPLC systems, previously reported by Gabler at al. and Scherf et al. were used to analyze the Mr distribution of proteins and peptides in the ATS compared with protein markers of known Mr (10, 38). Measurements were performed on a Jasco HPLC Extrema (Jasco, Gross-Umstadt, Germany). A BioSep-SEC-s3000 column (300 mm × 4.6 mm, 29 nm, 5 μm, Phenomenex, Aschaffenburg, Germany) was used for protein separation with an isocratic gradient (50:50, 0.1% trifluoroacetic acid (TFA) in ultrapure water/0.1% TFA in acetonitrile) with a flow rate of 0.3 ml/min at 20°C. Chromatography was carried out on a BioBasic SEC-60 column (150 mm × 7.8 mm, 6 nm, 5 μm, Thermo Fisher Scientific) with an isocratic gradient (70:30, 0.1% TFA in ultrapure water/0.1% TFA in acetonitrile) at a flow rate of 1.0 ml/min for small proteins/peptides. The injection volume was 3–5 μl.
Reversed-Phase HPLC
The protein/peptide concentration of the ATS was analyzed according to Gabler et al. using reversed phase (RP-)HPLC on a Jasco XLC instrument (Jasco) using a C18 column at 60°C (Acclaim 300, C18, 2.1 mm × 150 mm, 300 nm, 3 μm, Thermo Fisher Scientific). The elution solvents were 0.1% TFA in ultrapure water (A) and 0.1% TFA in acetonitrile (B) at a flow rate of 0.2 ml/min. Gradient elution was performed: 0 min 0% B, 0.1–0.5 min 24% B, 0.6–15 min 56% B, 15.1–19.1 min 90% B, 19.2–35.0 min 0% B. The injection volume was 20 μl. Prolamin Working Group (PWG)-gliadin was used for external calibration (10, 39).
Ultra-Performance Liquid Chromatography (UPLC)-TripleTOF-MS
Reduction and Alkylation
Lyophilized ATS from G, G-ω5, and sHWP as well as eHWP were dissolved in 320 μl of TRIS-HCl buffer (0.5 mol/L, pH 8.5) and 320 μl 1-propanol. For reduction, 50 μl of Tris-(2-carboxyethyl)-phosphine (TCEP) solution (22 mg/ml TCEP in TRIS-HCl buffer) were added and the samples shaken for 30 min at 60°C under nitrogen. After cooling, 100 μl of chloroacetamide (CAA)-solution was added for alkylation (34 mg/ml CAA in TRIS-HCl buffer). The samples were shaken for 45 min at 37°C in the dark. The solutions were evaporated to dryness (37, 40).
Enzymatic Digestion
Different protein digestions were carried out: pepsin + trypsin (PT), pepsin + chymotrypsin (PC), pepsin + trypsin + chymotrypsin (PTC), trypsin + chymotrypsin (TC), and thermolysin (TLY). Digestion was performed by adding pepsin [750 μl, 0.2 mg/ml in 0.15 mol/L HCl, pH 2, enzyme/substrate (E:S) ratio of 1:20 (w/w)] to the alkylated residues and shaking for 60 min at 37°C. After the peptic digest, the pH was adjusted to 6.5 with PBS (50 mmol/L). Then, trypsin and/or chymotrypsin [E:S of 1:20 for T or C, E:S of 1:40 for TC (w/w)] were added and the samples were hydrolyzed for 120 min at 37°C. For TC digestion, TC was added to the alkylated residues [1 ml, 0.12 mg/ml T/C in 0.1 mol/L TRIS-HCl-buffer, E:S of 1:50 (w/w)] followed by incubation for 16 h at 37°C. The digestions were stopped by heating for 10 min at 95°C (37, 40). TLY digestion [E:S of 1:20 (w/w)] was carried out in TRIS-HCl CaCl2 buffer (0.2 mol/L TRIS, 0.5 mmol/L CaCl2· 2H2O, pH 6.5) at 37°C for 16 h. The reaction was stopped with formic acid (FA) (41–43).
Solid Phase Extraction
Enzymatic digests were purified by solid phase extraction (SPE) using 100 mg Discovery DSC-18 cartridges (Supelco, Bellefonte, PA, USA). After activation with methanol, equilibration with 80/20 (v/v) acetonitrile 0.1% FA in water and washing with 2/98 (v/v) acetonitrile/0.1% FA the cartridges were loaded with sample and washed again. Elution was carried out using 40/60 (v/v) acetonitrile/0.1% FA in the first step and 80/20 (v/v) acetonitrile/0.1% FA in the second. Both eluates were united and evaporated to dryness. The residues were dissolved in 500 μl 0.1% FA and filtered immediately before UPLC-TripleTOF-MS analysis (40, 44).
UPLC-TripleTOF-MS
The UPLC-TripleTOF-MS analysis was performed using an UPLC system ExionLC coupled to a TripleTOF 6600 MS (SCIEX, Darmstadt, Germany). A bioZen peptide PS-C18 column (100 mm × 2.1 mm, 10 nm, 1.6 μm) (Phenomenex) was used. Peptides (injection volume 10 μl) were separated using linear gradient elution (0–65 min 5% B to 100% B, 65–69 min 100% B, 69–70 min 100% B to 5% B, 70–75 min 5% B; solvent A: 0.1% FA in water, solvent B: 0.1% FA in acetonitrile) with a flow rate of 0.35 ml/min at 40°C. The MS was operated in positive electrospray ionization mode and the following settings: ion spray voltage 5,500 eV, source temperature 550°C, heating gas 0.45 MPa, nebulizing gas 0.38 MPa, curtain gas 0.24 MPa.
The MS was operated in information-dependent acquisition (IDA) mode. The mass-to-charge range for MS1 was 350–1,800, using an accumulation time of 250 ms, collision energy of 10 V, and a declustering potential of 80 V. The IDA criteria for the precursor ion included intensity of >100 counts/s and the resolution was set to 0.5 Da. MS2 spectra of the 20 most abundant compounds were recorded in a mass-to-charge range of 350–1,800, using an accumulation time of 40 ms, collision energy of 35 V, declustering potential of 80 V, and a collision energy spread of 5 V. Instrument control and data acquisition were performed with Analyst TF software (v 1.7.1., SCIEX).
Analysis of UPLC-TripleTOF-MS Data
The raw data were analyzed against the proteome of Triticum aestivum (UniprotKB, download 08/2019) using the proteomics software MaxQuant (version 1.6.3.4) (45). The search parameters including specific and unspecific digestion are reported in Supplementary Table 1. All other parameters were kept as default settings. The intensity based absolute quantitation (iBAQ) algorithm implemented in MaxQuant was used to estimate wheat protein abundances in the ATS. A total sum normalization of protein iBAQ intensities between sample measurements was performed to correct for different total protein injection amounts (37, 40).
Statistical Analysis
A statistical analysis was performed with Origin 2020 (OriginLab Cooperation, Northampton, MA, USA) and SigmaPlot 14 (Systat Software GmbH, Erkrath, Germany). One-way ANOVA with Dunn's post-hoc test (p < 0.05) was used to identify significant differences between the ATS analyzed by HPLC, SPT, and BAT. Receiver operating characteristic (ROC) analyses were carried out to estimate how well BAT parameters, such as area under the ROC curve (AUC) distinguished between patients and controls. The optimized discrimination threshold (cut-off) for the %CD63+ basophils/anti-FcεRI ratio was determined based on the ROC curve for best selectivity and specificity.
Results
Allergenicity of Gluten and HWP for Patients With WDEIA
Skin Prick Test
As expected, all patients with WDEIA showed sensitizations to the positive control (wheal and erythema mean diameter (W/E): 5.8 and 13.4 mm), but none to the negative control (0 mm). A positive reaction was triggered in all patients with WDEIA for G (W/E 6.1 and 15.4 mm), in 11 of 12 patients for sHWP (W/E 5.8 and 13.7 mm), in 10 of 12 patients for G-ω5 (W/E 3.8 and 7.0 mm), and in 9 of 12 patients for eHWP (W/E 6.2 and 11.1 mm) (Figure 1 and Supplementary Table 2). Large interindividual differences were observed that resulted in wide ranges of minimal and maximal diameter for each substance, ranging from 0.5 to 16.5 mm for W and from 2.0 to 31.0 mm for E overall. There were no significant differences (p > 0.05) in mean wheal diameter between the four substances, even if G, sHWP, and eHWP triggered wheals that were comparable in size with those of the positive control and about 60% larger compared with G-ω5. The mean erythema diameter caused by G, sHWP, and eHWP was also similar to that of the positive control. The erythema following SPT with G was significantly higher (p < 0.05) than that with G-ω5, but all other pairwise comparisons were not significantly different from one another.
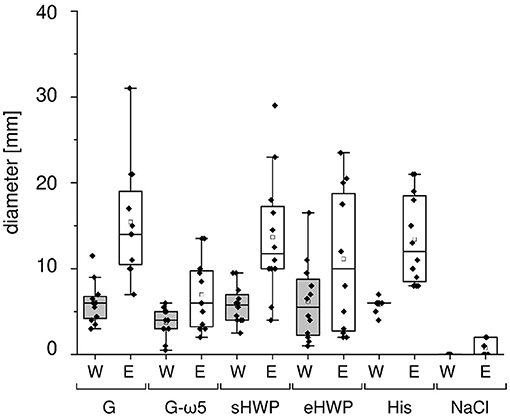
Figure 1. Skin prick test results of patients with wheat-dependent exercise-induced anaphylaxis. Allergen test solutions from gluten G and G-ω5 and from slightly and extensively hydrolyzed wheat proteins sHWP and eHWP were used, as well as histamine dihypochloride (10%) solution (His) as positive control and isotonic sodium chloride solution as negative control (NaCl). The diameter of the wheals (W) and erythema (E) were documented in mm. A double determination was performed for each patient (n = 2), except patient 4 (n = 1). The data for gluten G were added for comparison and were already reported in Gabler et al. (20).
Basophil Activation
All ATS for gluten and HWP induced basophil activation in the blood of patients with WDEIA, except for p5, p7, and p8 (Figure 2 and Supplementary Figures 1–8). As already observed in the SPT, the responses were highly individual, e.g., with blood from patients p1 and p6 showing the highest basophil activation for eHWP, p9 for sHWP and eHWP, and p11 for G and G-ω5. Contrary to expectations, G-ω5 did not lead to lower basophil activation in comparison with G in general. The basophil activations (%CD63+ basophils) of patients were in a range between 0.2 and 63.0% (median: 9.4%) for G, 0.6–82.6% (median: 11.6%) for G-ω5, 0.4–72.7% (median: 8.2%) for eHWP, and 2.2–80.0% (median: 23.1%) for sHWP. Significant differences in %CD63+ basophils between patients and controls were found for sHWP (p < 0.05), but not for G, G-ω5, and eHWP. In contrast, patients showed significantly higher %CD63+ basophils/anti-FcεRI ratios compared with controls with all ATS (p < 0.05) (Figure 3). Consequently, the %CD63+ basophils/anti-FcεRI ratio was used as characteristic parameter for further investigations.
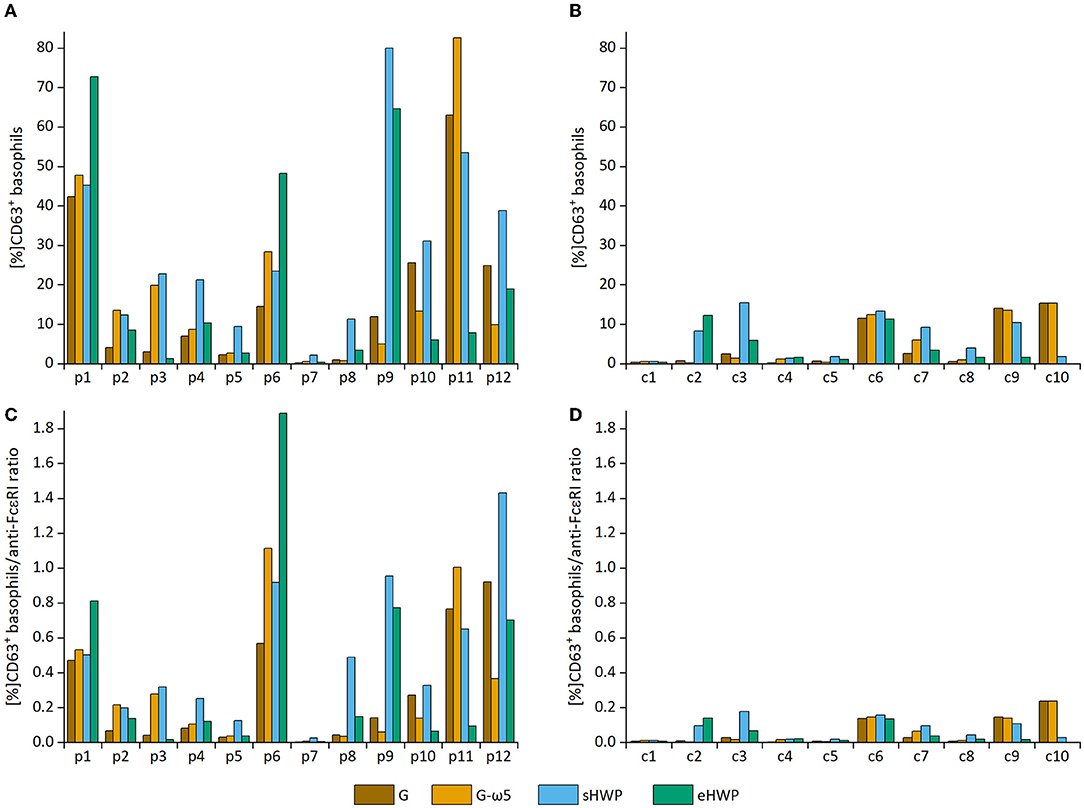
Figure 2. Basophil activation in individual patients and controls. Allergen test solutions from gluten G and G-ω5 and from slightly hydrolyzed wheat proteins (sHWPs) and extensively hydrolyzed wheat proteins (eHWP) were used. (A) %CD63+ basophils from patients p1–p12, (B) %CD63+ basophils from controls c1–c10, (C) %CD63+ basophils/anti-FcεRI ratio from patients p1–p12, (D) %CD63+ basophils/anti-FcεRI ratio from controls c1–c10.
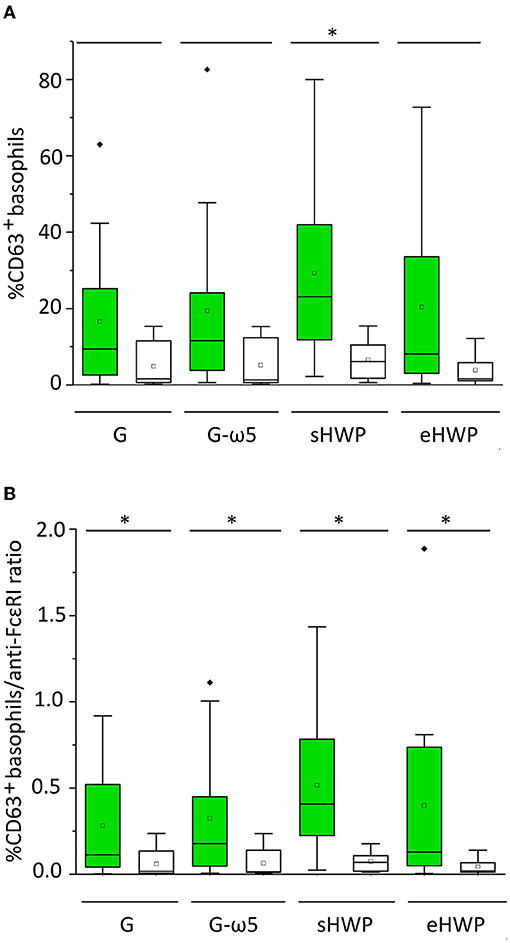
Figure 3. Basophil activation in patients (green) and controls (white). Allergen test solutions from gluten G and G-ω5 and from sHWPs and eHWPs were used. (A) %CD63+ basophils, (B) %CD63+ basophils/anti-FcεRI ratio. Significant differences between patients and controls are indicated by asterisks (one-way ANOVA, Dunn's post-hoc test, p < 0.05). There were no significant differences between patients' reactivity to different ATS. Diamonds indicate individual outliers outside the first or third quartiles. Squares represent the mean and lines the median. Whiskers mark the 1.5 interquartile range. The box corresponds to the range in which the middle 50% of the data are located.
There were no significant differences (p > 0.05) in patient %CD63+ basophils/anti-FcεRI ratios between the four different ATS (median G = 0.113, G-ω5 = 0.178, eHWP = 0.130, and sHWP = 0.408), inter alia, due to high interindividual variability. The %CD63+ basophils/anti-FcεRI ratios were low for all ATS in controls (median: G: 0.018, G-ω5: 0.016, eHWP: 0.069, and sHWP: 0.019). The ROC curves generated for all ATS from the %CD63+basophils/anti-FcεRI ratio of patients and controls revealed that BAT with sHWP gave the highest AUC (0.925) with excellent sensitivity (100%) and specificity (83%) to discriminate between patients with WDEIA and controls (Supplementary Figure 9 and Supplementary Table 3).
Identification of Allergenic Proteins in the Test Solutions
Sodium Dodecyl-Sulfate Polyacrylamide Gel Electrophoresis
In SDS-PAGE, all protein bands from the ATS had Mr below or equal to 60 kDa (Figure 4). The lack of larger and hydrophobic proteins, such as HMW-GS was expected, because the ATSs were aqueous extracts of G, G-ω5, and sHWP or were completely soluble in water as in case of eHWP. The band pattern of G and G-ω5 was similar with bands at 60, 57, 47, and 37 kDa and three additional ones at 52, 40, and 27–24 kDa for G-ω5. Bands with Mr about 60 kDa typically belong to ω-gliadins and the additional band at 52 kDa in G-ω5 is likely to be from ω-secalins. The other bands in the range from 37 to 47 kDa can be assigned to gliadins and LMW-GS (46). While eHWP showed a weak and blurred band at 20–27 kDa and its main band at 10–16 kDa, sHWP had only one band at 10–16 kDa. This indicates that proteins were degraded through hydrolysis in sHWP and eHWP. The most intense protein band in all ATSs was at Mr 10–16 kDa and this range corresponds to non-gluten proteins of the water-/salt-soluble albumin/globulin fraction, such as grain softness proteins, puroindolines, purothionins (Tri a 37), non-specific lipid-transfer protein (Tri a 14), and ATIs (Tri a 15, Tri a 28, Tri a 29, Tri a 30, and Tri a 40), many of them already known as allergens (47).
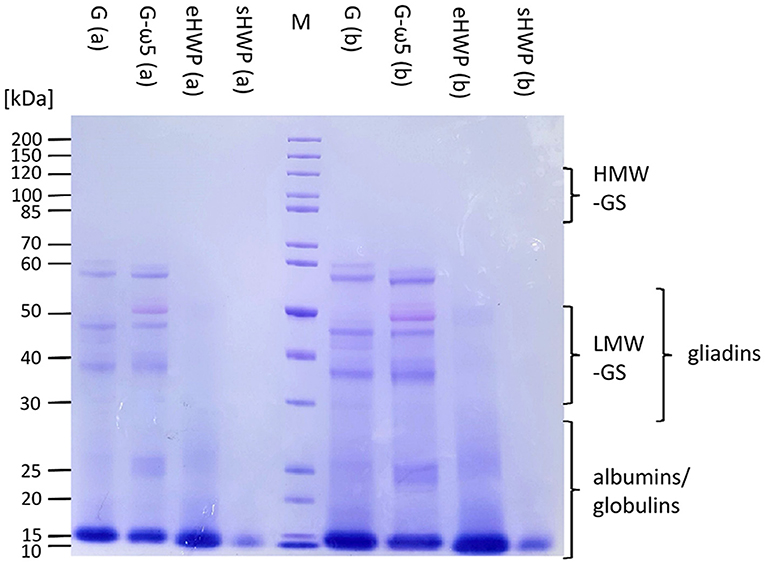
Figure 4. Sodium dodecyl-sulfate polyacrylamide gel electrophoresis (SDS-PAGE) of allergen test solutions. Gluten G and G-ω5 as well as sHWPs and eHWPs were analyzed. Protein marker (M) 3.5 μg, samples 5.3 μg (a), and 15.0 μg (b). HMW-GS, high-molecular-weight glutenin subunits, LMW-GS, low-molecular-weight glutenin subunits. The albumin/globulin fraction may consist of, e.g., grain softness proteins, puroindolines, purothionins (Tri a 37), non-specific lipid-transfer protein (Tri a 14), and amylase/trypsin-inhibitors (Tri a 15, Tri a 28, Tri a 29, Tri a 30, and Tri a 40) (40).
High-Performance Liquid Chromatography
Gel permeation- and RP-HPLC analyses were carried out to obtain further information complementary to SDS-PAGE on the Mr distribution of the proteins in the ATS and their hydrophobicity profile. Both GP-HPLC systems showed that there were high percentages of proteins with Mr of about 14 kDa present in the ATS (Figure 5). More than 68% of all proteins in the four ATS had a Mr about or below 14 kDa, according to system I suitable for a Mr range from <14 to 200 kDa (G: 81.9%, G-ω5: 68.3%, sHWP: 84.4%, and eHWP: 92.2%) (Supplementary Figure 10). System II suitable for a Mr range from <2 to ≥ 14 kDa confirmed that over 75% of proteins in the ATS had a Mr about 14 kDa (G: 85.6%, G-ω5: 91.5%, sHWP: 83.3%, and eHWP: 75.7%) (Supplementary Figure 11). These results corresponded well to the protein band pattern on the SDS-PAGE gel.
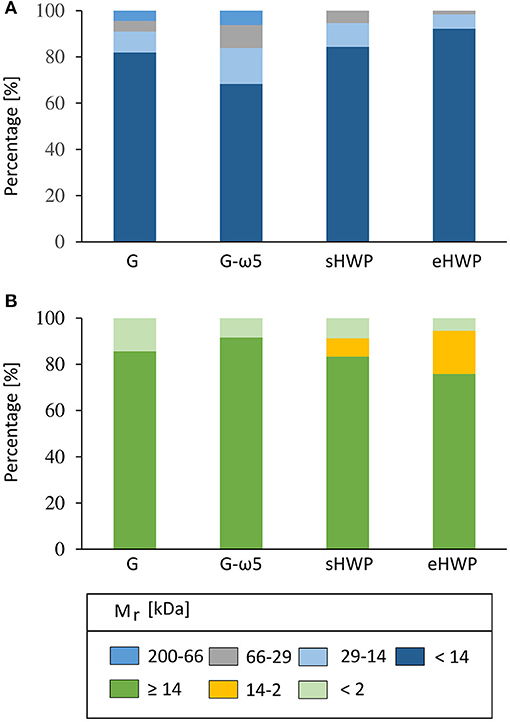
Figure 5. Gel-permeation high-performance liquid chromatography (GP-HPLC). Relative molecular mass distribution (Mr) [%] of the allergen test solutions from gluten G and G-ω5 and from sHWPs and eHWPs. Areas within each fraction were set by marker substances. Two different systems were used. (A) 1: 200–66 kDa; 2: 66–29 kDa; 3: 29–14 kDa; 4: <14 kDa. GP-HPLC; (B) 1: ≥14 kDa; 2: 14–2 kDa; 3: <2 kDa.
The RP-HPLC chromatograms of the G and G-ω5 ATS showed the typical hydrophobicity profile of the albumin/globulin fraction. In contrast, the peaks in the chromatograms of sHWP and eHWP could not be clearly assigned to any reference chromatogram of intact wheat proteins, again indicating protein degradation (Supplementary Figure 12). The protein concentrations of the ATS used for the BAT experiments determined by RP-HPLC were 2.10 mg/ml (G), 2.05 mg/ml (G-ω5), 3.96 mg/ml (sHWP), and 3.00 mg/ml (eHWP). Higher protein concentrations were not achievable with this preparation procedure for G, G-ω5, and sHWP, because of limited solubility. The concentration range of the four ATS, in which the allergenic basophil activation was triggered, was not directly comparable between the ATS. The concentrations were not set in a specific range, but resulted from preliminary tests, which were primarily intended to exclude non-specific activations in the control group while triggering specific activations in patients.
Proteomics-Based Untargeted Liquid-Chromatography Mass Spectrometry of the ATS
While SDS-PAGE and HPLC already provided valuable information on the identities of the proteins in the ATS, untargeted UPLC-TripleTOF-MS of different enzymatic digests of the ATS was performed to identify the specific proteins in the ATS and their proportions. Different enzyme combinations were used to maximize protein identifications and avoid bias, because gluten proteins, and especially ω5-gliadins, are known to be resistant to cleavage with P, T, or C (40). Of the PT, TC, PTC, PC, and TLY digestions used (Figure 6 and Supplementary Figure 13), PT turned out to be the most suitable, because percentages of identified proteins in the ATS were the highest in comparison with other digestions. Consequently, the peptides and corresponding proteins identified in the ATS after PT digestion are reported in Supplementary Tables 4–11, using both specific and unspecific digestion mode for data evaluation.
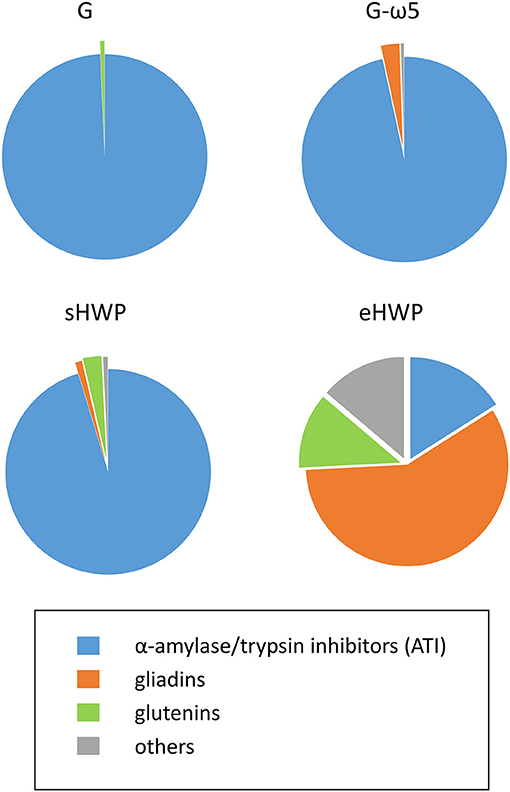
Figure 6. Percentages of protein groups in allergen test solutions. Groups include α-amylase/trypsin inhibitors (ATI, blue), gliadins (orange), glutenins (green), and others (gray) in allergen test solutions from gluten G and G-ω5 and from sHWPs and eHWPs. Percentages were determined using the intensity based absolute quantitation (iBAQ) algorithm with ultra-performance liquid chromatography (UPLC)-TripleTOF-MS data (protein score > 40) in specific digestion mode (pepsin + trypsin). Details on specific proteins are available in Supplementary Tables 4–11.
The identified proteins in the ATS made from gluten samples G and G-ω5 contained 96.6 and 99.3% of ATIs, such as ATI-types CM1, CM2, CM3, CM16, 0.28, and 0.53 in G and CM2, CM3, CM16, and 0.19 in G-ω5. ATIs are soluble in aqueous salt solutions whereas gluten, by definition, remains mostly insoluble. Therefore, it appears reasonable that ATIs were enriched during ATS preparation with isotonic NaCl solution. Small proportions of LMW-GS and α-gliadins were present in G, as well as α- and ω-gliadins in G-ω5.
The solubility of sHWP in aqueous solutions was comparable with that of gluten samples (10) as was the composition of the ATS. It consisted of 88.8% of ATIs, such as ATI-types CM1, CM2, CM3, CM16, 0.19, and 0.28, as well as a slightly higher proportion of 3.7% of gluten proteins (LMW-GS, gliadins) compared with G and G-ω5. In contrast, eHWP contained 70.2% of gluten proteins, with 58.2% gliadins (α-, β-, γ-gliadins) and 12.0% glutenins (LMW-GS). This difference can be explained by the fact that eHWP was strongly hydrolyzed and completely soluble in aqueous solutions. ATIs (CM1 and CM3) only represented 16.0% of proteins in eHWP and the remaining 13.8% were other proteins, such as enzymes and uncharacterized proteins. The investigations using TC, PTC, PC, and TLY digestions showed some variation in protein composition compared with the PT digestion, but the overall picture of identified protein groups in the ATS was similar (Supplementary Figure 13).
The sequences of the identified proteins in the ATS were analyzed for known WDEIA epitopes (15, 48, 49). Only the epitope QQPGQ was identified two times in an ω-gliadin (Uniprot accession: C0KEH9) present in G-ω5. All other identified proteins in the ATS contained none of the known WDEIA epitopes.
Discussion
We expected to see differences in allergenicity to patients with WDEIA between G and G-ω5, because G-ω5 was gluten from a wheat/rye-translocation line (35) that contains a significantly lower amount of ω5-gliadins. SPT results showed that wheal and erythema diameters caused by G-ω5 were the lowest compared with other substances, but the differences were not significant except for the comparison of erythema diameter between G and G-ω5. However, the BAT %CD63+ basophils/anti-FcεRI ratio was similar for G and G-ω5 with almost identical median values and ranges, as were all parameters derived from the ROC curves. It was reasonable to assume that gluten with a significantly lower ω5-gliadin content would trigger lower basophil activations in patients than representative gluten, since ω5-gliadins are considered to be the main allergen of WDEIA (14). In several cases, it appeared as if even the opposite was the case, because stronger basophil activities occurred for G-ω5 in comparison to G in p1, p2, p3, p4, p6, and p11. These results indicate that other allergenic proteins need to be relevant and present in the ATS.
Altenbach et al. used transgenic wheat with reduced content of ω5-gliadins and assessed its allergenicity in sera of eleven patients with WDEIA using a two-dimensional immunoblot analysis. Seven out of eleven patients showed reduced levels of immunoglobulin E (IgE) reactivity to ω5-gliadins using transgenic wheat, but the same sera showed IgE reactivities to other gluten proteins at the same time. Additionally, sera from three patients generally had the highest IgE reactivity not to ω5-gliadins, but to HMW-GS, α-gliadins, and non-gluten proteins. They concluded that this transgenic wheat line was not beneficial for the nutrition of patients with WDEIA because of the complexity of the immune response in the participating patients with WDEIA. Without knowing to which wheat protein groups, a patient with WDEIA is sensitized, it is too risky overall to consume transgenic wheat. Even if the ω5-gliadin content is reduced therein, other wheat proteins were shown to trigger IgE reactivity in patients with WDEIA (50). Our findings support their conclusion and still leave a wheat-free diet and/or avoidance of cofactors as the only safe option for patients with WDEIA. Further, the identified proteins in ATS from G and G-ω5 both contained over 96% of ATIs (non-gluten proteins) and only very low proportions of gliadins, so that a potential difference in ω5-gliadin content was most likely negligible.
We expected to find LTPs in the aqueous ATS, as they are known to be soluble and to cause basophil activity in patients. Pastorello et al. described three cases of exercise-food challenge confirmed patients with WDEIA. They identified a 9 kDa LTP as the allergenic protein in these patients by immunoblotting. Simultaneously, these patients showed no reactivity to the gliadin and glutenin fractions (23). The protein band of the albumin/globulin fraction (10–15 kDa) of G-ω5 and sHWP in the SDS-PAGE gel of the lyophilized ATS suggested that LTPs may be present. However, no LTPs were identified with the proteomics UPLC-TripleTOF-MS approach (PT-digestion), but high percentages of ATIs. In our previous study, the same WDEIA patient cohort was tested for sIgE against LTP. All patients showed negative results (<0.1 KU/L; LTP/Tri a 14) (20).
Based on the heterogeneous molecular properties of sHWP and eHWP, we expected differences among the parameters investigated, but we did not find any significant differences in SPT or CD63+ basophils/anti-FcεRI ratio. The only parameters that differed were those derived from the ROC curves indicating that sHWP yielded higher sensitivity/specificity (100%/83%) compared with eHWP (75%/70%) to discriminate between patients and controls. Due to a lack of studies so far, it remains unclear how degree and type of protein hydrolysis affect the allergenicity of gluten in WDEIA. Hydrolysis to a certain degree may increase the allergenicity by exposing epitopes or generating new ones (6, 7, 51). Beyond that degree, continued hydrolysis is expected to decrease allergenicity, because epitopes are degraded.
Neither SPT nor BAT revealed clear differences between gluten samples (G, G-ω5) and HWP (sHWP, eHWP) in terms of allergenicity. SDS-PAGE and GP-HPLC revealed that all ATS contained high percentages of proteins with Mr 10–16 kDa (SDS-PAGE) and about 14 kDa (GP-HPLC). UPLC-TripleTOF-MS analysis showed that high percentages of ATIs were present and their Mr correspond exactly to this mass range. These findings raise the question, whether ATIs are implicated not only in baker's asthma, but also in WDEIA. Until now, the main focus was on gluten proteins, such as ω5-gliadins and HMW-GS as major WDEIA allergens (19, 48, 52), though there are reports that ATIs may also play a role in WDEIA (24). IgE immunoblotting with patients' sera showed reactions to ATIs present in wheat protein fractions and ATI-types CM1, CM3, CM16, and 0.19 were identified in the allergenic fraction (24), similar to our results.
The sequences of all identified proteins in the ATS were analyzed for known WDEIA epitopes (15, 48, 49). Only one known epitope (QQPGQ) was identified, indicating that other epitopes appear to be relevant in WDEIA which are currently unknown. Western blotting using patient samples can be used in further studies to support their identification.
Sandiford et al. and Battais et al. reported possible cross-reactive epitopes between gliadins and ATIs (53, 54). Pastorello et al. used wheat flour within their study, which naturally contains ATIs, whereas we used gluten. By definition, gluten is poorly soluble in water and salt solutions, but residues of the soluble albumin/globulin fraction still remain in the gluten polymer, even after extensive washing to remove starch and other flour constituents (38, 55).
Besides ATIs, small percentages of gliadins and/or LMW-GS were present in the ATS from G, G-ω5, and sHWP. Overall, these three ATS showed a high degree of similarity regarding protein composition and solubility, again confirming that sHWP was only slightly hydrolyzed.
The basophil activation triggered by eHWP was according to expectations, because over 70% of proteins were gliadins and glutenins, but rendered soluble due to more extensive hydrolysis compared with sHWP. As gluten proteins are already known as relevant allergens in WDEIA, basophil activation in patients was anticipated (4, 48). Chinuki et al. reported a HWP product in soap, which was produced by acid hydrolysis and triggered allergic reactions in patients with WDEIA (5, 19). Apparently the degree of hydrolysis was enough to solubilize all wheat proteins in water, but not enough to significantly destroy allergenic epitopes in eHWP.
The %CD63+ basophils/anti-FcεRI ratio was identified as an appropriate BAT parameter to differentiate reactivity to ATS between patients with WDEIA and control subjects. The discriminability estimated from the AUC of each ROC curve varied between gluten samples and HWP, with the best results for sHWP (AUC ROC: 0.925). Specificity (83%) and sensitivity (100%) of %CD63+ basophils/anti-FcεRI ratio using sHWP at optimal cut-off were very good. Another advantage is that ATS preparation was easy and fast and did not require complex extractions or enzymatic digestions, as in the case of gluten isolates (20, 34, 55). We found no correlations between BAT results (CD63+ basophils, %CD63+ basophils/anti-FcεRI ratio), diameter of wheals and erythema in SPT, sIgE, or disease severity. This is understandable regarding the levels of sIgE, because only clinical routine IgE determination for WDEIA was available. As mainly ATIs were identified in the ATS (G, G-ω5, and sHWP), the allergic reactions to these are found here and those did not appear to be related to sIgE against wheat flour, gluten, gliadin, ω5-gliadin, or LTP. Further insights into possible correlations between BAT and sIgE levels could be gained by measurements of sIgE against ATI types. One possible reason for the lack of correlation between BAT results and disease severity may be that basophil granulocytes are only one part of the whole allergic reaction that has many other influencing factors (e.g., mast cells) (56).
Three of the twelve patients (p5, p7, and p8) showed low basophil activations to G, G-ω5, sHWP, and eHWP in general. P8 showed low basophil activations to the ATS assessed here, but showed a high reactivity to ω5-gliadins in our previous study (20). Patients p5 and p7 had low basophil reactions in the present and in our previous study (20). The IgE positive control showed a basophil activation in both cases, but the basophil granulocytes did not react to the allergens tested in either case. The exact reasons remain unclear at this point in time, but warrant further investigations.
In our previous study, we investigated the basophil activity to isolated ω5-gliadins in the context of WDEIA with the same patients and controls as in the present study. The BAT parameter %CD63+ basophils was identified as the best parameter in this case to differentiate between patients and controls. Thereby, the ATS from isolated ω5-gliadins showed a test sensitivity of 100%, a specificity of 90%, and an AUC ROC of 0.975 at a concentration of 4 mg/ml (20). In comparison with G, G-ω5, and eHWP, the results for ω5-gliadins were better, but comparable with sHWP (sensitivity 100%, specificity 83%, and AUC ROC 0.925). As we identified high amounts of ATI in the ATS of sHWP, this underlines the result of the present study, that non-gluten proteins carrying yet unidentified allergenic epitopes appear to be relevant in WDEIA.
One acknowledged limitation of our study is the comparatively small number of patients with WDEIA and controls. The main reason is that the prevalence of WDEIA is very low overall and the participants were only recruited from the surrounding area of one specialized center. Our main intent was to identify the causative proteins in the ATS first, before we continue studies with more patients with WDEIA from several centers.
In conclusion, we found differences in allergenicity of gluten and HWP samples with varying molecular composition in individual patients with WDEIA using SPT and BAT. The %CD63+ basophils/anti-FcεRI ratio was the most promising parameter to distinguish patients from controls. The procedure to prepare ATS from sHWP is easy and can be performed even in routine clinical practice to help establish BAT as another option to complement the WDEIA diagnosis. Since the ATS made of G, G-ω5, and sHWP predominantly contained ATIs and only small concentrations of gluten proteins, more research is needed to clarify the role of non-gluten proteins in WDEIA and identify specific mechanisms of immune activation.
Data Availability Statement
The original contributions presented in the study are included in the article/Supplementary Material, further inquiries can be directed to the corresponding author/s.
Ethics Statement
The studies involving human participants were reviewed and approved by Ethics Committee, Technical University of Munich. The patients/participants provided their written informed consent to participate in this study.
Authors Contributions
AG, JG, M-CN, BE, TB, KS, and KB: conceptualization. AG, JG, and M-CN: formal analysis, investigation, and methodology. AG, JG, and BE: data curation. BE, TB, KS, and KB: funding acquisition, resources, and supervision. AG: visualization and writing—original draft. JG, M-CN, BE, TB, KS, and KB: writing—review and editing. All authors read and approved the final manuscript.
Funding
This work was supported by the authors' institutes, by research and development grants from the German Federal Ministry of Education and Research (BMBF), project ABROGATE (funding number: 01EA2106A), and the Deutsche Forschungsgemeinschaft (DFG; German Research Foundation) CRC 1371 P06; bilateral funding from Luxembourg National Research Fund (FNR) project C17/BM/11656090—DFG DACH-Lead-Agency BI696/12-1.
Conflict of Interest
BE received methodological and technical support from Bühlmann Laboratories AG (Schönenbuch, Switzerland).
The remaining authors declare that the research was conducted in the absence of any commercial or financial relationships that could be construed as a potential conflict of interest.
Publisher's Note
All claims expressed in this article are solely those of the authors and do not necessarily represent those of their affiliated organizations, or those of the publisher, the editors and the reviewers. Any product that may be evaluated in this article, or claim that may be made by its manufacturer, is not guaranteed or endorsed by the publisher.
Acknowledgments
We thank Franziska Martin and Angelika Grassl for excellent technical support, Bühlmann Laboratories AG (Schönenbuch, Switzerland) for supporting by reduced reagent costs, the H.+W. Winkler Stiftung Hilfe für den Menschen for their financial support of research on diagnosis and management of patients with WDEIA as well as everyone who participated in the study. We acknowledge support by the KIT-Publication Fund of the Karlsruhe Institute of Technology.
Supplementary Material
The Supplementary Material for this article can be found online at: https://www.frontiersin.org/articles/10.3389/falgy.2022.822554/full#supplementary-material
References
1. Feldweg AM. Exercise-Induced Anaphylaxis: Clinical Manifestations, Epidemiology, Pathogenesis, and Diagnosis. Available online at: https://www.uptodate.com/contents/exercise-induced-anaphylaxis-clinical-manifestations-epidemiology-pathogenesis-and-diagnosis?search=Fdeia&source=search_result&selectedTitle=1~19&usage_type=default&display_rank=1 (accessed 13 September, 2021)
2. Aihara Y, Takahashi Y, Kotoyori T, Mitsuda T, Ito R, Aihara M, et al. Frequency of food-dependent, exercise-induced anaphylaxis in Japanese junior-high-school students. J Allergy Clin Immunol. (2001) 108:1035–9. doi: 10.1067/mai.2001.119914
3. Manabe T, Oku N, Aihara Y. Food-dependent exercise-induced anaphylaxis among junior high school students: a 14-year epidemiological comparison. Allergol Int. (2015) 64:285. doi: 10.1016/j.alit.2015.01.007
4. Brockow K, Kneissl D, Valentini D, Zelger O, Grosber M, Kugler C, et al. Using a gluten oral food challenge protocol to improve diagnosis of wheat-dependent exercise-induced anaphylaxis. J Allergy Clin Immunol. (2015) 135:977–84. doi: 10.1016/j.jaci.2014.08.024
5. Chinuki Y, Kaneko S, Dekio I, Takahashi H, Tokuda R, Nagao M, et al. CD203c expression-based basophil activation test for diagnosis of wheat-dependent exercise-induced anaphylaxis. J Allergy Clin Immunol. (2012) 219:1404–6. doi: 10.1016/j.jaci.2012.02.049
6. Yokooji T, Kurihara S, Murakami T, Chinuki Y, Takahashi H, Morita E, et al. Characterization of causative allergens for wheat-dependent exercise-induced anaphylaxis sensitized with hydrolyzed wheat proteins in facial soap. Allergol Int. (2013) 62:435–45. doi: 10.2332/allergolint.13-OA-0561
7. Hiragun M, Ishii K, Hiragun T, Shindo H, Mihara S, Matsuo H, et al. The sensitivity and clinical course of patients with wheat-dependent exercise-induced anaphylaxis sensitized to hydrolyzed wheat protein in facial soap - secondary publication. Allergol Int. (2013) 62: 351–58. doi: 10.2332/allergolint.13-OA-0553
8. Day L, Augustin MA, Batey IL, Wrigley CW. Wheat-gluten uses and industry needs. Trends Food Sci Technol. (2006) 17:82–90. doi: 10.1016/j.tifs.2005.10.003
9. Kong X, Zhou H, Qian H. Enzymatic preparation and functional properties of wheat gluten hydrolysates. Food Chem. (2007) 101:615–20. doi: 10.1016/j.foodchem.2006.01.057
10. Gabler AM, Scherf KA. Comparative characterization of gluten and hydrolyzed wheat proteins. Biomolecules. (2020) 10:1227. doi: 10.3390/biom10091227
11. Batey IL, Gras PW. Preparation of salt-free protein products from acid or alkali-treated proteins. Food Chem. (1983) 12:265–73. doi: 10.1016/0308-8146(83)90015-8
12. Apichartsrangkoon A, Bell AE, Ledward DA, Schofield JD. Dynamic viscoelastic behavior of high-pressure-treated wheat gluten. Cereal Chem. (1999) 76:777–82. doi: 10.1094/CCHEM.1999.76.5.777
13. Scherf KA, Lindenau A-C, Valentini L, Collado MC, García-Mantrana I, Christensen M, et al. Cofactors of wheat-dependent exercise-induced anaphylaxis do not increase highly individual gliadin absorption in healthy volunteers. Clin Transl Allergy. (2019) 9:19. doi: 10.1186/s13601-019-0260-0
14. Matsuo H, Dahlström J, Tanaka A, Kohno K, Takahashi H, Furumura M, et al. Sensitivity and specificity of recombinant omega-5 gliadin-specific IgE measurement for the diagnosis of wheat-dependent exercise-induced anaphylaxis. Allergy. (2008) 63:233–36. doi: 10.1111/j.1398-9995.2007.01504.x
15. Matsuo H, Morita E, Tatham AS, Morimoto K, Horikawa T, Osuna H, et al. Identification of the IgE-binding epitope in omega-5 gliadin, a major allergen in wheat-dependent exercise-induced anaphylaxis. J Biol Chem. (2004) 279:12135–40. doi: 10.1074/jbc.M311340200
16. Scherf KA, Brockow K, Biedermann T, Koehler P, Wieser H. Wheat-dependent exercise-induced anaphylaxis. Clin Exp Allergy. (2016) 46:10–20. doi: 10.1111/cea.12640
17. Hofmann SC, Fischer J, Eriksson C, Bengtsson Gref O, Biedermann T, Jakob T. IgE detection to α/β/γ-gliadin and its clinical relevance in wheat-dependent exercise-induced anaphylaxis. Allergy. (2012) 67:1457–60. doi: 10.1111/all.12020
18. Kobayashi T, Ito T, Kawakami H, Fuzishiro K, Hirano H, Okubo Y, et al. Eighteen cases of wheat allergy and wheat-dependent exercise-induced urticaria/anaphylaxis sensitized by hydrolyzed wheat protein in soap. J Int Dermatol. (2015) 54:e302–5. doi: 10.1111/ijd.12767
19. Chinuki Y, Morita E. Wheat-dependent exercise-induced anaphylaxis sensitized with hydrolyzed wheat protein in soap. Allergol Int. (2012) 61:529–37. doi: 10.2332/allergolint.12-RAI-0494
20. Gabler AM, Gebhard J, Eberlein B, Biedermann T, Brockow K, Scherf KA. The basophil activation test differentiates between patients with wheat-dependent exercise-induced anaphylaxis and control subjects using gluten and isolated gluten protein types. Clin Transl Allergy. (2021) 11:e12050. doi: 10.1002/clt2.12050
21. Konstantinou GN. Wheat-dependent exercise-induced anaphylaxis: are you sure about the diagnosis? J Allergy Clin Immunol Pract. (2018) 6:1434. doi: 10.1016/j.jaip.2018.04.023
22. Palacin A, Bartra J, Muñoz R, Diaz-Perales A, Valero A, Salcedo G. Anaphylaxis to wheat flour-derived foodstuffs and the lipid transfer protein syndrome: a potential role of wheat lipid transfer protein Tri a 14. Int Arch Allergy Immunol. (2010) 152:178–83. doi: 10.1159/000265539
23. Pastorello EA, Farioli L, Stafylaraki C, Joseph Scibilia J, Mirone C, Pravettoni V, et al. Wheat-dependent exercise-induced anaphylaxis caused by a lipid transfer protein and not by ω-5 gliadin. Ann Allergy Asthma Immunol. (2014) 112:383–94. doi: 10.1016/j.anai.2014.01.012
24. Pastorello EA, Farioli L, Conti A, Pravettoni V, Bonomi S, Iametti S, et al. Wheat IgE-mediated food allergy in European patients: alpha-amylase inhibitors, lipid transfer proteins and low-molecular-weight glutenins. Allergenic molecules recognized by double-blind, placebo-controlled food challenge. Int Arch Allergy Immunol. (2007) 144:10–22. doi: 10.1159/000102609
25. Eberlein B, Hann R, Eyerich S, Pennino D, Ring J, Schmidt-Weber CB, et al. Optimizing of the basophil activation test: comparison of different basophil identification markers. Cytometry B Clin Cytom. (2015) 88:183–9. doi: 10.1002/cytob.21203
26. Hoffmann HJ, Knol EF, Ferrer M, Mayorga L, Sabato V, Santos AF, et al. Pros and cons of clinical Basophil Testing (BAT). Curr Allergy Asthma Rep. (2016) 16:56. doi: 10.1007/s11882-016-0633-6
27. MacGlashan DW. Basophil activation testing. J Allergy Clin Immunol. (2013) 132:777–87. doi: 10.1016/j.jaci.2013.06.038
28. Hoffmann HJ, Santos AF, Mayorga C, Nopp A, Eberlein B, Ferrer M, et al. The clinical utility of basophil activation testing in diagnosis and monitoring of allergic disease. Allergy. (2015) 70:1393–405. doi: 10.1111/all.12698
29. Eberlein B, León Suárez I, Darsow U, Ruëff F, Behrendt H, Ring J. A new basophil activation test using CD63 and CCR3 in allergy to antibiotics. Clin Exp Allergy. (2010) 40:411–18. doi: 10.1111/j.1365-2222.2009.03426.x
30. Eberlein B, Krischan L, Darsow U, Ollert M, Ring J. Double positivity to bee and wasp venom: improved diagnostic procedure by recombinant allergen-based IgE testing and basophil activation test including data about cross-reactive carbohydrate determinants. J Allergy Clin Immunol. (2012) 130:155–61. doi: 10.1016/j.jaci.2012.02.008
31. Schwager C, Kull S, Behrends J, Röckendorf N, Schocker F, Frey A, et al. Peanut oleosins associated with severe peanut allergy—importance of lipophilic allergens for comprehensive allergy diagnostics. J Allergy Clin Immunol. (2017) 140:1331–38. doi: 10.1016/j.jaci.2017.02.020
32. Behrends J, Schwager C, Hein M, Scholzen T, Kull S, Jappe U. Innovative robust basophil activation test using a novel gating strategy reliably diagnosing allergy with full automation. Allergy. (2021) 76:3776–88. doi: 10.1111/all.14900
33. Mehlich J, Fischer J, Hilger C, Swiontek K, Morisset M, Codreanu-Morel F, et al. The basophil activation test differentiates between patients with alpha-gal syndrome and asymptomatic alpha-gal sensitization. J Allergy Clin Immunol. (2019) 143:182–9. doi: 10.1016/j.jaci.2018.06.049
34. Chinuki Y, Yagami A, Adachi A, Matsunaga K, Ugajin T, Yokozeki H, et al. In vitro basophil activation is reduced by short-term omalizumab treatment in hydrolyzed wheat protein allergy. Allergol Int. (2020) 69:284–6. doi: 10.1016/j.alit.2019.09.006
35. Wieser H, Kieffer R, Lelley T. The influence of 1B/1R chromosome translocation on gluten protein composition and technological properties of bread wheat. J Sci Food Agric. (2000) 80:1640–7. doi: 10.1002/1097-0010(20000901)80:11<1640::AID-JSFA688>3.0.CO;2-4
36. Lagrain B, Rombouts I, Wieser H, Delcour JA, Koehler P. A reassessment of the electrophoretic mobility of high molecular weight glutenin subunits of wheat. J Cereal Sci. (2012) 56:726–32. doi: 10.1016/j.jcs.2012.08.003
37. Geisslitz S, Ludwig C, Scherf KA, Koehler P. Targeted LC-MS/MS reveals similar contents of α-amylase/trypsin-inhibitors as putative triggers of nonceliac gluten sensitivity in all wheat species except einkorn. J Agric Food Chem. (2018) 66:12395–403. doi: 10.1021/acs.jafc.8b04411
38. Scherf KA, Wieser H, Koehler P. improved quantitation of gluten in wheat starch for celiac disease patients by Gel-Permeation High-Performance Liquid Chromatography with Fluorescence Detection (GP-HPLC-FLD). J Agric Food Chem. (2016) 64:7622–31. doi: 10.1021/acs.jafc.6b02512
39. van Eckert R, Berghofer E, Ciclitira PJ, Chirdo F, Denery-Papini S, Ellis HJ, et al. Towards a new gliadin reference material–isolation and characterisation. J Cereal Sci. (2006) 43:331–41. doi: 10.1016/j.jcs.2005.12.009
40. Lexhaller B, Ludwig C, Scherf KA. Identification of isopeptides between human tissue transglutaminase and wheat, rye, and barley gluten peptides. Sci Rep. (2020) 10:7426. doi: 10.1038/s41598-020-64143-9
41. Rombouts I, Lagrain B, Scherf KA, Koehler P, Delcour JA. Formation and reshuffling of disulfide bonds in bovine serum albumin demonstrated using tandem mass spectrometry with collision-induced and electron transfer dissociation. Sci Rep. (2015) 5:12210. doi: 10.1038/srep12210
42. DuPont FM, Vensel WH, Chan R, Kasarda DD. Characterization of the 1B-type w-gliadins from Triticum aestivum cultivar Butte. Cereal Chem. (2000) 77:607–14. doi: 10.1094/CCHEM.2000.77.5.607
43. Köhler P, Belitz H-D, Wieser H. Disulphide bonds in wheat gluten: further cystine peptides from high molecular weight (HMW) and low molecular weight (LMW) subunits of glutenin and from γ-gliadins. Z Lebensm Unters Forsch. (1993) 196:239–47. doi: 10.1007/BF01202740
44. Schalk K, Koehler P, Scherf KA. Targeted liquid chromatography tandem mass spectrometry to quantitate wheat gluten using well-defined reference proteins. PLoS ONE. (2018) 13:e0192804. doi: 10.1371/journal.pone.0192804
45. Schwanhäusser B, Busse D, Li N, Dittmar G, Schuchhardt J, Wolf J, et al. Global quantification of mammalian gene expression control. Nature. (2011) 473:337–42. doi: 10.1038/nature10098
46. Schalk K, Lexhaller B, Koehler P, Scherf KA. Isolation and characterization of gluten protein types from wheat, rye, barley and oats for use as reference materials. PLoS ONE. (2017) 12:e0172819. doi: 10.1371/journal.pone.0172819
47. Dupont FM, Vensel WH, Tanaka CK, Hurkman WJ, Altenbach SB. Deciphering the complexities of the wheat flour proteome using quantitative two-dimensional electrophoresis, three proteases and tandem mass spectrometry. Proteome Sci. (2011) 9:10. doi: 10.1186/1477-5956-9-10
48. Matsuo H, Kohno K, Niihara H, Morita E. Specific IgE determination to epitope peptides of omega-5 gliadin and high molecular weight glutenin subunit is a useful tool for diagnosis of wheat-dependent exercise-induced anaphylaxis. J Immunol. (2005) 175:8116–22. doi: 10.4049/jimmunol.175.12.8116
49. Matsuo H, Kohno K, Morita E. Molecular cloning, recombinant expression and IgE-binding epitope of omega-5 gliadin, a major allergen in wheat-dependent exercise-induced anaphylaxis. FEBS J. (2005) 272:4431–8. doi: 10.1111/j.1742-4658.2005.04858.x
50. Altenbach SB, Tanaka CK, Pineau F, Lupi R, Drouet M, Beaudouin E, et al. Assessment of the allergenic potential of transgenic wheat (Triticum aestivum) with reduced levels of ω5-gliadins, the major sensitizing allergen in wheat-dependent exercise-induced anaphylaxis. J Agric Food Chem. (2015) 63:9323–32. doi: 10.1021/acs.jafc.5b03557
51. Laurière M, Pecquet C, Bouchez-Mahiout I, Snégaro J, Bayrou O, Raison-Peyron N, et al. Hydrolysed wheat proteins present in cosmetics can induce immediate hypersensitivities. Contact Dermat. (2006) 54:283–9. doi: 10.1111/j.0105-1873.2006.00830.x
52. Takahashi H, Matsuo H, Chinuki Y, Kohno K, Tanaka A, Maruyama N, et al. Recombinant high molecular weight-glutenin subunit-specific IgE detection is useful in identifying wheat-dependent exercise-induced anaphylaxis complementary to recombinant omega-5 gliadin-specific IgE test Clin Exp Allergy. (2012) 42:1293–8. doi: 10.1111/j.1365-2222.2012.04039.x
53. Sandiford C, Tatham AS, Fido R, Welch J, Jones M, Tee R, et al. Identification of the major water salt insoluble wheat proteinsinvolved in cereal hypersensitivity. Clin Exp Allergy. (1997) 27:1120–9. doi: 10.1046/j.1365-2222.1997.1310936.x
54. Battais F, Courcoux P, Popineau Y, Kanny G, Moneret-Vautrin DA, Denery-Papini S. Food allergy to wheat: differences in immunoglobulin E-binding proteins as a function of age or symptoms. J Cereal Sci. (2005) 42:109–17. doi: 10.1016/j.jcs.2005.01.004
55. Wieser H, Scherf KA. Preparation of a defined gluten hydrolysate for diagnosis and clinical investigations of wheat hypersensitivities. Nutrients. (2018) 10:1411. doi: 10.3390/nu10101411
Keywords: allergy, amylase/trypsin inhibitor, basophil activation test, gluten, proteomics, wheat
Citation: Gabler AM, Gebhard J, Norwig M-C, Eberlein B, Biedermann T, Brockow K and Scherf KA (2022) Basophil Activation to Gluten and Non-Gluten Proteins in Wheat-Dependent Exercise-Induced Anaphylaxis. Front. Allergy 3:822554. doi: 10.3389/falgy.2022.822554
Received: 25 November 2021; Accepted: 26 January 2022;
Published: 25 February 2022.
Edited by:
Joana Vitte, INSERM UMRUA11 Institut Desbrest d'Épidémiologie et de Santé Publique (IDESP), FranceReviewed by:
Hongbing Chen, Nanchang University, ChinaUta Jappe, Research Center Borstel (LG), Germany
Copyright © 2022 Gabler, Gebhard, Norwig, Eberlein, Biedermann, Brockow and Scherf. This is an open-access article distributed under the terms of the Creative Commons Attribution License (CC BY). The use, distribution or reproduction in other forums is permitted, provided the original author(s) and the copyright owner(s) are credited and that the original publication in this journal is cited, in accordance with accepted academic practice. No use, distribution or reproduction is permitted which does not comply with these terms.
*Correspondence: Katharina Anne Scherf, a2F0aGFyaW5hLnNjaGVyZkBraXQuZWR1
†ORCID: Angelika Miriam Gabler orcid.org/0000-0003-3189-3932