 Mercedes García-Roche1,2*
 Guillermo Cañibe1
 Alberto Casal3
 Diego A. Mattiauda3
 Mateo Ceriani3
 Alejandra Jasinsky3
 Adriana Cassina2
 Celia Quijano2
 Mariana Carriquiry1
- 1Departamento de Producción Animal y Pasturas, Facultad de Agronomía, Universidad de la República, Montevideo, Uruguay
- 2Centro de Investigaciones Biomédicas and Departamento de Bioquímica, Facultad de Medicina, Universidad de la República, Montevideo, Uruguay
- 3Departamento de Producción Animal y Pasturas, Estación Experimental Mario A. Cassinoni, Facultad de Agronomía, Universidad de la República, Paysandú, Uruguay
In this study, we explored mechanisms related to glucose and fatty acid metabolism in Holstein–Friesian multiparous dairy cows during lactation under two feeding strategies. From 0 to 180 days postpartum, cows were fed total mixed ration (TMR) ad libitum (non-grazing group, G0) or grazed Festuca arundinacea or Medicago sativa and were supplemented with 5.4 kg DM/d of an energy-protein concentrate (grazing group, G1). From 180 to 250 days postpartum, all cows grazed F. arundinacea and were supplemented with TMR. Plasma samples and liver biopsies were collected at −14, 35, 60, 110, 180, and 250 days in milk (DIM) for metabolite, hormone, gene expression, and western blot analysis. Our results showed increased levels of negative energy balance markers: plasma non-esterified fatty acids (NEFA), liver triglyceride and plasma β-hydroxybutyrate (BHB) (P < 0.01), triglyceride and β-hydroxybutyrate concentration were especially elevated for G1 cows. Also, hepatic mRNA expression of gluconeogenic enzymes was upregulated during early lactation (P < 0.05). In particular, methymalonyl-CoA mutase expression was increased for G0 cows (P < 0.05) while pyruvate carboxylase (PC) expression was increased for G1 cows (P < 0.05), suggesting differential gluconeogenic precursors for different feeding strategies. Phosphorylation of AMP-activated protein kinase was increased in early lactation vs. late lactation (P < 0.01) and negatively correlated with PC mRNA levels. The positive association of gluconeogenic genes with proliferator-activated receptor gamma coactivator 1-alpha (PPARGC1A) hepatic expression supported the importance of this transcription factor in glucose metabolism. The peroxisome proliferator-activated receptor alpha (PPARA) mRNA was increased during early lactation (P < 0.05), and was positively associated to PPARGC1A, carnitine palmitoyl-transferase 1, and hydroxymethylglutaryl-CoA synthase 2 (HMGCS2) mRNA expression. Alongside, hepatic mRNA expression of FABP was decreased for G1 vs. G0 cows (P < 0.05), possibly linked to impaired fatty acid transport and related to accumulation of liver triglycerides, evidencing G1 cows fail to adapt to the demands of early lactation. In sum, our results showed that metabolic adaptations related to early lactation negative energy balance can be affected by feeding strategy and might be regulated by the metabolic sensors AMPK, SIRT1, and coordinated by transcription factors PPARGC1A and PPARA.
Introduction
High producing dairy cows undergo extreme metabolic adaptations during lactation. In particular, the transition period from late gestation to early lactation is the time where most diseases and metabolic disorders occur (Drackley, 1999). It represents a moment of almost 4-fold increases in energy, protein, and mineral requirements and when multiple organs orchestrate metabolic adaptations which will be critical in defining the success of the oncoming lactation (Bauman, 2000; Roche et al., 2013).
Recently, the inclusion of grazing in dairy cow systems achieved interest to farmers due to its reduced requirement for capital infrastructure and operating expenses per kilogram of milk, decreased environmental impact, and access to higher value markets where animal welfare is perceived as an added value (Gregorini et al., 2017; Roche et al., 2017). In dairy grazing systems, herbage is accounted for the primary diet component and unlike in total mixed rations (TMR) systems, in which feed quantity and quality can be controlled, manipulation of intake, and concentration of dietary nutrients are more complex to manage (Chilibroste et al., 2012). In addition, the challenges faced in grazing systems include assuring sufficient energy intake through quantity and quality of the forage and taking strategic decisions to account for a stable stocking rate during the different seasons of the year (Chilibroste et al., 2005; Mattiauda et al., 2013; Gregorini et al., 2017). Furthermore, previous research has shown that in order to achieve high milk yields or to maintain body reserves (i.e., body condition score) in Holstein cows on intensive grazing systems, supplemental energy is needed (Kolver and Muller, 1998).
Moreover, milk yield in grazing systems with supplementation of concentrate is reduced when compared to either TMR or partial TMR systems (60–70% of offered TMR; Bargo et al., 2002; Jasinsky et al., 2019). Pasture grazing, especially when herbage allowance, quality and access time may be limiting for herbage intake, may lead to excessive mobilization of energy reserves (Astessiano et al., 2015). Indeed, decreased body reserves has been pointed out to lead to poorer productive and reproductive performance (Astessiano et al., 2017).
Full lactation studies have reported that mobilization of body reserves, seen as changes in body weight and body condition score, reaches a plateau after peak of lactation at 60–85 days in milk (DIM) and replenishment of body stores is observed during mid-lactation (Buckley et al., 2000). However, this is highly dependent on the level of concentrate, as previous studies observed that Holstein–Friesian cows supplemented with high levels of concentrate started gaining body condition score 5–7 weeks prior to cows supplemented with low levels of concentrate (Veerkamp et al., 1994). Indeed, body condition score replenishment during mid-late lactation has been increasingly challenging for high yielding dairy cows in pasture based systems (Kolver and Muller, 1998; Wales et al., 2013). However, although there is information about body condition score and body weight changes, metabolism adaptation related to replenishment of body reserves in pasture based systems has been understudied.
Increasing knowledge of the coordinated metabolic shifts has led to improvements in production or the health status of dairy cows. Specifically, adaptations of glucose metabolism (Bell and Bauman, 1997) and the molecular events underlying insulin resistance (De Koster and Opsomer, 2013), one of the most significant mechanisms in high yielding dairy cows, have been extensively studied and led to different nutritional strategies (Grum et al., 1996). Alongside, the study of early lactation negative energy balance has clarified the molecular basis of pathologies associated to the transition period such as ketosis (Adewuyi et al., 2005; McArt et al., 2013) and fatty liver (Han van der Kolk et al., 2017) which have led to research in nutrition (Ingvartsen, 2006; Ingvartsen and Moyes, 2013) as well as supply of particular feedstuffs (Pinotti et al., 2003; Chung et al., 2009; Niehoff et al., 2009; Corbin and Zeisel, 2013; Jayaprakash et al., 2016; Panda et al., 2017).
Hence, the aim of this work was to characterize the adaptations in glucose and fatty acid metabolism in cows under two contrasting feeding strategies (TMR vs. pasture-based) during lactation as well as the underlying regulating mechanisms at both a transcriptional and post-transcriptional levels, elucidating plausible mechanisms involved in the regulation of glucose and lipid metabolism during different stages of lactation. We hypothesized that mechanisms of adaptation to lactation would differ between TMR and pasture-based strategies especially due to differential gluconeogenic precursors and differential energy balance during early lactation.
Materials and Methods
The experiment was conducted at the Experimental Station “Dr. Mario A. Cassinoni” of the Facultad de Agronomía, Universidad de la República, Paysandú, Uruguay. Animal use and procedures were approved by the Animal Experimentation Committee (CHEA) of the Universidad de la República, Uruguay (file number: 021130-001914-15).
Experimental Design
The experiment was conducted in a randomized block design in which 24 Holstein cows (664 ± 65 kg BW and 3.0 ± 0.4 units of BCS; 18/08/2015 ± 11 of calving date) were blocked by calving date, parity, BW, and BCS and randomly assigned to two feeding strategies from calving to 180 ± 11 DIM. Feeding strategies were: cows fed 100% of a total-mixed ration (TMR) ad libitum (a non-grazing control group; G0, n = 12) and cows with grazing and supplementation (G1; n = 12).
The TMR (forage to concentrate ratio of 70:30, as fed basis and 40:60 forage to concentrate ratio as DM basis) was offered once a day after the morning milking to control cows (G0). The TMR was formulated for a milk production target of 35 kg per day and 15–20% refusals according to NRC Dairy Model 2001 software (National Research Council, 2001). It was composed by corn silage and moha (Setaria italica) hay or alfalfa haylage and a concentrate that included sorghum grain (22.6%), corn grain (6.8%), barley grain (4.4%) sunflower expeller (7.5%), soybean expeller (13.6%), and minerals and vitamins (1.7%). Chemical composition was 43.1% DM, 12.9% crude protein (CP), 33.8% neutral detergent fiber (NDF), 21.3% acid detergent fiber (ADF), and 1.63 Mcal per kg of net energy of lactation (NEL) (DM basis, Table 1). Cows were housed in three pens (8 × 22.6 m each; 4 cows per pen) of a free stall facility (wood-frame barn) with wood shavings (>10 cm) for bedding, and access to shade, water, and a feeder (2.4 m long, 1.12 m wide in the top, 0.58 wide in the bottom and 0.50 m deep).
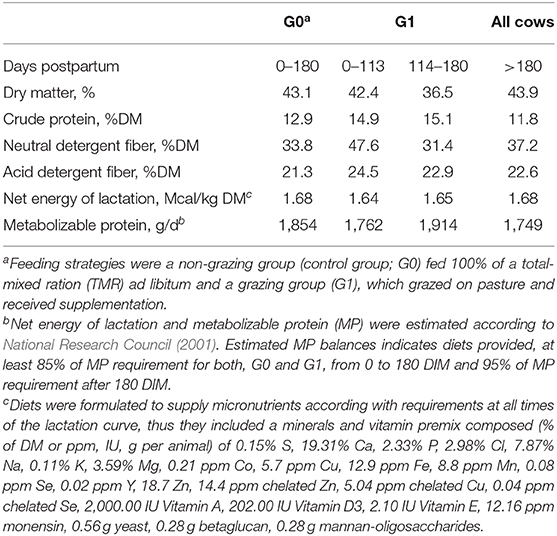
Table 1. Estimated nutrient composition of diets according to feeding strategy during lactation.
From 0 to 113 DIM, G1 cows grazed a tall fescue (Festuca arundinacea) pasture (2,500 ± 490 kg DM per ha, two grazing sessions from 08:00 to 16:00 h and from 18:00 to 04:00 h; mean herbage allowance, 4 cm above ground level, of 30 kg dry matter (DM)/d per cow in a 7-d rotational system). The chemical composition (DM basis) was 26.4% DM, 14.2% CP, 54.7% NDF, 30.1% ADF, and 1.58 Mcal per kg DM of NEL. Cows were also supplemented after the morning milking, in individual feeders, with 5.4 kg DM/d per cow of a concentrate containing corn grain (32%), barley grain (31%), and soybean expeller (32%) with an 87% DM, 16.8% CP, 28.5% NDF, 9.3% ADF, and 1.83 Mcal per kg of NEL (DM basis). From 114 to 180 DIM, cows grazed an alfalfa (Medicago sativa) pasture (1,380 ± 328 kg DM per ha, one grazing session from 18:00 to 04:00 h; mean herbage allowance−4 cm above ground level—of 20 kg DM/d per cow) in a 7-d rotational system. The chemical composition (DM basis) was 26.4% DM, 23.3% CP, 30.1% NDF, 24.7% ADF, and 1.68 Mcal per kg DM of NEL. During this period, cows received after the morning milking, in the free stall facility, TMR (50% of offered TMR to G0 cows) composed by corn silage (23.3%), alfalfa haylage (19%), sorghum grain (20.8%), corn grain (11.8%), barley grain (11.5%), soybean expeller (11.8%), and minerals and vitamins (1.8%) with a chemical composition (DM basis) of 41.5% DM, 11.1% CP, 32.1% NDF, 22.0% ADF, and 1.64 Mcal/kgDM of NEL. Management changed at 113 DIM as temperature-humidity index exceeded the value of 72 for more than 5 consecutive hours and for 3 consecutive days denoting heat stress (Johnson et al., 1961).
After 180 DIM until the end of the experiment (250 DIM), both, G0 and G1 cows grazed a F. arundinacea pasture (2,340 ± 291 kg DM per ha, one grazing session from 16:30 to 04:00 h, mean herbage allowance—above 4 cm of ground level—of 20 kg DM per cow per day in a 7-d rotational system. Herbage chemical composition was 28.3% DM, 10.1% CP, 56.6% NDF, 32.2% ADF, and 1.48 Mcal per kg of NEL, DM basis). After the morning milking, cows were supplemented in the free stall facility, with TMR (50% of offered TMR to G0 cows at 180 DIM; 23.4% corn silage, 12.4% alfalfa hay, 28.3% sorghum grain, 11.5% corn grain, 11.1% barley grain, 11.5% soybean expeller, and 1.8% minerals and vitamins) with 50% DM, 12.5% CP, 29.7% NDF, 18.8% ADF, and 1.76 Mcal per kg of NEL (DM basis).
To determine diet composition, DM intake of TMR (based on difference between feed offered and refused) and pasture (based on NRC requirements) were determined and the proportion of diet components (DM basis) was calculated for each treatment. Diet was composed of 100% TMR from 0 to 180 DIM for G0 cows, and for G1 cows of 73.4% pasture and 26.6% concentrate from 0 to 113 DIM and 32.7% pasture and 67.3% TMR from 114 to 180 DIM; from 180 to 250 DIM diet was composed of 28% pasture and 72% TMR for all cows (G0 and G1). Chemical composition of estimated diets is presented on Table 1.
Cows were milked twice a day and milk yield was recorded daily. Milk samples were collected weekly until 90 DIM, every 14 d from 90 to 180 DIM and every 28 d from 180 to 250 DIM. Cow BCS (score 1–5; Edmonson et al., 1989) and BW were determined every 14 d.
Plasma and Liver Biopsies
Blood samples were collected at −14, 35, 60, 110, 180, and 250 DIM by venipuncture of the coccygeal vein using BD Vacutainer® tubes with heparin (Becton Dickinson, Franklin Lakes, NJ, USA). Samples were centrifuged at 2,000 g for 15 min at 4°C within 1 h after collection and plasma was stored at −20°C until analyses were performed.
Liver biopsies were collected at −14, 35, 60, 110, 180, and 250 DIM using a 14-gauge biopsy needle (Tru-Core-II Automatic Biopsy Instrument; Angiotech, Lausanne, Switzerland) after the local intramuscular administration of 3 mL of 2% lidocaine HCl (Carriquiry et al., 2009) and snap frozen in liquid nitrogen and stored at −80°C until analysis.
Metabolite and Hormone Assays in Plasma Samples
Glucose concentrations were determined with a kit from Biosystems S.A. (Costa Brava, Barcelona, Spain), following manufacturer instructions. In this assay glucose oxidase oxidizes glucose yielding hydrogen peroxide, which forms a colored quinonoid in the reaction with 4-aminoantipyrine and phenol catalyzed by a peroxidase. Absorbance was measured at 505 nm. Concentrations of β-hydroxybutyrate (BHB) were determined with a kit from Randox Laboratories Ltd. (Ardmore, UK) following manufacturer instructions. The assay measures NADH formation spectrophotometrically at 340 nm as β-hydroxybutyrate dehydrogenase catalyzes the oxidation of BHB to acetoacetate (Porter et al., 1997). Concentrations of non-esterified fatty acids (NEFA) were determined spectrophotometrically with a kit from FUJIFILM Wako Diagnostics USA Corp. (Mountain View, CA, USA), following manufacturer instructions. In this method, NEFA is incubated with acyl-CoA synthetase and ATP and yields acyl-CoA, finally acyl-CoA is oxidized in a reaction catalyzed by acyl-CoA oxidase producing hydrogen peroxide, which reacts with 4-aminoantipyrine and 3-methyl-N-ethyl-N-(β-hydroxyethil)-aniline in the presence of peroxidase forming a purple colored end-product with an absorption maximum at 550 nm (Chilliard et al., 1984). For all metabolite assays intra and inter-assay coefficient of variation (CV) were <10%.
Insulin concentrations were measured using immunoradiometric assays (IRMA) with a commercial kit (INS-IRMA; DIA Source Immune Assays S.A., Belgium) as described by previously Astessiano et al. (2015); the assay detection limit was 1.18 μIU/ml. Leptin concentrations were determined by a liquid-phase radioimmunoassay (RIA) using a commercial Multi-Species Leptin kit (RIA kit, Merck Millipore Billerica, MA, USA) reported previously in bovines (Adrien et al., 2012; Astessiano et al., 2015); the assay detection limit was 1.8 ng/ml. Concentrations of adiponectin were measured with a human RIA kit (HADP-61 HK, Merck Millipore) using undiluted plasma samples (Astessiano et al., 2015); the sensitivity of the assay was 1.01 ng/ml. All samples were determined in a single assay. The intra-assay CVs for all the assays were <8%. The Revised Quantitative Insulin Sensitivity Check Index (RQUICKI) was calculated as 1/(log(fasting insulin) + log(fasting glucose) + log(free fatty acids) (Holtenius and Holtenius, 2007).
Triglyceride Quantification in Liver Samples
Triglyceride quantification was performed in liver homogenates as described in García-Roche et al. (2019). Briefly, lipids were extracted, and an internal standard was added to the samples; then, lipid extracts were spotted manually on thin layer chromatography plates using a microsyringe (Hamilton) along with the internal standard and a triglyceride standard. Finally, densitometry quantification analysis of the bands was performed using ImageJ software.
Free Glucose and Glycogen Quantification in Liver Samples
For liver glycogen and free glucose, homogenization was performed using 500 μL 2N HCl and glass Dounce homogenizers. Glycogen was digested to glucose by acid-heat hydrolysis (Bancroft and Fry, 1933), for this, samples were subjected to 100°C during an hour. Finally, free liver glucose and digested liver glycogen were determined using the aforementioned glucose detection kit after neutralizing acid samples with an equal amount of 2M NaOH.
Western Blots
Liver homogenates were performed as previously described by García-Roche et al. (2019), the lysis buffer was complemented with protease and phosphatase inhibitors: 1 mM PMSF, supplemented with SigmaFAST protease inhibitor cocktail and Calbiochem phosphatase inhibitor cocktail (Sigma-Aldrich, St Louis, MO, USA). Protein content was determined with the Bradford assay using bovine serum albumin as standard (Bradford, 1976) and samples were kept at −80°C until analyzed. Liver homogenates were resolved (25 μg) in 12% Tris-Glycine-SDS polyacrylamide gels (SDS/PAGE), along with protein ladders (SDS7B2; Sigma-Aldrich) and proteins were transferred overnight to nitrocellulose membranes. Membranes were blocked with blocking buffer (Tris buffered saline with 0.1% Tween 20 and 0.5% skimmed milk) and incubated overnight at 4°C with primary antibodies against: β-actin (1:1,000, sc-81178; Santa Cruz Biotechnology, Santa Cruz, CA, USA), AMPKα (1:1,000; #2532, Cell Signaling Technology, Danvers, MA, USA), and phosphorylated AMPKα (1:1,000, #2535; Cell Signaling Technology).
Membranes were washed and probed with secondary antibodies from LI-COR Biosciences, Lincoln, NE, USA: anti-mouse (1:10,000, IRDye 680, 926–68070) or anti-rabbit (1:20,000, IRDye 800, 926–32211). Immunoreactive proteins were detected with an infrared fluorescence detection system (Odyssey, LI-COR Biosciences) and bands were quantified by densitometry with ImageStudio software (LI-COR Biosciences).
RNA Extraction and qPCR Analysis
Isolation of total RNA from liver tissue and cDNA synthesis by reverse transcription was performed by Carriquiry et al. (2009). Briefly, total RNA was isolated using the Trizol reagent and concentration was quantified using a spectrophotometer (NanoDrop ND-1000 Spectrophotometer; Nanodrop Technologies, Wilmington, DE, USA). Quantified samples were subject to lithium chloride precipitation and DNase treatment using Ambion™ DNA-free™ DNA Removal Kit following manufacturer instructions (ThermoFisher Scientific, Waltham, MA, USA). Finally, concentration of RNA was determined by measuring the absorbance at 260 nm (NanoDrop ND-1000 Spectrophotometer; Nanodrop Technologies, Wilmington, DE, USA), and purity and integrity of RNA isolates were assessed from 260/280 and 260/230 absorbance ratios (>1.9 and 1.8, respectively). Samples of RNA were stored at −80°C. Retrotranscription of RNA was performed using the SuperScript™ III Reverse Transcriptase kit (Invitrogen™ from ThermoFischer Scientific) using random hexamers and 1 μg of total RNA as a template. The cDNA was stored at −20°C until its use in the real-time PCR. Primers (Supplementary Information 1) to specifically amplify cDNA of target genes: acetyl-CoA carboxylase (ACACA), β-actin (ACTB), adiponectin receptor 1 (ADIPOR1), carnitine palmitoyl-transferase (CPT1A), liver fatty acid binding protein (FABP1), glucose-6-phosphatase (G6PC), hydroxymethylglutaryl-CoA synthase 2 (HMGCS2), hypoxanthine phosphoribosyl transferase (HPRT1), methylmalonyl-CoA mutase (MMUT), leptin receptor (LEPR), pyruvate carboxylase (PC), phosphoenolpyruvate carboxykinase (PCK1), peroxisome proliferator-activated receptor gamma coactivator 1-alpha (PPARGC1A), peroxisome proliferator-activated receptor alpha (PPARA), and sirtuin 1 (SIRT1) were obtained from the literature or specifically designed using the Primer3 website (http://www.bioinformatics.nl/cgi-bin/primer3plus/primer3plus.cgi) and bovine nucleotide sequences available from NCBI (http://www.ncbi.nlm.nih.gov/).
Real time PCR reactions were performed in a total volume of 15 μl using Maxima SYBR Green/ROX qPCR Master Mix 2X (ThermoFisher Scientific), using the following standard amplification conditions: 10 min at 95°C and 40 cycles of 15 s at 95°C, 30 s at 60°C, and 30 s at 72°C in a 48-well StepOne™ Real-Time PCR System (Applied Biosystems™ from ThermoFischer Scientific). Melting curves were run on all samples to detect primer dimers, contamination, or presence of other amplicons. Each plate included a pool of total RNA from bovine liver samples analyzed in triplicate to be used as the basis for the comparative expression results (exogenous control) and duplicate wells of non-template control (water). Gene expression was measured by relative quantification with respect to the exogenous control (Pfaffl, 2004) and normalized to the geometric mean expression of the endogenous control genes (ACTB and HPRT). Expression stability of two selected housekeeping genes was evaluated using MS-Excel add-in Normfinder (MDL, Aarhus, Denmark). The stability values obtained with Normfinder were 0.004 for ACTB and 0.003 for HPRT. Amplification efficiencies or target and endogenous control genes were estimated by linear regression of a cDNA dilution curve (Supplementary Information 1). Intra and inter-assay CV-values were 1.9 and 5.9% (n = 5 dilutions, from 100 to 6.25 ng/well), respectively.
Statistical Analysis
Data were analyzed in a randomized block design using the SAS System program (SAS Academic Edition; SAS Institute Inc., Cary, NC, USA), where the cow was the experimental unit and they were blocked according to calving date, previous lactation yield, initial BW and initial BCS. Univariate and linear regression analyses were performed with all variables to identify outliers and inconsistencies and to verify normality of residuals. When data did not have normal distribution (Shapiro-Wilk P-value < 0.10) logarithmic transformations were performed in order to more closely approximate to normality requirements or outliers were removed when the studentized residual r was between −3 and 3, no more than three values per variable were excluded. Least square means and pooled standard error values of all variables shown were done with the non-transformed data, so as to aid in the comparison with variables that were not transformed.
Data were analyzed as repeated measures using the MIXED procedure, the model included treatment, stage of lactation (DIM), and their interaction as fixed effects, block as random effect and calving date, initial BW and BCS as covariates when P < 0.20. The interaction between pen and block was included in the model as a random effect, as covariance parameter estimates were zero or close to zero it was removed from the model. Spatial power [SP (POW)] was used as the covariance structure and the Kenward-Rogers procedure was used to adjust the denominator degree of freedom. Tukey-Kramer tests were conducted to analyze differences between groups. Means were considered to differ when P < 0.5 and a trend was declared when 0.05 < P < 0.10. The CORR procedure was performed for correlation analyses, Pearson correlations were used for variables with normal distribution while Spearman correlations were used for variables with non-normal distribution.
Results
Energy corrected milk yield (Figure 1A) decreased from 35 to 250 DIM (P < 0.001), without differences between treatments. On the other hand, an interaction between DIM and treatment (P < 0.05) was observed for body condition score (Figure 1B) as it increased with the progression of lactation (P < 0.001) and was higher for G0 than G1 from 110 to 180 DIM. A drop in body condition score was observed at 180 DIM, probably due to heat stress conditions recorded during the summer season.
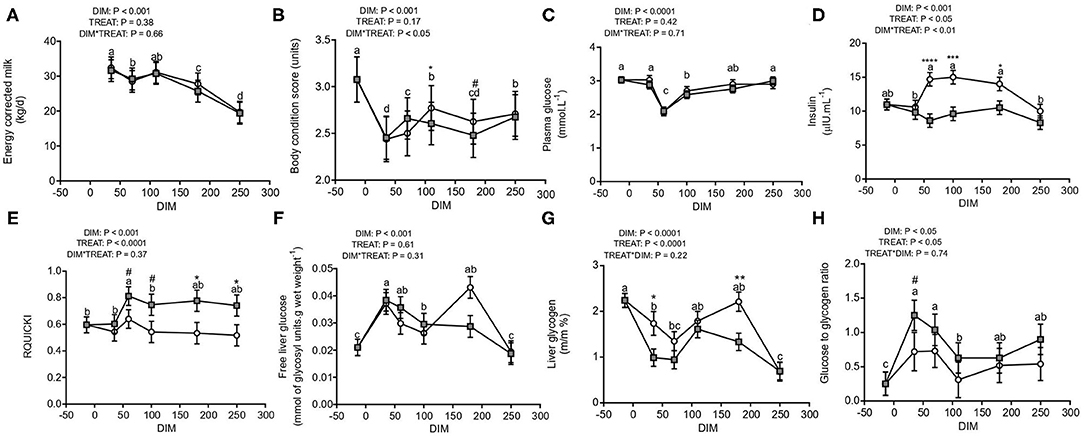
Figure 1. Energy corrected milk yield and glucose metabolism from pre-partum to late lactation in cows from G0 (white) and G1 (gray) (N = 8–12). Different letters (a and b for P < 0.05) and asterisks or numerals (* for P < 0.05, **P < 0.01, ***P < 0.001, and ****P < 0.0001; # for trends, 0.05 < P < 0.10) depict differences between means; letters for DIM effect and asterisks or numerals for treatment effect. Graphs show energy corrected milk yield (A), body condition score (B), concentrations of plasma glucose (C), plasma insulin (D), RQUICKI (E), free liver glucose (F), liver glycogen (G), and glucose to glycogen ratio (H). G0: Cows were fed TMR ad libitum from calving to 180 DIM. G1: Cows grazed Festuca arundinacea plus a commercial concentrate or Medicago sativa supplemented with TMR (50% of G0 offer), depending on heat stress conditions, from calving to 180 DIM. From 180 to 250 DIM both groups grazed Medicago sativa and were supplemented with TMR (50% of G0 offer at 180 DIM).
Glucose Metabolism and the AMPK, PGC-1α, and SIRT1 Axis
Plasma glucose concentrations decreased sharply during early lactation (60 DIM) and gradually increased during the progress of lactation reaching levels similar to pre-partum at late lactation (250 DIM; Figure 1C). However, neither effect of treatment nor its interaction with stage of lactation were observed for plasma glucose. In contrast, for insulin concentration there was an interaction between DIM and treatment (P < 0.01, Figure 1D) where plasma insulin increased from early to mid-lactation (60–180 DIM) only in G0 cows. Since the increase in insulin coincided with the decrease in glucose concentrations, the revised quantitative insulin sensitivity index (RQUICKI), indicative of insulin sensibility, was calculated (Figure 1E). Although RQUICKI was not affected by the interaction between stage of lactation and treatment, it was affected by stage of lactation (P < 0.001) and treatment (P < 0.0001) as it increased only for G1 cows from 35 DIM onwards.
Regarding liver composition, both, free liver glucose (Figure 1F) and liver glycogen (Figure 1G) were affected by DIM (P < 0.001). Free hepatic glucose peaked in early lactation (35 DIM) and returned to pre-partum (−14 DIM) levels at 250 DIM where minimum concentrations were observed. Hepatic glycogen reserves dropped dramatically from pre-partum to early lactation, increased from 60 to 180 DIM and decreased again in late lactation (250 DIM). Additionally, liver glycogen was higher for G0 than G1 cows. Free glucose and liver glycogen were negatively correlated at 35 DIM (r = −0.42 and P < 0.05) while liver glycogen and insulin concentrations were positively correlated (r = 0.30, P < 0.05). Free liver glucose to liver glycogen ratio (Figure 1H) peaked during early lactation (P < 0.05) and was higher for G1 cows (P < 0.05), especially at 35 DIM (P = 0.07).
Phosphorylated AMPK was 1.8-fold greater at 35 than 250 DIM (P < 0.01), while no changes in total AMPK protein expression were observed (P > 0.13). This yielded a pAMPK to AMPK ratio more in favor of phosphorylated AMPK, at 35 than 250 DIM (Figures 2E,F, P < 0.01), evidencing AMPK activation during early lactation. Plasma adiponectin was not affected by DIM, treatment, or their interaction (Figure 2A), while plasma leptin tended to be higher for G0 than G1 cows (P = 0.09, Figure 2C). But, both hepatic ADIPOR1 (P = 0.08, Figure 2B) and LEPR (P < 0.05; Figure 2D) mRNA tended to decrease at 110 DIM. Gene expression of hepatic ADIPOR1 and LEPR correlated positively (r = 0.43 and P < 0.001).
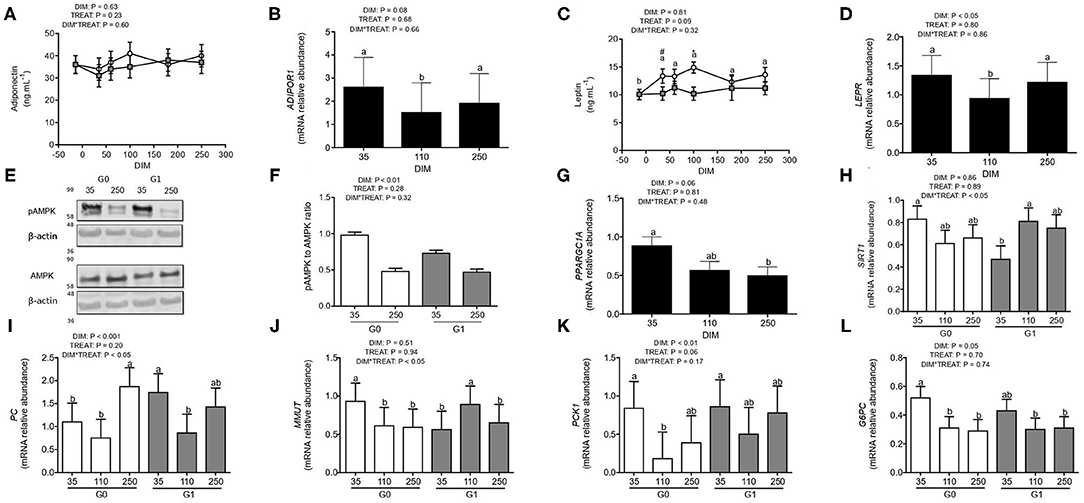
Figure 2. AMPK, PGC-1α, and SIRT1 axis and expression of gluconeogenic genes during 35, 110, and 250 DIM in cows from G0 (white) and G1 (gray) (N = 8–12). Different letters (a and b for P < 0.05) and asterisks or numerals (* for P < 0.05 and # for trends, 0.05 < P < 0.10) depict differences between means; letters for DIM effect and asterisks or numerals for treatment effect. Graphs show plasma concentrations of adiponectin (A) and leptin (C) and gene expression of ADIPOR1 (B), LEPR (D), PPARGC1A (G), SIRT1 (H), PC (I), MMUT (J), PCK1 (K), and G6PC (L). (E) A representative western blot of pAMPK and AMPK in liver homogenates is shown. (F) pAMPK and AMPK levels were quantified by densitometry from blots like shown in (E), normalized by protein levels of the loading control (β-actin) and the pAMPK/AMPK ratio was calculated and expressed in relation to the average value of the G0 group at 35 DIM. G0: Cows were fed TMR ad libitum from calving to 180 DIM. G1: Cows grazed Festuca arundinacea plus a commercial concentrate or Medicago sativa supplemented with TMR (50% of G0 offer), depending on heat stress conditions, from calving to 180 DIM. From 180 to 250 DIM both groups grazed Medicago sativa and were supplemented with TMR (50% of G0 offer at 180 DIM).
Hepatic mRNA expression levels of the PPARGC1A tended to be affected by DIM (P = 0.06) as it was 1.4-fold greater (P < 0.05) at 35 than 250 DIM (Figure 2G). Alongside, for hepatic SIRT1 mRNA an interaction between DIM and treatment was observed (P < 0.05) with higher expression, roughly above 40%, for G0 than G1 cows at 35 DIM and the increase from 35 to 110 DIM for G1 cows, reinforcing the lower levels that these cows suffered at 35 DIM (Figure 2H). Although the pAMPK to AMPK ratio did not correlate with hepatic PPARGC1A or SIRT1 mRNA levels, PPARGC1A and SIRT1 mRNA expression levels did correlate positively (r = 0.43, P < 0.01).
Pyruvate carboxylase and methylmalonyl-CoA mutase catalyze reactions involved in recruiting different metabolites to the gluconeogenic pathway. Both, PC and MMUT mRNA were affected by the interaction between DIM and treatment (P < 0.05; Figures 2I,J). Hepatic PC decreased from 35 to 110 DIM to increase again at 250 DIM, its expression was 1.6-fold greater for G1 than G0 at 35 DIM (Figure 2I). Instead, expression of MMUT mRNA was 1.7-fold greater in G0 than G1 cows at 35 DIM (P < 0.05; Figure 2J).
In addition, expression of genes coding for phosphoenolpyruvate carboxykinase and glucose-6-phosphatase, key enzymes of the gluconeogenic pathway, was assessed. Hepatic expression of PCK1 mRNA was affected by DIM (P < 0.01) and tended to be affected by treatment (P = 0.06; Figure 2K). Hepatic PCK1 mRNA decreased from 35 to 110 DIM to increase again at 250 DIM, however, its expression was 2.7-fold higher for G1 than G0 at 110 DIM (Figure 2K). While G6PC mRNA was only affected by DIM (P = 0.05), its levels were 1.6-fold greater at 35 than 110 and 250 DIM (Figure 2L).
Hepatic PPARGC1A mRNA correlated positively with mRNA expression of all gluconeogenic genes (PPARGC1A and PC: r = 0.30 and P < 0.05, PPARGC1A and MMUT: r = 0.53 and P < 0.0001, PPARGC1A and PCK1: r = 0.33 and P < 0.05, PPARGC1A and G6PC: r = 0.26 and P = 0.06) and SIRT1 mRNA correlated positively only with expression of MMUT and PCK1 mRNA (r = 0.30 and P < 0.05). Instead, the pAMPK/AMPK ratio correlated negatively with hepatic PC mRNA (r = −0.42 and P < 0.05). Both PC and MMUT mRNA correlated positively with PCK1 (r = 0.30 and P < 0.05 and r = 0.51 and P < 0.0001, respectively) and G6PC mRNA (r = 0.34 and P < 0.05 and r = 0.30 and P < 0.05, respectively) and PC and PCK1 mRNA correlated negatively with liver glycogen (r = −0.30 and P < 0.05 and r = −0.35 and P < 0.01, respectively) while PCK1 mRNA correlated positively with energy corrected milk (r = 0.37 and P < 0.05). Finally, PPARGC1A mRNA correlated positively with free liver glucose (r = 0.28 and P < 0.05).
Fatty Acid Metabolism and PPARA Mediated Pathway
Plasma concentrations of BHB (Figure 3A) and NEFA (Figure 3B), and liver triglyceride (Figure 3C) were quantified. Concentrations of BHB were affected by stage of lactation, treatment, and their interaction (P < 0.05) as plasma BHB reached its highest concentration during early lactation (between 35 and 60 DIM) mainly due to the 2-fold increase observed for G1 with respect to G0 cows. On the other hand, although no interaction was observed, plasma NEFA was affected (P < 0.0001) by DIM as it peaked in early lactation, decreasing at +60 DIM and thereafter. However, concentrations of NEFA tended (P = 0.08) to be affected by treatment, as they were greater for G1 than G0 cows especially during 35 and 180 DIM. Additionally, liver triglyceride was affected by DIM (P < 0.0001) and treatment (P < 0.05) and tended (P = 0.06) to be affected by the interaction between DIM and treatment (Figure 3C). While liver triglyceride concentrations remained unchanged for G0 cows during the progress of lactation, they peaked at 35 DIM for G1 cows.
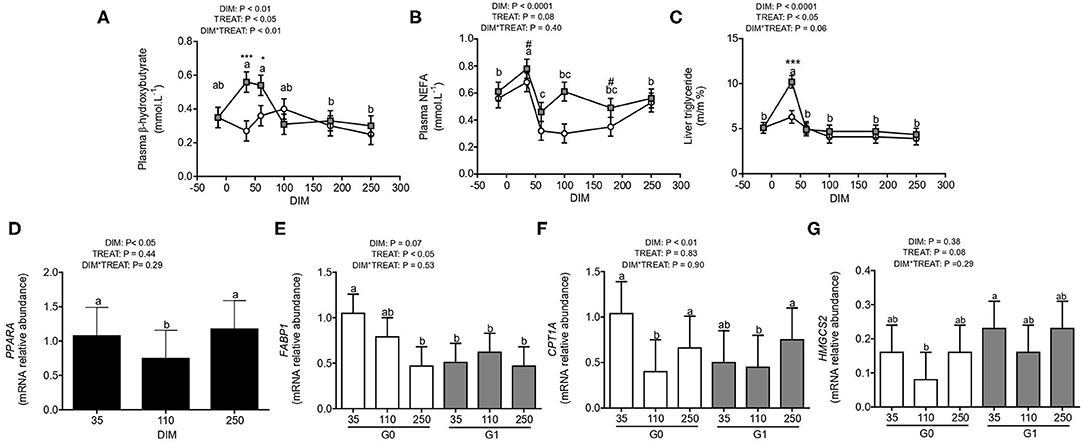
Figure 3. Fatty acid metabolism and PPARA in pre-partum to late lactation in cows from G0 (white) and G1 (gray) (N = 8–12). Different letters (a and b for P < 0.05) and asterisks or numerals (* for P < 0.05, *** for P < 0.001 and # for trends, 0.05 < P < 0.10) depict differences between means; letters for DIM effect and asterisks or numerals for treatment effect. Graphs show concentrations of plasma BHB (A), plasma NEFA (B), and liver triglyceride (C), and gene expression of PPARA (D), FABP1 (E), CPT1A (F), and HMGCS2 (G). G0: Cows were fed TMR ad libitum from calving to 180 DIM. G1: Cows grazed Festuca arundinacea plus a commercial concentrate or Medicago sativa supplemented with TMR (50% of G0 offer), depending on heat stress conditions, from calving to 180 DIM. From 180 to 250 DIM both groups grazed Medicago sativa and were supplemented with TMR (50% of G0 offer at 180 DIM).
Indeed, hepatic gene expression of PPARA was affected by DIM (P < 0.05) as it was higher at 35 and 250 DIM than during 110 DIM (Figure 3D). Expression of genes downstream PPARA mediated pathway were studied such as FABP1, CPT1A, HMGCS2 (Figures 3E–G). Both, expression of FABP1 and CPT1A mRNA tended to be affected (P = 0.07) or were affected (P < 0.01) by DIM as FABP1 mRNA decreased from 35 to 250 DIM and CPT1A mRNA decreased at 110 DIM when compared to 35 and 250 DIM. Expression of FABP1 mRNA was affected by treatment (P < 0.01) as it was 2-fold higher for G0 than G1 cows while HMGCS2 mRNA tended to be 1.6-fold higher for G1 than G0 cows (P = 0.08). Hepatic PPARA mRNA correlated positively with both CPT1A and HMGCS2 mRNA (r = 0.42, P < 0.01 and r = 0.64, P < 0.001). Additionally, the expression of CPT1A and HMGCS2 mRNA were positively correlated (r = 0.50, P < 0.001).
Besides, positive correlations between the pAMPK to AMPK ratio and HMGCS2 expression (r = 0.46 and P < 0.05), and between PPARGC1A and HMGCS2 mRNA levels (r = 0.34 and P < 0.05); as well as between PPARGC1A and PPARA mRNA levels (r = 0.31 and P < 0.05) were observed.
Discussion
During early lactation glucose metabolism changes drastically as a response to maximal lactogenesis, from pre-partum to 60 DIM insulin peaked, especially for G0 cows as glucose dropped and free liver glucose increased while glycogen decreased. In addition to this, although blood and free liver glucose concentrations did not differ between treatments glycogen stores increased for G0 vs. G1 cows at 60 DIM probably due to increased gluconeogenesis to replenish glycogen stores or a decrease in glycogen hydrolysis. Alongside, glucose to glycogen ratio shows that at 35 DIM G1 is primarily focused in glycogen catabolism. Although PCK1 mRNA was similar for both groups, indicative of similar enzyme activity (Greenfield et al., 2000), we found G0 and G1 cows were likely using different precursors for gluconeogenesis which was evidenced by MMUT and PC differential mRNA expression (Figure 4A). Indeed, MMUT expression, the point of entry of propionate to gluconeogenesis (Aschenbach et al., 2010), was greater for G0 than G1 cows during early lactation. Propionate is the primary precursor for gluconeogenesis in fed cows, however, when propionate from dietary origin is insufficient, other gluconeogenic precursors are used such as: lactate, glycerol, and amino acids (Kristensen, 2005; Larsen and Kristensen, 2013). These alternative precursors are converted to pyruvate, hence their point of entrance to the gluconeogenic pathway is commonly assumed to be via the conversion of pyruvate to oxaloacetate catalyzed by PC (Greenfield et al., 2000). Previous studies have demonstrated that mRNA abundance and enzyme activity of PC were strongly correlated, therefore gene expression of this enzyme is suggestive of enzyme activity (Greenfield et al., 2000). In line with this, we found grazing cows (G1 cows) had greater PC mRNA expression than cows fed TMR (G0 cows) during early lactation. Hence, our results suggest that G0 cows sustained glucose synthesis for lactose production during early lactation more on propionate as the precursor while G1 cows used more non-propionate precursors. In addition, since propionate is the most abundant precursor (Larsen and Kristensen, 2013), G0 cows had increased availability of substrates for gluconeogenesis and in turn produced more glucose which would probably account for their increased glycogen stores at 60 DIM.
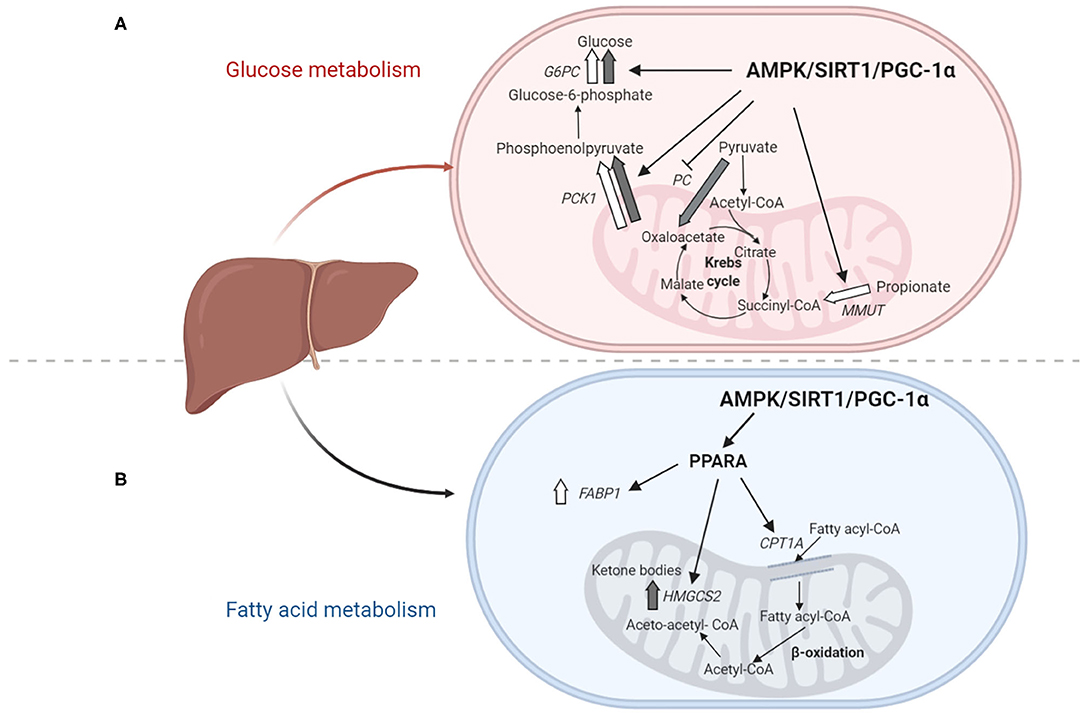
Figure 4. (A) Plausible mechanism behind differential use of gluconeogenic precursors. During early lactation when milk yield is maximum, the expression of gluconeogenic gene G6P and PCK1 is high in all the animals. However, G0 cows (white) increase MMUT expression and use propionate over pyruvate as gluconeogenic precursor; while G1 cows (gray) increase PC expression and use pyruvate over propionate as gluconeogenic precursor. Based on our results we hypothesize that AMPK, SIRT1, and PGC1-α induce the expression of gluconeogenic genes G6P and PCK1 and MMUT, while suppressing PC expression, (B) Plausible mechanism behind metabolic adaptations of fatty acid metabolism in TMR vs. grazing cows. During early lactation, lipid reserves are mobilized and fatty acids reach the liver. In G0 cows (white) the expression of genes CPT1A and FABP1 increases and probably accounts for an increase in fatty acid oxidation. As opposed to G1 cows (gray) where this metabolic adaptation does not occur and fatty acids accumulate as liver triglycerides. We hypothesize that AMPK, SIRT1, PGC1-α activate PPARA which in turn induces the expression of fatty acid oxidation genes FABP1, HMGCS2, and CPT1A, but differential regulation occurs in G0 and G1 cows that present different levels of hepatic BHB synthesis and triglycerides. In panels (A) and (B) metabolites are written in black, metabolic pathways in bold, genes in italics, master regulators in bold letters, and thick arrows represent higher transcription of genes.
During the latter part of early lactation to mid-lactation, insulin concentrations peaked only for TMR-fed cows (G0) consistent with the greater nutrient availability in the TMR diet (Meikle et al., 2013) and the reduced energy requirements for walking and grazing (Jasinsky et al., 2019). On the other hand, grazing and walking activities for pasture based cows could have an insulin sensitizing effect (Astessiano et al., 2015) as seen from the RQUICKI index which peaked at 60 DIM and remained higher during all the course of lactation only for these cows (G1).
Hepatic glycogen reserves were mobilized during late lactation (from 180 to 250 DIM) at the same time that expression of PC and PCK1 mRNA were high. Nevertheless, these changes would not probably be associated with a need for glucose for lactogenesis as energy corrected milk yield reached its lowest point at 250 DIM. Also, the decrease in plasma insulin concentration suggests a decrease in intake which could be due to less availability of dietary nutrients since both groups were on a pasture-based system from 180 DIM onwards and were subject to heat stress. Previous authors have suggested that metabolic adaptations related to heat stress are initiated due to decreased dry matter intake representing an inadequate plane of nutrition (Baumgard et al., 2011). Additionally, when heat stressed cows are under similar planes of nutrition as their thermal-neutral cohorts, heat stressed cows do not mobilize adipose tissue as much and increase their reliance on glucose as a fuel source in order to remain euthermic (Wheelock et al., 2010). Lipid oxidation increases body temperature and thus heat stressed cows mobilize skeletal muscle to a greater extent than their thermal–neutral cohorts, hence yielding alanine and lactate as gluconeogenic precursors (Rhoads et al., 2011; Baumgard and Rhoads, 2012). In addition to this and consistent with our findings, previous reports have observed increased glycogenolysis and gluconeogenesis, in particular higher expression of PC (Rhoads et al., 2011).
Apart from insulin concentrations, we studied adiponectin and leptin, plasma concentrations of these hormones did not change throughout lactation but the increased mRNA expression of LEPR at 35 and 250 DIM could point out to higher tissue sensitivity during early and late lactation. Indeed, previous authors have observed that hypoinsulinemia could trigger hepatic leptin receptor expression (Thorn et al., 2008), this could be the case for both 35 and 250 DIM where insulin is decreased. Interestingly, leptin plasma concentrations tended to remain higher in G0 cows, probably due to increased energy balance and improved adipocyte size (Ehrhardt et al., 2000; Laubenthal et al., 2016).
Increased mobilization of lipid reserves reflected in increased plasma BHB and NEFA as well as liver triglyceride concentrations were observed during early lactation, especially in grazing cows (G1 cows). The trend to higher mRNA expression of HMGCS2 in G1 cows together with higher plasma BHB and liver triglyceride concentrations indicated these cows may have mobilized more lipid reserves than G0 cows in agreement with previous research (Astessiano et al., 2015). In addition, in early lactation the expression of FABP1 and CPT1A was increased with respect to mid-lactation only for G0 cows, suggesting that G1 cows fail to adapt their metabolism to higher levels of fatty acid oxidation, and therefore accumulate triglycerides in the liver (Figure 4B). The FABP participates in intracellular fatty acid transport and facilitates fatty acid oxidation (Nuño-lámbarri et al., 2016). Previous authors, have found that FABP1 is downregulated in cows with severe negative energy balance as well as early postpartum cows and propose that this may limit long chain fatty acid β-oxidation and result in the accumulation of hepatic triacylglycerols (Loor, 2010; McCarthy et al., 2010; Guzmán et al., 2013; Albrecht et al., 2019). Indeed, previous studies have shown that FABP1 mRNA expression was downregulated in cows during early lactation or under physiological imbalance (Loor, 2010; Moyes et al., 2013). Additionally, in mice models, targeted deletion of FABP1 has shown to induce hepatic triglyceride accumulation (Nassir and Ibdah, 2014).
Finally, toward mid to late lactation, both groups had similar and low levels of lipid mobilization as plasma BHB, NEFA, and liver triglyceride reach pre-partum levels. However, PPARA and CPT1A expression increases from 110 to 250 DIM, probably unrelated to mobilization of body reserves.
Associated to early lactation negative energy balance, we previously found an impairment in mitochondrial function in early lactation in G1 vs. G0 cows (García-Roche et al., 2019), this could lead to an increase in AMP to ATP ratios promoting the phosphorylation and activation of the energy sensing AMPK (Jenkins et al., 2013; Hardie, 2018; Herzig and Shaw, 2018). Regarding adiponectin and leptin, that have also been reported as activators of the AMPK pathway (Kelly et al., 2006; Ohtani et al., 2012; Yamauchi et al., 2014; Gamberi et al., 2018), we observed that the plasma levels of these hormones did not differ during lactation; while the expression of the receptors LEPR and ADIPOR1 differed or tended to differ, respectively, during lactation probably increased sensibility to these hormones. However, we did not observe a correlation between ADIPOR1 or LEPR mRNA and pAMPK to AMPK.
The AMPK also phosphorylates and activates PGC1-α. Alongside AMPK is SIRT1, that is activated by an AMPK-dependent increase in NAD+ levels. The SIRT1 deacetylates PGC1-α and further stimulates the activity of this transcription factor coactivator (Cantó and Auwerx, 2009), the positive correlation between hepatic SIRT1 and PPARGC1A mRNA in our study is suggestive of the interplay between these two molecules. Besides AMPK promotes the activation of transcription factor EB that directly binds the promoter and activates the transcription of the PPARGC1A gene (Herzig and Shaw, 2018). In agreement, both AMPK phosphorylation and hepatic expression of the PPARGC1A were higher (P < 0.05) at 35 than 250 DIM.
The transcriptional coactivator PGC-1α interacts with transcription factors, such as forkhead box protein O1, glucocorticoid receptor, and hepatocyte nuclear factor 4 alpha, promoting the transcription of gluconeogenic genes in the liver in response to several hormones (Herzig et al., 2001; Yoon et al., 2001; Puigserver et al., 2003; Rowe and Arany, 2014). In particular, the transcriptional coactivator PGC-1α regulates glucose metabolism inducing G6PC and PCK1 transcription and increasing gluconeogenesis and glucose production from pyruvate (Herzig et al., 2001; Yoon et al., 2001; Puigserver et al., 2003; Rodgers et al., 2005; Rowe and Arany, 2014). Moreover, SIRT1 is required for the PGC-1α regulation of these gluconeogenic genes (Rodgers et al., 2005). In this sense, our results showed an increase in both G6PC and PCK1 mRNA levels in early lactation with respect to mid and late lactation which positively correlate with PPARGC1A expression, suggesting that the increase in gluconeogenesis and glucose output in early lactation might be regulated by the AMPK/SIRT1/PGC-1α axis. Increases in the expression of G6PC and PCK1 during early lactation have been reported by others (Aschenbach et al., 2010), our results contribute to elucidate the factors regulating gluconeogenesis in the dairy cow.
However, when assessing the first steps of gluconeogenesis, related to the point of entry of gluconeogenic precursors, we found that the pAMPK to AMPK ratio correlated negatively with hepatic PC mRNA expression levels and especially during early lactation, pyruvate is formed from alternative gluconeogenic precursors, other than propionate (Aschenbach et al., 2010). Gluconeogenesis from alternative precursors is a costly adaptation for the metabolism of the dairy cow since it requires the mobilization of reserves instead of utilizing dietary propionate, hence we hypothesize that the AMPK pathway may be inhibiting PC mRNA expression in order to inhibit gluconeogenesis driven by non-propionate precursors (Winder et al., 2000; Zhou et al., 2001; Hardie et al., 2017). Three promoters drive the transcription of PC in bovine liver, in response to nutritional and environmental stimuli (Aschenbach et al., 2010). Putative binding sites for transcription factors nuclear factor-Y, and TATA binding protein (TBP) and Sp1/Sp3, have been identified (Aschenbach et al., 2010) in these promoters. Interestingly Sp1 is reported to undergo several post-translational modifications, including phosphorylation and acetylation (Chang and Hung, 2012). Besides, both AMPK activation and SIRT1 overexpression are reported to reduce Sp1 levels in mouse and human liver cells, respectively (Yie et al., 2014; Rada et al., 2018). Thus, Sp1 might link AMPK activation with PC expression, though this remains to be investigated. On the other hand, we found both SIRT1 and PPARGC1A mRNA were positively associated with the hepatic expression of the gluconeogenic gene, MMUT suggesting that the SIRT1/PGC-1α axis could be favoring gluconeogenesis from propionate in early lactation.
The AMPK also has an effect on lipid metabolism (Hardie, 2018; Herzig and Shaw, 2018). In this sense, we observed AMPK activation was increased during early lactation when levels of NEFA, BHB, and liver triglycerides were elevated compared to late lactation, this is in accordance with other authors that have found an increase in AMPK phosphorylation in bovine hepatocytes treated with increasing doses of BHB and acetic acid (Li et al., 2013; Deng et al., 2015). Also, AMPK has been reported to increase the expression of PPARA which in turn upregulates the expression of lipid oxidation genes CPT1A, HMGCS2, FABP1 (Guzmán et al., 2013; Khan et al., 2014; Grabacka et al., 2016; Li et al., 2020). In fact, we found a positive correlation between the pAMPK to AMPK ratio and mRNA HMGCS2 expression. In addition to this, PPARGC1A, mRNA expression levels were also positively associated with the expression of HMGCS2 mRNA. Hence AMPK could be using PGC-1α as its effector in order to alter the expression of fatty acid oxidation genes (Finck and Kelly, 2006; Cantó and Auwerx, 2009).
The coactivator PGC-1α interacts with PPARA and contributes to the transcriptional control of genes encoding fatty acid oxidation enzymes (Vega et al., 2000; Finck and Kelly, 2006; Gastaldi et al., 2007; Gerhart-Hines et al., 2007; Song et al., 2010) and indeed we found a positive association between these two factors. In the liver, PPARA is proposed to be activated by fatty acids to induce enzymes related to peroxisomal and mitochondrial fatty acid oxidation and ketogenesis (Schoonjans et al., 1996; Drackley, 1999). Our results are consistent with these findings given the positive association between hepatic mRNA expression levels of PPARA and CPT1A and HMGCS2. Previous studies in dairy cows have shown inconsistent results regarding PPARA mRNA expression levels, on one hand, PPARA mRNA remained unchanged when cows consumed more than 100% their energy requirements (Carriquiry et al., 2009; Khan et al., 2014). On the other hand, its expression decreased continuously after parturition (Han van der Kolk et al., 2017), which is consistent with our findings that PPARA was upregulated during 35 DIM and downregulated during 110 DIM, however its increased expression during 250 DIM is a novel result suggesting a metabolic response related to heat stress which may shift metabolism toward lipolysis and inhibition of insulin-mediated lipogenesis and glucose utilization (Baumgard and Rhoads, 2012).
Additionally, the negative correlation (r = −0.50 and P < 0.01) between hepatic expression of SIRT1 studied in this work and protein acetylation in liver homogenates observed in García-Roche et al. (2019), suggests a possible regulatory effect of SIRT1 on protein deacetylation (García-Roche et al., 2019). Deacetylation of PGC-1α mediated by SIRT1 has been shown to activate PPARA with the consequent transcription mitochondrial fatty acid oxidation genes (Purushotham et al., 2009). Indeed, in this work hepatic SIRT1 and CPT1A expression positively correlated (r = 0.41 and P < 0.01), and although no correlation was confirmed between PPARGC1A and CPT1A mRNA expression levels, PGC-1α could have been activated by deacetylation and not increased expression, as aforementioned.
Conclusion
In sum, this work elucidates plausible regulatory mechanisms for hepatic glucose and fatty acid metabolism during lactation in TMR vs. grazing dairy cows. Our results confirm the extreme energy demands and synchronized metabolic adaptations imposed by lactogenesis during early lactation, especially in grazing dairy cows.
In addition, we found an implication of AMPK, PGC-1α, and SIRT1 in the regulation of the gluconeogenic pathway; as well as in a PPARA dependent regulation of fatty acid oxidation. Mechanistic information on whole lactation phenomena, presented in this study, could be useful to assertively manage dairy cattle nutrition.
Data Availability Statement
The datasets presented in this study can be found in online repositories. The names of the repository/repositories and accession number(s) can be found in the article/Supplementary Material.
Ethics Statement
The animal study was reviewed and approved by Animal use and procedures were approved by the Animal Experimentation Committee (CHEA) of the Universidad de la República, Uruguay (file number: 021130-001914-15).
Author Contributions
MG-R conceived and designed lab experiments, performed field and lab experiments, analyzed the results, and wrote the original draft and revised versions of the manuscript. MCa conceptualized and designed field experiment, conceived and designed lab experiments, supervised field and lab experiments and results analyses, obtained funding and administrated the project, and reviewed and edited the manuscript. CQ conceived, designed and supervised lab experiments, and reviewed and edited the manuscript. ACass conceived, designed, and supervised lab experiments. DM conceptualized and designed field experiment and obtained funding. ACasa and GC performed field and lab experiments. MCe and AJ participated in field experiments and sample collection. All authors reviewed the manuscript and approved the final version of the manuscript.
Funding
This study was supported by the Agencia Nacional de Investigación e Innovación (ANII) (FSA_1_2013_1_12612). MG-R was supported by ANII fellowship POS_NAC_2015_1_110049. ACass and CQ were partially funded by grants of the Espacio Interdisciplinario—Centros, UDELAR 2015. ACass was also supported by the grant CSIC grupos I+D 2014 (767).
Conflict of Interest
The authors declare that the research was conducted in the absence of any commercial or financial relationships that could be construed as a potential conflict of interest.
Acknowledgments
We would like to thank the staff from the Experimental Station Dr. Mario A. Cassinoni (EEMAC) for their support in animal handling.
Supplementary Material
The Supplementary Material for this article can be found online at: https://www.frontiersin.org/articles/10.3389/fanim.2021.622500/full#supplementary-material
References
Adewuyi, A. A., Gruysi, E., and Van Eerdenburg, F. J. C. M. (2005). Non esterified fatty acids (NEFA) in dairy cattle. A review. Vet. Q. 27, 117–126. doi: 10.1080/01652176.2005.9695192
Adrien, M. L., Mattiauda, D. A., Artegoitia, V., Carriquiry, M., Motta, G., Bentancur, O., et al. (2012). Nutritional regulation of body condition score at the initiation of the transition period in primiparous and multiparous dairy cows under grazing conditions: milk production, resumption of post-partum ovarian cyclicity and metabolic parameters. Animal 6, 292–299. doi: 10.1017/S175173111100142X
Albrecht, D., Kuhla, S., and Metges, C. C. (2019). Proteome analysis of fatty liver in feed-deprived dairy cows reveals interaction of fuel sensing, calcium, fatty acid, and glycogen metabolism. Physiol. Genomics 37, 88–98. doi: 10.1152/physiolgenomics.90381.2008
Aschenbach, J. R., Kristensen, N. B., Donkin, S. S., Hammon, H. M., and Penner, G. B. (2010). Gluconeogenesis in dairy cows: the secret of making sweet milk from sour dough. IUBMB Life 62, 869–877. doi: 10.1002/iub.400
Astessiano, A., Carriquiry, M., Mattiauda, D., Adrien, M., Chilibroste, P., and Meikle, A. (2017). Endometrial gene expression in primiparous dairy cows at the end of the voluntary waiting period is affected by nutrition: total mixed ration vs increasing levels of herbage allowance. Reprod. Domest. Anim. 1, 1–8. doi: 10.1111/rda.12981
Astessiano, A. L., Meikle, A., Fajardo, M., Gil, J., Mattiauda, D. A., Chilibroste, P., et al. (2015). Metabolic and endocrine profiles and hepatic gene expression of Holstein cows fed total mixed ration or pasture with different grazing strategies during early lactation. Acta Vet. Scand. 57, 1–12. doi: 10.1186/s13028-015-0163-6
Bancroft, G., and Fry, E. G. (1933). Adsorption and hydrolysis of glycogen. J. Biol. Chem. 100, 255–265.
Bargo, F., Muller, L. D., Delahoy, J. E., and Cassidy, T. W. (2002). Performance of high producing dairy cows with three different feeding systems combining pasture and total mixed rations. J. Dairy Sci. 85, 2948–2963. doi: 10.3168/jds.S0022-0302(02)74381-6
Bauman, D. E. (2000). “Regulation of nutrient partitioning during lactation: homeostais and homeorhesis revisited,” in Ruminant Physiology, ed P. Cronje (Oxon: CABI Publishing), 311–329.
Baumgard, L. H., and Rhoads, R. P. (2012). Ruminant production and metabolic responses to heat stress. J. Anim. Sci. 90, 1855–1865. doi: 10.2527/jas.2011-4675
Baumgard, L. H., Wheelock, J. B., Sanders, S. R., Moore, C. E., Green, H. B., Waldron, M. R., et al. (2011). Postabsorptive carbohydrate adaptations to heat stress and monensin supplementation in lactating Holstein cows. J. Dairy Sci. 94, 5620–5633. doi: 10.3168/jds.2011-4462
Bell, A. W., and Bauman, D. E. (1997). Adaptations of glucose metabolism during pregnancy and lactation. J. Mammary Gland Biol. Neoplasia 2, 265–278. doi: 10.1023/A:1026336505343
Bradford, M. M. (1976). A rapid and sensitive method for the quantitation of microgram quantities of protein utilizing the principle of protein-dye binding. Anal. Biochem. 72, 248–254. doi: 10.1016/0003-2697(76)90527-3
Buckley, F., Dillon, P., Rath, M., and Veerkamp, R. F. (2000). The relationship between genetic merit for yield and live weight, condition score, and energy balance of spring calving Holstein Friesian dairy cows on grass based systems of milk production. J. Dairy Sci. 83, 1878–1886. doi: 10.3168/jds.S0022-0302(00)75060-0
Cantó, C., and Auwerx, J. (2009). PGC-1α, SIRT1 and AMPK, an energy sensing network that controls energy expenditure. Curr. Opin. Lipidol. 20, 98–105. doi: 10.1097/MOL.0b013e328328d0a4
Carriquiry, M., Weber, W. J., Fahrenkrug, S. C., and Crooker, B. A. (2009). Hepatic gene expression in multiparous Holstein cows treated with bovine somatotropin and fed n-3 fatty acids in early lactation. J. Dairy Sci. 92, 4889–4900. doi: 10.3168/jds.2008-1676
Chang, W. C., and Hung, J. J. (2012). Functional role of post-translational modifications of Sp1 in tumorigenesis. J. Biomed. Sci. 19, 1–7. doi: 10.1186/1423-0127-19-94
Chilibroste, P., Gibb, M. J., and Tamminga, S. (2005). “Pasture characteristics and animal performance,” in Quantitative Aspects of Ruminant Digestion and Metabolism, eds J. Dijkstra, J. Forbes, and J. France (Wageningen: CAB International), 681–706. doi: 10.1079/9780851998145.0000
Chilibroste, P., Mattiauda, D. A., Bentancur, O., Soca, P., and Meikle, A. (2012). Effect of herbage allowance on grazing behavior and productive performance of early lactation primiparous Holstein cows. Anim. Feed Sci. Technol. 173, 201–209. doi: 10.1016/j.anifeedsci.2012.02.001
Chilliard, Y., Bauchart, D., Barnouin, J., Duboisset, F., Flechet, J., and Charcornac, J. P. (1984). Determination of plasma non-esterified fatty acids in herbivores and man : a comparison of values obtained by manual or automatic chromatographic, titrimetric, colorimetric and enzymatic methods. Reprod. Nutr. Dev. 24, 469–482. doi: 10.1051/rnd:19840412
Chung, Y., Brown, N. E., Martinez, C. M., Cassidy, T. W., and Varga, G. A. (2009). Effects of rumen-protected choline and dry propylene glycol on feed intake and blood parameters for Holstein dairy cows in early lactation. J. Dairy Sci. 92, 2729–2736. doi: 10.3168/jds.2008-1299
Corbin, K. D., and Zeisel, S. H. (2013). Choline metabolism provides novel insights into nonalcoholic fatty liver disease and its progression. Curr. Opin. Gastroenterol. 28, 159–165. doi: 10.1097/MOG.0b013e32834e7b4b.Choline
De Koster, J. D., and Opsomer, G. (2013). Insulin resistance in dairy cows. Vet. Clin. North Am. Food Anim. Pract. 29, 299–322. doi: 10.1016/j.cvfa.2013.04.002
Deng, Q., Liu, G., Liu, L., Zhang, Y., Yin, L., Shi, X., et al. (2015). BHBA influences bovine hepatic lipid metabolism via AMPK signaling pathway. J. Cell. Biochem. 116, 1070–1079. doi: 10.1002/jcb.25062
Drackley, J. K. (1999). Biology of dairy cows during the transition period: the final frontier? J. Dairy Sci. 82, 2259–2273. doi: 10.3168/jds.S0022-0302(99)75474-3
Edmonson, A. J., Lean, I. J., Weaver, L. D., Farver, T., and Webster, G. (1989). A body condition scoring chart for holstein dairy cows. J. Dairy Sci. 72, 68–78. doi: 10.3168/jds.S0022-0302(89)79081-0
Ehrhardt, R. A., Slepetis, R. M., Siegal-Willott, J., Van Amburgh, M. E., Bell, A. W., and Boisclair, Y. R. (2000). Development of a specific radioimmunoassay to measure physiological changes of circulating leptin in cattle and sheep. J. Endocrinol. 166, 519–528. doi: 10.1677/joe.0.1660519
Finck, B. N., and Kelly, D. P. (2006). PGC-1 coactivators : inducible regulators of energy metabolism in health and disease Find the latest version : review series PGC-1 coactivators : inducible regulators of energy metabolism in health and disease. J. Clin. Invest. 116, 615–622. doi: 10.1172/JCI27794.PGC-1
Gamberi, T., Magherini, F., Modesti, A., and Fiaschi, T. (2018). Adiponectin signaling pathways in liver diseases. Biomedicines 6:52. doi: 10.3390/biomedicines6020052
García-Roche, M., Casal, A., Mattiauda, D. A., Ceriani, M., Jasinsky, A., Mastrogiovanni, M., et al. (2019). Impaired hepatic mitochondrial function during early lactation in dairy cows: association with protein lysine acetylation. PLoS ONE 14:e213780. doi: 10.1371/journal.pone.0213780
Gastaldi, G., Russell, A., Golay, A., Giacobino, J. P., Habicht, F., Barthassat, V., et al. (2007). Upregulation of peroxisome proliferator-activated receptor gamma coactivator gene (PGC1A) during weight loss is related to insulin sensitivity but not to energy expenditure. Diabetologia 50, 2348–2355. doi: 10.1007/s00125-007-0782-1
Gerhart-Hines, Z., Rodgers, J. T., Bare, O., Lerin, C., Kim, S.-H., Mostoslavsky, R., et al. (2007). Metabolic control of muscle mitochondrial function and fatty acid oxidation through SIRT1/PGC-1α. EMBO J. 26, 1913–1923. doi: 10.1038/sj.emboj.7601633
Grabacka, M., Pierzchalska, M., Dean, M., and Reiss, K. (2016). Regulation of ketone body metabolism and the role of PPARα. Int. J. Mol. Sci. 17:2093. doi: 10.3390/ijms17122093
Greenfield, R. B., Cecava, M. J., and Donkin, S. S. (2000). Changes in mRNA expression for gluconeogenic enzymes in liver of dairy cattle during the transition to lactation. J. Dairy Sci. 83, 1228–1236. doi: 10.3168/jds.S0022-0302(00)74989-7
Gregorini, P., Villalba, J. J., Chilibroste, P., and Provenza, F. D. (2017). Grazing management: setting the table, designing the menu and influencing the diner. Anim. Prod. Sci. 57, 1248–1268. doi: 10.1071/AN16637
Grum, D. E., Drackley, J. K., Younker, R. S., LaCount, D. W., and Veenhuizen, J. J. (1996). Nutrition during the dry period and hepatic lipid metabolism of periparturient dairy cows. J. Dairy Sci. 79, 1850–1864. doi: 10.3168/jds.S0022-0302(96)76553-0
Guzmán, C., Benet, M., Pisonero-Vaquero, S., Moya, M., García-Mediavilla, M. V., Martínez-Chantar, M. L., et al. (2013). The human liver fatty acid binding protein (FABP1) gene is activated by FOXA1 and PPARα; And repressed by C/EBPα: implications in FABP1 down-regulation in nonalcoholic fatty liver disease. Biochim. Biophys. Acta Mol. Cell Biol. Lipids 1831, 803–818. doi: 10.1016/j.bbalip.2012.12.014
Han van der Kolk, J. H., Gross, J. J., Gerber, V., and Bruckmaier, R. M. (2017). Disturbed bovine mitochondrial lipid metabolism: a review. Vet. Q. 37, 262–273. doi: 10.1080/01652176.2017.1354561
Hardie, D. G. (2018). Keeping the home fires burning: AMP-activated protein kinase. J. R. Soc. Interface 15:20170774. doi: 10.1098/rsif.2017.0774
Hardie, L. C., VandeHaar, M. J., Tempelman, R. J., Weigel, K. A., Armentano, L. E., Wiggans, G. R., et al. (2017). The genetic and biological basis of feed efficiency in mid-lactation Holstein dairy cows. J. Dairy Sci. 100, 9061–9075. doi: 10.3168/jds.2017-12604
Herzig, S., Long, F., Jhala, U. S., Hedrick, S., Quinn, R., Bauer, A., et al. (2001). CREB regulates hepatic gluconeogenesis through the coactivator PGC-1. Nature 413, 179–183. doi: 10.1038/35093131
Herzig, S., and Shaw, R. J. (2018). AMPK: guardian of metabolism and mitochondrial homeostasis. Nat. Rev. Mol. Cell Biol. 19, 121–135. doi: 10.1038/nrm.2017.95
Holtenius, P., and Holtenius, K. (2007). A model to estimate insulin sensitivity in dairy cows. Acta Vet. Scand. 49, 3–5. doi: 10.1186/1751-0147-49-29
Ingvartsen, K. L. (2006). Feeding- and management-related diseases in the transition cow: physiological adaptations around calving and strategies to reduce feeding-related diseases. Anim. Feed Sci. Technol. 126, 175–213. doi: 10.1016/j.anifeedsci.2005.08.003
Ingvartsen, K. L., and Moyes, K. (2013). Nutrition, immune function and health of dairy cattle. Animal 7, 112–122. doi: 10.1017/S175173111200170X
Jasinsky, A., Mattiauda, D. A., Ceriani, M., Casal, A., and Carriquiry, M. (2019). Heat production and body composition of primiparous Holstein cows with or without grazing pastures in early lactation. Livest. Sci. 225, 1–7. doi: 10.1016/j.livsci.2019.04.017
Jayaprakash, G., Sathiyabarathi, M., Robert, M. A., and Tamilmani, T. (2016). Rumen-protected choline : a significance effect on dairy cattle nutrition. Vet. World. 9, 837–841. doi: 10.14202/vetworld.2016.837-841
Jenkins, Y., Sun, T., Markovtsov, V., Foretz, M., Li, W., Nguyen, H., et al. (2013). AMPK activation through mitochondrial regulation results in increased substrate oxidation and improved metabolic parameters in models of diabetes. PLoS ONE 8:e81870. doi: 10.1371/journal.pone.0081870
Johnson, H., Kibler, H., Ragsdale, A., Berry, I., and Shanklin (1961). Role of heat tolerance and production level in response of lactating Holsteins to various temperature-humidity conditions. J. Dairy Sci. 44:1191.
Kelly, M., Ruderman, N. B., and Tomas, E. (2006). AMP-activated protein kinase and its regulation by adiponectin and interleukin-6. Scand. J. Food Nutr. 50, 85–91. doi: 10.1080/17482970601076305
Khan, M. J., Jacometa, C. B., Graugnard, D. E., Correa, M. N., Schmitt, E., Cardoso, F., et al. (2014). Overfeeding dairy cattle during late-pregnancy alters hepatic PPARα-regulated pathways including hepatokines: impact on metabolism and peripheral insulin sensitivity. Gene Regul. Syst. Bio. 8, 97–111. doi: 10.4137/GRSB.S1971
Kolver, E. S., and Muller, L. D. (1998). Performance and nutrient intake of high producing Holstein cows consuming pasture or a total mixed ration. J. Dairy Sci. 81, 1403–1411. doi: 10.3168/jds.S0022-0302(98)75704-2
Kristensen, N. B. (2005). Splanchnic metabolism of volatile fatty acids in the dairy cow. Anim. Sci. 80, 3–10. doi: 10.1079/ASC41250003
Larsen, M., and Kristensen, N. B. (2013). Precursors for liver gluconeogenesis in periparturient dairy cows. Animal 7, 1640–1650. doi: 10.1017/S1751731113001171
Laubenthal, L., Ruda, L., Sultana, N., Winkler, J., Rehage, J., Meyer, U., et al. (2016). Effect of increasing body condition on key regulators of fat metabolism in subcutaneous adipose tissue depot and circulation of nonlactating dairy cows. J. Dairy Sci. Sci. 100, 4976–4986. doi: 10.3168/jds.2014-8710
Li, X., Chen, H., Guan, Y., Li, X., Lei, L., Liu, J., et al. (2013). Acetic acid activates the amp-activated protein kinase signaling pathway to regulate lipid metabolism in bovine hepatocytes. PLoS ONE 8:e67880. doi: 10.1371/journal.pone.0067880
Li, Y., Zou, S., Ding, H., Hao, N., Huang, Y., Tang, J., et al. (2020). Low expression of sirtuin 1 in the dairy cows with mild fatty liver alters hepatic lipid metabolism. Animals 10:560. doi: 10.3390/ani10040560
Loor, J. J. (2010). Genomics of metabolic adaptations in the peripartal cow. Animal 4, 1110–1139. doi: 10.1017/S1751731110000960
Mattiauda, D. A., Tamminga, S., Gibb, M. J., Soca, P., Bentancur, O., and Chilibroste, P. (2013). Restricting access time at pasture and time of grazing allocation for Holstein dairy cows: ingestive behaviour, dry matter intake and milk production. Livest. Sci. 152, 53–62. doi: 10.1016/j.livsci.2012.12.010
McArt, J. A. A., Nydam, D. V., Oetzel, G. R., Overton, T. R., and Ospina, P. A. (2013). Elevated non-esterified fatty acids and β-hydroxybutyrate and their association with transition dairy cow performance. Vet. J. 198, 560–570. doi: 10.1016/j.tvjl.2013.08.011
McCarthy, S. D., Waters, S. M., Kenny, D. A., Diskin, M. G., Fitzpatrick, R., Patton, J., et al. (2010). Negative energy balance and hepatic gene expression patterns in high-yielding dairy cows during the early postpartum period: a global approach. Physiol. Genomics 42A, 188–199. doi: 10.1152/physiolgenomics.00118.2010
Meikle, A., Adrien, M., de, L., Mattiauda, D. A., and Chilibroste, P. (2013). Effect of sward condition on metabolic endocrinology during the early postpartum period in primiparous grazing dairy cows and its association with productive and reproductive performance. Anim. Feed Sci. Technol. 186, 139–147. doi: 10.1016/j.anifeedsci.2013.10.003
Moyes, K. M., Bendixen, E., Codrea, M. C., and Ingvartsen, K. L. (2013). Identification of hepatic biomarkers for physiological imbalance of dairy cows in early and mid lactation using proteomic technology. J. Dairy Sci. 96, 3599–3610. doi: 10.3168/jds.2012-5900
Nassir, F., and Ibdah, J. (2014). Role of mitochondria in nonalcoholic fatty liver disease. Int. J. Mol. Sci. 15, 8713–8742. doi: 10.3390/ijms15058713
National Research Council (2001). Nutrient Requirements of Dairy Cattle: Seventh Revised Edition, 2001. Washington, DC: The National Academies Press. doi: 10.17226/9825
Niehoff, I.-D., Huther, L., and Lebzien, P. (2009). Niacin for dairy cattle: a review. Br. J. Nutr. 101, 5–19. doi: 10.1017/S.0007114508043377
Nuño-lámbarri, N., Barbero-becerra, V. J., and Uribe, M. (2016). Mitochondrial molecular pathophysiology of nonalcoholic fatty liver disease : a proteomics approach. Int. J. Mol. Sci. 17:281. doi: 10.3390/ijms17030281
Ohtani, Y., Takahashi, T., Sato, K., Ardiyanti, A., Song, S. H., Sato, R., et al. (2012). Changes in circulating adiponectin and metabolic hormone concentrations during periparturient and lactation periods in Holstein dairy cows. Anim. Sci. J. 83, 788–795. doi: 10.1111/j.1740-0929.2012.01029.x
Panda, S., Panda, N., Panigrahy, K. K., Gupta, S. K., Mishra, S. P., and Laishram, M. (2017). Role of niacin supplementation in dairy cattle: a review. Asian J. Dairy Food Res. 36, 93–99. doi: 10.18805/ajdfr.v36i02.7949
Pfaffl, M. W. (2004). “Quantification strategies in real-time polymerase chain reaction,” in A–Z of Quantitative PCR, ed S. A. Bustin (La Jolla, CA: International University Lane), 89–113. doi: 10.21775/9781912530243.05
Pinotti, L., Baldi, A., Politis, I., Rebucci, R., Sangalli, L., and Orto, V. D. (2003). Rumen-protected choline administration to transition cows : effects on milk production and vitamin E status. J. Vet. Med. A 21, 18–21. doi: 10.1046/j.1439-0442.2003.00502.x
Porter, W. H., Yao, H. H., and Karounos, D. G. (1997). Laboratory and clinical evaluation of assays for beta-hydroxybutyrate. Am. J. Clin. Pathol. 107, 353–358. doi: 10.1093/ajcp/107.3.353
Puigserver, P., Rhee, J., Donovan, J., Walkey, C. J., Yoon, J. C., Oriente, F., et al. (2003). Insulin-regulated hepatic gluconeogenesis through FOXO1-PGC-1α interaction. Nature 423, 550–555. doi: 10.1038/nature01667
Purushotham, A., Schug, T. T., Xu, Q., Surapureddi, S., Guo, X., and Li, X. (2009). Hepatocyte-specific deletion of SIRT1 alters fatty acid metabolism and results in hepatic steatosis and inflammation. Cell Metab. 9, 327–338. doi: 10.1016/j.cmet.2009.02.006
Rada, P., Pardo, V., Mobasher, M. A., García-Martínez, I., Ruiz, L., González-Rodríguez, Á., et al. (2018). SIRT1 controls acetaminophen hepatotoxicity by modulating inflammation and oxidative stress. Antioxidants Redox Signal. 28, 1187–1208. doi: 10.1089/ars.2017.7373
Rhoads, R. P., La Noce, A. J., Wheelock, J. B., and Baumgard, L. H. (2011). Short communication: alterations in expression of gluconeogenic genes during heat stress and exogenous bovine somatotropin administration. J. Dairy Sci. 94, 1917–1921. doi: 10.3168/jds.2010-3722
Roche, J. R., Bell, A. W., Overton, T. R., and Loor, J. J. (2013). Nutritional management of the transition cow in the 21st century-a paradigm shift in thinking. Anim. Prod. Sci. 53, 1000–1023. doi: 10.1071/AN12293
Roche, J. R., Berry, D. P., Bryant, A. M., Burke, C. R., Butler, S. T., Dillon, P. G., et al. (2017). A 100-year review : a century of change in temperate grazing dairy systems 1. J. Dairy Sci. 100, 10189–10233. doi: 10.3168/jds.2017-13182
Rodgers, J. T., Lerin, C., Haas, W., Gygi, S. P., Spiegelman, B. M., and Puigserver, P. (2005). Nutrient control of glucose homeostasis through a complex of PGC-1a and SIRT1. Nature 434, 113–118. doi: 10.1038/nature03314.1
Rowe, G. C., and Arany, Z. (2014). Genetic models of PGC-1 and glucose metabolism and homeostasis. Rev. Endocr. Metab. Disord. 15, 21–29. doi: 10.1007/s11154-013-9273-5
Schoonjans, K., Staels, B., and Auwerx, J. (1996). The peroxisome proliferator activated receptors (PPARs) and their effects on lipid metabolism and adipocyte differentiation. Biochim. Biophys. Acta Lipids Lipid Metab. 1302, 93–109. doi: 10.1016/0005-2760(96)00066-5
Song, S., Attia, R. R., Connaughton, S., Niesem, M. I., Ness, G. C., Elam, M. B., et al. (2010). Peroxisome proliferator activated receptor α (PPARα) and PPAR gamma coactivator (PGC-1α) induce carnitine palmitoyltransferase IA (CPT-1A) via independent gene elements. Mol. Cell Endrocinol. 325, 54–63. doi: 10.1038/jid.2014.371
Thorn, S. R., Ehrhardt, R. A., Butler, W. R., Quirk, S. M., and Boisclair, Y. R. (2008). Insulin regulates hepatic leptin receptor expression in early lactating dairy cows. Am. J. Physiol. Regul. Integr. Comp. Physiol. 295, R1455–R1462. doi: 10.1152/ajpregu.90546.2008
Veerkamp, R. F., Simm, G., and Oldham, J. D. (1994). Effects of interaction between genotype and feeding system on milk production, feed intake, efficiency and body tissue mobilization in dairy cows. Livest. Prod. Sci. 39, 229–241. doi: 10.1016/0301-6226(94)90202-X
Vega, R. B., Huss, J. M., and Kelly, D. P. (2000). The coactivator PGC-1 cooperates with peroxisome proliferator-activated receptor α in transcriptional control of nuclear genes encoding mitochondrial fatty acid oxidation enzymes. Mol. Cell. Biol. 20, 1868–1876. doi: 10.1128/mcb.20.5.1868-1876.2000
Wales, W. J., Marett, L. C., Greenwood, J. S., Wright, M. M., Thornhill, J. B., Jacobs, J. L., et al. (2013). Use of partial mixed rations in pasture-based dairying in temperate regions of Australia. Anim. Prod. Sci. 53, 1167–1178. doi: 10.1071/AN13207
Wheelock, J. B., Rhoads, R. P., VanBaale, M. J., Sanders, S. R., and Baumgard, L. H. (2010). Effects of heat stress on energetic metabolism in lactating Holstein cows. J. Dairy Sci. 93, 644–655. doi: 10.3168/jds.2009-2295
Winder, W. W., Holmes, B. F., Rubink, D. S., Jensen, E. B., Chen, M., and Holloszy, J. O. (2000). Activation of AMP-activated protein kinase increases mitochondrial enzymes in skeletal muscle. J. Appl. Physiol. 88, 2219–2226. doi: 10.1152/jappl.2000.88.6.2219
Yamauchi, T., Iwabu, M., Okada-Iwabu, M., and Kadowaki, T. (2014). Adiponectin receptors: a review of their structure, function and how they work. Best Pract. Res. Clin. Endocrinol. Metab. 28, 15–23. doi: 10.1016/j.beem.2013.09.003
Yie, Y., Zhao, S., Tang, Q., Zheng, F., Wu, J., Yang, L. J., et al. (2014). Ursolic acid inhibited growth of hepatocellular carcinoma HepG2 cells through AMPKα-mediated reduction of DNA methyltransferase 1. Mol. Cell. Biochem. 402, 63–74. doi: 10.1007/s11010-014-2314-x
Yoon, J. C., Puigserver, P., Chen, G., Donovan, J., Wu, Z., Rhee, J., et al. (2001). Control of hepatic gluconeogenesis through the transcriptional coaotivator PGC-1. Nature 413, 131–138. doi: 10.1038/35093050
Zhou, G., Goodyear, L. J., Moller, D. E., Zhou, G., Myers, R., Li, Y., et al. (2001). Role of AMP-activated protein kinase in mechanism of metformin action Find the latest version : role of AMP-activated protein kinase in mechanism of metformin action. J. Clin. Invest. 108, 1167–1174. doi: 10.1172/JCI200113505
Keywords: AMPK, sirtuin 1, PGC1A, PPARA, dairy cows, grazing
Citation: García-Roche M, Cañibe G, Casal A, Mattiauda DA, Ceriani M, Jasinsky A, Cassina A, Quijano C and Carriquiry M (2021) Glucose and Fatty Acid Metabolism of Dairy Cows in a Total Mixed Ration or Pasture-Based System During Lactation. Front. Anim. Sci. 2:622500. doi: 10.3389/fanim.2021.622500
Received: 28 October 2020; Accepted: 10 February 2021;
Published: 01 March 2021.
Edited by:
Todd Riley Callaway, University of Georgia, United StatesReviewed by:
Priscilla Dutra Teixeira, Universidade Federal de Lavras, BrazilJeferson Menezes Lourenco, University of Georgia, United States
Copyright © 2021 García-Roche, Cañibe, Casal, Mattiauda, Ceriani, Jasinsky, Cassina, Quijano and Carriquiry. This is an open-access article distributed under the terms of the Creative Commons Attribution License (CC BY). The use, distribution or reproduction in other forums is permitted, provided the original author(s) and the copyright owner(s) are credited and that the original publication in this journal is cited, in accordance with accepted academic practice. No use, distribution or reproduction is permitted which does not comply with these terms.
*Correspondence: Mercedes García-Roche, bWVyY2VkZXNnQGZhZ3JvLmVkdS51eQ==