 Pablo Arechavala-Lopez
 Martin J. Lankheet
 Carlos Díaz-Gil
 Wout Abbink4
 Arjan P. Palstra
- 1Fish Ethology and Welfare Group, Centro de Ciencias do Mar (CCMAR), Faro, Portugal
- 2Experimental Zoology Group, Animal Sciences, Wageningen University & Research, Wageningen, Netherlands
- 3Xelect Ltd., St. Andrews, United Kingdom
- 4Wageningen University & Research Animal Breeding and Genomics, Wageningen Livestock Research, Wageningen, Netherlands
Acoustic transmitters equipped with accelerometer sensors are considered a useful tool to study swimming activity, including energetics and movement patterns, of fish species in aquaculture and in nature. However, given the novelty of this technique, further laboratory-derived calibrations are needed to assess the characteristics and settings of accelerometer acoustic transmitters for different species and specific environmental conditions. In this study, we compared accelerometer acoustic transmitter outputs with swimming performance and body motion of gilthead seabream (Sparus aurata L.) in swim-tunnels at different flow speeds, which allowed us to characterize the swimming activity of this fish species of high aquaculture interest. Tag implantation in the abdominal cavity had no significant effects on swimming performance and body motion parameters. Accelerations, cost of transport and variations on head orientation (angle with respect to flow direction) were negatively related to flow speed in the tunnel, whereas oxygen consumption and frequencies of tail-beat and head movements increased with flow speed. These results show that accelerometer acoustic transmitters mainly recorded deviations from sustained swimming in the tunnel, due to spontaneous and explorative swimming at the lowest speeds or intermittent burst and coast actions to cope with water flow. In conclusion, accelerometer acoustic transmitters applied in this study provided a proxy for unsustained swimming activity, but did not contemplate the high-energy cost spent by gilthead seabream on sustained swimming, and therefore, it did not provide a proxy for general activity. Despite this limitation, accelerometer acoustic transmitters provide valuable insight in swim patterns and therefore may be a good strategy for advancing our understanding of fish swimming behavior in aquaculture, allowing for rapid detection of changes in species-specific behavioral patterns considered indicators of fish welfare status, and assisting in the refinement of best management practices.
Introduction
Understanding the basic biology of fish species is crucial for livestock production, and the integration of technological solutions can help to improve accuracy, precision and repeatability in farming operations, but also to improve the decision making in aquaculture management plans. The ongoing technological advances are rapidly expanding the possibilities of using biotelemetry sensors to accurately assess fish swimming activity and movements as a proxy for energy use in fish (Wilson et al., 2013; Hussey et al., 2015). The accurate measurement of animal acceleration should be a good proxy for energy expenditure during activity, given that locomotion occurs when animals spend energy to contract muscles which leads to body acceleration (Halsey et al., 2009). A theoretically valid proxy of energy expenditure is the acceleration of an animal's mass due to the movement of its body parts (Halsey et al., 2011). The classic approach for assessing swimming energetics is to force the fish to swim in a flow-tunnel respirometer and to measure the relationship between swimming speed and oxygen uptake (Brett, 1964). Oxygen consumption (MO2) is usually well correlated with swimming speed but also with fish movements, such as tail beat frequency (TBF), which has been used as a proxy for energy use in fish (Lowe et al., 1998). Locomotor performance and associated metabolic costs are often coupled with life history traits, which may involve trade-offs related to growth and energy expenditure (Arnott et al., 2006; Rouleau et al., 2010). Knowledge of the activity patterns and energetic requirements of marine fish species is highly relevant not only for conservation and management strategies (Wikelski and Cooke, 2006), but also for fish aquaculture management (McKenzie et al., 2020). As a result, there is a growing demand for continuously monitoring swimming activity, both in fish farms and in the wild.
Accelerometer sensors can provide fine-scale information on locomotion and body posture (Shepard et al., 2008), and therefore, they are being positioned as an innovative tool for measuring energy expenditure in fishes (Halsey et al., 2011). Accelerometers may be either archival tags (loggers) that store data in internal storage mediums that can only be accessed after the fish (and tag) has been recaptured, or acoustic transmitter tags that transmit data wirelessly and real-time to the user, collecting the data by means of an acoustic receiver (Thorstad et al., 2013). Loggers and transmitters can be used to record the acceleration of animals both in the field and the laboratory, providing an overall activity level indicator, which can be used to calculate activity-specific energy use (Gleiss et al., 2010, Wilson et al., 2013). Previous studies have explored the utility of accelerometer loggers providing high resolution acceleration data (Shepard et al., 2008) and successfully establishing correlations between MO2 and two dimensional (Partial Dynamic Body Acceleration) or three dimensional (Overall Dynamic Body Acceleration) acceleration in fishes (Clark et al., 2010; Gleiss et al., 2010; Wright et al., 2014; Brownscombe et al., 2018). External tri-axial accelerometer loggers has been also attached to the operculum of two marine farmed fish to successfully assess the physical activity by measurements of movement accelerations in x- and y-axes, while records of operculum beats (z-axis) served as a measurement of respiratory frequency (Martos-Sitcha et al., 2019; Ferrer et al., 2020). However, acceleration data loggers require retrieval of the logger to access the data, limiting their applicability and battery-life. On the other hand, accelerometer acoustic transmitters allow for transmission of data which is sent to hydrophone receivers, rather than storing data that must be later retrieved and downloaded, extending therefore the study period and the use of these accelerometers to species and/or environments where recaptures are difficult (Cooke et al., 2016). In captive conditions, acoustic transmission also allows real-time monitoring with cabled receivers (Føre et al., 2018). Therefore, there is no one-size-fits-all method, and the selection of the accelerometers to be used must be carefully considered and based on the objectives of the study to be carried out.
Accelerometer acoustic transmitters have been used to monitor individual and group swimming activity, behavior and movement patterns of several farmed fish species (e.g. Føre et al., 2011; Kolarevic et al., 2016; Gesto et al., 2020; Muñoz et al., 2020; Palstra et al., 2021), but also to estimate the bioenergetics in wild fish (e.g. Cooke et al., 2016; Metcalfe et al., 2016). Without a lab-based calibration of energy expenditure, field-based tag outputs can still be used to make within-individual comparisons across times, places, or temperatures, but cannot be directly used to provide estimates of energy budgets (Cooke et al., 2016). To date, few studies have used a swim flume to perform controlled calibrations between accelerometer output and MO2 in fish. For example, positive linear relationships between accelerations and swimming speed, MO2 and TBF have been reported for sockeye salmon (Oncorhynchus nerka) (Wilson et al., 2013) and lake trout (Salvelinus namaycush) (Cruz-Font et al., 2016) in laboratory settings. Zupa et al. (2021) calibrated tail-bait (2-axis) accelerometer acoustic transmitters with MO2 in rainbow trout (Oncorhynchus mykiss) during swimming trials. Murchie et al. (2011) tested the utility of acoustic tri-axial acceleration transmitters in combination with ethogram and respirometry studies to quantify the activity patterns and field metabolic rates of free-swimming bonefish (Albula vulpes). Similarly, Brownscombe et al. (2017) used a swim tunnel respirometer to calibrate accelerometer acoustic transmitters implanted in bonefish and estimated their metabolic rates and energy expenditure in the field. Brodie et al. (2016) used accelerometer acoustic transmitters in conjunction with laboratory respirometry trials to estimate active metabolic rates of kingfish (Seriola lalandi) in the wild. Therefore, in cases where the output of an activity-related tag has been calibrated with oxygen consumption rates (and/or swimming speeds) and locomotion using laboratory experiments, field-based measurements could be used to better-understand the swimming activity of fish species, but also to improve the accuracy of bioenergetics models (Cooke et al., 2016; Metcalfe et al., 2016). Therefore, the use of accelerometer acoustic transmitters calibrated with MO2 as a proxy of energy expenditure can be seen as a promising tool for welfare assessment in the aquaculture industry (Zupa et al., 2021). Nevertheless, more studies are required to improve methodologies in this field of research, with issues arising from the complex interpretation of data acceleration, but also developing species- and life-stage-specific relationships between acceleration, oxygen consumption and body motion before acceleration transmitters can be extensively applied to reliably assess fish swimming activity.
Gilthead seabream (Sparus aurata Linnaeus, 1758) is a widely distributed species with high interest for both fisheries and aquaculture, mostly throughout the Mediterranean Basin. Previous studies used acoustic telemetry transmitters to monitor fish movements of free-swimming seabream (Abecasis and Erzini, 2008), farmed individuals in ponds (Bégout and Lagardère, 1995) and escapees from rearing cages (Arechavala-Lopez et al., 2012; Šegvić-Bubić et al., 2018). Lately, there is a growing interest on using accelerometers as a tool to assess swimming activity of seabream at farms in order to better-understand the swimming performance and welfare conditions in aquaculture (Muñoz et al., 2020; Palstra et al., 2021). However, to support more in-depth research on free-swimming and reared seabream using acoustic tags with accelerometer sensors, the relationships between acceleration, oxygen consumption and locomotion should be validated for use in this species. In addition, there is a general concern about the potential effects of implanted tags on swimming performance and behavior of tagged fish. Apart from carrying a device internally, tagging procedures include several operations (i.e. handling, anesthesia and surgical procedures) that may induce stress that in turn may lead to physiological and/or behavioral changes in the fish (e.g. Thorstad et al., 2013). These potential changes must be at least transient, which means that the fish may be considered fully recovered once the response patterns return to those expected from a non-tagged fish. Ideally, tags cannot influence physiology or behavior in such a way that the tagged fish differ significantly from non-tagged fish (e.g. Wright et al., 2019), and the only way to test such effects is experimentally. Therefore, the objectives of this study were to characterize the swimming activity of gilthead seabream by assessing the relationships between transmitted accelerations and swimming speeds of tagged individuals, but also between accelerometer outputs, oxygen consumption and body motion parameters (i.e. head orientation and tail beats). In addition, we assessed the potential surgical/tagging effects through the comparison of oxygen consumption, cost of transport and body motion parameters between tagged and non-tagged gilthead seabream.
Materials and Methods
Fish and Experimental Settings
Hatchery-reared gilthead seabream were provided by Aquanord (Gravelines, France) and transported to the Wageningen University and Research experimental facilities (CARUS, Wageningen, The Netherlands). There, 50 seabream (about 20 cm in length and 200 g in weight) were held in a 600 L circular tank supplied with well-aerated water at 20 ± 1°C from a recirculating biofilter system, and fed every day with commercial pellets (2% of body mass). They were allowed to acclimatize in the quarantine tank for at least 2 weeks before use in the experiment. Experimental swimming tests were performed in four Blazka-type swim-tunnels (see Van Den Thillart et al., 2004 for a detailed description). Air temperature was maintained at 20°C, water temperature values during experiments were 20 ± 1°C. Tunnels were connected to a 400 L tank filled with seawater, which was aerated to maintain high oxygen levels. Water from the tanks was recirculated through each tunnel using an EHEIM pump (Universal; EHEIM GmbH & Co. KG, Deizisau, Germany). The water inlet could be closed by a valve when oxygen measurements were performed (Figure 1). The flow in the swim-tunnels was set at six different speeds during the experiment, from the lowest speed (flushing only, propellers not active) and increasing stepwise by 0.2 ms−1 per hour up to 1 ms−1 (Palstra et al., 2020) while accelerations, oxygen consumption and locomotion were assessed within each interval.
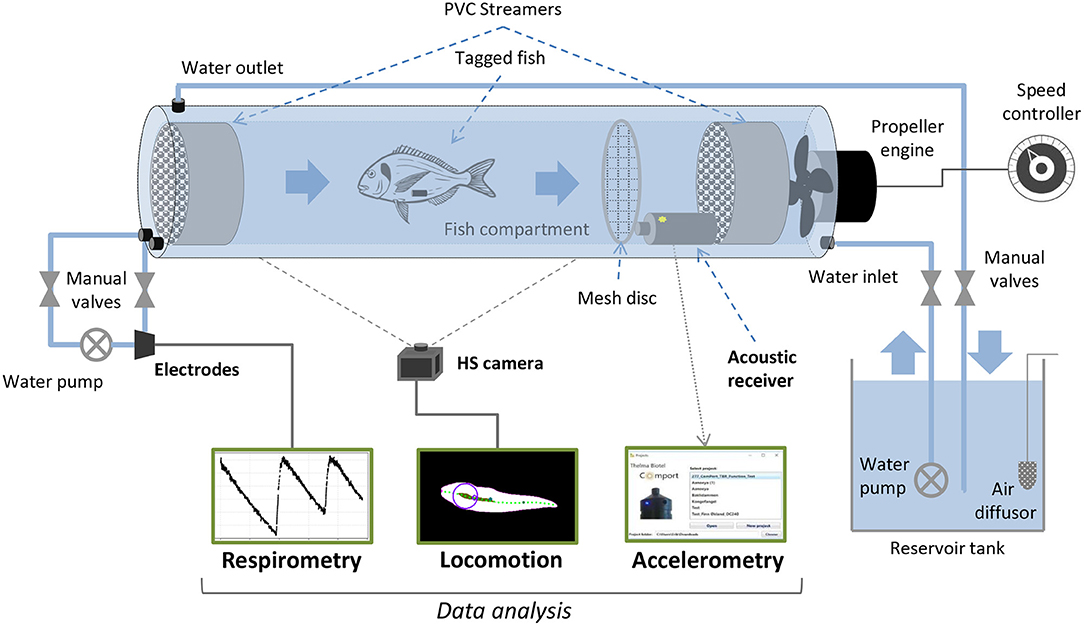
Figure 1. Schematic drawing of a Blažka-type swim-tunnel (modified and adapted from Van Den Thillart et al., 2004) with the experimental setting for accelerometry, respirometry and locomotion assessment of Sparus aurata at different swimming speeds in the present work.
Acoustic Accelerometer Transmitters and Tagging
After a period of acclimatization after transport, acoustic accelerometer transmitters were implanted to 10 seabream individuals (see Table 1). Fish collected from the tanks using a hand net were anesthetized by submersion in an aqueous solution of Phenoxyethanol (0.25 ml L−1). Once deeply anesthetized, the fish standard length was measured, the fish was weighed, and then placed with the ventral side up on a surgical table to implant the transmitters. An incision (~1 cm) was made on the ventral surface, posterior to the pelvic girdle. An acoustic transmitter equipped with accelerometer sensor (Thelma Biotel Ltd., Trondheim, Norway; model A-LP7; sampling frequency: 5 Hz; transmission frequency: 71 kHz; weight in air: 1.9 g; weight in water: 1 g; diameter size: 7.3 mm; length: 17 mm; transmission interval: 20–40 s) was introduced through the incision into the body cavity above the pelvic girdle. The incision was closed with one or two independent silk sutures. The fish was regularly sprayed with water during the surgery (handling time: 2–3 min). Before each incision, the surgical equipment was rinsed in 70% ethanol and allowed to dry. After tagging, the fish was released back into a separate quarantine tank for recovery and re-acclimatization for 5 days before the experiment. A passive acoustic receiver (Thelma Biotel Ltd.; model TBR 700; diameter: 75 mm; length: 230 mm) was positioned at the back end inside each tunnel, to record the accelerometer transmitters signals during the experiment (Figure 1). A mesh structure was placed between the receiver and the swimming area of the tunnel to avoid possible effects on the water flow and on swimming behavior of the fish during the experiment. The accelerometers provided root mean square values of the three acceleration axes (ARMS, in mcots−2), averaged over all samples in the sampling window, and were transformed into real accelerations (in ms−2).
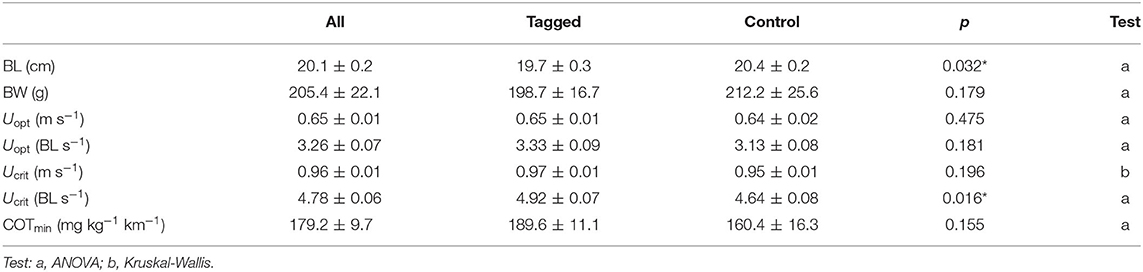
Table 1. Mean values (±SE) of body length (BL), body weight (BW), optimal swimming speed (Uopt), critical swimming speed (Ucrit), and minimum oxygen cost of transport (COTmin) for tagged and control seabream in the swim-tunnels, and significance of differences between tagged (N = 10) and non-tagged fish (N = 10) for all parameters (ANOVA, significance level: p < 0.05, indicated with an asterisk:*).
Respirometry and Swimming Performance
The swim-tunnel system included a bypass with an oxygen probe in a four-channel respirometry system (DAQ-PAC-G4; Loligo Systems Aps, Tjele, Denmark) to measure total oxygen content of the water in percentage (Figure 1), which drops due to oxygen consumption of the fish (ΔO2%). A low rate of background (bacterial) respiration was always detected and subsequently subtracted from fish oxygen consumption (Palstra et al., 2015). From the decline of the O2 concentration, the O2 consumption rate (MO2; in mgO2 kg−1 h−1) and cost of transport (COT; in mg kg−1 km−1) were calculated following the equations:
where DOmax is the maximum amount of oxygen dissolved in the water (9.47 mg O2 L−1 at a temperature of 20°C in seawater for seabream); L is the volume of the swim-tunnel (127 L); t the time in minutes, and Δd is the covered distance in m (estimated from selected flow speed and exposure time during sampling). Additionally, three parameters were used to characterize swimming endurance (Farrell, 2008; Palstra et al., 2008): (i) Critical speed (Ucrit): the critical swimming speed (m s−1 and BL s−1), calculated according to Brett (1964); (ii) Optimal speed (Uopt): the optimum swimming speed (m s−1 and BL s−1) where the cost of transport (COT, mgO2 kg−1 km−1) reaches a minimum (Tucker, 1970); (iii) minimum cost of transport (COTmin): the cost of transport (mg O2 kg−1 km−1) at Uopt. The Uopt was determined by plotting a polynomial trend line through COT values vs. swimming speeds per seabream individual. The point on this trend line with the lowest COT (COTmin) was calculated by equalling the first derivative to zero (Palstra et al., 2008).
Body Motion: Tail Beats and Head Orientation
Seabream locomotion was filmed with a Basler 2040-90um NIR USB3 camera at a frame rate of 25 frames per second and 15 ms exposure time. Pixels were binned 2×2 to improve sensitivity by a factor of 4. The camera was positioned one meter below the center of the tunnel (Figure 1). Final images were 1024×512 pixels at a resolution of 14.25 pixels per cm. A translucent back projection screen was placed on top of the tunnel to disperse the room lights into a homogeneous white background. The camera view covered the full length and width of the tunnel, except for the most upstream 5 cm and downstream 10 cm. Custom software developed in Python, including the OpenCV image analysis library was used to detect and save the fish contour (Figure 2) in real-time. To detect the fish we used a median (3 pix) and Gaussian blur (5 pix) filter to reduce noise, followed by a histogram normalization to improve the contrast in the images, and by a luminance threshold that selected dark images relative to a light background. The fish was selected from detected objects (using the find_contours routine) based on size (surface area) and length-width ratio of an ellipse fitted to the contour. We used a standard Kalman filter in OpenCV with position, speed and acceleration estimates, to obtain smoothed estimates of fish tracks, quantified by the center of mass of the contour. Timing information, x and y locations and full body contours were saved to disk for off-line analysis. The midline of each fish was analyzed from the saved contours based on a distance transform (quantifying for each pixel the nearest distance to the contour). To this end, the head location and orientation (HO) were determined by fitting a line to all points with a distance larger than 80% of half the width of the body, yielding a strip of ‘midline' points in the anterior region of the fish (Figure 2, black area). The snout (Figure 2, yellow dot) of the fish was found by detecting the first point outside the contour, on a line fitted to the midline points. To construct the full axis of the fish, we tracked the ridge of maxima of the distance transform, starting at the snout, in steps of 0.7 cm. To track the maxima in the distance transform we iteratively find the maximum on a circle (0.7 cm radius) around the previous point, followed by clearing the values within the circle (thus preventing direction reversals). Tracking stopped when the tip of the tail was reached. The resulting axis was slightly smoothed using a univariate spline (k = 3, s = 5) for x and y data separately, to minimize the effects of irregularities in the contour on the distance transforms. To quantify tailbeat parameters we selected a point in the tail at 14.0 cm distance from the snout, and we determined the lateral excursion relative to the midline through the head (Figure 2, projection of the red dot onto the gray line). Tailbeat frequency (TBF) and amplitude (TBA) were obtained by performing a spectral analysis on the tail excursion as a function of time (Figure 2C). Spectrograms were calculated with a temporal window size of 1.28 s (32 frames), shifted frame by frame. The resolution in the frequency domain was increased by padding the signal with zero values to a length 8 times the width of the original signal. Frequency and amplitude (Figures 2D,E) were determined based on the maximum in the spectrogram at each frame. A similar calculation was performed on head orientation to obtain frequency (HOF) and amplitude (HOA) of head orientation changes.
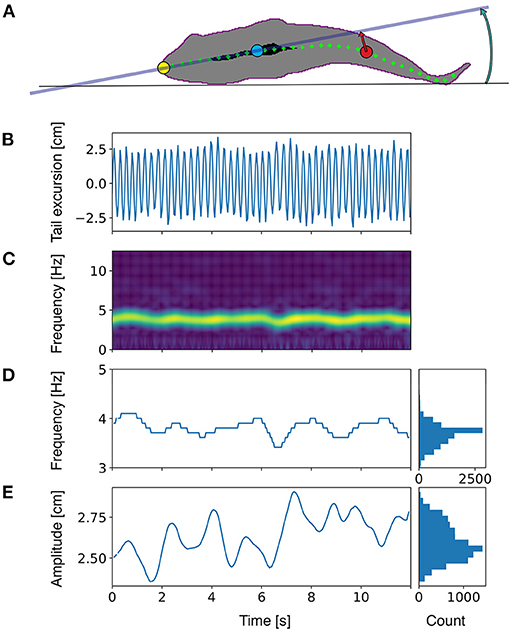
Figure 2. Schematic representation of the locomotion parameters estimated in the present work. (A) bottom view of a fish silhouette with analyzed data points. Yellow: tip of the snout. Blue: reference point in the head region, determined as the center of mass for all points that are located further from the contour than 80% of the width of the fish (the area marked in black). Red: a reference point on the axis of the fish in the tail region, defined at a fixed distance from the snout, along the central axis. Green dots indicate the central axis. (B) Tail excursion as a function of time, measured as the distance of the tail point (red mark) to midline through the head. (C) Frequency analysis of the tail excursion. The spectrogram shows the amplitude of all frequencies as a function of time. (D) The frequency of tail beats determined as the frequency at which the spectrogram peaks. (E) The amplitude of tail excursions determined at the tail beat frequency in (D). Marginal histograms in (D) and (E) show the distribution of frequencies and amplitudes, from which mean values and standard deviations were calculated. Similar frequency analyses were performed for other parameters (see methods for further details).
Experimental Protocol and Data Analyses
Each experimental day, four individuals (tagged or non-tagged control fish) were scooped out of the tank, anesthetized, measured (length and weight) and placed individually in the swim-tunnels, where they recovered within 10 min. After acclimatization to the swim-tunnel overnight, the next day each fish was exposed to six different swimming speeds (in the range 0–1 ms−1 with increments of 0.2 ms−1). Each condition was maintained for 1 h during which the oxygen decline in the tunnel was measured over the first 0.5 h for all individuals (N = 20). After oxygen measurements, the tunnel was flushed for another 0.5 h while swimming speed was maintained. Accelerations were recorded during the whole experimental procedure on tagged fish (N = 10). Swimming behavior (i.e. body movements) was recorded during 0.25 h (15 min) within the first 0.5 h of interval for a total of 10 fish (6 tagged and 4 control). Regression analyses were performed to assess the relationships between swimming speed and dependent variables (i.e. accelerations, MO2, COT, HO, HOA, HOF and TBA, TBF) as well as paired relationships between studied parameters. Distribution of recorded seabream accelerations, TBF, HO and HOF were visually assessed by plotting percentage of recorded observations (counts) at different swimming speed (see Supplementary Figure 1).
Analyses of variance (ANOVA) were applied to assess for differences between tagged and non-tagged fish regarding body size (BL), body weight (BW) and estimated swimming performance parameters (i.e. Uopt, Ucrit, COTmin). Homogeneity of variances were tested in all cases using Bartlett's test as well as normality of the residuals. In the case of not following the assumptions of the model, non-parametric Kruskal Wallis tests were performed to assess differences between tagged and control fish (Table 1). Similarly, difference between tagged and non-tagged fish on respirometry and locomotion parameters were tested using a generalized linear mixed model (GLMM), with estimated parameters as the response variable, treatment (tagged/non-tagged) and swimming speed as fixed effects, and accounting for individual variability as random effect in all the models. For accelerations a Gamma-distributed response variable was applied, given that the values are positive defined and positive-skewed, and it has been successfully used in previous seabream accelerations modeling (Díaz-Gil et al., 2017). In addition, the paired relationships between estimated parameters were also tested using a GLMM, with accelerations or oxygen consumption as the response variable, other dependent variables and swimming speed as fixed effect and individual as a random factor. R software (R Core Team, 2020) was used for statistical analyses, and the R packages lme4 (Bates et al., 2015) and lmerTest (Kuznetsova et al., 2017) were employed to fit models. Results were considered significant at p < 0.05. All values are reported as means ± SE.
Ethical Approval
Animal manipulations for this experiment were carried out strictly by trained and competent personnel, in accordance with the European Directive (2010/63/UE), and approved by the Dutch Central Committee for Animal Experimentation (CCD nr. AVD401002017817) and by the Animal Experimental Committee of Wageningen University (IvD experiment nr. 2016.D-0039.004).
Results
Acoustically Transmitted Accelerations
One accelerometer showed technical problems (i.e. no data transmission) and therefore it was not considered in the accelerometry study. For the rest of tagged individuals (n = 9), there was a significant negative relationship of accelerations with swimming speed (exponential fit: R2 = 0.61, p < 0.001). Gilthead seabream exhibited maximum mean accelerations at the lowest speed (1.26 ± 0.21 ms−2), and minimum mean accelerations at the highest speed (0.51 ± 0.17 ms−2) (Figure 3A). Similarly, the variability of accelerations recorded by tagged seabream decreased as swimming speed increased (Figure 3B) (see more detailed representation in Supplementary Figure 1).
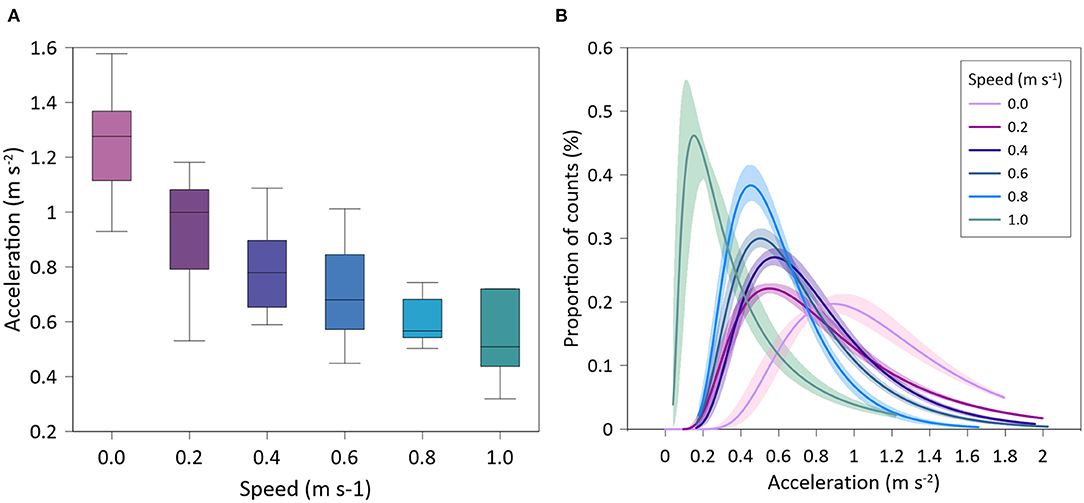
Figure 3. Accelerations of tagged Sparus aurata at different water speeds. (A) Box-plot of mean values; (B) Inverse Gaussian lines fitted on proportional data distribution.
Respirometry
There was a significant positive relationship between MO2 and swimming speed (polynomial fit: R2 = 0.50; GLMM, p < 0.001) for all individuals (n = 20), where MO2 did not significantly differ between tagged fish (n = 10) and non-tagged (n = 10) seabream (GLMM, p = 0.779) (Figure 4A). COT was negatively related to swimming speed (polynomial fit: R2 = 0.50; GLMM, p < 0.001) for all individuals, but no significant differences on COT were observed between tagged and non-tagged seabream (GLMM, p = 0.757) (Figure 4B). Most of the seabream (70%; 9 tagged and 5 non-tagged fish) showed a clear Uopt of average 0.65 ± 0.01 ms−1 (3.26 ± 0.07 BL s−1) and a mean COTmin of 179.2 ± 9.7 mg kg−1 km−1 (Table 1). 50% of seabream individuals (4 tagged and 6 non-tagged fish) fatigued before the end of the experiment, and for the rest of seabream an Ucrit of 1 ms−1 was considered. As a result, a mean Ucrit of 0.96 ± 0.01 m s−1 (4.78 ± 0.06 BL s−1) was estimated for all fish although this is an underestimation as half of the fish did not fatigue. Although there were significant differences between tagged and non-tagged fish regarding body length (BL; ANOVA, p = 0.032) and Ucrit (BL s-1; Kruskal-Wallis, p =0.016), no differences between both fish groups were detected for body weight (BW) and the rest of estimated swimming performance parameters (ANOVA, p > 0.05) (Table 1).
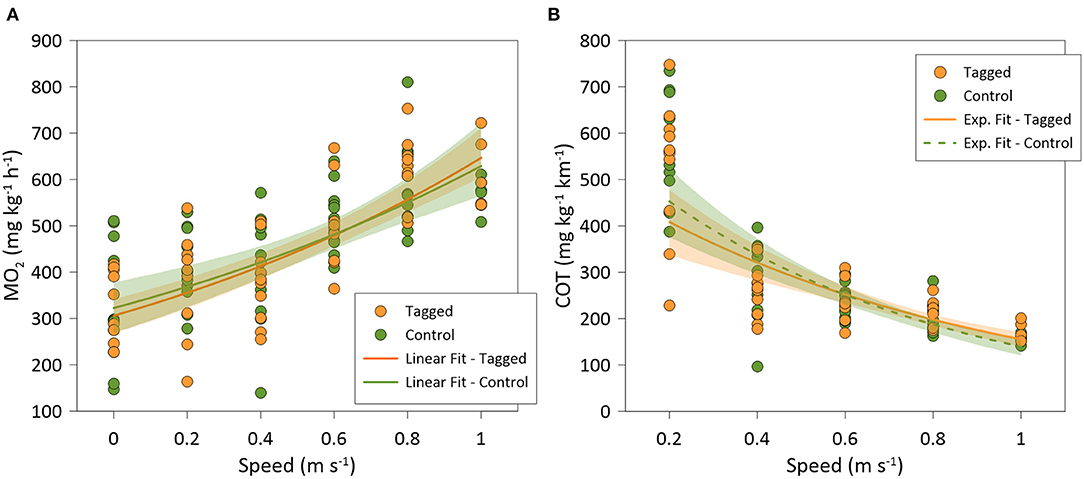
Figure 4. (A) Best-fitted regression of: (A) oxygen consumption rates (MO2); and (B) oxygen cost of transport (COT), of tagged (orange; N = 9) and control (green; N = 10) Sparus aurata in swim-tunnels at different swimming speeds.
Body Motion: Head Orientation and Tail Beats
Recorded seabream (n = 10) exhibited the highest mean values of HO at the lowest speed, where individuals were able to swim in all directions (spontaneous movements), while at higher swimming speeds the fish only swam against the flow and HO values were minimal (Figure 5A). This resulted in significant differences on HO regarding swimming speed (GLMM, p < 0.001). In addition, there were no differences between tagged and non-tagged fish (GLMM, p = 0.601). HO variability also decreased as the swimming speed increased, remaining closer to an angle of 1.57 rad above the Uopt, which corresponds to the straight “upstream” position (Figure 5B) (See Supplementary Figure 1 for further details). HOA varied with swimming speeds (mean HOA range: 0.10–0.40 rad) (Figure 6A), decreasing significantly with swimming speed increase (exponential fit: R2 = 0.49; GLMM, p =0.038), but no differences were observed between tagged and non-tagged seabream (GLMM, p = 0.9723). There was a significant positive relationship between HOF and swimming speed (linear fit: R2 = 0.68; GLMM, p < 0.001), although higher variation was observed at the highest speed (Figure 6B) (See Supplementary Figure 1 for further details). Minimum HOF mean values can be observed at the lowest speed (mean: 1.67 ± 0.23 cycles s−1) and maximum values at the highest speed (mean: 2.87 ± 0.43 cycles s−1). No significant differences were observed on HOF between tagged and non-tagged seabream (GLMM, p = 0.1403). There were no significant differences on TBA regarding swimming speed (exponential fit: R2 = 0.43; GLMM, p = 0.266) (Figure 6C), and no tagging effects were detected (GLMM, p =0.983). A significant positive relationship between TBF and swimming speed was observed (linear fit: R2 = 0.87; GLMM, p < 0.001) (Figure 6D) (See Supplementary Figure 1 for further details). Seabream exhibited minimum mean TBF values at the lowest speed (mean: 1.68 ± 0.07 cycles s−1) and the maximum TBF values at the highest speed (mean: 4.13 ± 0.34 cycles s−1). There were no significant differences on TBF between tagged and non-tagged seabream (GLMM, p = 0.822).
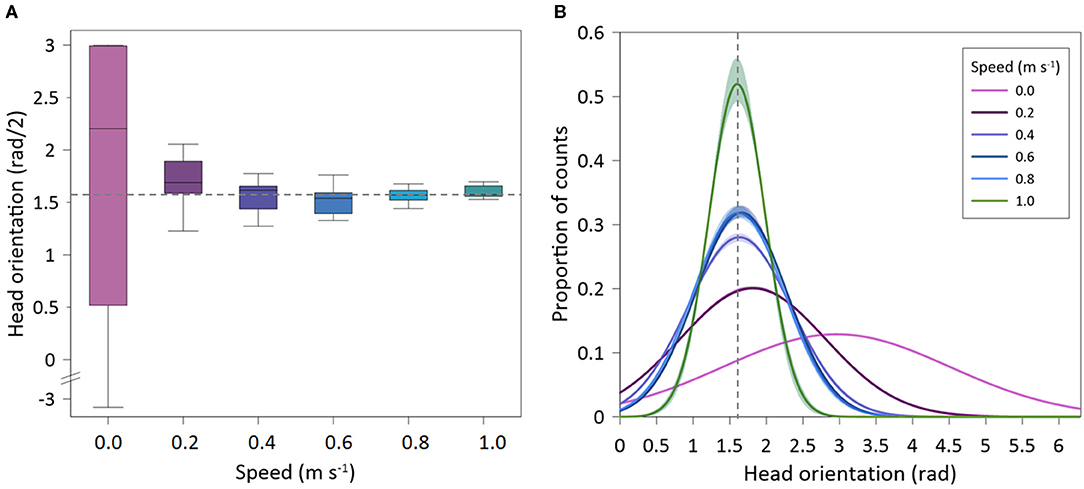
Figure 5. Head orientation of Sparus aurata in swim-tunnels at different swimming speeds. (A) Box-plot of mean values; (B) Gaussian lines fitted on proportional data distribution. Dotted line: HO = 1.57 rad (straight upstream swimming position).
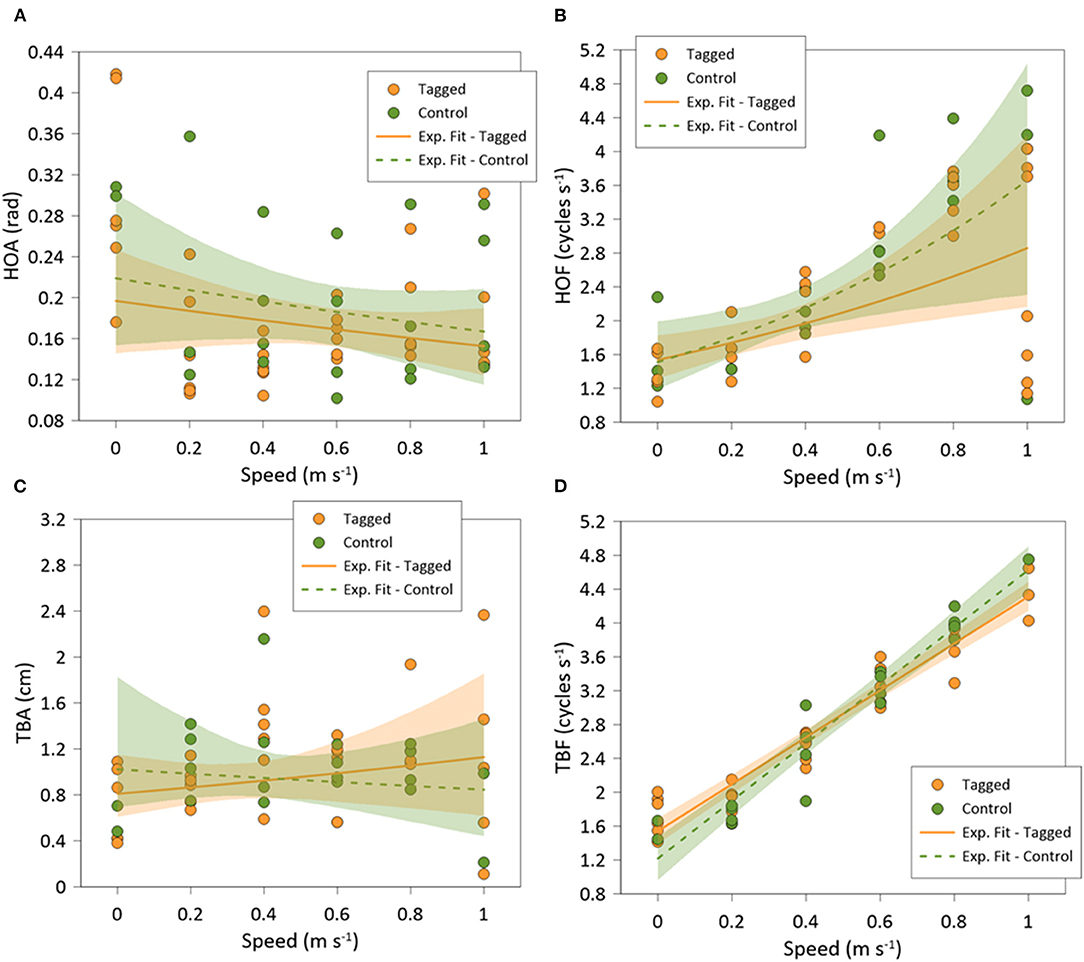
Figure 6. Best-fitted regression of: (A) head orientation amplitude (HOA); (B) head orientation frequency (HOF); (C) tail beat amplitude (TBA); and (D) tail beat frequency (TBF), of tagged (orange) and control (green) Sparus aurata in swim-tunnels at different swimming speeds.
Acceleration and Oxygen Consumption vs Body Motion
Gilthead seabream accelerations showed a significantly negative relationship with MO2 (exponential fit: R2 = 0.50; GLMM, p < 0.001) (Figure 7A) and a significantly positive relationship with COT (exponential fit: R2 = 0.50; GLMM, p =0.004) (Figure 7B). Variations of head orientation (SD-OH) were significantly and positively correlated to accelerations (linear fit: R2 = 0.68; GLMM, p < 0.001) (Figure 8A) and significantly and negatively related to MO2 (exponential fit: R2 = 0.44; GLMM, p < 0.001) (Figure 8B). HOF showed a significantly negative relationship with accelerations (exponential fit: R2 = 0.49; GLMM, p < 0.001) (Figure 8C), while its relationship with MO2 was significantly positive (lineal fit: R2 = 0.45; GLMM, p < 0.001) (Figure 8D). Similarly, TBF was significantly and negatively related to accelerations (exponential fit: R2 = 0.51; GLMM, p < 0.001) (Figure 8E), while it showed a positive relationship with MO2 (linear fit: R2 = 0.56; GLMM, p = 0.081) (Figure 8F).
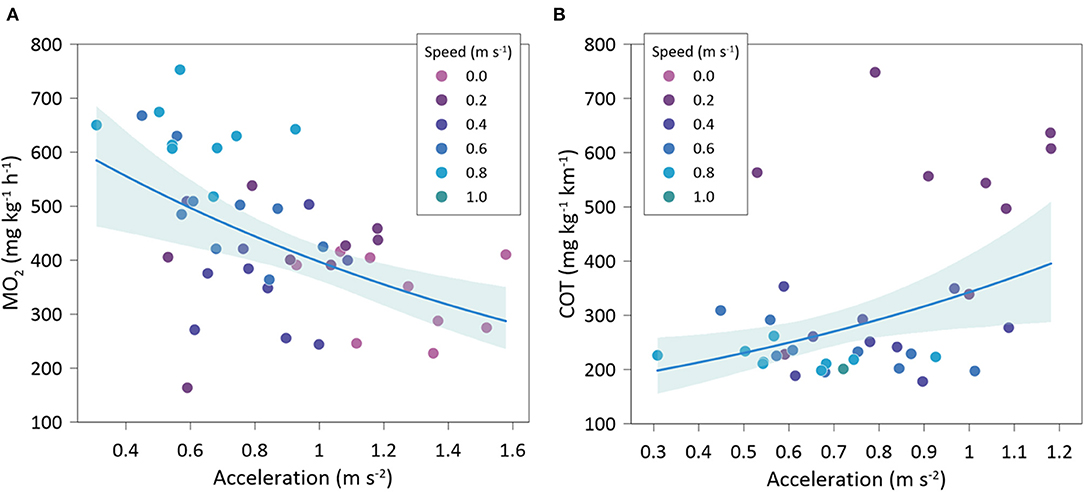
Figure 7. Best-fitted regression accelerations with: (A) oxygen consumption rate (MO2), and (B) cost of transport (COT), of Sparus aurata at different swimming speeds.
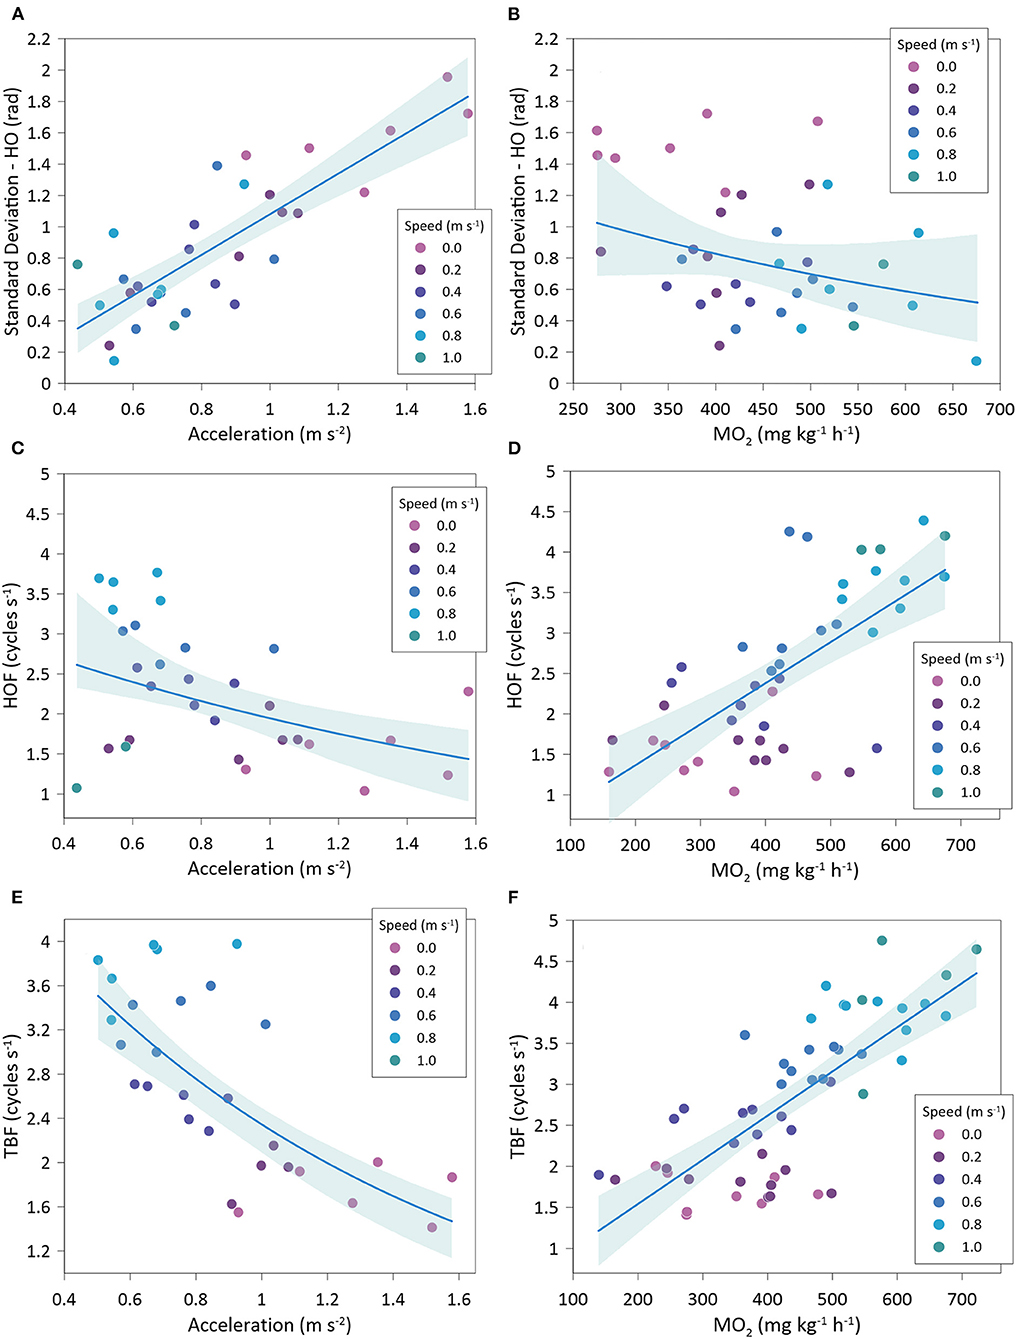
Figure 8. Best-fitted regression of Sparus aurata accelerations and oxygen consumption (MO2) with body motion parameters at different swimming speeds. (A) variations of head orientation (SD-HO) and accelerations; (B) variations of head orientation (SD-HO) and oxygen consumption; (C) head orientation frequency (HOF) and accelerations; (D) head orientation frequency (HOF) and oxygen consumption; (E) tail beat frequency (TBF) and accelerations; (F) tail beat frequency (TBF) and oxygen consumption.
Discussion
This study successfully characterized the swimming activity of gilthead seabream through a multidisciplinary approach in swim-tunnels, which also allowed testing the effects of tag implantation at optimal and critical swimming speed. Tag implantation did not have impact on oxygen consumption, swimming performance and locomotion on seabream, since no differences were observed between non-tagged and tagged individuals, and results agree with values previously reported in wild and farmed seabream (Basaran et al., 2007; Steinhausen et al., 2010; Martos-Sitcha et al., 2018; Palstra et al., 2020). Carrying an internal device and the associated tagging procedures may induce physiological and behavioral stress responses on fish, in such a way that the tagged fish differ significantly in performance from the non-tagged fish (e.g. Cooke et al., 2011; Montoya et al., 2012; Thorstad et al., 2013; Wright et al., 2019; Alfonso et al., 2020). Previous studies on gilthead seabream also reported a lack of mid-term effects of tag implantation on rhythmicity of feeding and locomotor activity, stress physiology and growth performance (Montoya et al., 2012; Alfonso et al., 2020), supporting that tagged seabream can be considered as a representative portion of the study population. However, some additional research might be warranted to investigate potential physiological-induced long-term effects on seabream (Montoya et al., 2012), to ensure that the data generated are relevant to non-tagged conspecifics and the surgical procedure does not impair the health and welfare status of the tagged fish (Cooke et al., 2011).
Gilthead seabream performed spontaneous swimming at the lowest flow speed, whereas during forced swimming they adopted a steady-state swimming where the fish gradually increased speed as the flow speed increased to maintain its position within the tunnel, but also decreased burst-coast actions as they approached exhaustion. Acoustic accelerometer tags transmitted a summarized acceleration value of a certain period of time (20–40 s) that provides an index of activity, measuring spontaneous movements and overall displacements due to burst-actions in the tunnel. Therefore, this study pointed out that applied accelerometer acoustic transmitters do not properly measure sustained swimming, which entails high expenditure of energy, but successfully reveal unsustained swimming activity of seabream in swim-tunnels. Gilthead seabream exhibited spontaneous swimming patterns with highly frequent changes in directions in the absence of water flow, reflected on the highest transmitted accelerations and lowest oxygen consumption. In addition, seabream exhibited burst-and-coast swimming behavior in the swim-tunnels whereby fish would burst to the front of the tunnel and fall back to the end of the swim-tunnel. Burst actions occurred more often at lower swimming speeds, which were represented by higher transmitted accelerations and decreased in distance as the swimming speed increased, as a result of reduced energy and locomotive efficiencies which requires higher locomotion and oxygen consumption. Indeed, when seabream were exposed to swim at the highest speed, burst actions were practically inefficient showing a lack of forward displacements, mostly remaining at the end of the tunnel performing a highly forced sustained swimming, approaching to exhaustion (Ucrit).
Continuous swimming is fuelled aerobically and can be sustained by a fish for a relative long time, and locomotion is mainly propelled by the red musculature which is powered by oxidative phosphorylation; whereas the white musculature will be used when a fish is exposed to strong or variable currents (Gui et al., 2014). On the contrary, transient swimming (burst actions) is performed anaerobically (utilization of phosphocreatine, ATP and glycogen) and propelled by the white musculature. During burst-and-coast swimming, alternating bouts of active swimming movements (burst phase) with passive coasts or glides (coast phase) conserves on the energy by reducing the amount of muscular effort over a prolonged time period (Webb and Weihs, 1983). Svendsen et al. (2015) demonstrated the energetic importance of anaerobic metabolism during steady swimming on gilthead seabream, providing that anaerobic swimming costs increase linearly with the number of bursts in this species. Gilthead seabream is a body-caudal fin swimmer, presenting a subcarangiform swimming mode, where the whole body participates in large amplitude undulations, only limited at the anterior side, and increasing toward the posterior half of the body (Sfakiotakis et al., 1999; Lauder, 2015). The movements of the entire body contribute to the overall swimming performance (Akanyeti et al., 2017) but are particularly significant during unsteady swimming actions characterized by quick turns, high accelerations or burst actions (Sfakiotakis et al., 1999). Seabream control speed by primarily modulating undulation frequency, reflected in TBF and HOF, while maintaining a relatively low and constant undulation amplitude (TBA and HOA). However, when a steadily swimming fish accelerates forward, the speed is gained not only by further increase of the TBF and HOF, but also by bending the body to accelerate a large amount of fluid (Lauder, 2015) increasing the angle of the head (HO) with respect to the rest of the body (Akanyeti et al., 2017).
Accelerometer acoustic transmitters used in this study provided averaged measures over all samples (sampling frequency: 5 Hz) in the sampling window (20–40 s) corresponding to the mean absolute acceleration values that mostly represent changes in swimming speed or direction. Therefore, total swimming activity is the sum of steady swimming at the flow speed and additional activity picked up by the accelerometers (unsustained swimming due to spontaneous or burst-coast actions). Oscillations due to vigorous swimming movements, movement of restrictions and fatigue stress were observed at highest swimming speeds. However, these increases of yaw movements and body bendings may not have been properly recorded by the accelerometer due to its location and orientation in the fish gut cavity and next to the mass center. Therefore, the increase of swimming speed revealed a sustained swimming behavior of seabream, which involved an increase of TBF and HOF, and a reduction of HO and burst actions together with lower acceleration outputs. Cruz-Font et al. (2016) showed that TBF transmitters implanted at the back of the body cavity of lake trout were more sensitive to swimming movements, showing higher values of acceleration at each speed tested. Although high relationships between acceleration and speed for tags implanted centrally in the body cavity were also reported, implanting a tag at the back of the cavity may better describe the swimming energetics, but it highly depends on the swimming mode of the fish. Gesto et al. (2020) implanted acoustic accelerometer tags with 12 s sampling period in farmed rainbow trout (O. mykiss) that measured only on two spatial axes (X, Z; “tailbeat” mode), ignoring the backward/forward acceleration (Y axis). In this case, authors only accounted for the undulation movements associated to the movements of the tail, which are known to be directly associated to fish' swimming speed (Wilson et al., 2013; Cruz-Font et al., 2016). Similarly, Zupa et al. (2021) calibrated tail-beat (2-axis) accelerometer acoustic tags with MO2 on rainbow trout during swimming trials with a high sampling frequency of 10 Hz. Wilson et al. (2013) calibrated acceleration transmitters with energy expenditure on sockeye salmon (O. nerka) across a range of swimming speeds and water temperatures, showing positive linear relationships of accelerations with swimming speed, MO2 and TBF. In this case, sockeye salmon maintained steady-state swimming during the swim trials, performing irregular tail-beats at lower swimming speeds and burst actions only at high speeds, a swimming behavior completely opposite to that observed on seabream. Wilson et al. (2013) used accelerometer acoustic transmitters operating at higher sampling frequency (10 Hz) and lower sampling period (10 s) than those used in the present study. Murchie et al. (2011) tested acoustic tri-axial acceleration transmitters (5Hz sampling frequency, 25 s sampling period) in combination with ethogram and respirometry studies on bonefish. Author reported that their accelerometers reflected low swimming speeds and intermittent swimming behaviors, and given that most bursting activity lasts on the order of seconds, it is not surprising that most of the acceleration data collected consisted of low values. Similarly, other studies also agreed that burst behaviors might exceed the capacity of the tag to report an increase in the acceleration at high swimming speeds (Murchie et al., 2011; Wilson et al., 2013; Cruz-Font et al., 2016). Brownscombe et al. (2017) used similar accelerometers (5Hz sampling frequency, 35 s sampling period) on bonefish and showed positive relationships between fish accelerations and oxygen consumption with swimming speed in the swim-tunnel, but mentioned the limitation of swim-tunnels of generating linear swimming only, and not more complex and energetically-costly maneuvers which allow better estimations of fish energy expenditure. Brodie et al. (2016) also showed a positive relationship metabolic rate, swimming speed and activity for kingfish using accelerometers (5 Hz sampling frequency, 25 s sampling period) in swim-tunnels which were used to estimate active metabolic rate in the wild. Comparing with previous studies, our results suggest that body movements and locomotion parameters can be used to accurately estimate metabolic rates on gilthead seabream. However, a better selection of appropriate accelerometers, position of the recording device, and probably shorter recording period (higher frequency), must be performed and validated in future studies (Shepard et al., 2008; Broell et al., 2013; Brownscombe et al., 2018).
Adequate accelerometer acoustic transmitters setting will ensure the monitoring of sustained aerobic swimming activity of fish, a necessary element for estimating the energy consumption of fish, highly relevant for fish farmers' management. This study reveals that selected accelerometer acoustic transmitters successfully measured unsustained swimming activity of seabream, namely spontaneous and burst-coast actions. Accelerometer acoustic transmitters could represent a useful tool in future fish farm management, allowing for rapid detection of changes in species-specific behavioral patterns which are considered indicators of fish welfare status in aquaculture (Martins et al., 2012), and assisting in the refinement of best management practices. In fact, acoustic telemetry is being recently transferred to the aquaculture sector improving the farmer's ability to monitor, control and document biological processes in fish farms (Føre et al., 2018). For example, Føre et al. (2011) reported the successful implementation of depth- and acceleration-based tags to observed changes in swimming, activity and feeding behavior on farmed Atlantic salmon (Salmo salar). Similarly, Kolarevic et al. (2016) used accelerometer acoustic transmitters on farmed Atlantic salmon for real time monitoring of swimming activity within recirculating aquaculture production systems (RAS). Regarding gilthead seabream, recent studies reported the successful application of acoustic transmitters equipped with accelerometer sensor in experimental sea cages to monitor daily swimming activity, revealing higher seabream accelerations during feeding time and morning and evening periods (Muñoz et al., 2020; Palstra et al., 2021). Our results are consistent with these results, since the greatest fish activity may reflect less sustained swimming behavior (lack of shoaling behavior) and therefore more individualism (e.g. feeding competition, aggressiveness, resting). Nevertheless, there are some limitations when using acoustically transmitted accelerations, and our results illustrate problems associated with how accelerations and energy budgets estimates can be compromised and misinterpreted, and must be handled with caution. Besides the necessity to upscale telemetry studies in aquaculture and free-swimming fish, further laboratory-derived calibrations are needed in order to find the best characteristics and settings of transmitters (sampling period, battery life, etc.) for each species and specific environmental conditions. It is therefore important to validate acceleration outputs with physiological and behavioral parameters for each species of interest, in order to ensure research or applied questions are addressed effectively and appropriately answered.
Data Availability Statement
The raw data supporting the conclusions of this article will be made available by the authors, without undue reservation.
Ethics Statement
The animal study was reviewed and approved by Dutch Central Committee for Animal Experimentation (CCD nr. AVD401002017817).
Author Contributions
PA-L and AP: conceptualization and funding acquisition. PA-L, AP, and ML: methodology. PA-L, CD-G, and ML: formal analysis and data curation. WA, AP, and ML: resources. PA-L: writing—original draft. PA-L, CD-G, ML, WA, and AP: writing—review and editing. WA: project administration. All authors contributed to the article and approved the submitted version.
Funding
This work is based upon work through a Short Term Scientific Mission from the European Aquatic Animal Tracking Network COST Action (ECOST-STSM-CA18102-020320-115323) supported by COST (European Cooperation in Science and Technology). This study is also part of a Trans National Access project ACTIVEBREAM (AE160009) that has received funding from the European Union's Horizon 2020 research and innovation programme under grant agreement no. 652831 (AQUAEXCEL2020). This output reflects only the author's view and the European Union cannot be held responsible for any use that may be made of the information contained therein. This study also received Portuguese national funds from FCT—Foundation for Science and Technology through project UIDB/04326/2020.
Conflict of Interest
CD-G was employed by the company Xelect Ltd. (St. Andrews, United Kingdom).
The remaining authors declare that the research was conducted in the absence of any commercial or financial relationships that could be construed as a potential conflict of interest.
Acknowledgments
The authors thank T. Šegvić-Bubić (Croatian Institute of Oceanography and Fisheries) for sharing part of the telemetry equipment, G. van den Thillart for the use of the swim-tunnels and the staff of CARUS (research facility of the Department of Animal Sciences, Wageningen University & Research) for their assistance, excellent care of the fish and experimental facilities.
Supplementary Material
The Supplementary Material for this article can be found online at: https://www.frontiersin.org/articles/10.3389/fanim.2021.679848/full#supplementary-material
References
Abecasis, D., and Erzini, K. (2008). Site fidelity and movements of gilthead sea bream (Sparus aurata) in a coastal lagoon (Ria Formosa, Portugal). Estuar. Coast. Shelf. Sci. 79, 758–763. doi: 10.1016/j.ecss.2008.06.019
Akanyeti, O., Putney, J., Yanagitsuru, Y. R., Lauder, G. V., Stewart, W. J., and Liao, J. C. (2017). Accelerating fishes increase propulsive efficiency by modulating vortex ring geometry. Proc. Nat. Acad. Sci. U.S.A. 114, 13828–13833. doi: 10.1073/pnas.1705968115
Alfonso, S., Zupa, W., Manfrin, A., Fiocchi, E., Dioguardi, M., Dara, M., et al. (2020). Surgical implantation of electronic tags does not induce medium-term effect: insights from growth and stress physiological profile in two marine fish species. Anim. Biotel. 8, 1–6. doi: 10.1186/s40317-020-00208-w
Arechavala-Lopez, P., Uglem, I., Fernandez-Jover, D., Bayle-Sempere, J. T., and Sanchez-Jerez, P. (2012). Post-escape dispersion of farmed seabream (Sparus aurata L.) and recaptures by local fisheries in the Western Mediterranean Sea. Fish. Res. 121, 126–135. doi: 10.1016/j.fishres.2012.02.003
Arnott, S. A., Chiba, S., and Conover, D. O. (2006). Evolution of intrinsic growth rate: metabolic costs drive trade-offs between growth and swimming performance in Menidia menidia. Evolution 60, 1269–1278. doi: 10.1111/j.0014-3820.2006.tb01204.x
Basaran, F., Ozbilgin, H., and Ozbilgin, Y. D. (2007). Comparison of the swimming performance of farmed and wild gilthead sea bream, Sparus aurata. Aquacult. Res. 38, 452–456. doi: 10.1111/j.1365-2109.2007.01670.x
Bates, D., Maechler, M., Bolker, B., and Walker, S. (2015). Fitting linear mixed-effects models using lme4. J. Stat. Softw. 67, 1–48. doi: 10.18637/jss.v067.i01
Bégout, M. L., and Lagardère, J. P. (1995). “An acoustic telemetry study of seabream (Sparus aurata L.): first results on activity rhythm, effects of environmental variables and space utilization,” in Space Partition within Aquatic Ecosystems, vol 104, Developments in Hydrobiology, eds G. Balvay (Dordrecht, Springer).
Brett, J. R. (1964). The respiratory metabolism and swimming performance of young sockeye salmon. J. Fish. Res. Bd. Can. 21, 1183–1226. doi: 10.1139/f64-103
Brodie, S., Taylor, M. D., Smith, J. A., Suthers, I. M., Gray, C. A., and Payne, N. L. (2016). Improving consumption rate estimates by incorporating wild activity into a bioenergetics model. Ecol. Evol. 6, 2262–2274. doi: 10.1002/ece3.2027
Broell, F., Noda, T., Wright, S., Domenici, P., Steffensen, J. F., Auclair, J. P., et al. (2013). Accelerometer tags: detecting and identifying activities in fish and the effect of sampling frequency. J. Exp. Biol. 216, 1255–1264. doi: 10.1242/jeb.088336
Brownscombe, J. W., Cooke, S. J., and Danylchuk, A. J. (2017). Spatiotemporal drivers of energy expenditure in a coastal marine fish. Oecology 183, 689–699. doi: 10.1007/s00442-016-3800-5
Brownscombe, J. W., Lennox, R. J., Danylchuk, A. J., and Cooke, S. J. (2018). Estimating fish swimming metrics and metabolic rates with accelerometers: the influence of sampling frequency. J. Fish Biol. 93, 207–214. doi: 10.1111/jfb.13652
Clark, T. D., Sandblom, E., Hinch, S. G., Patterson, D. A., Frappell, P. B., and Farrell, A. P. (2010). Simultaneous biologging of heart rate and acceleration, and their relationships with energy expenditure in free-swimming sockeye salmon (Oncorhynchus nerka). J. Comp. Physiol. B 180, 673–684. doi: 10.1007/s00360-009-0442-5
Cooke, S. J., Brownscombe, J. W., Raby, G. D., Broell, F., Hinch, S. G., Clark, T. D., et al. (2016). Remote bioenergetics measurements in wild fish: opportunities and challenges. Comp. Biochem. Physiol. Part A Mol. Integr. Physiol. 202, 23–37. doi: 10.1016/j.cbpa.2016.03.022
Cooke, S. J., Woodley, C. M., Eppard, M. B., Brown, R. S., and Nielsen, J. L. (2011). Advancing the surgical implantation of electronic tags in fish: a gap analysis and research agenda based on a review of trends in intracoelomic tagging effects studies. Rev. Fish Biol. Fish. 21, 127–151. doi: 10.1007/s11160-010-9193-3
Cruz-Font, L., Shuter, B. J., and Blanchfield, P. J. (2016). Energetic costs of activity in wild Lake Trout: a calibration study using acceleration transmitters and positional telemetry. Can. J. Fish. Aquat. Sci. 73, 1237–1250. doi: 10.1139/cjfas-2015-0323
Díaz-Gil, C., Cotgrove, L., Smee, S. L., Simón-Otegui, D., Hinz, H., Grau, A., et al. (2017). Anthropogenic chemical cues can alter the swimming behaviour of juvenile stages of a temperate fish. Mar. Environ. Res. 125, 34–41. doi: 10.1016/j.marenvres.2016.11.009
Farrell, A. P. (2008). Comparisons of swimming performance in rainbow trout using constant acceleration and critical swimming speed tests. J. Fish. Biol. 72, 693–710. doi: 10.1111/j.1095-8649.2007.01759.x
Ferrer, M. A., Calduch-Giner, J. A., Díaz, M., Sosa, J., Rosell-Moll, E., Abril, J. S., et al. (2020). From operculum and body tail movements to different coupling of physical activity and respiratory frequency in farmed gilthead sea bream and European sea bass. Insights on aquaculture biosensing. Comput. Electron. Agric. 175:105531. doi: 10.1016/j.compag.2020.105531
Føre, M., Alfredsen, J. A., and Gronningsater, A. (2011). Development of two telemetry-based systems for monitoring the feeding behaviour of Atlantic salmon (Salmo salar L.) in aquaculture sea-cages. Comput. Electron. Agric. 76, 240–251. doi: 10.1016/j.compag.2011.02.003
Føre, M., Frank, K., Norton, T., Svendsen, E., Alfredsen, J. A., Dempster, T., et al. (2018). Precision fish farming: A new framework to improve production in aquaculture. Biosyst. Eng. 173, 176–193. doi: 10.1016/j.biosystemseng.2017.10.014
Gesto, M., Zupa, W., Alfonso, S., Spedicato, M. T., Lembo, G., and Carbonara, P. (2020). Using acoustic telemetry to assess behavioral responses to acute hypoxia and ammonia exposure in farmed rainbow trout of different competitive ability. Appl. Anim. Behav. Sci. 230:105084. doi: 10.1016/j.applanim.2020.105084
Gleiss, A. C., Dale, J. J., Holland, K. N., and Wilson, R. P. (2010). Accelerating estimates of activity-specific metabolic rate in fishes: testing the applicability of acceleration data-loggers. J. Exp. Mar. Biol. Ecol. 385, 85–91. doi: 10.1016/j.jembe.2010.01.012
Gui, F., Wang, P., and Wu, C. (2014). Evaluation approaches of fish swimming performance. Agric. Sci. 5:42552. doi: 10.4236/as.2014.52014
Halsey, L. G., Green, J. A., Wilson, R. P., and Frappell, P. B. (2009). Accelerometry to estimate energy expenditure during activity: best practice with data loggers. Physiol. Biochem. Zool. 82, 396–404. doi: 10.1086/589815
Halsey, L. G., Shepard, E. L., and Wilson, R. P. (2011). Assessing the development and application of the accelerometry technique for estimating energy expenditure. Comp. Biochem. Physiol. Part A Mol. Integr. Physiol. 158, 305–314. doi: 10.1016/j.cbpa.2010.09.002
Hussey, N. E., Kessel, S. T., Aarestrup, K., Cooke, S. J., Cowley, P. D., Fisk, A. T., et al. (2015). Aquatic animal telemetry: a panoramic window into the underwater world. Science 348:1255642. doi: 10.1126/science.1255642
Kolarevic, J., Aas-Hansen, Ø., Espmark, Å., Baeverfjord, G., Terjesen, B. F., and Damsgård, B. (2016). The use of acoustic acceleration transmitter tags for monitoring of Atlantic salmon swimming activity in recirculating aquaculture systems (RAS). Aquac. Eng. 72, 30–39. doi: 10.1016/j.aquaeng.2016.03.002
Kuznetsova, A., Brockhoff, P. B., and Christensen, R. H. B. (2017). lmerTest package: tests in linear mixed effects models. J. Stat. Softw. 82, 1–26. doi: 10.18637/jss.v082.i13
Lauder, G. V. (2015). Fish locomotion: recent advances and new directions. Ann. Rev. Mar. Sci. 7, 521–545. doi: 10.1146/annurev-marine-010814-015614
Lowe, C. G., Holland, K., and Wolcott, T. G. (1998). A new acoustic tailbeat transmitter for fishes. Fish. Res. 36, 275–283. doi: 10.1016/S0165-7836(98)00109-X
Martins, C. I., Galhardo, L., Noble, C., Damsgård, B., Spedicato, M. T., Zupa, W., et al. (2012). Behavioural indicators of welfare in farmed fish. Fish Physiol. Biochem. 38, 17–41. doi: 10.1007/s10695-011-9518-8
Martos-Sitcha, J. A., Simó-Mirabet, P., Piazzon, M. C., de las Heras, V., Calduch-Giner, J. A., Puyalto, M., et al. (2018). Dietary sodium heptanoate helps to improve feed efficiency, growth hormone status and swimming performance in gilthead sea bream (Sparus aurata). Aquac. Nutr. 24, 1638–1651. doi: 10.1111/anu.12799
Martos-Sitcha, J. A., Sosa, J., Ramos-Valido, D., Bravo, F. J., Carmona-Duarte, C., Gomes, H. L., et al. (2019). Ultra-low power sensor devices for monitoring physical activity and respiratory frequency in farmed fish. Front. Physiol. 10:667. doi: 10.3389/fphys.2019.00667
McKenzie, D. J., Palstra, A. P., Planas, J., MacKenzie, S., Bégout, M. L., Thorarensen, H., et al. (2020). Aerobic swimming in intensive finfish aquaculture: applications for production, mitigation and selection. Rev. Aquac. 13, 1–18. doi: 10.1111/raq.12467
Metcalfe, J. D., Wright, S., Tudorache, C., and Wilson, R. P. (2016). Recent advances in telemetry for estimating the energy metabolism of wild fishes. J. Fish Biol. 88, 284–297. doi: 10.1111/jfb.12804
Montoya, A., López-Olmeda, J. F., Lopez-Capel, A., Sánchez-Vázquez, F. J., and Pérez-Ruzafa, A. (2012). Impact of a telemetry-transmitter implant on daily behavioral rhythms and physiological stress indicators in gilthead seabream (Sparus aurata). Mar. Environ. Res. 79, 48–54. doi: 10.1016/j.marenvres.2012.05.002
Muñoz, L., Aspillaga, E., Palmer, M., Saraiva, J. L., and Arechavala-Lopez, P. (2020). Acoustic telemetry: a tool to monitor fish swimming behavior in sea-cage aquaculture. Front. Mar. Sci. 7:645. doi: 10.3389/fmars.2020.00645
Murchie, K. J., Cooke, S. J., Danylchuk, A. J., and Suski, C. D. (2011). Estimates of field activity and metabolic rates of bonefish (Albula vulpes) in coastal marine habitats using acoustic tri-axial accelerometer transmitters and intermittent-flow respirometry. J. Exp. Mar. Biol. Ecol. 396, 147–155. doi: 10.1016/j.jembe.2010.10.019
Palstra, A. P., Arechavala-Lopez, P., Xue, Y., and Roque, A. (2021). Accelerometry of seabream in a seacage: is acceleration a good proxy for activity? Front. Mar. Sci. 8:144. doi: 10.3389/fmars.2021.639608
Palstra, A. P., Kals, J., Böhm, T., Bastiaansen, J. W., and Komen, H. (2020). Swimming performance and oxygen consumption as non-lethal indicators of production traits in Atlantic salmon and Gilthead seabream. Front. Physiol. 11:759. doi: 10.3389/fphys.2020.00759
Palstra, A. P., Mes, D., Kusters, K., Roques, J. A., Flik, G., Kloet, K., et al. (2015). Forced sustained swimming exercise at optimal speed enhances growth of juvenile yellowtail kingfish (Seriola lalandi). Front. Physiol. 5:506. doi: 10.3389/fphys.2014.00506
Palstra, A. P., van Ginneken, V., and van den Thillart, G. (2008). Cost of transport and optimal swimming speed in farmed and wild European silver eels (Anguilla anguilla). Comp. Biochem. Physiol. Part A Mol. Integr. Physiol. 151, 37–44. doi: 10.1016/j.cbpa.2008.05.011
R Core Team (2020). R: A Language and Environment for Statistical Computing. Available online at: https://www.r-project.org/
Rouleau, S., Glémet, H., and Magnan, P. (2010). Effects of morphology on swimming performance in wild and laboratory crosses of brook trout ecotypes. Funct. Ecol. 24, 310–321. doi: 10.1111/j.1365-2435.2009.01636.x
Šegvić-Bubić, T., Arechavala-Lopez, P., Vučić, I., Talijančić, I., Grubišić, L., ŽuŽul, I., et al. (2018). Site fidelity of farmed gilthead seabream Sparus aurata escapees in a coastal environment of the Adriatic Sea. Aquac. Environ. Interact. 10, 21–34. doi: 10.3354/aei00251
Sfakiotakis, M., Lane, D. M., and Davies, J. B. C. (1999). Review of fish swimming modes for aquatic locomotion. IEEE J. Ocean Eng. 24, 237–252. doi: 10.1109/48.757275
Shepard, E. L., Wilson, R. P., Quintana, F., Laich, A. G., Liebsch, N., Albareda, D. A., et al. (2008). Identification of animal movement patterns using tri-axial accelerometry. Endanger. Species. Res. 10, 47–60. doi: 10.3354/esr00084
Steinhausen, M. F., Fleng Steffensen, J., and Gerner Andersen, N. (2010). The effects of swimming pattern on the energy use of gilthead seabream (Sparus aurata L.). Mar. Fresh. Behav. Physiol. 43, 227–241. doi: 10.1080/10236244.2010.501135
Svendsen, J. C., Tirsgaard, B., Cordero, G. A., and Steffensen, J. F. (2015). Intraspecific variation in aerobic and anaerobic locomotion: gilthead sea bream (Sparus aurata) and Trinidadian guppy (Poecilia reticulata) do not exhibit a trade-off between maximum sustained swimming speed and minimum cost of transport. Front. Physiol. 6:43. doi: 10.3389/fphys.2015.00043
Thorstad, E. B., Rikardsen, A. H., Alp, A., and Økland, F. (2013). The use of electronic tags in fish research—an overview of fish telemetry methods. Turk. J. Fish. Aquat. Sci. 13, 881–896. doi: 10.4194/1303-2712-v13_5_13
Tucker, V. A. (1970). Energetic cost of locomotion in animals. Comp. Biochem. Physiol. 34, 841–846. doi: 10.1016/0010-406X(70)91006-6
Van Den Thillart, G. E. E. J., Van Ginneken, V., Körner, F., Heijmans, R., Van der Linden, R., and Gluvers, A. (2004). Endurance swimming of European eel. J. Fish Biol. 65, 312–318. doi: 10.1111/j.0022-1112.2004.00447.x
Wikelski, M., and Cooke, S. J. (2006). Conservation physiology. Trends Ecol. Evol. 21, 38–46. doi: 10.1016/j.tree.2005.10.018
Wilson, S. M., Hinch, S. G., Eliason, E. J., Farrell, A. P., and Cooke, S. J. (2013). Calibrating acoustic acceleration transmitters for estimating energy use by wild adult Pacific salmon. Comp. Biochem. Physiol. Part A Mol. Integr. Physiol. 164, 491–498. doi: 10.1016/j.cbpa.2012.12.002
Wright, D. W., Stien, L. H., Dempster, T., and Oppedal, F. (2019). Differential effects of internal tagging depending on depth treatment in Atlantic salmon: a cautionary tale for aquatic animal tag use. Curr. Zool. 65, 665–673. doi: 10.1093/cz/zoy093
Wright, S., Metcalfe, J. D., Hetherington, S., and Wilson, R. (2014). Estimating activity-specific energy expenditure in a teleost fish, using accelerometer loggers. Mar. Ecol. Progr. Ser. 496, 19–32. doi: 10.3354/meps10528
Keywords: acoustic telemetry, oxygen consumption, head orientation, tail beats, swimming behavior, aquaculture
Citation: Arechavala-Lopez P, Lankheet MJ, Díaz-Gil C, Abbink W and Palstra AP (2021) Swimming Activity of Gilthead Seabream (Sparus aurata) in Swim-Tunnels: Accelerations, Oxygen Consumption and Body Motion. Front. Anim. Sci. 2:679848. doi: 10.3389/fanim.2021.679848
Received: 12 March 2021; Accepted: 17 June 2021;
Published: 09 July 2021.
Edited by:
Martin Føre, Norwegian University of Science and Technology, NorwayReviewed by:
Miguel Angel Ferrer, University of Las Palmas de Gran Canaria, SpainRyo Kawabe, Nagasaki University, Japan
Copyright © 2021 Arechavala-Lopez, Lankheet, Díaz-Gil, Abbink and Palstra. This is an open-access article distributed under the terms of the Creative Commons Attribution License (CC BY). The use, distribution or reproduction in other forums is permitted, provided the original author(s) and the copyright owner(s) are credited and that the original publication in this journal is cited, in accordance with accepted academic practice. No use, distribution or reproduction is permitted which does not comply with these terms.
*Correspondence: Pablo Arechavala-Lopez, cGFibG9AZmlzaGV0aG9ncm91cC5uZXQ=