 Anderson Antonio Carvalho Alves1*
 Lucas Tassoni Andrietta2
 Rafael Zinni Lopes2
 Fernando Oliveira Bussiman2
 Fabyano Fonseca e Silva3
 Roberto Carvalheiro4,5
 Luiz Fernando Brito6
 Júlio César de Carvalho Balieiro2
 Lucia Galvão Albuquerque4,5
 Ricardo Vieira Ventura2*
- 1Department of Education, Federal Institute of Education, Science and Technology of Maranhão (IFMA), São Raimundo das Mangabeiras, Brazil
- 2Department of Animal Nutrition and Production, School of Veterinary Medicine and Animal Science, University of São Paulo, Pirassununga, Brazil
- 3Department of Animal Science, Federal University of Viçosa, Viçosa, Brazil
- 4Department of Animal Science, School of Agricultural and Veterinary Sciences, Säo Paulo State University (UNESP), Jaboticabal, Brazil
- 5National Council for Scientific and Technological Development (CNPq), Brasilia, Brazil
- 6Department of Animal Sciences, Purdue University, West Lafayette, IN, United States
This study focused on assessing the usefulness of using audio signal processing in the gaited horse industry. A total of 196 short-time audio files (4 s) were collected from video recordings of Brazilian gaited horses. These files were converted into waveform signals (196 samples by 80,000 columns) and divided into training (N = 164) and validation (N = 32) datasets. Twelve single-valued audio features were initially extracted to summarize the training data according to the gait patterns (Marcha Batida—MB and Marcha Picada—MP). After preliminary analyses, high-dimensional arrays of the Mel Frequency Cepstral Coefficients (MFCC), Onset Strength (OS), and Tempogram (TEMP) were extracted and used as input information in the classification algorithms. A principal component analysis (PCA) was performed using the 12 single-valued features set and each audio-feature dataset—AFD (MFCC, OS, and TEMP) for prior data visualization. Machine learning (random forest, RF; support vector machine, SVM) and deep learning (multilayer perceptron neural networks, MLP; convolution neural networks, CNN) algorithms were used to classify the gait types. A five-fold cross-validation scheme with 10 repetitions was employed for assessing the models' predictive performance. The classification performance across models and AFD was also validated with independent observations. The models and AFD were compared based on the classification accuracy (ACC), specificity (SPEC), sensitivity (SEN), and area under the curve (AUC). In the logistic regression analysis, five out of the 12 audio features extracted were significant (p < 0.05) between the gait types. ACC averages ranged from 0.806 to 0.932 for MFCC, from 0.758 to 0.948 for OS and, from 0.936 to 0.968 for TEMP. Overall, the TEMP dataset provided the best classification accuracies for all models. The most suitable method for audio-based horse gait pattern classification was CNN. Both cross and independent validation schemes confirmed that high values of ACC, SPEC, SEN, and AUC are expected for yet-to-be-observed labels, except for MFCC-based models, in which clear overfitting was observed. Using audio-generated data for describing gait phenotypes in Brazilian horses is a promising approach, as the two gait patterns were correctly distinguished. The highest classification performance was achieved by combining CNN and the rhythmic-descriptive AFD.
Introduction
The Brazilian gaited horse industry is booming steadily, with economic increases headed by different activities, including livestock and horseback riding, gait and endurance competitions, and equine therapy. Horse breeds such as the Mangalarga Marchador (MM), the most numerous in Brazil, have become more common around the world, with a substantial increase in the number of national registrations and exports of embryos and live animals [Fonseca et al., 2017; Brazilian Association of Mangalarga Marchador Horse Breeders—Associação Brasileira dos Criadores do Cavalo Mangalarga Marchador (ABCCMM), 2019].
In the past few decades, significant progress in the understanding of the biological and biomechanical mechanisms associated with gait patterns in different horse breeds has been achieved. Remarkably, the availability of numerous data sources has been contributing to the study of different aspects that directly affect the worldwide gaited horse industry, including the description of locomotion pattern using kinematic data (Hobbs et al., 2016), body-mounted sensors data analysis for both lameness diagnosis (McCracken et al., 2012) and gait characterization (Olsen et al., 2012; Sapone et al., 2020; Serra Bragança et al., 2020), blood-assessed gait metabolic profiles (Wanderley et al., 2010; Lage et al., 2017), and gait genetics, based either on traditional pedigree data (Rustin et al., 2009; Bussiman et al., 2020) or high-throughput genotyping technologies (Kristjansson et al., 2014; Fonseca et al., 2017; Jäderkvist et al., 2017).
Brazilian gaited horse breeds are characterized by exhibiting a natural smooth four-beat gait, termed “marcha”, which is classified into two main groups according to the animal leg movements: lateral (marcha picada—MP) or diagonal (marcha batida—MB). These two gait phenotypes show remarkable differences related to the speed, range of motion, step frequency per unit of time, leg dissociation movements, among other factors (Wanderley et al., 2010), which are generally assessed subjectively based on visual inspection. Although kinematic analysis of camcorder data has been considered an alternative to the traditional subjective assessment, this approach can be laborious and time-consuming, as it involves a frame-by-frame inspection (Nicodemus and Clayton, 2003; Bussiman et al., 2018).
Some differences between MB and MP are acoustic-perceptible which motivated us to investigate the suitability of audio signal processing (ASP) as a complementary method for describing the horses' gait patterns. ASP refers to the set of computational, mathematical, and engineering methods focused on the manipulation and information retrieval of digital audio signals for different purposes. Successful applications of ASP include speech emotion recognition (Mustaqeem Kwon, 2020), music genre classification (Ghosal and Kolekar, 2018), and disease diagnosis (Miranda et al., 2019), just to name a few.
Under the gaited horse industry perspective, when compared to traditional methods for evaluating and classifying gait types (human subjective evaluation, sensors, and video monitoring, among others), the sound-enabled analysis might be a novel and cost-effective high-throughput phenotyping for horse breeding purposes. In this context, the first step toward this goal is to assess if audio-generated data can be used to accurately classify different gait types. As the information extracted from audio signals can be highly complex, using advanced classification algorithms such as machine learning and deep learning techniques may be of great importance for exploring hidden non-linear patterns in the data, and thus, enhancing the classification accuracy.
This study aimed to investigate the usefulness of audio signal processing in phenotyping schemes of gaited horses. Therefore, we assessed the performance of machine learning (support vector machine and random forests) and deep learning (multilayer perceptron neural networks and convolutional neural networks) algorithms for classifying two common phenotypes (MB and MP) exhibited by Brazilian gaited horses according to different features datasets extracted from digital audio signals.
Materials and Methods
Audio Data Acquisition and Edition
A total of 196 short-time audio files were extracted from Brazilian horses gaiting videos, publicly available on the Youtube platform and other social media. The full-length audios were manually labeled into 0 or 1 values by a trained evaluator according to the gait type (MB or MP, respectively). The original extracted audio files had a sampling rate (SR) ranging between 44 and 48 kHz, besides, all were monophonic and had 16-bit depth. All recordings were edited using the freely available Audacity© audio software (www.audacityteam.org), retaining only a short-length audio content (4 s) aiming to exclude uninformative noises (e.g., background music, riders/owners voices, and background environment sound). All audio files were then converted to the .wav format. These 4 s-length segmentations were performed following the “Fair use on Youtube” guidelines (www.support.google.com/youtube/answer/9783148). Furthermore, all information regarding horse riders/owners as well as animal identification were recoded to avoid any non-authorized exposure.
After the editing procedures, all audios were integrated and processed using librosa (McFee et al., 2015), a python library. The audio files were imported and down-sampled using the librosa.load function, considering an SR of 20 kHz (i.e., 20.000 samples per second). This process generated a one-dimensional real-valued vector of size equal to 80 k for each file, containing the time series of the audio amplitude values (waveform). Finally, the imported audio time series were decomposed into harmonic and percussive components using the librosa.effects.hpss functionality. This function automates the following pipeline (McFee et al., 2015): (a) convert the audio time series into sliding windows, considering 2048 samples per frame and overlapping of 75%, resulting in 157 windows frames; (b) apply the fast Fourier transform into the windowed segments of the signal to convert it from time to frequency domain. This algorithm is known as short-time Fourier transform (STFT) and generates the spectrum of frequencies of the audio signal over time, the spectrogram; (c) Use the spectrogram as input in the median-filtering mask for harmonic/percussive separation (Fitzgerald, 2010); (d) convert separately the complex-valued spectrograms of the percussive and harmonic components back to the audio signal time series using the inverse-STFT.
The audio signal of the percussive component for each file was then kept for further analyses. This pre-processing was applied as a denoising step before the audio-feature extraction. The resultant smoothed waveform data frame had dimensions equal to 196 × 80,000, considering all audio files, which were subsequently divided into training (N = 164) and validation (N = 32) datasets.
Audio-Feature Extraction and Reshaping
As a first step, the raw waveforms in the training dataset were used for extracting several single-value audio features aiming to describe the gait types (MB and MP) according to statistical, spectral, and rhythmic attributes. Spectral-based features were extracted from the spectrogram, obtained by applying the Fourier transform at successive windowed overlapping segments of the audio signal (Rao, 2008). All audio features were extracted using librosa (McFee et al., 2015) or other general-use python libraries. A python script exemplifying this process can be found at https://github.com/alvesand/sound-analysis-with-librosa.
In brief, the audio features initially analyzed are:
Signal minimum: the most negative value in the waveform time series; Signal maximum: the highest value in the waveform time series; RMS: the root-mean-square for each time frame in the waveform time series. The time-series RMS array was then averaged for each sample; ZCR: the zero-crossing rate for the audio time series, computed by counting how many times the amplitude signal changed, divided by the total number of amplitude samples; Tempo: An estimate of global tempo (beats per minute) for the audio sample; AOS: the average value of the onset strength envelope, which is computed with the spectral flux operation in the log-power Mel spectrogram (Böck and Widmer, 2013). Centroid: estimates the frequency value for each time frame in which the spectrogram energy mass is concentrated. For each audio sample, the centroid values were averaged as a global measure for the spectral centroid. Spectral contrast: it considers the differences between the spectral peak and valley in each sub-band (Jiang et al., 2002). The average of the Spectral Contrast array was then computed for each sample. Spectral bandwidth: roughly speaking, it gives a weighted standard deviation of the spectrogram frequency values at each time frame. Roll-off: gives the frequency value below which a specified percentage of the total spectrogram energy per time-frame is concentrated. Two percentage values were defined for approximating the minimum and maximum frequencies per time-frame, Roll-off (15%) and Roll-off (85%), respectively; MFCC[1]: Computed by averaging the array with the first component of the Mel-frequency cepstral coefficients (MFCC). The MFCC concept is further explained in the next section.
Using the glm function in the R statistical package (R Core Team, 2020), a multiple logistic regression analysis was performed by fitting these 12 audio features as covariables and gait type as the response variable in a generalized linear model with a logit link. Based on the significance of the estimated z-scores from the regression covariables, the MFCC, Onset Strength, and Tempo features were kept for further analyses. Multi-dimensional arrays of the selected features were developed for capturing time-frame-specific variations. The following sections provide some key concepts on these audio features and the process of creating the input vectors for the classification algorithms is also described.
Mel-Frequency Cepstral Coefficients
The MFCCs have been extensively used as a product obtained from feature extraction mechanisms, in areas such as speech recognition in humans (since they are proposed to represent human sound perception), animal vocalizations, audio information retrieval, and for detecting the health status of several animal species (Lee et al., 2006; Chung et al., 2013). MFCC offers a compact representation of the evaluated sounds for subsequent analysis. The Mel scale results from a non-linear transformation of the frequency scale to linearly approximate the human perception ability to small changes in pitch at both low and high frequencies (Dhonde and Jagade, 2015; Aslan and Akin, 2018).
The MFFCs computing process can be summarized as follows (Rao, 2008; Serizel et al., 2017):
(a) The sound signals obtained from horse gaits are fragmented into short blocks known as frames, assuming that frequencies are stationary in short-time audio segments. This step is crucial to apply a Fourier transform on the generated frames. A windowing approach is applied to reduce spectral leakage. This process is used to avoid the signal discontinuity created after framing the original sound. The audio signals were converted into overlapping windows considering a constant number of samples per window (n_fft) and the hop size for sampling the next window (hop_length); (b) Compute the STFT over each window, yielding the magnitude spectrogram; (c) Apply the Mel filter bank to the power spectra obtained in the previous step and sum the energy within each filter; (d) Compute the logarithmic for the filterbank energies; and, (e) Apply the discrete cosine transform (DCT) on the log Mel filterbanks to compute the cepstral coefficients:
where Nmfcc is the number of log filterbank energies, Xm is the log energy in the mth Mel frequency band and, c is the index for the ith cepstral coefficient (for i = 1, 2, 3, … Nmfcc). In this study we set n_fft = 2048, hop_length = 512 and Nmfcc = 13, generating a two-dimensional feature map for each audio file with the frequencies' magnitudes in the Mel scale over 13 MFCCs and 157 time-frames (100 ms length windows with approximately 75% of overlapping samples). MFFCs were computed using the librosa function librosa.feature.mfcc, a step-wise summary of the whole process is shown in Figure 1.
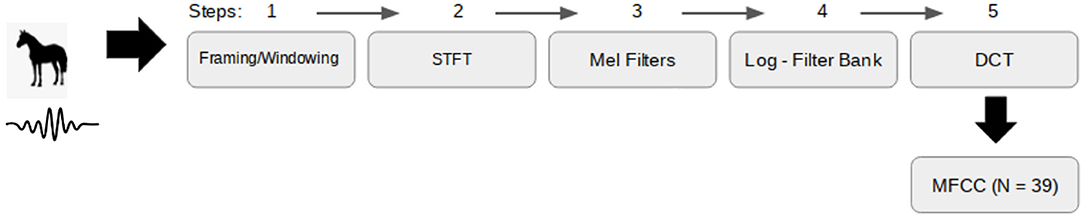
Figure 1. Step-wise summary of how to extract Mel-frequency cepstrum coefficients (MFCC) from a .wav file. STFT, short-time Fourier transform; DCT, discrete cosine transform.
Finally, the thirteen 1 × 157 arrays (MFCC1, MFCC2, MFCC3, …, MFCC13, representing the 13 Mel coefficients) were concatenated into a one-dimensional vector of size 2041 and used as the input information for the classification algorithms in preliminary analyses. Due to the observed overfitting in the training phase for all tested models, an additional feature selection step was performed using the Random Forest (Supplementary Figure 1). After feature selection, only values related to MFCC1 and MFCC4 were kept for further analyses, resulting in 314 input features for each audio file.
Onset Strength
In ASP, the term onset refers to the beginning of a sound event, the strength of each onset can be modulated as the change in the spectral energy distribution, by taking the differences between two consecutive short-time spectra in a frame-wise manner and summing all positive deviations (Böck and Widmer, 2013). In the librosa library the OS at time t is determined with a modified version of the spectral flux (SF) function (Böck and Widmer, 2013):
where S(f, t) is the log-power Mel spectrogram at time bin t and frequency f; μ is a time lag parameter for computing the differences (by default, μ = 1). To compute S(f, t), the steps “a” to “d” from the previous section are followed, using by default 256 Mel frequency bands. The SF algorithm produces an array with 154 features (the onset strength envelope), which was used as the input dataset in the classification algorithms. According to McFee and Ellis (2014), the OS envelope provides a useful way to visualize the relevant information throughout the audio by representing the amount of spectral energy change at each frame. It has a paramount role in computing the likelihood that a prominent change has occurred at a given time frame (e.g., a horse gait event).
Tempogram (TEMP)
The tempo is a terminology commonly adopted in the music industry, it refers to the speed or pace of a given musical piece, measured in beats per minute (BPM). The tempogram is a feature matrix encoding the tempo variation over some time intervals, as the pace can vary locally. In the librosa library, a cyclic tempogram is obtained by computing local autocorrelation of the onset strength envelope, in which octave equivalent tempi classes are considered for avoiding pulse level ambiguity (Grosche et al., 2010). The time-wise tempi prevalence in the audio signals is represented with a correlogram matrix, where the rows are the BPM classes and the columns are the time-frame classes. We set the onset autocorrelation window size equal to 157. This was done for considering the 4-s length prevalence in the audio files (157 × hop_length / SR ≈ 4 s). The TEMP dataset was then obtained by column-wise averaging the square matrix (the tempogram), resulting in 157 input features per file.
Principal Component Analysis
Principal component analysis (PCA) is a multivariate technique useful for reducing the complexity and dimensionality of data with a large number of correlated features by projecting them onto orthogonal vectors of lower dimension named principal components (PC) (Lever et al., 2017). PCA can be considered as an unsupervised learning method in the sense that it can find some pattern in the data without prior knowledge and without providing any target variable (Lever et al., 2017). A PCA was performed for the 12 single-value features set and for each audio-feature dataset—AFD (MFCC, OS and, TEMP), identified after obtaining the results from the multiple logistic regression analysis as previously described. This was done as a preliminary step to potentially find some linear pattern in the audio data that could discriminate well the gait types. The first two PC (PC1 and PC2) were computed in the training labels using the prcomp function and visualized with 2D scatter plots. All analyses were performed using the R environment and its respective programming language resources (R Core Team, 2020).
Supervised Machine Learning Algorithms
Random Forest
RF is a supervised ensemble learning method that merges the concepts of bootstrap aggregation (bagging) and random split feature selection (Breiman, 2001). The basic unit of the RF is a decision tree, generally fitted using the Classification and Regression Trees (CART) methodology. CART is based on recursive binary splitting of the predictor space at each internal node of the tree until achieving homogeneous or near homogeneous classes into the terminal nodes. A decision tree classifies unobserved data by attributing to it the most commonly occurring class in the subregion it belongs to, after splitting the predictor space (Breiman, 2001).
In the RF algorithm, each tree is grown using a bootstrap sample, obtained by a random sampling process (with replacement) from the original training dataset. The second randomness component in the RF algorithm is introduced in the tree building process. Only mtry predictor variables are randomly selected from all p features (with mtry ≤ p) as candidates for optimizing the splitting rule at each tree node. This trick makes the algorithm less greedy and decorrelates the trees by giving the chance of weak predictors to contribute jointly with the other features for the final learning rule. The information of hundreds or thousands of trees generated with the different bootstrapped training data sets is then aggregated and, the final classification is given by majority voting of all ensembled trees, where the number of trees to grow is a user-defined choice, determined by the hyperparameter ntree (Chen and Ishwaran, 2012).
The best hyperparameters configuration for each AFD (MFCC, OS, or TEMP) was set by using a grid-search procedure on the training data. We assessed different combinations of values for ntree (200, 500, 1000, 3000), mtry (, ≈ 0.1p, ≈ 0.3p and ≈ 0.5p, for p representing the number predictors in each data set) and nodesize (1, 3, 5, and 10). The RF method was implemented in the randomForest R package (Liaw and Wiener, 2002), available in the CRAN repository (https://cran.r-project.org/).
Support Vector Machine
In binary classification tasks, the SVM algorithm aims to find some optimum linear hyperplane by maximizing the decision margin between the two classes while penalizing misclassified observations. SVM can deal with nonlinearity by using a function φ(xi) for mapping the input data into a high-dimensional feature space, where data points are linearly separable.
Let D = {yi, xi}, i = 1, 2, …N, be the training data set, with yi ϵ {0, 1} representing the class labels for the two horse gait types (MB or MP) and xi a p-dimensional input vector of real-valued predictors extracted from the audio signals scaled to lie between 0 and 1. Introducing Lagrange multipliers one can represent the SVM optimization problem using the dual representation (Hastie et al., 2009):
in which ai are the Lagrange multipliers associated with each observation, C is a user predefined positive regularization parameter and k〈xi, xj〉 = φ(xi)φ(xj) is the kernel function. Due to its good generalization capability while dealing with possible nonlinearity in the input data, we used the radial basis function (RBF) as the kernel:
in which γ is the user-predefined kernel bandwidth hyper-parameter and, xi and xj are the vectors of predictor variables for labels i and j, respectively. The classification of unlabeled data (xt) is given by:
where N_SV is the number of support vectors, i.e., the trained data points for which ai > 0. The best combination for the hyperparameter values in each AFD was set by using a grid-search procedure on the training data, with C and γ ϵ {0.00001, 0.0001, 0.001, 0.01, 0.1, 1, 10, 100}. The SVM was fitted using the e1071 R package (Meyer et al., 2019).
Supervised Deep Learning Algorithms
Deep learning (DL) is a subfield of ML which comprises a wide variety of techniques for implementing multi-layered neural networks. It has been the state-of-art method for dealing with unstructured data arising in many research areas such as machine translation, computer vision, and speech recognition (Voulodimos et al., 2018; Mustaqeem Kwon, 2020; Popel et al., 2020). Recent applications of DL in livestock include the prediction of complex traits in quantitative genomics (Abdollahi-Arpanahi et al., 2020) and precision farming (Qiao et al., 2019). Supervised DL techniques can be classified according to different architectures such as multilayer perceptron (MLP), deep belief networks (DBN), convolutional neural networks (CNN), and recurrent neural networks (RNN). A comprehensive review of different DL methods can be found in Emmert-Streib et al. (2020). This study focused on the implementation of MLP and CNN, two very common DL algorithms. The basic components and key concepts are described in the next subsections.
Multilayer Perceptron
The MLP is the simplest neural network (NN) architecture and comprises several layers fully connected in a feedforward propagation scheme. These layers can be divided into the input layer, which receives the input data (here, the audio-based features), hidden layers, containing the mapping processing units, also called neurons, and the output layer which gives the outcomes of the NN. Conventionally, an MLP architecture can be considered deep if it consists of more than two hidden layers (Yoshua, 2009). Our proposed architecture is composed of 3 fully connected hidden layers as schematically depicted in Figure 2. In this NN topology, each neuron in the hidden layer computes a score given by a weighted linear summation of the values from the previous layer. The neuron-specific scores are then mapped by a linear or non-linear activation function. Finally, the output layer receives the mapped scores from the last hidden layer for computing the output values (Figure 2).

Figure 2. Schematic representation of the trained multiple-layer perceptron neural networks. Each layer receives the outputs from the previous layer and computes weighted linear summations followed by some linear or nonlinear processing, X represents the audio-based features data, the W's and b's are the matrices or vectors of weights and biases, φ are the neurons activation functions, nh1, nh2 and nh3 are the number of neurons in the hidden layers.
Let y be an n x 1 vector containing the labels indicating the gait types for each observation, with yi ϵ {0, 1}, and X = {xi} is the n x p matrix of audio-based features, with xi as specified before. In Figure 2, the first hidden layer (H1) performs the following computation: , where W1 is a p x nh1 weights matrix connecting the input variables to each neuron, with nh1 standing for the user predefined number of neurons in H1; b1 is an n x nh1 matrix of neuron-specific constants called biases; φ1 is an activation function used for mapping the nh1 neuron-specific scores, and Z[1] is an n x nh1 matrix containing the H1 activated outputs. The second hidden layer (H2) performs the following computation: , in which W2 is the weight matrix of dimension nh1 x nh2 (nh2 = number of neurons in the second hidden layer) that connects Z[1] into the H2 neuron units; b2 is the n x nh2 matrix of biases; φ2 is the activation function for the neurons in H2; and Z[2] is the n x nh2 matrix of outputs for H2; analogously, the outputs for H3 are computed as . Lastly, the neurons in the output layer compute the following quantities: , in which Wo is the weight matrix of dimension nh3 x 2 connecting Z[3] to the output layer; bo is the n x 2 matrix of biases and φo represents the softmax function, which was maintained as the output layer activation function for all DL implementations in this study. The softmax activation function is given by:
where is the n x 2 matrix of logits scores, are the elements of the ith row of the matrix Z[o], and l is the number of levels or classes, with l = 2 for binary classification problems. This results in n bidimensional vectors containing the probabilities that a given sample belongs to each gait type, and the MLP classification is given by the class with the highest probability:
For classification problems the loss function is generally the cross-entropy given as follows:
where W represent the model parameters, is the L2 regularization term for penalizing complex models and α > 0 are hyperparameters that control the magnitude of the penalty. The basic learning process of an MLP involves backpropagating the updated values of W, obtained with some gradient descent based-techniques, until reach its minimal (Goodfellow et al., 2016).
For finding the architecture with the best generalization capability, we considered different values for the MLP hyperparameters, including the optimization algorithm (sgd, adam, nadam and, RMSprop), learning rate (0.001, 0.01, 0.05, 0.1), nh1 (512, 256, 128, 64, 32), nh2 (64, 32, 16, 8), nh3 (32, 16, 8, 4), batch size (8, 16, 32, 64), dropout (0.01, 0.1, 0.3, 0.5) and hidden layers activation function (sigmoid—sig, tangent hyperbolic—tanh, rectified linear unit—ReLU, or exponential linear unit—ELU), with φ1 = φ2 = φ3. Due to the computation burden in assessing each possible combination of hyperparameter values in the traditional grid-search procedure, the network optimization was performed using a genetic algorithm (GA).
Briefly, the GA evolves a population of candidate models, represented with vectors that contain different values for the hyperparameters. The models with the best fitness scores (measured with some loss function) are then selected and combined into new vectors that aggregate the features of both parent vectors. The GA was implemented using an R library (Scrucca, 2013), considering 100 generations, population size equal to 20, elitism of 2 (the best two models are selected for crossing), and a mutation rate of 0.1 (the probability of a given hyperparameter value to change randomly). All models were run with 150 epochs and the best two configurations, hereinafter named MLP1 and MLP2, were found for each AFD and retained for comparisons across models. The MLP was implemented in the Keras version for R (Allaire and Chollet, 2017) using Tensorflow (Allaire and Tang, 2018) as a backend. Supplementary Table 1 summarizes the final configurations for MLP1 and MLP2 according to the different audio-based features used as predictor variables.
Convolutional Neural Network
A CNN is a special case of neural networks composed of convolutional layers, pooling layers, and feed-forward fully-connected layers that are conceived to deal with different unstructured multidimensional data represented by two or three-dimensional arrays such as images and videos (Emmert-Streib et al., 2020). Indeed, most applications of CNN for audio-based classifications are converted into image classification tasks by using visual representations of the audio features (e.g., Spectrograms) as the input information (e.g., Rubin et al., 2016; Ghosal and Kolekar, 2018; Su et al., 2020). However, for a meaningful comparison of the predictive ability across models, we used the same input data as the other methods for training the CNN, which converts it into a one-dimensional CNN (1D-CNN).
The first CNN component is the convolutional layer (or layers) which can extract local spatial or temporal dependency by performing operations between the input data and arrays of a predefined size, called kernels or filters. Instead of applying fully connected operations, a kernel operates locally and moves forward in the input space until it reaches its limit, sliding into it according to the stride size (str_s). A convolutional layer is composed of k equally sized filters, which will learn different patterns from the input data, for one-dimensional input vectors, each filter has the dimension of 1 x k_s, where k_s is a user predefined size. Convolutional operations for a 1D-CNN, considering kernel size = 2 and stride = 1, can be represented as follows:
in which represents the ith column vector (with i = 1, 2, 3, … N) for the kth filter in the convolutional layer, and are learnable parameters. The dimension of will depend mainly on the kernel size and stride, with , where pa represents the number of zeros padded on each side of the input vector. This is useful for preserving the input dimension. The convolution operation outputs are generally mapped with an activation function before passing to the next layer of the network. Here, the ReLU function was used to map all filters in the convolution layer, .
The activated filters in the convolution layer are further processed by the pooling layers to reduce the dimension of the inputs (with minimal loss of information) as well as introducing slight invariance to small changes (Pérez-Enciso and Zingaretti, 2019; Emmert-Streib et al., 2020). The pooling operations extract single information of successive groups of the filter outputs by performing operations such as the mean, maximum, or minimum. The main pooling layer hyperparameters are the size of the pooling window (poo_s) and stride (poo_str) that were set to be equal in the present study. For instance, a max-pooling operation with pooling windows size equal to 2 will half the size of the convolution layer outputs as follows:
Lastly, for classifying the horses' gait types, the k different maps from the pooling layer (represented as a 3D tensor) are flattened into one-dimensional vectors and used to feed the input layer of an MLP, with the main elements as explained before. The general architecture of the built 1D-CNN in this study is depicted in Figure 3. The proposed 1D-CNN is composed of one convolutional layer, one pooling layer, and a feedforward MLP with two hidden layers and dropout regularization. The ReLU and softmax activation functions were fixed for the hidden layers and output layer, respectively.

Figure 3. Schematic representation of the used 1D CNN general architecture. The input layer receives the audio-based features data that were extracted from raw audio-signal; the convolutional layer is composed of k filters; each filter captures information in the input data by performing local operations involving a limited number of input features depending on the filter size (filters of size = 2 are represented) and moves toward the input data space according to the stride size (stride size = 1 is represented); the pooling layer operates by converting the outputs of the convolutional layer at some certain locations into a single value by taking its maximum (max-pooling operation); the last layer is a fully-connected multilayer perceptron that receives flatten pooling layer outputs as input information.
As presented for the MLP, the CNN was optimized using the GA considering different values for the number of filters (8, 16, 32, 64), k_s (1, 2, 3, 4), str_s (1, 2, 3, 4), poo_s (1, 2, 3, 4), nh1 (256, 128, 64, 32, 16, 8, 4), nh2 (8, 16, 32, 64), dropout rate (0.01, 0.1, 0.3, 0.5), optimization algorithm (sgd, adam, nadam and, RMSprop), learning rate (0.001, 0.01, 0.05, 0.3), and batch size (8, 16, 32, 64). All models were run with 150 epochs for the backpropagation optimizer and, the best two configurations (CNN1 and CNN2) were defined for each AFD (MFCC, TEMP, and OS), final CNN architectures are shown in Supplementary Table 1. CNN was implemented in the R version of Keras and Tensorflow (Allaire and Chollet, 2017; Allaire and Tang, 2018).
Training and Validation Processes
For the models fine-tuning, the training set was further subdivided into two groups, containing ~ 2/3 and 1/3 of the total number of data points. In the grid-search or GA procedures, the first group (~ 67%) was used for training the different methods considering different hyperparameter combinations, whereas the classification accuracy was monitored in the remaining group (~33%). The best model hyperparameter configuration was defined for each AFD considering the classification accuracy in the monitoring group. After setting the models hyperparameters, we performed a five-fold cross-validation scheme considering 10 replicates in the training data, to allow more realistic comparisons across the different methods.
The final models were also fitted to all training data points (N = 164) according to the AFD and used for classifying independent validation data points (N = 32), which were omitted during the fine-tuning and cross-validation processes. This was done to prevent overfitting (a scenario where the model predictions provide excellent accuracy in the training phase but poorly perform when presented to new data, not previously introduced to the modeling problem). The metrics used for comparing the models' performance were the classification accuracy (ACC = number of correct classifications divided by the total number of samples), specificity (SPEC = MB correctly identified among all MB samples in the validation set), sensitivity (SEN = MP correctly identified among all MP samples in the validation set), and area under the curve (AUC). Multiple pairwise Tukey tests were performed in the R package for comparing the models' performance within each AFD.
Results
Audio-Feature Descriptive Analysis
Waveforms and spectrograms of random audio data representing each gait pattern (MB or MP) are depicted in Figure 4. The sound waves can be rendered digitally by sampling the audio signal amplitudes at discrete time intervals, this provides a convenient way to visualize audio data over time. As highlighted before, we set up a sampling rate of 20 kHz which means that 20,000 audio amplitude samples were taken per second. From visual inspection, it can be seen important differences in the dynamics of the audio signal over time according to the gait type considered. The audio selected for MB presented wider wavelengths with signals presenting relatively similar amplitude values over time whereas the MP audio data presented shorter wavelengths with several small peaks in-between waves with higher amplitude values (Figure 4). The spectrograms, i.e., visual representation of the sound frequencies spectrum over time (Rao, 2008), show that for the MB audio sample, the frequencies with the highest energy (horizontal brightest region) lied into two different ranges, at lowest and highest-frequency bands (from 0 to 2000 Hz and, from 6000 to 9000 Hz), without major changing over time. For the MP audio sample, the frequencies with higher energy were most present until 4000 Hz, as suggested by visual inspection of the spectrogram (Figure 4).
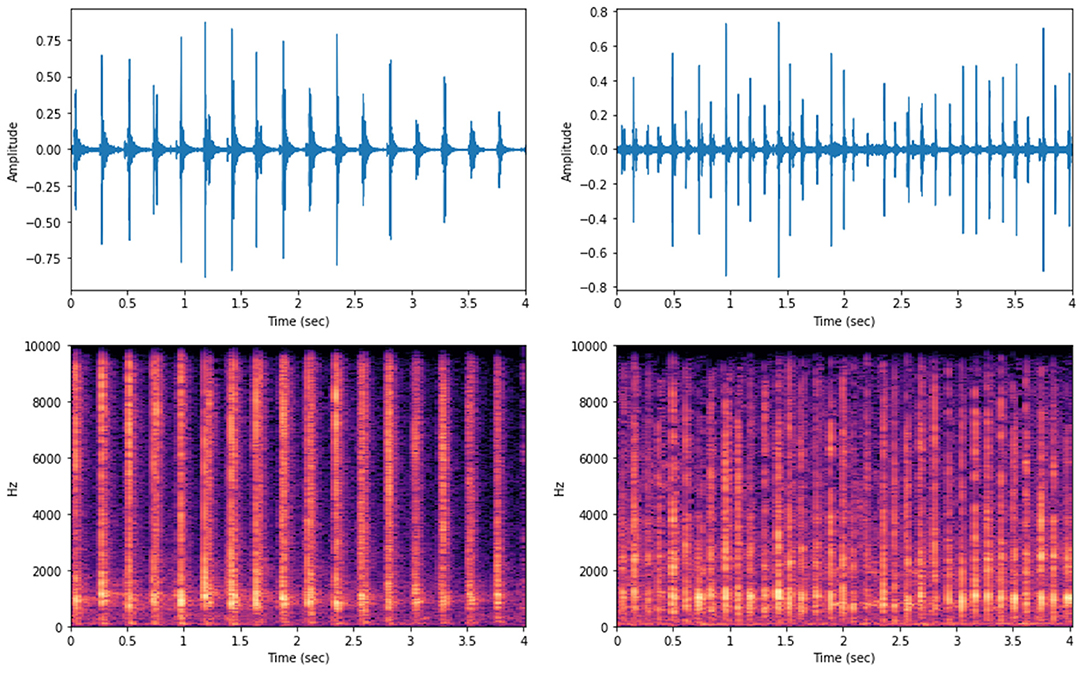
Figure 4. Waveforms (top) and spectrograms (bottom) for the audio data of random samples of MB (left) and MP (right) gaiting phenotypes in Brazilian horses.
We further explored the acoustic differences between MP and MB by extracting audio features in different domains. Except for Tempo, the feature values were computed by linear or non-linear transformations either from the raw waveform or spectrogram (for more details, the reader is referred to Rao, 2008 and McFee et al., 2015). Some features (Onset Strength, Centroid, Spectral Bandwidth, Roll-off, and MFCC[1]) are high dimensional and, hence, were computed by averaging the features arrays obtained for each training data sample.
The boxplots in Figure 5 show that the audio data for MP presented a higher signal span, with mean values of −0.553 and 0.544 for the signal minimum and maximum, respectively, whereas values of −0.315 and 0.311 were observed in the MB data (Table 1). The distribution of Roll-off (15%) values was more asymmetrical for MB, also presenting more outliers (Figure 5), which indicates that the minimum frequency necessary for retaining an important amount of spectral energy vary more than for MP audio data, as confirmed by the relative standard deviations (Table 1). Logistic regression analysis also pointed that MB audio-data presented on average, lower RMS (p = 0.002), Averaged Onset Strength (p = 0.014) and MFCC[1] (p = 2.01 × 10⁻⁷), whereas the global Tempo was higher (p = 0.006), as detailed in Table 1. Averaged centroid values were higher for MP (Figure 5) but not significant (Table 1), with mean values of 2,634 ± 611.5 and 2,938 ± 750.1 Hz for the frequencies throughout the time domain.
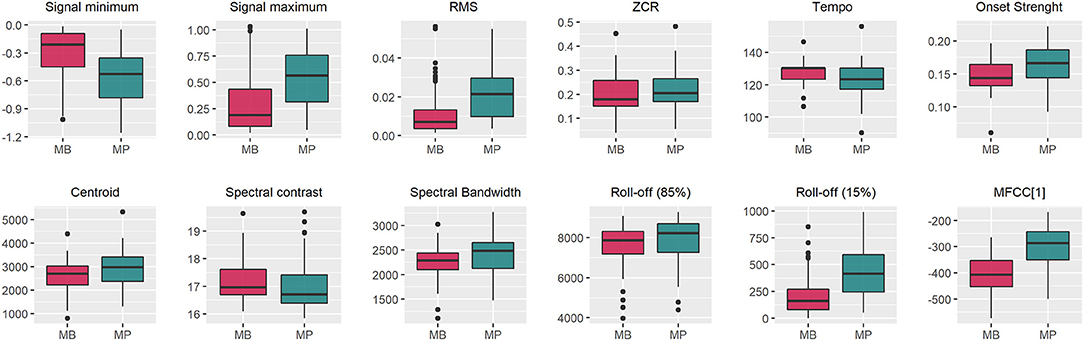
Figure 5. Boxplots for features extracted from audio data of Brazilian horses gaiting according to two different gait types (marcha batida—MB and marcha picada—MP). ZCR, Zero Crossing Rate; MFCC[1], First component of the Mel-frequency cepstrum coefficients. The Onset Strength, Centroid, Spectral Contrast, Spectral Bandwidth, Roll-off, MFCC[1] were computed by averaging the values of the whole feature vector for each training data sample.
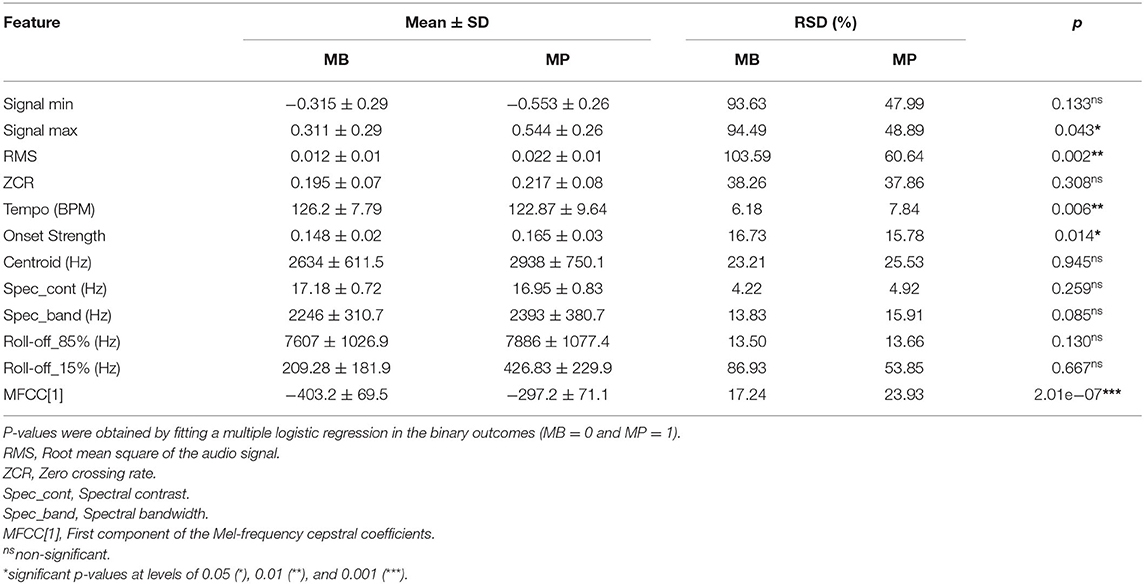
Table 1. Mean ± standard deviation (SD) and relative standard deviation (RSD) for different features extracted from audio recordings of Brazilian horses gaiting according to different patterns (Marcha Batida—MB and Marcha Picada—MP).
These single-valued audio features presented null to substantial linear associations (Supplementary Figure 2), with the highest positive correlation coefficient observed between the signal maximum and RMS (0.86), ZCR and Centroid (0.91), and Centroid and Spectral bandwidth (0.90). The highest negative correlations were observed between the signal minimum and other audio features such as signal maximum (−0.97), RMS (−0.86), and MFCC[1] (−0.78). The averaged onset strength presented a significant correlation with almost all other features (except for ZCR), although with weak associations in all cases (Supplementary Figure 2).
Based on the boxplots inspection and logistic regression results we decided to explore fully the potential of MFCC, Onset Strength, and Tempo audio features for classifying the gait patterns since they provide a good description of harmonic and/or rhythmic domains. The RMS and signal minimum features were also statistically significant. However, these metrics were not further explored because they are less informative when compared to the chosen metrics. As detailed in the Material and Methods section, instead of using single-values for describing these features, the whole real-valued features vector or some array reshaping was used as input information in the methods (PCA, ML, and DL). This was done for capturing time-specific variations in the audio data. Visual representations of these features are exemplified in Figure 6. Local Tempo information per time-frame was encoded with the tempogram (TEMP) a two-dimensional autocorrelation array of the onset strength envelope (Figures 6E,F).
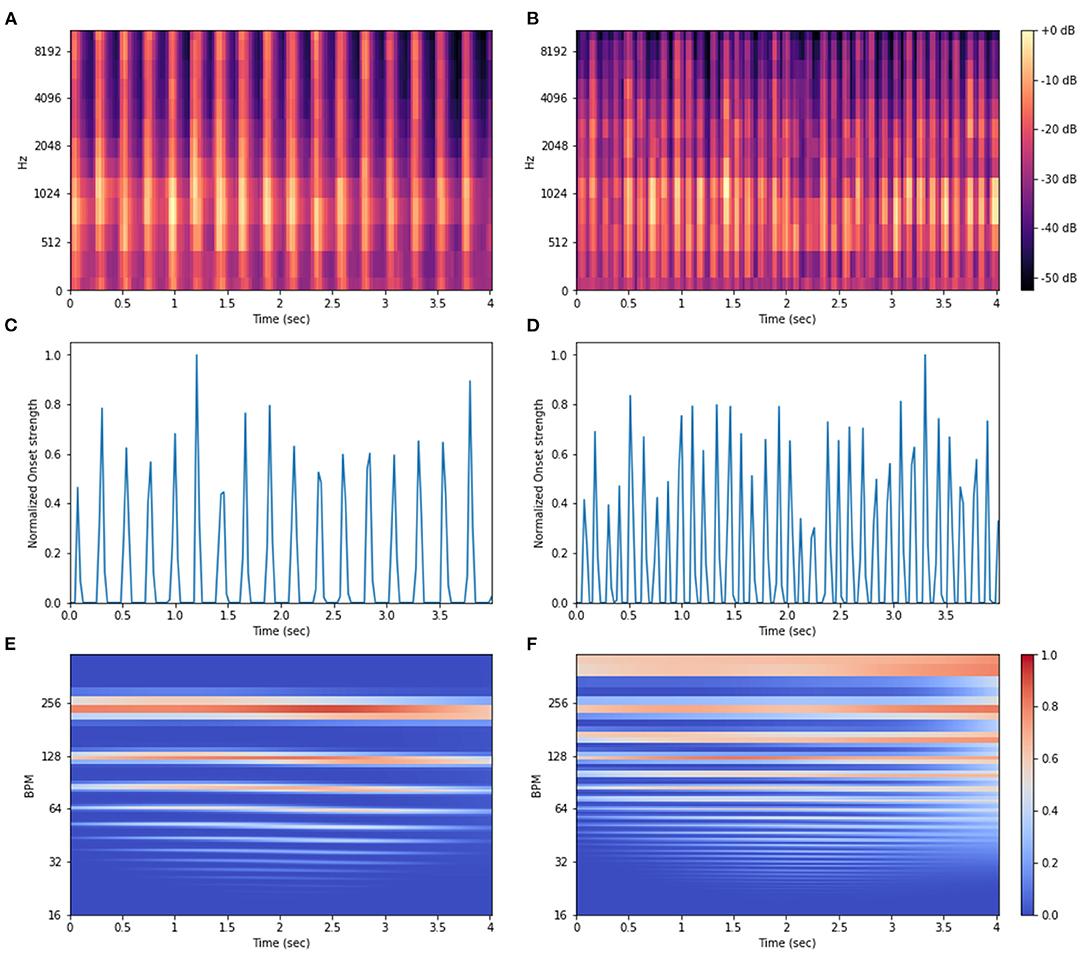
Figure 6. Visual representation for the Mel-frequency cepstrum coefficients (MFCC) spectrogram (A,B), Onset Strength envelope (C,D), and Tempogram (E,F) extracted from audio recordings of Brazilian horses gaiting according to two gait types, marcha batida—MB (left) and marcha picada—MP (right).
Principal Component Analysis
Scatterplots illustrating the first and second principal component projections of the initial 12 single-value features set and the AFD (MFCC, OS, TEMP) proposed for training the classifiers are shown in Figure 7. The central aim here was to identify visually how the gait types were related to each other according to the different audio-derived data. Despite some clustering patterns that could be noticed, the fuzziness in those linear projections is noticeable given the high extent of overlapping among samples from the two gait patterns (Figure 7). In the TEMP dataset, more than two substructures are highlighted (Figure 7D) and outliers can be found for all datasets (Figures 7A–D). Also, the proportion of variance explained by the first and second components was not substantial for MFCC (PC1 = 8.8% and PC2 = 5.4%) and OS (PC1 = 7.1% and PC2 = 6%), which differs from results for TEMP (PC1 = 65.5% and PC2 = 4.6%), more specifically for the first PC (Figures 7B–D). The single-value features set presented the second-highest percentage of variance explained by the PC1 (36.9%) and the highest for the PC2 (27.3%), unfortunately, this was not reflected in a substantially better clustering ability.
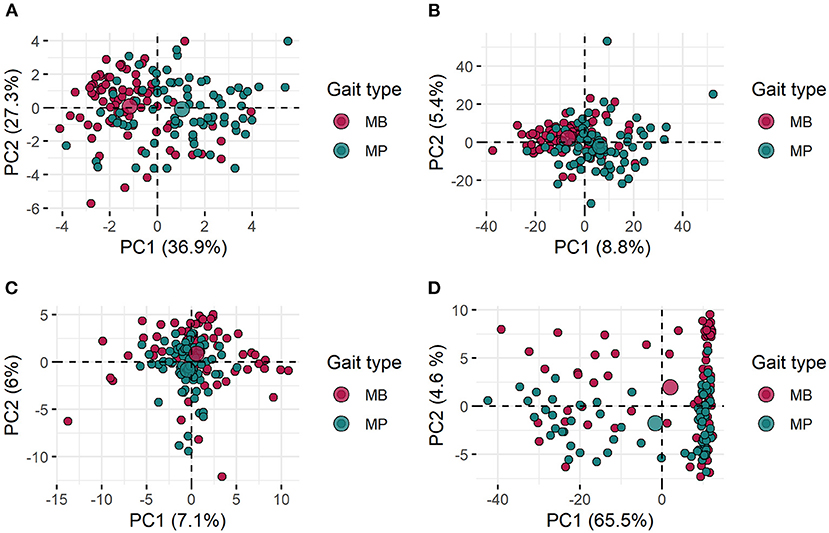
Figure 7. Scatter plot for the first and second principal components (PC1 and PC2) of the initial 12 single-valued features set (A; please refer to Table 1 for further details) and for the different audio feature datasets (B—Mel-frequency Cepstral Coefficients, C—Onset Strength and D—Tempogram) proposed for training the classification models. All features were extracted from audio recordings of gait types (marcha batida—MB and marcha picada—MP) exhibited by Brazilian horses.
Models Performance Assessment With Cross-Validation
Figure 8 shows the boxplots for the classification accuracy obtained according to the AFD (MFCC, OS, or TEMP) and classification algorithm (RF, SVM, MLP, or CNN), ACC values were obtained in a five-fold cross-validation scheme with 10 random repetitions. The boxplots distributions and the small presence of outliers confirm that the performance across folds was stable in most cases, suggesting a good generalization capability for yet-to-be-observed labels (Figure 8). When MFCC-based features were used as input information, the average ACC (standard deviation) were 0.846 (0.06), 0.806 (0.07), 0.831 (0.06), 0.922 (0.06), and 0.932 (0.06) for RF, SVM, MLP1, MLP2, CNN1, and CNN2, respectively. The OS-developed models were the most divergent in terms of average performance (Figure 8B), with RF, SVM, MLP1, MLP2, CNN1, and CNN2 presenting ACC values of 0.846 (0.06), 0.758 (0.07), 0.775 (0.06), 0.785 (0.07), 0.948 (0.04), and 0.917 (0.04), respectively. Overall, the TEMP dataset provided the best classification accuracies for all models (Figure 8), with average ACC values of 0.937 (0.04), 0.952 (0.04), 0.946 (0.04), 0.936 (0.04), 0.947 (0.04), and 0.968 (0.03), following the same order as presented before.
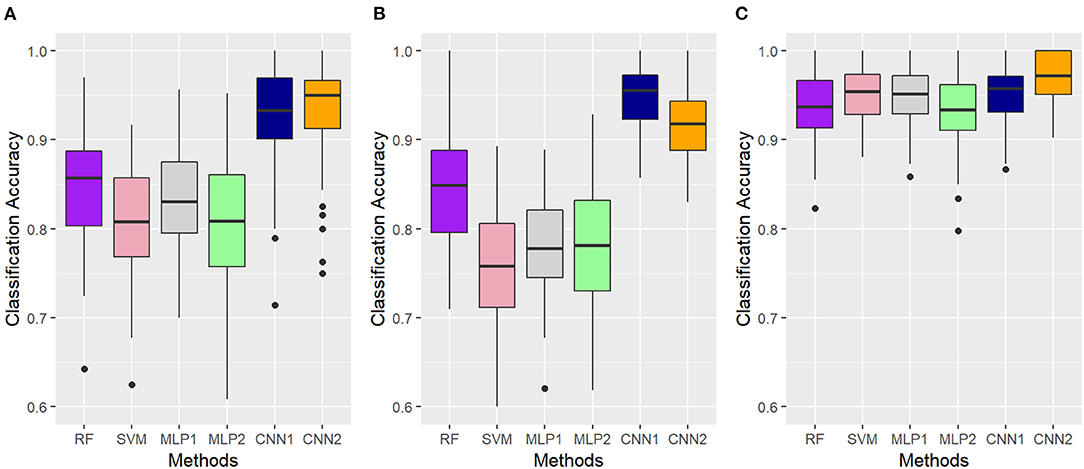
Figure 8. Accuracy values obtained with different algorithms (RF, Random Forest; SVM, Support Vector Machine; MLP, Multilayer Perceptron Neural Networks; CNN, Convolutional Neural Networks) for the classification of gait types (marcha batida—MB or marcha picada—MP) in Brazilian horses according to the audio-feature dataset used as input information (A—Mel-frequency Cepstral Coefficients, B—Onset Strength and C—Tempogram). Classification accuracy was assessed using a five-fold cross-validation scheme with 10 random repetitions. MLP1, MLP2, CNN1, and CNN2 refer to the different neural network architectures used for each audio-feature dataset, as fully described in Supplementary Table 1.
Since the labels' frequency was approximately balanced in the training dataset, the AUC values were rather similar to that observed for ACC (Figure 9). CNN was the less AFD sensitive method while SVM and MLP presented considerable performance variation, depending on the AFD. Comparing the classification algorithms within the different AFD, the SVM had the lowest values for ACC and AUC in the OS, whereas MLP performed worst in the TEMP dataset (Figures 8, 9). Pairwise Tukey tests confirmed that the proposed CNN architectures presented clear superiority in the classification accuracy over all other methods when using the MFCC or OS datasets (p < 0.05), while the SVM was competitive with the CNN's second architecture (CNN2) in the TEMP dataset (p = 0.14). Nonetheless, the boxplot distributions empirically favor the CNN2 choice (Figure 8C). There were no major AUC differences between the CNN's first and second architectures within each AFD (Figure 9). It is noteworthy that the proposed architectures for the MLP and CNN methods vary with the input dataset. Supplementary Table 1 presents a full description of the hyperparameters used in each neural network.
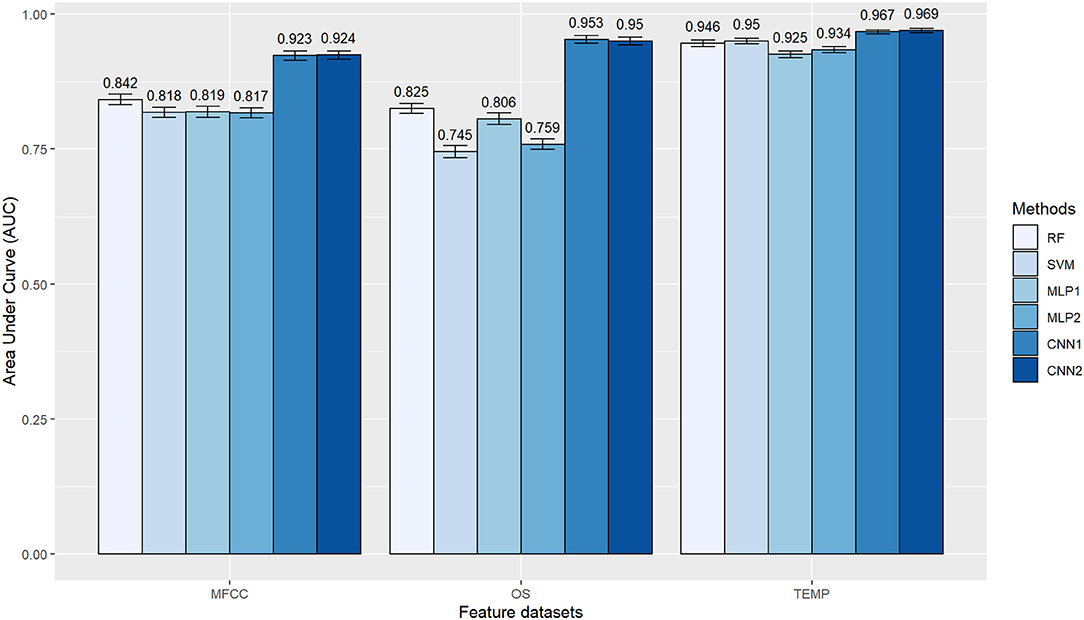
Figure 9. Area under the curve (AUC) obtained with different algorithms (RF, Random Forest; SVM, Support Vector Machine; MLP, Multilayer Perceptron Neural Networks; CNN, Convolutional Neural Networks) for the classification of gait types (marcha batida and marcha picada) in Brazilian horses according to the audio-feature dataset used as input information (MFCC, Mel-frequency Cepstral Coefficients; OS, Onset Strength; TEMP, Tempogram). AUC values were obtained in a five-fold cross-validation scheme with 10 random repetitions. MLP1, MLP2, CNN1, and CNN2 refer to the different neural network architectures used for each audio-feature dataset, as fully described in Supplementary Table 1.
Models Performance in the Validation Dataset
The classification performance of the models in the independent data varied remarkably according to the AFD. Overall, the results agreed well with that observed in the cross-validation scheme, where the adoption of MFCC and TEMP as input datasets provided the worst and best results in terms of model classification accuracy (Figure 10). All methods (especially RF, SVM and MLP) seemed to suffer from overfitting in the MFCC dataset, mainly due to the high misclassification rate for MP as evidenced by the sensitivity values (Figure 10A). Such a reduced ability into classifying MP audios correctly was also noticed in the OS dataset, but to a lower extent (Figure 10B). In turn, the TEMP-based models had more stable performance, presenting balanced results between SPEC and SEN (Figure 10C), with the best overall predictive performance observed in the second CNN architecture (ACC = 0.97).
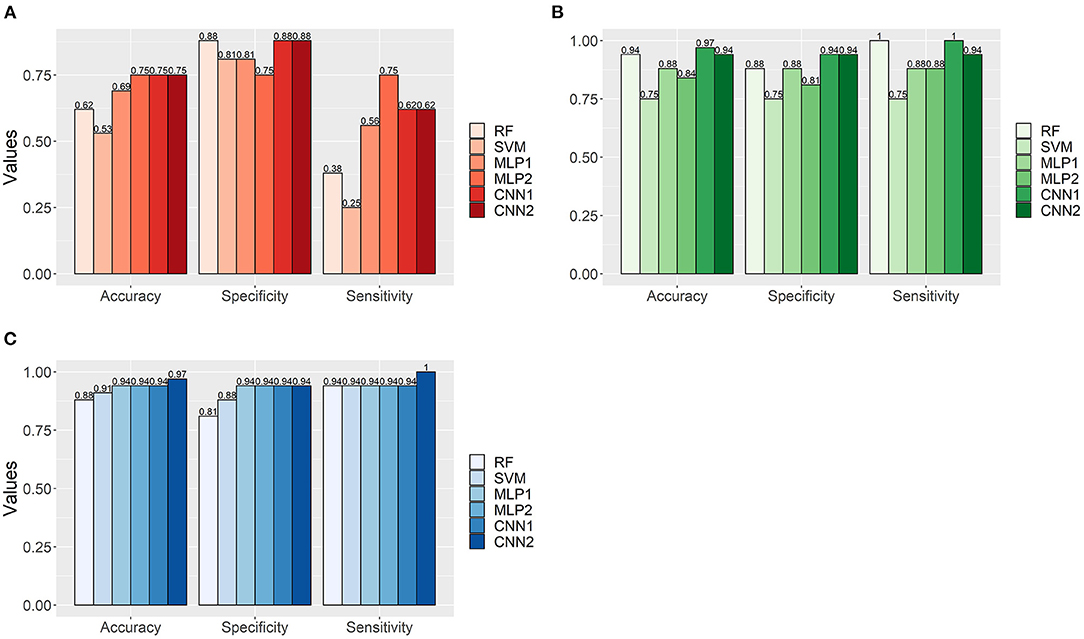
Figure 10. Accuracy, specificity, and sensitivity values for the classification of Brazilian horses gait types (MB and MP) in an independent dataset (N = 32) using machine learning algorithms (RF, Random Forest; SVM, Support Vector Machine; MLP, Multilayer Perceptron Neural Networks; CNN, Convolutional Neural Networks) trained with different feature datasets extracted from audio data (A—Mel-frequency Cepstral Coefficients, B—Onset Strength and C—Tempogram). MLP1, MLP2, CNN1, and CNN2 refer to the different neural network architectures used for each audio-feature dataset (as fully presented in Supplementary Table 1).
Receiver operating characteristic (ROC) curves along with their respective area under the ROC curve (AUC) for the classifications in the independent data according to the AFD and models are shown in Figure 11. The best AUC values were observed for RF (0.963) and CNN2 (0.961) in the OS and TEMP features data, respectively. ROC curves reinforce the good performance of CNN at distinguishing correctly between MB and MP in different thresholds, generally with curves closer to the top left corner, which indicates a better overall performance. The MFCC-based SVM model presented the worst specificity-sensitivity trade-off, performing lower even than a random guess for some thresholds (Figure 11).
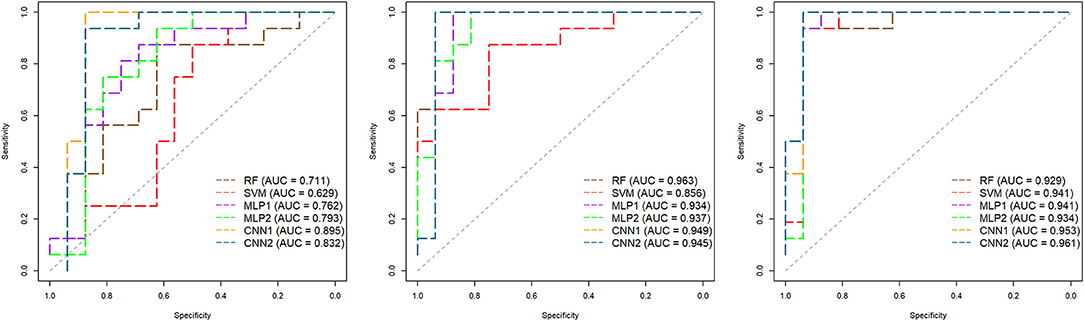
Figure 11. Receiver operating characteristic (ROC) curves and respective area under the ROC curves (AUC) for the classification of Brazilian horses gait types (MB or MP) obtained in an independent dataset (N = 32) according to the algorithm (RF, Random Forest; SVM, Support Vector Machine; MLP, Multilayer Perceptron Neural Networks; CNN, Convolutional Neural Networks) and the audio-feature dataset (Left—Mel-frequency Cepstral Coefficients, Middle—Onset Strength, and Right—Tempogram). The diagonal dashed line represents a random guess. MLP1, MLP2, CNN1, and CNN2 refer to the different neural network architectures used for each audio-feature dataset (as fully presented in Supplementary Table 1).
Discussion
To the best of our knowledge, this is the first effort of exploring audio signal processing techniques using gaited horse datasets. Undoubtedly, the sound analysis presents potential value as an emerging technology in horse production systems such as for the high-throughput phenotyping in horse breeding schemes. Sound-enabled classification of gait patterns could be used as a complementary tool to the subjective visual assessment by breeders associations during the registration process or for automated gait type labeling in official webpages. The results obtained in this study are encouraging, as a good classification performance is expected, provided that suitable AFD and classification algorithms are employed (Figures 8–11). More importantly, such a high classification performance validates ASP as a promising approach to be explored in the gaited horse industry. The next steps should involve field-collected audio data using sensors technology to provide relevant information for developing novel complex traits describing inherent variation among animals within and between different gait patterns.
Using audio-generated data in phenotyping routines provides an interesting opportunity to understand the different gait phenotypes in greater detail. For instance, the feature tempo (measured in beats per minute) can be interpreted as a general indicator of the horse's gait speed and rhythm whereas the stepping rate for any particular time interval can be characterized using onset detection algorithms. Hence, the gaiting pattern prevalence for different time intervals could be assessed through audio-features generated traits. Dissociated four-beat gaits (including MB and MP) and some of their attributes, such as the capability to pace exhibit moderate to high heritability (Rustin et al., 2009; Albertsdóttir et al., 2011; Becker et al., 2011; Bussiman et al., 2020). It seems reasonable, therefore, to expect gait-ability correlated traits developed with ASP to show a remarkable response to selection.
A single nucleotide mutation in the double-sex and mab-3-related transcription factor 3 (DMRT3) gene has been described as a causal region with a major effect on the horses' ability to express a natural four-beat ambling gait (Andersson et al., 2012; Kristjansson et al., 2014; Promerová et al., 2014; Fonseca et al., 2017). However, the role of the “Gait keeper” mutant allele in the expression of the MB and MP gaits remains uncertain. For instance, in the Mangalarga Marchador breed, the animals exhibiting the MB phenotype generally carry only the homozygous genotype for the wild allele (CC) and still can be classified as gaited horses (Patterson et al., 2015). On the other hand, in the Campolina breed, animals expressing either the MB or MP gait types can carry the mutant allele in the heterozygotic or double-recessive form (Manso Filho et al., 2015). More recently, some studies have been pointing that the genetic mechanisms underlying those gait types might be polygenic (Fonseca et al., 2017; Bussiman et al., 2019).
Since gait phenotyping generally demands trained personnel, in Brazil, most of the research in gait genetics has been performed with a very limited sample size, which reduces the statistical power to detect important regions in genome-wide studies (Fonseca et al., 2017; Bussiman et al., 2019). Furthermore, the MB and MP gaits are generally analyzed jointly as a dichotomous trait, impairing a detailed prospection of the genetic mechanisms underlying each gait type. These drawbacks contribute to the lack of conclusive results on the genetic architecture for these two distinct phenotypes expressed by Brazilian gaited horses. The approach described in this study could help to overcome the issues aforementioned by allowing automated phenotyping of the gait types (in the standard binary fashion) and the development of novel complex phenotypes that would have continuous distribution within each gait group. We believe, therefore, that ASP can be a valuable tool for future research into the genetics of gait and horse breeding.
Horse gait classification is commonly based on the visual assessment of horse movements. There are several intermediate gait types, differing in terms of support proportions, step frequency, speed, and metabolic cost (Nicodemus and Clayton, 2003; Wanderley et al., 2010). The visual evaluation demands a trained evaluator because the person who gives the scores or measures may have a high impact on the trait (Rustin et al., 2009; Vicente et al., 2014), and it also depends largely on subjectivism naturally occurred when different people need to evaluate a specific feature. To overcome this issue, kinematic analyses may be a solution (Valera et al., 2008; Solé et al., 2014; Clayton and Hobbs, 2019), since they are accurate and have high reproducibility. At the same time, kinematic analysis generally requires the adoption of specific software and high-speed cameras, which increases its cost and impairs large-scale phenotyping. Body sensors technologies such as accelerometry (for e.g., Robilliard et al., 2007) and inertial measurement units (Serra Bragança et al., 2020) also have been developed to allow accurate and fast phenotyping, in the latter case, integrating machine learning algorithms for improved classification. The use of audio-recording data can be viewed as a low-cost complementary approach for improving both accuracy and time of horse gait phenotyping, as it can be done in several conditions (different locals and equestrian arenas) and with common resources (such as our nowadays smartphones). These appealing attributes would allow a faster gait type determination, favoring the formation of robust datasets, and also could provide novel temporally distributed continuous phenotypes.
Furthermore, recent applications of ASP technology in precision livestock farming provide evidence of its usefulness in a wide range of problems related to welfare, health, and feeding management. For instance, cough and sneeze audio data can provide information for recognizing in advance respiratory diseases in poultry, pig, and cattle, with precision scores (percentage of samples predicted to be coughing that are true coughing) ranging between 88.4 and 97.6% in the best scenarios (Carpentier et al., 2018, 2019; Yin et al., 2020). The sound analysis also has been used for identifying heat and management related distress conditions using pigs' vocalization generated data, achieving accuracies over 80% (Cordeiro et al., 2013, 2018; Ferrari et al., 2013) and for acoustic monitoring of intake behavior in broilers, cattle, and sheep, also delivering reliable predictions (Clapham et al., 2011; Galli et al., 2011; Aydin et al., 2014; Aydin and Berckmans, 2016; Chelotti et al., 2016), as evidenced by the good determination coefficients achieved in those studies (higher than 0.89 and up to 0.995). These results reinforce thereof that the possibilities of exploring sound-generated data in the animal science discipline are vast.
In the waveform representation, the number of amplitude values becomes as large as the SR and audio length increase, easily surpassing dozens of thousands of sampled points; hence, raw audio signal data are generally not suited for classification tasks. In this study, a set of 12 single-valued features was initially used for summarizing the audio data in the temporal, frequency, or rhythmic domains. This preliminary analysis has pointed to MFCC, Onset Strength, and Tempo as the most relevant metrics for describing the gait patterns in the studied population. Interestingly, some biomechanical characteristics of each gait type as the step frequencies (higher in MP) and speed (higher in MB) (Wanderley et al., 2010) can be directly related to the higher average onset strength (implying the detection of more sound onsets) and global tempo found for the marcha picada and marcha batida gait patterns, respectively. Therefore, following the preliminary multiple regression results and their expected biological meaning, three audio-feature datasets (MFCC, OS, and TEMP) based on these metrics were used as input variables for different methods (PCA, ML, and DL).
In the PCA, no clear clusters for the gait patterns were found, as noticed by the fuzziness present in the projection of the first and second principal components for all datasets. Also, in some cases, more than two clusters were suggested and a high presence of outliers was observed in all scenarios. We hypothesize that it could be due to data-specific differences such as the gait speed, horses' aerobic capacity, road condition (paved or unpaved), horseshoes types, rider skills, and the horse training intensity, besides the perceived heterogeneity in the audio quality; however, the lack of details in the audio-data annotation prevented us from investigating it closer.
Possibly, the underlying structure of the different AFD is not linear or the target patterns are highly correlated which would impair the PCA clustering performance (Lever et al., 2017). To address these challenges, different machine learning (RF, SVM) and deep learning (MLP and CNN) algorithms were compared according to their classification performance. Overall, CNN presented the best classification performance among all methods. In audio-generated data, the sound events tend to be similar in near-time intervals, hence, features describing the audio dynamics over a given period present strong time-dependent collinearity. This may explain the CNN superiority since this method is designed to take into account both local dependence and nonlinear relationships present in the data (Emmert-Streib et al., 2020). Our results have shown that the DL techniques, particularly the CNN method, provided a highly accurate and stable classification for yet-to-be observed labels in both cross-validation and independent validation schemes, although the best network architecture was highly AFD-dependent (Supplementary Table 1). Finding an optimal configuration for DL algorithms can be challenging because depending on the hyperparameters tested (e.g., number of layers, number of neurons, activation functions, kernel and stride sizes, and learning rate) thousands of combinations need to be assessed and different classification performances can be achieved. Here we used a genetic algorithm for stochastic optimization of both MLP and CNN methods. Evolutionary algorithms such as GA are a well-documented alternative to solve complex optimization problems in a faster manner than an exhaustive grid-search procedure (Wicaksono and Supianto, 2018; Han et al., 2020) by selecting, combining, and mutating the model parameters sequentially, thus, mimicking mechanisms that resemble biological evolution.
Another methodological challenge in this study was the risk of overfitting, mainly due to the small amount of available data for training the classification models. Still, good classification performance was observed in almost all scenarios, considering the different AFD and models. This is mostly because of the very well-behaved nature of the problem, with only two balanced classes, which simplifies the decision boundary to be optimized. This binary classification task was considered because the largest Brazilian gaited horses breed associations require a visual inspection during the registration process to ensure that horses exhibit either the MB or MP phenotype. Accordingly, this is a real-world problem, with practical implications for the Brazilian gaited horse industry. Certainly, the issue with overfitting would be more prominent with a larger number of horse gait classes, considering the same amount of training data. As already stressed, this study provides a preliminary exploration of audio-signal processing for gait characterization. Hence, it is important to validate the proposed approach in the simplest case before it can be extended to multiclass classification tasks or even more complex cases, which can be done straightforwardly.
According to our results, the MFCC dataset had the worst performance at explaining the differences between the horses' gait patterns. Partially, this can be due to the higher number of variables included in this AFD (p = 314). Indeed, the ratio between the number of available observations and features influences the risk of overfitting. Notwithstanding, one must highlight that all classification methods applied in our study have well-known mechanisms to prevent overfitting. For instance, the C hyperparameter in the SVM regulates the trade-off between model complexity and training error variance; in the RF, there is variable selection during the growing process of the classification trees. For the deep learning models, two regularization strategies were employed during the training phase, i.e., weight decay and dropout. Besides, previous studies point that the ML methods can be useful even when the number of explanatory variables (p) vastly exceeds the number of available phenotypes (n), as demonstrated in the genome-enabled prediction of complex traits (Lopes et al., 2020; Bargelloni et al., 2021). Hence, the higher number of explanatory variables itself does not fully explain the lower classification performance of the models feed with the MFCC data. Apparently, there are also acoustic components intrinsic to this audio feature affecting its ability to generalize effectively the gait types.
MFCCs are intended to represent human spectral perception which makes them useful in different ASP applications, including speech recognition, environmental sound differentiation, music genre classification, and abnormal heart activity detection (On et al., 2006; Piczak, 2015; Rubin et al., 2016; Ghosal and Kolekar, 2018; Nogueira et al., 2019). However, differently from animal vocalizations, the sound events describing MB and MP gait patterns are less sensitive to changes in the audio harmonic component. On the other hand, the horses gaiting activity give rise to important differences in the audio percussive patterns.
The Brazilian gaited horse breeds present a natural gait with symmetrical and four-beat pace, which differs in two main patterns, the MB is mainly characterized by the frequent diagonal support in the leg movements, more frequent than the triple support, whereas the MP presents leg movements in a lateral sequence, frequently alternating with triple hoof support (Nicodemus and Clayton, 2003). Since gait phenotypes are highly pace-dependent, the higher classification accuracy and model stability achieved when using the TEMP dataset as input variables is justified as it provides a rhythmic rather than harmonic description of the audio data. Sound onset detection algorithms also seem to have an important role in describing the horses stepping rate, as footfalls laterally coupled and without loss of triple-limb support are expected to generate a higher number of sound events.
The results reported are promising, nonetheless, the current study also had some limitations such as the relatively small sample size. Also, our data was not generated under experimental conditions, implying that the audio recording process was rather heterogeneous, resulting in low audio quality for some files, and thus, very short audio segmentations (4 s) were studied. As evidenced here, those issues had no major implications on the classification accuracy of the gait patterns. On the other hand, a much higher data volume, with longer recording periods and in standardized conditions may be needed to characterize the gait phenotypes in greater detail, as some audio features may be sensitive to these factors to some extent. Differences among breeds, horse training intensity, and activity purposes (e.g., official competitions, livestock handling and, leisure ride) are some of the technical factors that also must be taken into account. Thus, future researches exploring those gaps are strongly encouraged.
Conclusions
This study provides a primer on the suitability of applying audio signal processing technology in the gaited horse industry. According to the results observed, exploring audio-generated data for describing gait phenotypes in Brazilian horses is a promising approach as the two gait types studied were correctly distinguished in the presented approach. The highest classification performance was achieved by combining deep learning techniques (Convolutional Neural Networks) and rhythmic-descriptive audio feature datasets. One must highlight that the results found in this study are preliminary, hence, future research using field-collected information must be assessed to further elucidate some practical concerns, including the validation of novel complex phenotypes derived from audio data.
Data Availability Statement
The raw data supporting the conclusions of this article will be made available by the authors, without undue reservation.
Ethics Statement
Ethical review and approval was not required for the animal study because the procedures in this research were performed using publicly available data and do not require any formal consent of the Institutional Animal Care and Use Committee.
Author Contributions
RV conceptualized the project idea. FB, LAn, and RL performed data collection, annotation, and edition. AA, LAn, RV, and RL contributed to the study design. AA performed statistical analyses and drafted the original manuscript. FB, FS, JB, LB, LAl, LAn, RC, RV, and RL improved the discussion of the results and performed writing editions. All authors reviewed and approved the final version of the manuscript.
Funding
RV would like to acknowledge Säo Paulo Research Foundation—FAPESP (Grants 16/19514-2 and 20/04461-6) for the financial support.
Conflict of Interest
The authors declare that the research was conducted in the absence of any commercial or financial relationships that could be construed as a potential conflict of interest.
Publisher's Note
All claims expressed in this article are solely those of the authors and do not necessarily represent those of their affiliated organizations, or those of the publisher, the editors and the reviewers. Any product that may be evaluated in this article, or claim that may be made by its manufacturer, is not guaranteed or endorsed by the publisher.
Supplementary Material
The Supplementary Material for this article can be found online at: https://www.frontiersin.org/articles/10.3389/fanim.2021.681557/full#supplementary-material
References
Abdollahi-Arpanahi, R., Gianola, D., and Peñagaricano, F. (2020). Deep learning versus parametric and ensemble methods for genomic prediction of complex phenotypes. Genet. Sel. Evol. 52:12. doi: 10.1186/s12711-020-00531-z
Albertsdóttir, E., Eriksson, S., Sigurdsson, Á., and Árnason, T. (2011). Genetic analysis of ‘breeding field test status’ in Icelandic horses. J. Anim. Breed. Genet. 128, 124–132. doi: 10.1111/j.1439-0388.2010.00902.x
Allaire, J., and Chollet, F. (2017). keras: R Interface to ‘Keras’. R package version 2.2.4.1.9001. Avaliable online at: https://keras.rstudio.com/ (accessed October 12, 2020).
Allaire, J., and Tang, Y. (2018). tensorflow: R Interface to ‘TensorFlow’. Avaliable online at: https://CRAN.R-projectorg/package=tensorflow (accesssed October 12, 2020).
Andersson, L. S., Larhammar, M., Memic, F., Wootz, H., Schwochow, D., Rubin, C. J., et al. (2012). Mutations in DMRT3 affect locomotion in horses and spinal circuit function in mice. Nature 488, 642–646. doi: 10.1038/nature11399
Aslan, Z., and Akin, M. (2018). Performing accurate speaker recognition by use of SVM and cepstral features. Int. J. Energy Eng. Sci. (IJEES) 3, 16–25. Avaliable online at: https://dergipark.org.tr/tr/pub/ijees/issue/35485/424099 (accessed December 10, 2020).
Associação Brasileira dos Criadores do Cavalo Mangalarga Marchador (ABCCMM) (2019). O MM em números. Available online at: http://www.abccmm.org.br/leitura?id=9525 (accessed February 02, 2021).
Aydin, A., Bahr, C., Viazzi, S., Exadaktylos, V., Buyse, J., and Berckmans, D. (2014). A novel method to automatically measure the feed intake of broiler chickens by sound technology. Comput. Electron. Agr. 101, 17–23. doi: 10.1016/j.compag.2013.11.012
Aydin, A., and Berckmans, D. (2016). Using sound technology to automatically detect the short-term feeding behaviours of broiler chickens. Comput. Electron. Agr. 121, 25–31. doi: 10.1016/j.compag.2015.11.010
Bargelloni, L., Tassiello, O., Babbucci, M., Ferraresso, S., Franch, R., Montanucci, L., et al. (2021). Data imputation and machine learning improve association analysis and genomic prediction for resistance to fish photobacteriosis in the gilthead sea bream. Aquacult. Rep. 20:100661. doi: 10.1016/j.aqrep.2021.100661
Becker, A. -C., Stock, K. F., and Distl, O. (2011). Genetic correlations between free movement and movement under rider in performance tests of German Warmblood horses. Livest. Sci. 142, 245–252. doi: 10.1016/j.livsci.2011.08.001
Böck, S., and Widmer, G. (2013). “Maximum filter vibrato suppression for onset detection,” in 16th International Conference on Digital Audio Effects, Maynooth, Ireland. 2013. Available online at: http://phenicx.upf.edu/system/files/publications/Boeck_DAFx-13.pdf (accessed October 12, 2020).
Bussiman, F. O., Brandi, R. A., Mattos, E. C., Eler, J. P., and Ferraz, J. B. S. (2018). “Proposal of methodology of video image analysis for gaited equine using free software,” in World Congress on Genetics Applied to Livestock Production, 2018, Auckland. Proceedings of the World Congress on Genetics Applied to Livestock Production, v. Equine, 900–908.
Bussiman, F. O., dos Santos, B. A., Silva, B. C. A., Mamani, G. C. M., Pereira, L. G. G. L., Grigolleto, L., et al. (2019). Genome-wide association study: Understanding the genetic basis of the gait type in Brazilian Mangalarga Marchador horses, a preliminary study. Livest. Sci. 231, 103867. doi: 10.1016/j.livsci.2019.103867
Bussiman, F. O., Silva, F. F., Carvalho, R. S. B., Ventura, R. V., de Oliveira, H. N., Silva, B. C. A., et al. (2020). Model comparisons for genetic evaluation of gait type in Mangalarga Marchador horses. Livest. Sci. 239:104168. doi: 10.1016/j.livsci.2020.104168
Carpentier, L., Berckmans, D., Youssef, A., Berckmans, D., van Waterschoot, T., Johnston, D., et al. (2018). Automatic cough detection for bovine respiratory disease in a calf house. Biosyst. Eng. 173, 45–56. doi: 10.1016/j.biosystemseng.2018.06.018
Carpentier, L., Vranken, E., Berckmans, D., Paeshuyse, J., and Norton, T. (2019). Development of sound-based poultry health monitoring tool for automated sneeze detection. Comput. Electron. Agr. 162, 573–581. doi: 10.1016/j.compag.2019.05.013
Chelotti, J. O., Vanrell, S. R., Milone, D. H., Utsumi, S. A., Galli, J. A., Rufiner, H. L., et al. (2016). A real-time algorithm for acoustic monitoring of ingestive behavior of grazing cattle. Comput. Electron. Agr. 127, 64–75. doi: 10.1016/j.compag.2016.05.015
Chen, X., and Ishwaran, H. (2012). Random forests for genomic data analysis. Genomics 99, 323–329. doi: 10.1016/j.ygeno.2012.04.003
Chung, Y., Oh, S., Lee, J., Park, D., Chang, H-H., Kim Chung, Y., et al. (2013). Automatic detection and recognition of pig wasting diseases using sound data in audio surveillance systems. Sensors 13, 12929–12942. doi: 10.3390/s131012929
Clapham, W. M., Fedders, J. M., Beeman, K., and Neel, J. P. S. (2011). Acoustic monitoring system to quantify ingestive behavior of free-grazing cattle. Comput. Electron. Agr. 76, 96–104. doi: 10.1016/j.compag.2011.01.009
Clayton, H. M., and Hobbs, S. J. (2019). A review of biomechanical gait classification with reference to collected trot, passage and piaffe in dressage horses. Animals 9:763. doi: 10.3390/ani9100763
Cordeiro, A. F. S., Nääs, I. A., Leitão, F. S., Almeida, A. C. M., and Moura, D. J. (2018). Use of vocalisation to identify sex, age, and distress in pig production. Biosyst. Eng. 173, 57–63. doi: 10.1016/j.biosystemseng.2018.03.007
Cordeiro, A. F. S., Nääs, I. A., Oliveira, S. R. M., Violaro, F., Almeida, A. C. M., and Neves, D. P. (2013). Understanding vocalization might help to assess stressful conditions in piglets. Animals 3, 923–934. doi: 10.3390/ani3030923
Dhonde, S. B., and Jagade, S. M. (2015). Feature extraction techniques in speaker recognition: a review. IJRMEE 2,104–106. Available at: http://ijrmee.org/index.php/ijrmee/article/view/247/247 (accessed December 10, 2020).
Emmert-Streib, F., Yang, Z., Feng, H., Tripathi, S., and Dehmer, M. (2020). An introductory review of deep learning for prediction models with big data. Front. Artif. Intell. 3:4. doi: 10.3389/frai.2020.00004
Ferrari, S., Costa, A., and Guarino, M. (2013). Heat stress assessment by swine related vocalizations. Livestock Sci. 15, 29–34. doi: 10.1016/j.livsci.2012.10.013
Fitzgerald, D. (2010). “Harmonic/percussive separation using median filtering,” in 13th International Conference on Digital Audio Effects (DAFX10), Graz, Austria, 2010. Available online at: http://dafx10.iem.at/papers/DerryFitzGerald_DAFx10_P15.pdf (accessed June 09, 2021).
Fonseca, M. G., Ferraz, G. C., Lage, J., Pereira, G. L., and Curi, R. A. (2017). A genome-wide association study reveals differences in the genetic mechanism of control of the two gait patterns of the Brazilian Mangalarga Marchador breed. J. Equine Vet. Sci. 53, 64–67. doi: 10.1016/j.jevs.2016.01.015
Galli, J. R., Cangiano, C. A., Milone, D. H., and Laca, E. A. (2011). Acoustic monitoring of short-term ingestive behavior and intake in grazing sheep. Livestock Sci. 140, 32–41. doi: 10.1016/j.livsci.2011.02.007
Ghosal, D., and Kolekar, M. F. (2018). “Musical genre and style recognition using deep neural networks and transfer learning,” in Proceedings, APSIPA Annual Summit and Conference, 1010–1018. Avaliable online at: http://www.apsipa.org/proceedings/2018/pdfs/0001010.pdf (accessed December 11, 2020).
Goodfellow, I., Bengio, Y., and Courville, A. (2016). Deep learning. MIT Press. Avaliable online at: http://www.deeplearningbook.org (accessed October 12, 2020).
Grosche, P., Müller, M., and Kurth, F. (2010). “Cyclic tempogram-A mid-level tempo representation for musicsignals,” in 2010 IEEE International Conference on Acoustics, Speech and Signal Processing, 5522–5525. doi: 10.1109/ICASSP.2010.5495219
Han, J. H., Choi, D. J., Park, S. U., and Hong, S. K. (2020). Hyperparameter optimization using a genetic algorithm considering verification time in a convolutional neural network. J. Electr. Eng. Technol. 15, 721–726. doi: 10.1007/s42835-020-00343-7
Hastie, T. J., Tibshirani, R., and Friedman, J. (2009). The Elements of Statistical Learning. New York, NY: Springer. doi: 10.1007/978-0-387-84858-7
Hobbs, S. J., Bertram, J. E. A., and Clayton, H. M. (2016). An exploration of the influence of diagonal dissociation and moderate changes in speed on locomotor parameters in trotting horses. PeerJ. 4:e2190. doi: 10.7717/peerj.2190
Jäderkvist, F. K., Hirschberg, I., Árnason, T., Andersson, L., Velie, B. D., Andersson, L. S., et al. (2017). To pace or not to pace: a pilot study of four- and five-gaited Icelandic horses homozygous for the DMRT3 'Gait Keeper' mutation. Anim Genet. 48, 694–697. doi: 10.1111/age.12610
Jiang, D. N., Lie, L., Zhang, H. J., Tao, J. -H., and Cai, L. H. (2002). “Music type classification by spectral contrast feature,” in Proceedings IEEE International Conference on Multimedia and Expo, Lausanne, Switzerland, 113–116. doi: 10.1109/ICME.2002.1035731
Kristjansson, T., Bjornsdottir, S., Sigurdsson, A., Andersson, L. S., Lindgren, G., Helyar, S. J., et al. (2014). The effect of the 'Gait keeper' mutation in the DMRT3 gene on gaiting ability in Icelandic horses. J. Anim. Breed Genet. 131, 415–425. doi: 10.1111/jbg.12112
Lage, J., Fonseca, M. G., Barros, G. G. M., Feringer-Júnior, W. H., Pereira, G. T., and Ferraz, G. C. (2017). Workload of official contests, net cost of transport, and metabolic power of Mangalarga Marchador horses of marcha batida or picada gaits. J. Anim. Sci. 95, 2488–2495. doi: 10.2527/jas.2016.1270
Lee, C-H., Chou, C-H., Han, C-C., and Huang, R-Z. (2006). Automatic recognition of animal vocalizations using averaged MFCC and linear discriminant analysis. Pattern Recogn Lett. 27, 93–101. doi: 10.1016/j.patrec.2005.07.004
Lever, J., Krzywinski, M., and Altman, N. (2017). Principal component analysis. Nat. Methods. 14, 641–642. doi: 10.1038/nmeth.4346
Liaw, A., and Wiener, M. (2002). Classification and regression by randomForest. R News. 2, 8–22. Avaliable online at: https://www.r-project.org/doc/Rnews/Rnews_2002-3.pdf (accessed October 12, 2020).
Lopes, F. B., Magnabosco, C. U., Passafaro, T. L., Passafaro, T. L., Brunes, L. C., Costa, M. F. O., et al. (2020). Improving genomic prediction accuracy for meat tenderness in Nellore cattle using artificial neural networks. J. Anim. Breed. Genet. 137, 438–448. doi: 10.1111/jbg.12468
Manso Filho, H. C., Cothran, E. G., Juras, R., Gomes Filho, M. A., da Silva, N. M. V., da Silva, G. B., et al. (2015). Alelo DMRT3 mutante em equinos de marcha batida e picada das raças Campolina e Mangalarga Marchador. Ciência Vet. Tróp. 18, 6–11.
McCracken, M. J., Kramer, J., Keegan, K. G., Lopes, M., Wilson, D. A., Reed, S. K., et al. (2012). Comparison of an inertial sensor system of lameness quantification with subjective lameness evaluation. Equine Vet. J. 44, 652–656. doi: 10.1111/j.2042-3306.2012.00571.x
McFee, B., and Ellis, D. P. W. (2014). “Better beat tracking through robust onset aggregation,” in 2014 IEEE International Conference on Acoustics, Speech and Signal Processing (ICASSP), Florence, Italy.
McFee, B., Raffel, C., Liang, D., Ellis, D. P. W., McVicar, M., Battenberg, E., et al. (2015). “librosa: audio and music signal analysis in python,” in Proceedings of the 14th Python in Science Conference. Avaliable online at: https://brianmcfee.net/papers/scipy2015_librosa.pdf (accessed October 01, 2020).
Meyer, D., Dimitriadou, E., Hornik, K., Weingessel, A., and Leisch, F. (2019). e1071: misc functions of the department of statistics, probability theory group (E1071), TU Wien. R package version 1.6-7. Avaliable online at: http://cran.r-project.org/package=e1071 (accessed October 05, 2020).
Miranda, I. D., Diacon, A. H., and Niesler, T. R. (2019). “A comparative study of features for acoustic cough detection using deep architectures,” in 41st Annual International Conference of the IEEE Engineering in Medicine and Biology Society (EMBC). IEEE, 2601–2605. doi: 10.1109/EMBC.2019.8856412
Mustaqeem, and Kwon, S. (2020). A CNN-assisted enhanced audio signal processing for speech emotion recognition. Sensors 20:183. doi: 10.3390/s20010183
Nicodemus, M. C., and Clayton, H. M. (2003). Temporal variables of four-beat, stepping gaits of gaited horses. Appl. Anim. Behav. Sci. 80, 133–142. doi: 10.1016/S0168-1591(02)00219-8
Nogueira, D. M., Ferreira, C. A., Gomes, E. F., and Jorge, A.M. (2019). Classifying heart sounds using images of motifs, MFCC and temporal features. J. Med. Syst. 43, 1–13. doi: 10.1007/s10916-019-1286-5
Olsen, E., Andersen, P. H., and Pfau, T. (2012). Accuracy and precision of equine gait event detection during walking with limb and trunk mounted inertial sensors. Sensors 12, 8145–8156. doi: 10.3390/s120608145
On, C. K., Pandiyan, P. M., Yaacob, S., and Saudi, A. (2006). “Mel-frequency cepstral coefficient analysis in speech recognition,” in International Conference on Computing and Informatics, Kuala Lumpur, 1–5, doi: 10.1109/ICOCI.2006.5276486
Patterson, L., Staiger, E. A., and Brooks, S. A. (2015). DMRT3 is associated with gait type in Mangalarga Marchador horses, but does not control gait ability. Anim. Genet. 46, 213–215. doi: 10.1111/age.12273
Pérez-Enciso, M., and Zingaretti, L. M. (2019). A guide for using deep learning for complex trait genomic prediction. Genes 10:553. doi: 10.3390/genes10070553
Piczak, K. J. (2015). “Environmental sound classification with convolutional neural networks,” in Proceedings of the 25th International Workshop on Machine Learning for Signal Processing, Boston, MA, 1–6. doi: 10.1109/MLSP.2015.7324337
Popel, M., Tomkova, M., Tomek, J., Kaiser, L., Uszkoreit, J., Bojar, O., et al. (2020). Transforming machine translation: a deep learning system reaches news translation quality comparable to human professionals. Nat. Commun. 11, 1–15. doi: 10.1038/s41467-020-18073-9
Promerová, M., Andersson, L. S., Juras, R., Penedo, M. C. T., Reissmann, M., Tozaki, T., et al. (2014). Worldwide frequency distribution of the ‘Gait Keeper’ mutation in the DMRT3 gene. Anim. Genet. 45, 274–282. doi: 10.1111/age.12120
Qiao, Y., Truman, M., and Sukkarieh, S. (2019). Cattle segmentation and contour extraction based on Mask R-CNN for precision livestock farming. Comput. Eletron. Agric. 165:104958. doi: 10.1016/j.compag.2019.104958
R Core Team (2020). R: a language and environment for statistical computing. R Foundation for Statistical Computing, Vienna, Austria. Available online at: https://www.R-project.org/ (accessed October 05, 2020).
Rao, P. (2008). “Audio signal processing,” in Speech, Audio, Image and Biomedical Signal Processing using Neural Networks, eds B. Prasad and S.R.M. Prasanna (Berlin, Springer). doi: 10.1007/978-3-540-75398-8_8
Robilliard, J. J., Pfau, T., and Wilson, A. M. (2007). Gait characterisation and classification in horses. J. Exp. Biol. 210, 187–197. doi: 10.1242/jeb.02611
Rubin, J., Abreu, R., Ganguli, A., Nelaturi, S., Matei, I., and Sricharan, K. (2016). “Classifying heart sound recordings using deep convolutional neural networks and mel-frequency cepstral coefficients,” in Proceedings of Computing in Cardiology Conference, Vancouver, BC, 813–816. Available online at: http://physionet.cps.unizar.es/challenge/2016/papers/rubin.pdf (accessed October 09, 2020).
Rustin, M., Janssens, S., Buys, N., and Gengler, N. (2009). Multi-trait animal model estimation of genetic parameters for linear type and gait traits in the Belgian warmblood horse. J. Anim. Breed. Genet. 126, 378–386. doi: 10.1111/j.1439-0388.2008.00798.x
Sapone, M., Martin, P., Ben Mansour, K., Château, H., and Marin, F. (2020). Comparison of trotting stance detection methods from an inertial measurement unit mounted on the horse's limb. Sensors 20:2983. doi: 10.3390/s20102983
Scrucca, L. (2013). GA: a package for genetic algorithms in R. J. Stat. Softw. 53, 1–37. doi: 10.18637/jss.v053.i04
Serizel, R., Bisot, V., Essid, S., and Richard, G. (2017). “Acoustic features for environmental sound analysis,” in Computational Analysis of Sound Scenes and Events, ed T. Virtanen, M. D. Plumbley, and D. Ellis (Berlin: Springer), 71–101. doi: 10.1007/978-3-319-63450-0_4
Serra Bragança, F. M., Broomé, S., Rhodin, M., Björnsdóttir, S., Gunnarsson, V., Voskamp, J. P., et al. (2020). Improving gait classification in horses by using inertial measurement unit (IMU) generated data and machine learning. Sci. Rep. 10:17785. doi: 10.1038/s41598-020-73215-9
Solé, M., Santos, R., Molina, A., Galisteo, A., and Valera, M. (2014). Genetic analysis of kinematic traits at the trot in Lusitano horse subpopulations with different types of training. Animal 8, 192–199. doi: 10.1017/S1751731113002036
Su, Y., Zhang, K., Wang, J., Zhou, D., and Madani, K. (2020). Performance analysis of multiple aggregated acoustic features for environment sound classification. Appl. Acoust. 158:107050. doi: 10.1016/j.apacoust.2019.107050
Valera, M., Galisteo, A. M., Molina, A., Mir,ó, F., Gómez, M. D., Cano, M. R., et al. (2008). Genetic parameters of biokinematic variables of the trot in Spanish Purebred horses under experimental treadmill conditions. Vet. J. 178, 219–226. doi: 10.1016/j.tvjl.2007.07.031
Vicente, A. A., Carolino, N., Ralão-Duarte, J., and Gama, L. T. (2014). Selection for morphology, gaits and functional traits in Lusitano horses: I. Genetic parameter estimates. Livest. Sci. 164, 1–12. doi: 10.1016/j.livsci.2014.01.020
Voulodimos, A., Doulamis, N., Doulamis, A., and Protopapadakis, E. (2018). Deep learning for computer vision: a brief review. Comput. Intell. Neurosci. 2018:7068349. doi: 10.1155/2018/7068349
Wanderley, E. K., Manso Filho, H. C., Manso, H.E., Santiago, T. A., and McKeever, K. H. (2010). Metabolic changes in four beat gaited horses after field marcha simulation. Equine Vet. J. Suppl. 38, 105–109. doi: 10.1111/j.2042-3306.2010.00288.x
Wicaksono, A. S., and Supianto, A. A. (2018). Hyper parameter optimization using genetic algorithm on machine learning methods for online news popularity prediction. IJACSA 9, 263–267. doi: 10.14569/IJACSA.2018.091238
Yin, Y., Tu, D., Shen, W., and Bao, J. (2020). Recognition of sick pig cough sounds based on convolutional neural network in field situations. Inform. Process. Agric. doi: 10.1016/j.inpa.2020.11.001. [Epub ahead of print].
Keywords: audio-feature, convolutional neural network, sound analysis, horse gait, four-beat gaited
Citation: Alves AAC, Andrietta LT, Lopes RZ, Bussiman FO, Silva FF, Carvalheiro R, Brito LF, Balieiro JCC, Albuquerque LG and Ventura RV (2021) Integrating Audio Signal Processing and Deep Learning Algorithms for Gait Pattern Classification in Brazilian Gaited Horses. Front. Anim. Sci. 2:681557. doi: 10.3389/fanim.2021.681557
Received: 16 March 2021; Accepted: 19 July 2021;
Published: 20 August 2021.
Edited by:
Joao R. R. Dorea, University of Wisconsin-Madison, United StatesReviewed by:
Dario Augusto Borges Oliveira, University of Wisconsin-Madison, United StatesArthur Francisco Araujo Fernandes, Cobb-Vantress, United States
Copyright © 2021 Alves, Andrietta, Lopes, Bussiman, Silva, Carvalheiro, Brito, Balieiro, Albuquerque and Ventura. This is an open-access article distributed under the terms of the Creative Commons Attribution License (CC BY). The use, distribution or reproduction in other forums is permitted, provided the original author(s) and the copyright owner(s) are credited and that the original publication in this journal is cited, in accordance with accepted academic practice. No use, distribution or reproduction is permitted which does not comply with these terms.
*Correspondence: Anderson Antonio Carvalho Alves, YWx2ZXMuem9vdGVjbmlzdGFAZ21haWwuY29t; Ricardo Vieira Ventura, cnZ2ZW50dXJhQHVzcC5icg==