 Johan Thomas
 Yvonnick Rousselière1
 Anne Hémonic
- 1Pig Breeding Department, French Institute for Pig and Pork Industry, Paris, France
- 2R&D, IT and Digital Department, French Institute for Pig and Pork Industry, Paris, France
This study analyzed individual water and feed consumption related to weight of weaned piglets and their link to diarrhea. Data were collected from 15 batches of 102 piglets each, using specific automata (connected feeders, connected drinkers, automatic weighing stations, RFID ear tags). Analyses were carried out every week on the 138 healthy animals compared by weight category. The average feed consumption had no significant difference between weight categories (light, medium, heavy pigs) whatever the week and was close to 4% of the live weight. For the average water consumption according to weight, it was close to 10%. There was no significant difference between weight groups, except at the end of the period, where the variability of one heavy pig was so high that its own water consumption caused significant difference when compared with the light group. But these overall stable averages do not highlight the high intra-individual variabilities, which was around 40% for both water and feed data at the beginning of trial. At the end, it was almost 16% for feed consumption and 25% for water. The comparison between healthy and diarrheic piglets showed no statistical difference for average water consumption on the day of the first clinical signs and even 1 and 2 days before. In contrast, the average feed consumption had a very significant difference (P ≤ 0.001) for days 5–7 after the weaning and a significant difference for day 8 (P ≤ 0.05). Differences were also significant for data 24 and 48 h before first clinical signs. This means either that diarrheic piglets decrease their feed consumption the first days after weaning or that it is because they eat less that they become diarrheic. So, the hypothesis was that feed consumption could be an interesting indicator to detect early sick animals. Nevertheless, despite this difference, machine learning methods failed in detecting individually diarrheic animals from water and feed consumption related to weight, because of considerable individual variability. To improve these results, one solution could be to collect other data from new sensors like automatic measurement of body temperature or location of piglets in the pen by image analysis.
Introduction
Antimicrobials are a critical global resource and antimicrobial resistance is recognized as one of the most serious current global public health threats (Prestinaci et al., 2015).
There has been increasing recognition that widespread antimicrobial usage in food animal production might contribute to the development of resistance to antimicrobials commonly used in human medicine (Landers et al., 2012; Aidara-Kane et al., 2018), largely due to the use of common antimicrobials in food producing animals and humans (Tang et al., 2017).
A detailed review, known as ≪ the RONAFA opinion ≫, was published by EMA and EFSA in 2017, to address the need to reduce the use of antimicrobial agents in animal husbandry within the EU [EMA Committee for Medicinal Products for Veterinary Use (CVMP) EFSA Panel on Biological Hazards (BIOHAZ) et al., 2017]. In part, this study was motivated by the results of the European Surveillance of Veterinary Antimicrobial Consumption (ESVAC) project, which highlighted considerable variation in the use of antimicrobials between countries, also the introduction in some countries of initiatives to successfully reduce antimicrobial consumption (European Medicines Agency, 2019).
Consistent with the findings of the RONAFA opinion, a broad range of measures are being used across different countries to reduce the need for antimicrobial usage in food animal production (Postma et al., 2015). Thus, good health and a reduced use of antimicrobials can be promoted by disease prevention (biosecurity for instance), disease control (vaccination for instance), and—if necessary—targeted and precise treatment (individual injectable and curative treatment for instance)
The objective of this study was to analyze one aspect of the means of action ≪ disease control ≫: the early detection of disease. Indeed, this strategy allows rapid action to prevent further spread and increase treatment efficacy (Ferran et al., 2011; Lhermie et al., 2016).
Continuous monitoring of changes in animal behavior that occur during development of clinical signs of disease can have diagnostic value and may allow the development of automatic early warning systems (Matthews et al., 2016; Miller et al., 2019; Alameer et al., 2020). Such changes include modifications in feeding, drinking as well as in posture and activity (Martínez-Avilés et al., 2017). These Precision Farming techniques (visual imaging, RFID, audio analysis,…) hold great promise for improving livestock management through automated, continuous, and objective monitoring of behavioral changes (Berckmans, 2004; Cornou and Kristensen, 2013). This is a promising development but needs more research to facilitate early disease detection by making it context specific.
More specifically, this paper seeks to detect diarrhea early in weaned pigs using automata recording of individual weight and feed and water intake of pigs equipped with RFID tags.
Materials and Methods
Ethics
The trial took place at IFIP's experimental station that has an official approval authorizing our institute to perform scientific trials on animals. This approval is registered by the French Authorities under the number E-35-245-28. Dr Anne HEMONIC, Doctor in Veterinary Medicine, was the pilot of this study and has the official degree to perform scientific trials on pigs, with respect of their welfare.
Furthermore, the protocol did not include any painful or disturbing tasks on the pigs: their feeding and drinking behavior was registered by connected automata that were not intrusive. Their health status was checked by observation of trained employees, which was also not intrusive. Their environment (temperature, ventilation) and breeding conditions were also controlled to comply with classical conditions in pig farms. The trial did not include any blood samples or other specific interventions that should have needed to make it reviewed and approved by an ethics committee.
Animals
The study involved 15 batches of 102 piglets between weaning at 28 days of age. The piglets leave post-weaning for fattening units at different ages, on our study, we kept them until day 36 of post-weaning. The pigs were distributed into six pens of 17 animals using several criteria: the sow, the weaning weight, and the sex of the piglet. The sex ratio was 50/50, so depending on the number of piglets available there were nine males and eight females per pen or the reverse. The distribution of animals by weight resulted in two pens per category: light (6.7 kg on average), medium (8.0 kg) and heavy (9.5 kg). Finally, a maximum of four litters were mixed in a single pen. This method of allocating piglets helped to reduce fights during the test, keep the lots homogeneous, and compare the pigs according to their weaning weight class.
Automata for Automatic Data Collection
Each pen had two connected feeders for recording feed consumption, a connected drinker for collecting water consumption and a connected weighing pan for recording the live weights of piglets.
The data records are individual because each piglet was equipped with an RFID (Radio Frequency Identification) chip positioned in the ear, communicating by radio frequency with the automata. The chips were installed on the weaning day with a specific plier, during the distribution in the six pens. Thus, when an animal was detected by an automaton, its individual number was immediately identified by an RFID antenna and the information generated by the automaton was automatically assigned to it (water or feed consumption or weight, depending on the automaton concerned). Low Frequency RFID technology was able to detect an animal at a distance of 20 cm and only one piglet at the same time, which guaranteed the recorded information. When the animal left the detection field of the antenna, this information was sent to a collection box which compiled and aggregated it into a single piece of information before transmitting it to a central computer. Finally, the computer was responsible for time stamping and then archiving all the compiled information transmitted to it to create a daily flat file database (csv). In this daily flat file, a line was produced that corresponded to an event that occurred on one of the automata.
The connected feeder consisted of a trough equipped with a probe capable of detecting the presence of dry feed, a radio frequency detection antenna (RFID) and a gear motor connected to a worm screw (Rousseliere et al., 2020a). This micro-screw distributed the feed in doses of 10 grams (± 2 g), from a storage hopper above it. The trough was conical in shape and was equipped with a probe capable of detecting the presence or absence of dry feed. The shape and position of the probe allowed it to be covered quickly when dispensing feed. When an animal was detected by the automaton, it was protected by stall partitions (up to the thighs at the start of the batch and then to the shoulders at the end of the batch). This type of connected feeder only allowed feeding one animal at a time to ensure the reliability of individual animal detection. If there was feed left in the trough, that is, the probe was covered, the piglet needed to consume it for a new dose to be dispensed. When the probe was discovered and an animal was detected, the automaton automatically activated the geared motor, and a dose was dispensed to the animal present. Each time a piglet ear tag was detected by the RFID antenna, the computer located in the office time stamped the visit and recorded the amount of feed consumed. To ensure the consistency of the data collected by the machine, the feed was weighed every day by the animal handlers and the accuracy of the distribution was checked every week.
The connected drinker consisted of a bowl drinker, adjusted at 1 l/min (± 1ml), connected to an individual water meter and an RFID antenna to identify piglets (Rousselière et al., 2016). The flow rate of the drinkers was checked at the start and at the middle of the test to always guarantee a flow rate of 1 l/min. Each drinker was associated with a weighing pan suspended using two strain gauges, at the front and at the rear of the automaton (Marcon et al., 2018). This device allowed precise weighing to ± 10 grams. As soon as a difference in weight was detected on the platform, a measurement was taken every 10 milliseconds until the output of the animal from the automata. We then obtained a Gaussian curve, and a pre-processing was carried out directly by the automaton to extract the mean weight of the animal. The whole of this device was also equipped with side walls. These were flexible to adapt to the growth of piglets and prevent several animals from drinking at the same time. Every time a piglet ear tag was detected by the RFID antenna, which was positioned behind the drinker, the computer, located in the office, timestamped the visit and recorded the weight and quantity of water.
Trial Management
The piglets were fed ad libitum via the connected feeders for the duration of the trial. A classic 1st age feed was distributed during the first 14 days of the test, then the animals were fed a 2nd age feed until their leaving.
The room atmosphere was managed by a control box configured according to the recommended standards, namely 28°C at the entrance of the piglets and a gradual descent to 24°C at their exit. The box controlled the fans and heaters installed above each of the pens.
Observations of Health Status
In order to collect a maximum of data on the animal's health status, observations of the piglets were made by animal keepers every day and by specialized technicians three times a week. All these observations were made according to a unique standardized grid and the observers were trained by a veterinary to limit the subjectivity of the data. Between animal keepers and technicians, the main difference was the time spent for the observations, technicians checked all the piglets one by one and spent at least 20 min at each pen. During each observation, the health status of each piglet was registered on a sheet previously printed with the ID of piglets in this pen. There was also the possibility for the observer to write other kind of useful information about the animal (dead, infirmary…). The scoring grid used is described here:
- Digestive disorders: D0 = normal state (=healthy animals), D1 = onset of diarrhea (=soft feces), D2 = marked diarrhea (=liquid feces). D1 and D2 pigs are considered as sick animals.
- Respiratory disorders: T0 = no cough, T1 = less than three coughing fits, T2 = three or more coughing fits.
- Musculoskeletal disorders: B0 = normal gait, B1 = hampered gait, B2 = no longer puts a hoof.
- Wounds and bites: P0 = no wounds, P1 = wound <2 cm in diameter, P2 = wound ≥2 cm with their location.
- Abscesses and swelling: the location of them (castration, ears, legs, whitlow, etc.).
- The other observations, with, for example, the thinness or the pallor of an animal.
Data Analysis
Database Creation
At each end of batch, the files with feed and water consumption and the weight of all the piglets were automatically imported into a database developed with Access software. The data of health scoring status were also imported into the database after entry via a dedicated form developed in VBA, with different alert messages and buttons blocked to signal any missing information in order to reduce entry errors.
For data analysis, all the information collected on the fifteen batches was exported to be manipulated and analyzed using Python language, via the Jupyter interface.
The data were aggregated daily for each piglet and data cleaning was carried out: periods, pens, and animals with biased (for example a defective water meter) or incomplete (automata or computer errors, power cut) data on water, feed or weight were deleted. These cases can happen due to a power failure, a problem with an automaton, loss of RFID ear tag, ….
Selection of Animals Included in the Data Analysis
After cleaning the database, 15 batches representing 53,550 lines (one line represents one animal for 1 day) were used for the analysis. Of the 1,530 piglets registered in the database, ~9% (138 pigs representing 4,830 lines in the database) showed no symptoms of all the clinical scores (not only diarrhea) during the 5 weeks of the trial, they represented the “Healthy” group of animals. To constitute the group of “Sick” animals, we used 2,568 lines of pigs rated D1 and 1,686 lines of pigs rated D2. Pigs having exhibited clinical signs other than diarrhea (cough, lameness, wounds, etc.) were not included in this study.
Furthermore, to compare healthy and sick animals, data corresponding to the first day of diarrhea and the days before were used. In cases where diarrhea in a pig lasted several days, the days after the first detection were not used in the analyses. Indeed, the objective of the study was to detect the appearance of a digestive problem early, so it was essential to detect any behavioral changes of a healthy animal and notify the breeder; ideally in the days prior to the diarrhea, and at the latest, on the day where the first clinical signs appear. Beyond that time frame, pathology detection is too late. It becomes too similar to the techniques breeders use to simply observe their animals.
Creating Variables for Analysis
The water and feed consumption were directly connected to the live weight of the animals, and so were systematically expressed as a percentage of the live weight of the pigs (ml of water consumed/g of live weight and g of feed/g of live weight). This made it possible to compare the results of animals with several weights at a given age.
To represent the piglet's behavioral changes over time and according to its digestive health for analysis via machine learning, the following variables were created: the accumulation, since the start of the test, of water consumption related to weight; the cumulation of feed consumption in relation to weight and the 2- and 3-day moving averages of water and feed consumption. The moving averages made it possible to obtain a result considering the previous days, which indicated the dynamics of water and feed consumption of the piglet and not only to use data from a given day.
Data Analysis, Statistical Tests, and Machine Learning
First, the water and feed intakes of healthy animals were studied to see if a healthy animal showed stable results over time, which was necessary to detect deviant behavior in sick animals. The results of the three weight categories were visualized by box plot and compared individually with a Tukey test. Analyses were performed with data from days 2 to 36, grouped by week from Friday to Friday. Day 1, which corresponded to the Thursday of arrival in post-weaning, was not considered in these analyses because the new environment strongly affected the behavior of the piglets.
Then, the intra-individual variability of water and feed consumption in healthy animals was evaluated by calculating the coefficient of variation (ratio between the standard deviation and the mean) of each pig week by week. An average was then calculated with the coefficients obtained for all the pigs.
Then, the feed and water consumption of the healthy and sick groups were compared by a Tukey test to evaluate the difference of mean. Due to the amount of data, normality was not checked before the Tukey test, in step of the scipy.stats.shapiro documentation: “For N >5,000 the W test statistic is accurate but the p-value may not be.” The aim was to check whether a sick animal was feeding differently to a healthy animal and if so, how many days in advance. Comparisons were therefore made on the very day of the onset of diarrhea, then 24 h, and 48 h before. For these comparisons, the first 4 days of the trial were removed from the data analysis.
Indeed, on the first day, which corresponded to weaning, the piglets showed an exploratory behavior to discover their new environment: automata for feeding and watering, absence of the sow, new other piglets in the pen, etc. On days 2, 3, and 4, the health observations were reduced due to the weekend. The start of data analysis therefore began on the Monday following weaning, the fifth day of presence in the room, with reliable health data. Due to our work on early disease detection, several days were excluded from the comparison between healthy and sick data, because of zero piglets with the first diarrhea symptoms on these days. Therefore, days 31, 32, 34, and 36 do not appear on the following graphs.
Finally, a machine learning approach using scikit-learn package on Python language via Jupyter software was adopted using seven different methods (logistic regression, linear discriminant analysis, k nearest neighbor classifier, decision tree classifier, Gaussian naive Bayes classification, support vector machines and random forest). These methods were used with the default parameters on this first comparison, on future studies we can work on the fine-tuning parameters. The objective was to classify the piglets in two groups: healthy or sick. To do this, the performance of each method was compared according to its sensitivity and specificity. Sensitivity is the method's ability to detect sick animals and to avoid false negatives. Its calculation is Sensitivity = a/a + c where a = number of true positive and c = number of false negative. Specificity is the method's ability to detect healthy animals and to avoid false positives. Its calculation is Specificity = d/b + d where d = number of true negative and b = number of false positive. For these analyses, we created two databases: training database, with the piglets of 10 batches randomly drawn, and test database with the five batches remaining. The results obtained with the training database were then validated with the test database because checking the results with other data than training data was essential to evaluate the machine learning methods.
Results
Water and Feed Consumption of Healthy Animals
The feed (Figure 1) and water (Figure 2) consumption of piglets were compared week by week according to their weight category. For the feeding data, no significant difference was observable between the weight categories for a given week. For water consumption, one significant difference was observed: between the small group and the heavy group, in week 5. We found a piglet with very high level of water consumption in the heavy group for weeks four and five.
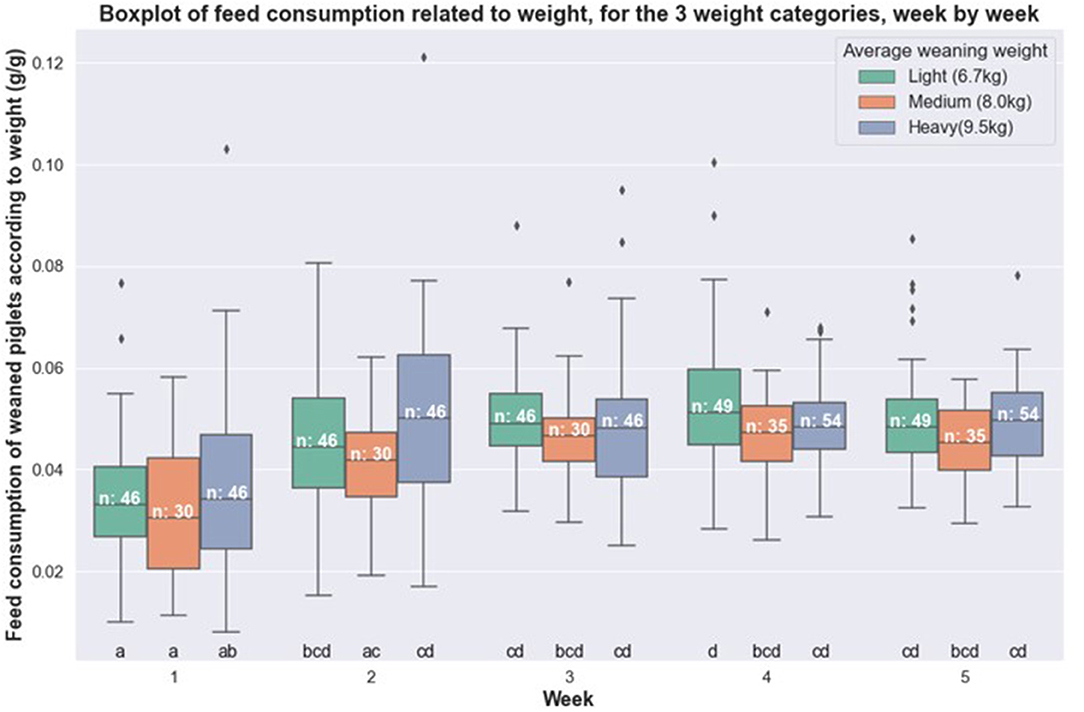
Figure 1. Boxplot of feed consumption related to weight for healthy piglets, week by week, according to their weight category (light, medium and heavy).
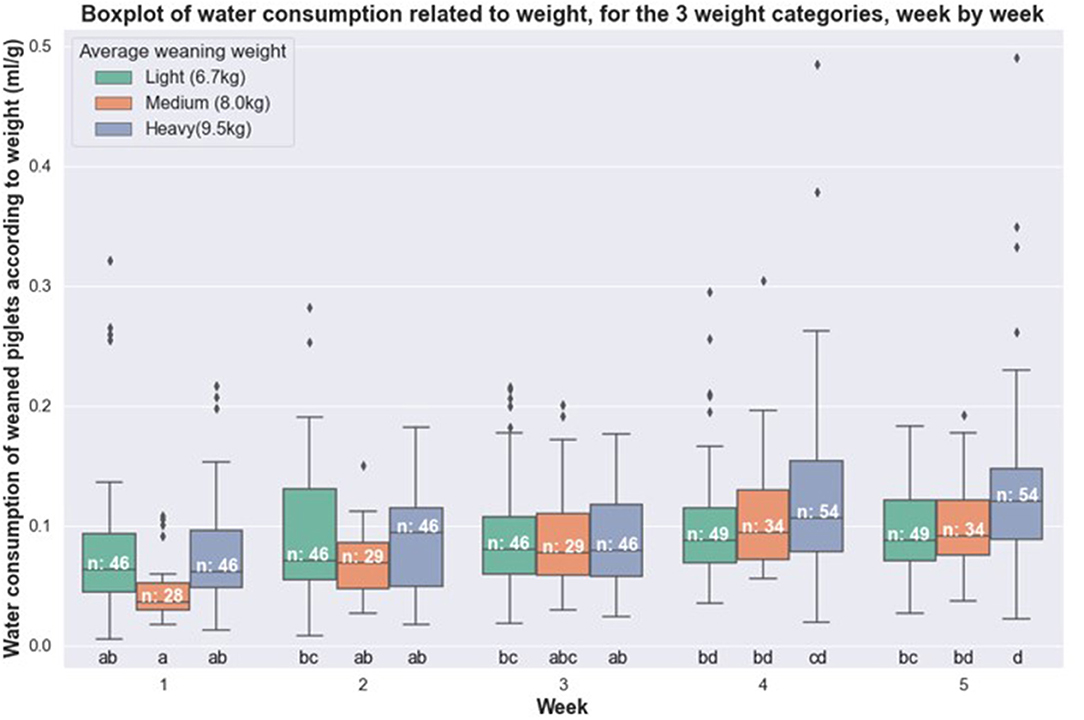
Figure 2. Boxplot of water consumption related to weight for healthy piglets, week by week, according to their weight category (light, medium and heavy).
Furthermore, we noted that feed consumption increased from the 2nd and 3rd week, where it was significantly higher than the first week. Thus, the average feed consumption increased from 3.4 to 4.9% of live weight between the start and the end of the period. Average water consumption also changed week after week: it went from 7.1 to 11.3% of body weight between the start and the end of the period.
The intra-individual variability of water and feed consumption is presented in Table 1 based on the average of the coefficients of variation for each of the 138 healthy pigs week by week. Very similar coefficients were observed between the weight categories for the same week with a maximum difference of 5%, for both feed and water consumption. It should also be noted that the coefficients decreased as the test progressed, from 39 to 16% for feeding and from 40 to 25% for watering.
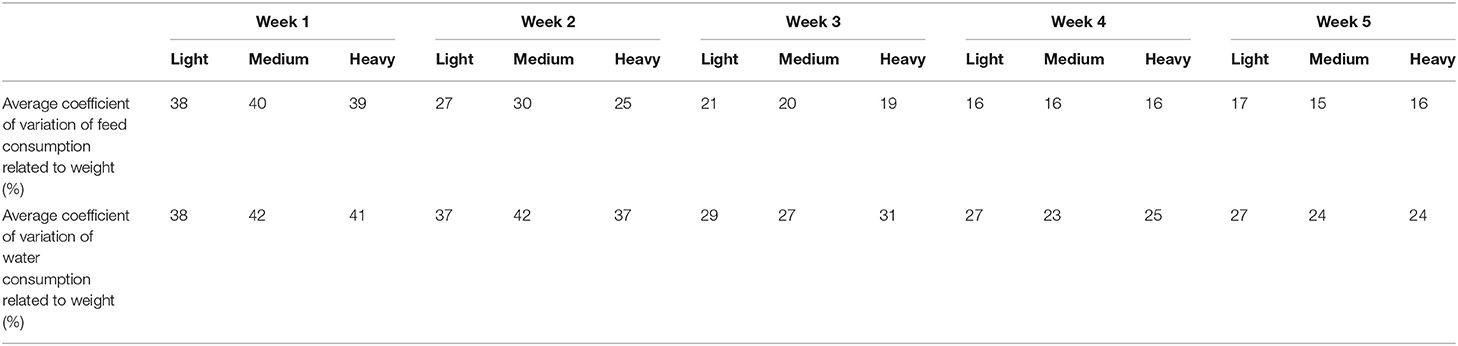
Table 1. Average coefficient of variation (in %) of the intra-individual feed and water consumption related to live weight, week by week, according to the weight group of the 138 healthy piglets (light, medium and heavy).
Comparison of Water and Feed Consumption Between Healthy and Sick Animals
Analysis of water consumption showed no significant statistical difference between the group of healthy animals and that of sick animals on the day of the onset of diarrhea (Figure 3). This observation is also valid for the consumption of the 2 days prior to observing the diarrhea for the first time. That is to say that an animal with diarrhea had the same water consumption as a healthy animal, both on the day of observation of the first clinical signs, and also during the 24 and 48 h before.
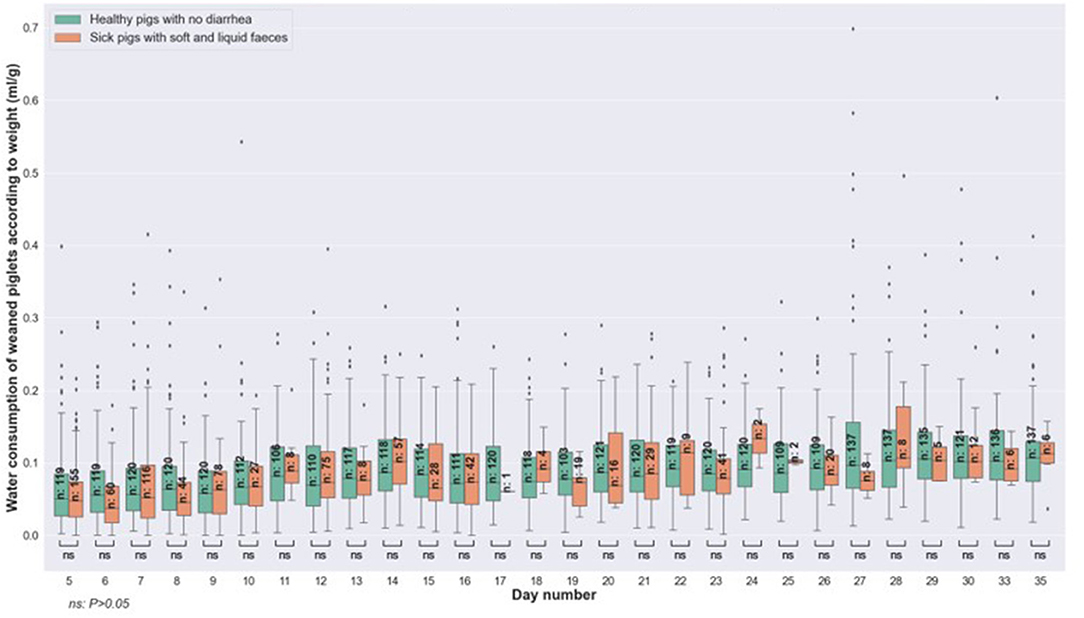
Figure 3. Comparison of water consumption related to weight, between healthy pigs (no diarrhea) vs. sick animals (with soft and liquid diarrhea) at the same age and on the day of onset of diarrhea.
On the other hand, significant differences were observed between the feed consumption of the healthy and sick groups during test days 5–8, for the day of diarrhea observation (Figure 4). These differences were also significant for the data collected 24 and 48 h before the observation of diarrhea. In fact, sick animals consumed less feed than healthy animals, 1 and 2 days before the onset of clinical signs. From day 9 of the period and until the end of the batch, the differences were no longer significant.
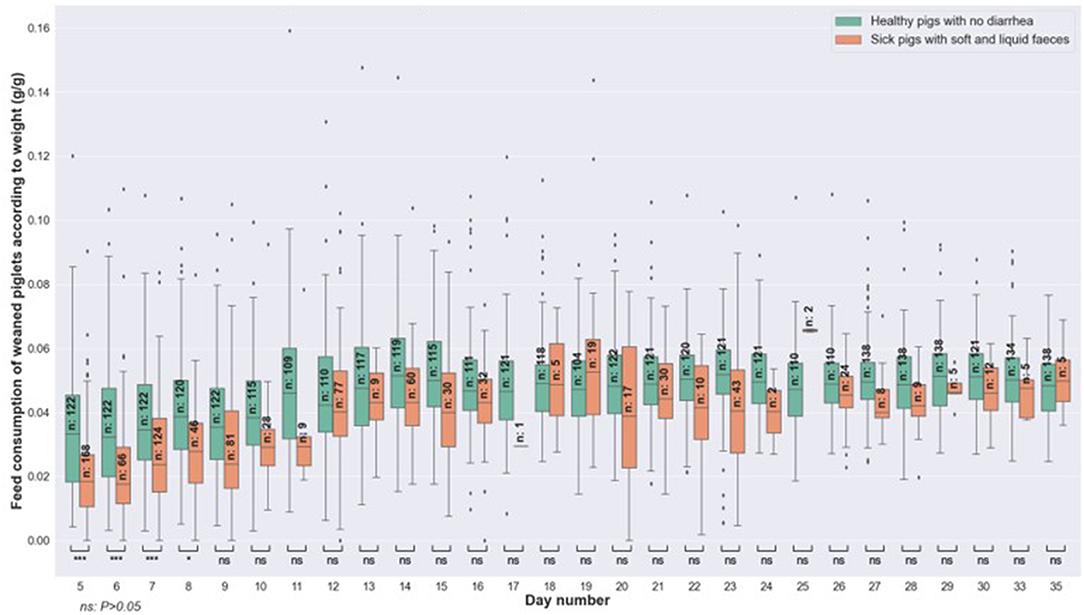
Figure 4. Comparison of feed consumption related to weight, between healthy pigs (no diarrhea) vs. sick animals (with soft and liquid diarrhea) at the same age and on the day of onset of diarrhea.
Data Analysis With Machine Learning Methods
The results of the seven methods regarding sensitivity and specificity are presented in Table 2.
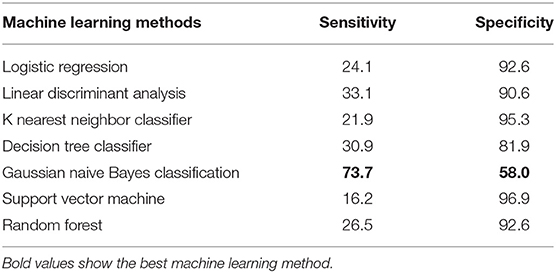
Table 2. Sensitivity and specificity (in %) of machine learning methods for piglet diarrhea detection, from watering, feeding and weight data.
The Gaussian naive Bayes classification shows the best sensitivity results (73.7%) compared to the other six methods that don't reach more than 33.1%, but its specificity is only equal to (58.0%), whereas the other methods are all above 80%.
But it doesn't significantly change the previous results suggesting that watering data do not impact the efficacy of the models.
Discussion
The follow-up of fifteen bands of 102 piglets enabled the creation of a substantial database composed of daily and individual data on water, feed consumption and weight of weaned piglets to study the possibility of early diarrhea detection on post-weaning.
This study showed that feed consumption in relation to weight does not show significant differences between the three weight categories (light, medium and heavy) in healthy pigs. The conclusion is similar for water consumption, except in week 5 when the heavy pig category consumed significantly more water than the light pig category. This result of week 5 should nevertheless be interpreted with caution because the average water consumption of heavy pigs was abnormally increased by the results of one piglet which was a very heavy user or waster of water. Furthermore, this piglet was weaned during a heat wave period, which can explain high consumption. On the other hand, for the first 4 weeks of post-weaning, water consumption was similar in healthy and sick pigs. This result is particularly interesting because it is not intuitive: one would have thought that heavy animals would have had more difficulty getting used to their new environment after weaning compared to light animals. Indeed, lighter animals have frequently less access than the heavier ones to the sow's milk and they look for the solid feed to satisfy their needs. Since heavy animals have enough milk, they consume less solid feed during lactation and weaning may be more difficult for them. But this was ultimately not the case. Moreover, among the healthy animals, the light group had a higher number (49) than the medium group (35) and close to that of heavy animals (54), indicating that healthy animals existed over the entire period of the trial whatever the weight category. This finding was also interesting because it allowed us to dispense with an analysis by weight category to compare the water and feed consumption of healthy and sick animals in the rest of the study.
The data recorded indicates that a piglet drinks on average an amount of water equivalent to 7–11% of its bodyweight, whether healthy or sick. A previous study carried out in France confirms this data (Massabie et al., 2013; Massabie et al., 2014). Of course, these data also include the waste of water, that represented around 19–20% of the total amount of water registered with nipple bowls (Torrey et al., 2008). But waste of water can be higher with some pigs that play or refresh themselves with water: this is probably what happened in week 5 for one pig in the healthy and heavy group.
The data obtained for feed consumption included between 3 and 5% of live weight and confirmed the first results described from two batches in a previous study using the same machines and the same protocol (Rousseliere et al., 2020b). Healthy animals had a feed intake of 4.6% (± 1.7) and 3.8% (± 1.8) of live weight on the batches studied. In addition, the consumption of feed relative to that of water corresponded to the ratio of two to one, as shown by the research of Mroz et al. (1995).
The fact our data indicates that healthy animals have, on average, the same water and feed intake relative to their live weight, regardless of their weight category would suggest it is possible to detect diarrheal animals with, intuitively, more atypical behavior. Nevertheless, the large intra-individual variability in the consumption of water and feed of healthy animals represents a real obstacle to this early detection: the consumption is very variable from 1 day to another for the same healthy individual. These intra-individual variabilities correspond to the data obtained by Rousselière et al. (2019), who observed, at the start of post-weaning, a coefficient of variation of 45.8% for water consumption and 40.7% for feed consumption. For our part, during the first week of post-weaning, the coefficient of variation of water consumption varied between 38 and 42% depending on the weight category, and that of feed consumption was between 38 and 40%. These coefficients gradually decreased during the trial but remained high with values between 24 and 27% for water, and 15 and 17% for feed, when pigs left. This confirms the results of the cited study with, at the end of post-weaning, the coefficient variation of 27.4% for water and 18.3% for feed. This high intra-individual variability may therefore complicate the discrimination of diarrheal animals from healthy animals.
Moreover, the fact that sick animals continued to drink normally, whereas their feed consumption decreased when compared to healthy animals is a major result for another field than the early detection of pathologies. Indeed, this means that it is better to treat sick animals through drinking water rather than through feed in order to avoid under dosage of medicines.
If the amounts of water drunk do not seem relevant here for early detection of the onset of diarrhea, our goal is now to analyze drinking water behavior (number, hour and duration of visits) in order to identify pathological disorders, as shown by Madsen and Kristensen (2005). On growing pigs also, the water consumption (water flow and drinking bouts frequency) is a good predictor for diarrhea on pens using linear models (Jensen et al., 2017). Our connected drinkers could also be used in the future to detect pathologies other than diarrhea, like A. pleuropneumoniae (Pijpers et al., 1991) and respiratory problems in fattening pigs (Brumm, 2006).
Our results show that the use of feed consumption seems more relevant for the early detection of diarrhea. Indeed, significant differences for days 5–8 were observed between healthy animals and those with diarrhea. These differences showed that animals with diarrhea consume less feed, relative to their weight, than healthy animals. This result was also observed on the days preceding the observation of first diarrhea signs, which would make it possible to anticipate the pathology before the appearance of the first clinical signs. These results confirm that the animal's state of health influences its feed intake. But health status is one among others: hunger and satiety, but also veterinary treatments, the composition of the feed, the feeding system, the housing, the breed, and the environment of the pig (Maselyne et al., 2015). All these parameters affect the feed consumption, which makes automatic detection complicated.
The use of machine learning methods also allowed us to automatically value the data collected. Among the seven methods tested, none had performances that we can consider good both on sensitivity and specificity to help farmers to early detect diarrhea on weaned piglets: the Gaussian naïve Bayes classification offered the best sensitivity results with 73.7% but it's not acceptable to consider that more than 25% of the sick piglets are not detected by the model. In the same way, the specificity of this method is bad because it reaches only 58% which means that nearly half of the healthy pigs are classified as sick. All these results are insufficient for a commercial tool, which requires at least 85% of sensitivity and specificity.
The very low sensitivities seen here may be the result of over-learning the methods with healthy animals. Indeed, sick animals only represented 15% of the training base, which may not be enough for the model to learn the specific behavior of these sick animals compared to healthy animals. Another explanation for this poor performance is the very high intra-individual variability in the feed consumption of healthy animals. The model therefore failed to distinguish a sick animal from a healthy animal, since their feed consumption was in the same range.
To improve the results obtained, the next step will be to analyze variables already included in our database but not investigated up to now (such as: duration inside feed and water automata, rooms temperature, veterinary treatments, …) or new variables. For example, the temperature of animals seems to be a good indicator of the presence of diarrhea in a pen, as shown by Jensen and Kristensen (2016). The use of cameras and automatic image analysis could also make it possible to detect health disorders by monitoring the water consumption of pigs at the pen scale (Kashiha et al., 2013), their weight (Kashiha et al., 2014) their postures and drinking behavior (Alameer et al., 2020) and their position in selected areas (Labrecque et al., 2019).
Conclusion
The early detection of pathologies in pig farming is a promising strategy for helping breeders to monitor animal health, reduce the use of antibiotics and treat sick animals in a targeted manner. The objective of this study was to assess the predictive value of individual water and feed consumption to detect the onset of diarrhea in weaned piglets, identified by RFID ear tag, and bred in pens equipped with feeders, drinkers and connected scales.
The results showed that the average water and feed consumption of healthy pigs was not statistically different over the post-weaning period according to their weight category (heavy, medium, light). In addition, no significant difference was observed between the average water consumption of healthy and sick animals, neither on the day of the observation of diarrhea nor 1 or 2 days before. On the other hand, a significant difference was noted between the average feed consumption of healthy and sick piglets from the fourth to the ninth day post-weaning, both on the day of the observation of diarrhea and 24 and 48 h before. However, machine learning methods have not made it possible to obtain a model allowing the early detection of diarrhea with sufficient sensitivity and specificity for a commercial tool on the field (72 and 62%, respectively). The reason is the huge intra-individual variability in the consumption of feed by healthy animals which really complicates the discrimination of diarrheal animals from healthy animals.
For future studies, new parameters such as automatic measurement of body temperature or location of piglets in the pen by image analysis could improve the performance of these methods.
Data Availability Statement
The raw data supporting the conclusions of this article will be made available by the authors, without undue reservation.
Ethics Statement
This animal study took place in IFIP's experimental station that has an official approval authorizing our institute to perform scientific trials on animals. This approval is registered by the French Authorities under the number E-35-245-28.
Author Contributions
JT, YR, MM, and AH contributed to the study conception and design. JT, YR, and AH supervised data acquisition, contributed to interpretation of the data, and they drafted and critically revised the manuscript. All authors contributed to the article and approved the submitted version.
Funding
This experiment was part of the EU-China Healthy Livestock project. The authors wish to acknowledge that Healthy Livestock was funded by the European Union H2020 research and innovation program under grant agreement number 773436.
Author Disclaimer
The European Commission's support to produce this publication does not constitute an endorsement of the contents, which reflect the views of only the authors, and the Commission cannot be held responsible for any use which may be made of the information contained therein.
Conflict of Interest
The authors declare that the research was conducted in the absence of any commercial or financial relationships that could be construed as a potential conflict of interest.
Publisher's Note
All claims expressed in this article are solely those of the authors and do not necessarily represent those of their affiliated organizations, or those of the publisher, the editors and the reviewers. Any product that may be evaluated in this article, or claim that may be made by its manufacturer, is not guaranteed or endorsed by the publisher.
Acknowledgments
Lorena Girre, Delphine Loiseau, Romain Richard, and the caretakers (Experimental Pig Station of IFIP, Romillé, France) are acknowledged for care and management of the pigs. The authors would like to thank Didier Concordet, Remi Servien, and Malika Chassan for their reflection and discussions on the analysis of the data.
References
Aidara-Kane, A., Angulo, F. J., Conly, J. M., Minato, Y., Silbergeld, E. K., McEwen, S. A., et al. (2018). World Health Organization (WHO) guidelines on use of medically important antimicrobials in food-producing animals. Antimicrob. Resist. Infect. Control 7:7. doi: 10.1186/s13756-017-0294-9
Alameer, A., Kyriazakis, I., and Bacardit, J. (2020). Automated recognition of postures and drinking behaviour for the detection of compromised health in pigs. Sci. Rep. 10:13665. doi: 10.1038/s41598-020-70688-6
Berckmans, D. (2004). “Automatic on-line monitoring of animals by precision livestock farming,” in International Society for Animal Hygiène, ed F. Madec et Genevieve Clement (Saint-Malo: ISPAIA), 27–30.
Brumm, M. (2006). Patterns of drinking water use in pork production facilities. Neb. Swine Rep. 2006, 10–13. Available online at: https://digitalcommons.unl.edu/coopext_swine/221/
Cornou, C., and Kristensen, A. R. (2013). Use of information from monitoring and decision support systems in pig production: Collection, applications and expected benefits. Livest. Sci. 157, 552–567. doi: 10.1016/j.livsci.2013.07.016
EMA Committee for Medicinal Products for Veterinary Use (CVMP) EFSA Panel on Biological Hazards (BIOHAZ), Murphy, D., Ricci, A., Auce, Z., Beechinor, J. G., Bergendahl, H., et al. (2017). EMA and EFSA Joint Scientific Opinion on measures to reduce the need to use antimicrobial agents in animal husbandry in the European Union, and the resulting impacts on food safety (RONAFA). EFSA J. 15:4666. doi: 10.2903/j.efsa.2017.4666
European Medicines Agency (2019). Sales of Veterinary Antimicrobial Agents in 31 European Countries in 2017 - Trends From 2010 to 2017. Available online at: https://www.ema.europa.eu/en/documents/report/sales-veterinary-antimicrobial-agents-31-european-countries-2017_en.pdf (accessed November 24, 2020).
Ferran, A. A., Toutain, P.-L., and Bousquet-Mélou, A. (2011). Impact of early versus later fluoroquinolone treatment on the clinical; microbiological and resistance outcomes in a mouse-lung model of Pasteurella multocida infection. Vet. Microbiol. 148, 292–297. doi: 10.1016/j.vetmic.2010.09.005
Jensen, D. B., and Kristensen, A. R. (2016). Temperature as a predictor of fouling and diarrhea in slaughter pigs. Livest. Sci. 183, 1–3. doi: 10.1016/j.livsci.2015.11.007
Jensen, D. B., Toft, N., and Kristensen, A. R. (2017). A multivariate dynamic linear model for early warnings of diarrhea and pen fouling in slaughter pigs. Comput. Electron. Agric. 135, 51–62. doi: 10.1016/j.compag.2016.12.018
Kashiha, M., Bahr, C., Haredasht, S. A., Ott, S., Moons, C. P. H., Niewold, T. A., et al. (2013). The automatic monitoring of pigs water use by cameras. Comput. Electron. Agric. 90, 164–169. doi: 10.1016/j.compag.2012.09.015
Kashiha, M., Bahr, C., Ott, S., Moons, C. P. H., Niewold, T. A., Ödberg, F. O., et al. (2014). Automatic weight estimation of individual pigs using image analysis. Comput. Electron. Agric. 107, 38–44. doi: 10.1016/j.compag.2014.06.003
Labrecque, J., Gouineau, F., and Rivest, J. (2019). “Real-time individual pig tracking and behavioural metrics collection with affordable security cameras,” in Precision Livestock Farming '19 Precision Livestock Farming, eds B. O'Brien, D. Hennessy and L. Shalloo (Cork: Precision Livestock Farming), 460–466.
Landers, T. F., Cohen, B., Wittum, T. E., and Larson, E. L. (2012). A review of antibiotic use in food animals: perspective, policy, and potential. Public Health Rep. 127, 4–22. doi: 10.1177/003335491212700103
Lhermie, G., Ferran, A. A., Assié, S., Cassard, H., El Garch, F., Schneider, M., et al. (2016). Impact of timing and dosage of a fluoroquinolone treatment on the microbiological, pathological, and clinical outcomes of calves challenged with mannheimia haemolytica. Front. Microbiol. 7:237. doi: 10.3389/fmicb.2016.00237
Madsen, T. N., and Kristensen, A. R. (2005). A model for monitoring the condition of young pigs by their drinking behaviour. Comput. Electron. Agric. 48, 138–154. doi: 10.1016/j.compag.2005.02.014
Marcon, M., Rousselière, Y., and Hémonic, A. (2018). Développement d'un dispositif de pesée individuelle et automatisée des porcelets en post-sevrage. J. Rec. Porcine 50, 243–244.
Martínez-Avilés, M., Fernández-Carrión, E., López García-Baones, J. M., and Sánchez-Vizcaíno, J. M. (2017). Early detection of infection in pigs through an online monitoring system. Transbound. Emerg. Dis. 64, 364–373. doi: 10.1111/tbed.12372
Maselyne, J., Saeys, W., and Van Nuffel, A. (2015). Review: quantifying animal feeding behaviour with a focus on pigs. Physiol. Behav. 138, 37–51. doi: 10.1016/j.physbeh.2014.09.012
Massabie, P., Aubert, C., Ménard, J. L., Roy, H., Boulestreau-Boulay, A. L., Dubois, A., et al. (2013). Maîtrise des consommations d'eau en élevage : élaboration d'un référentiel, identification des moyens de réduction, construction d'une démarche de diagnostic. Innov. Agron. 30, 87–101. Available online at: https://www6.inrae.fr/ciag/Revue/Volumes-publies-en-2013/Volume-30-Septembre-2013
Massabie, P., Roy, H., Boulestreau-Boulay, A. L., and Dubois, A. (2014). La Consommation d'Eau en Élevage de Porcs. Paris: IFIP Institut du Porc.
Matthews, S. G., Miller, A. L., Clapp, J., Plötz, T., and Kyriazakis, I. (2016). Early detection of health and welfare compromises through automated detection of behavioural changes in pigs. Vet. J. 217, 43–51. doi: 10.1016/j.tvjl.2016.09.005
Miller, A. L., Dalton, H. A., Kanellos, T., and Kyriazakis, I. (2019). How many pigs within a group need to be sick to lead to a diagnostic change in the group's behavior? J. Anim. Sci. 97, 1956–1966. doi: 10.1093/jas/skz083
Mroz, Z., Jongbloed, A. W., Lenis, N. P., and Vreman, K. (1995). Water in pig nutrition: physiology, allowances and environmental implications. Nutr. Res. Rev. 8, 137–164. doi: 10.1079/NRR19950010
Pijpers, A., Schoevers, E. J., van Gogh, H., van Leengoed, L. A. M. G., Visser, I. J. R., van Miert, A. S., et al. (1991). The influence of disease on feed and water consumption and on pharmacokinetics of orally administered oxytetracycline in pigs. J. Anim. Sci. 69, 2947–2954. doi: 10.2527/1991.6972947x
Postma, M., Stärk, K. D. C., Sjölund, M., Backhans, A., Beilage, E. G., Lösken, S., et al. (2015). Alternatives to the use of antimicrobial agents in pig production: a multi-country expert-ranking of perceived effectiveness, feasibility and return on investment. Prev. Vet. Med. 118, 457–466. doi: 10.1016/j.prevetmed.2015.01.010
Prestinaci, F., Pezzotti, P., and Pantosti, A. (2015). Antimicrobial resistance: a global multifaceted phenomenon. Pathog. Glob. Health 109, 309–318. doi: 10.1179/2047773215Y.0000000030
Rousselière, Y., Hémonic, A., and Marcon, M. (2016). Suivi individuel du comportement d'abreuvement du porcelet sevré. J. Rec. Porcine 48, 355–356.
Rousselière, Y., Hemonic, A., Thomas, J., and Marcon, M. (2019). “Development of automata to improve individual management of health in pig production,” in Precision Livestock Farming '19 Precision Livestock Farming, eds B. O'Brien, D. Hennessy and L. Shalloo (Cork: Precision Livestock Farming), 699–706.
Rousseliere, Y., Hemonic, A., Thomas, J., and Marcon, M. (2020a). Alimentation à volonté, individuelle et automatisée pour des porcelets en post-sevrage. J. Rec. Porcine 52, 415–416.
Rousseliere, Y., Hemonic, A., Thomas, J., and Marcon, M. (2020b). Analyse descriptive individuelle du comportement alimentaire, d'abreuvement et de la prise de poids journalière de porcelets sains logés en post-sevrage. J. Rec. Porcine 52, 323–324.
Tang, K. L., Caffrey, N. P., Nóbrega, D. B., Cork, S. C., Ronksley, P. E., Barkema, H. W., et al. (2017). Restricting the use of antibiotics in food-producing animals and its associations with antibiotic resistance in food-producing animals and human beings: a systematic review and meta-analysis. Lancet Planet. Health 1, 316–327. doi: 10.1016/S2542-5196(17)30141-9
Keywords: piglets, diseases detection, individual data, precision livestock farming, feed consumption, water consumption, machine learning
Citation: Thomas J, Rousselière Y, Marcon M and Hémonic A (2021) Early Detection of Diarrhea in Weaned Piglets From Individual Feed, Water and Weighing Data. Front. Anim. Sci. 2:688902. doi: 10.3389/fanim.2021.688902
Received: 31 March 2021; Accepted: 30 July 2021;
Published: 23 August 2021.
Edited by:
Candido Pomar, Agriculture and Agri-Food Canada, CanadaReviewed by:
Mona Lilian Vestbjerg Larsen, KU Leuven, BelgiumAnders Ringgaard Kristensen, University of Copenhagen, Denmark
Copyright © 2021 Thomas, Rousselière, Marcon and Hémonic. This is an open-access article distributed under the terms of the Creative Commons Attribution License (CC BY). The use, distribution or reproduction in other forums is permitted, provided the original author(s) and the copyright owner(s) are credited and that the original publication in this journal is cited, in accordance with accepted academic practice. No use, distribution or reproduction is permitted which does not comply with these terms.
*Correspondence: Johan Thomas, am9oYW4udGhvbWFzQGlmaXAuYXNzby5mcg==