 Patricia I. Colusso
 Cameron E. F. Clark
 Alexandra C. Green2
 Sabrina Lomax
- 1Livestock Production and Welfare Group, School of Life and Environmental Sciences, Faculty of Science, The University of Sydney, Camden, NSW, Australia
- 2Sydney School of Veterinary Science, Faculty of Science, The University of Sydney, Camden, NSW, Australia
Dairy cattle are offered varying amounts of feed which they deplete through time. A reduction in the amount of feed allocated to cows may impact on their containment using a virtual fence (VF). Pre-commercial neckbands (eShepherd®, Agersens, Melbourne, VIC) deliver an audio tone (AT) to the individual cow when it reaches the VF, and this is followed by an electrical pulse (EP) if they continue forward movement. No further stimuli are delivered if the cow stops or turns around. Thirty-four non-lactating dairy cows were used across three blocks in a controlled field experiment evaluating the impact of feed restriction on the exclusion of cows from a lucerne cube feed source using a VF. Within each block cows were pre-trained to the VF system for 6-days on pasture before being fed either a (1) Restricted (R, 12 ± 0.3 kg) or (2) Above maintenance (+M, 20 kg) lucerne cube ration each day. The treatment groups were then tested for four 30 min tests (T1–T4) in test paddocks of 100 × 20 m. For testing, a VF was set at 30 m from the paddock entry and 2 kg per cow of lucerne cube feed was placed at 90 m. Only R cows crossed the VF to access the feed, thereby receiving more AT and EP stimuli in T1 and T2 as compared to +M cows (P ≤ 0.03). However, there was no difference between treatments in T3 and T4 as cows learned the test routine and to remain within the VF in the paddock context. These results suggest that feed restriction may impact the exclusion of dairy cows from feed using a VF, but this effect is limited, and cows can learn to remain within a VF even when fed a restricted ration.
Introduction
In pasture-based dairy systems pasture on offer is typically restricted for dairy cattle (Holmes et al., 2002a,b; Clark et al., 2016). In practise, the desired allocation of pasture is managed through a combination of area given (m2) and time allowed for cows to graze that area (Holmes et al., 2002a), with temporary and/or fixed physical fencing to contain the livestock. Virtual fencing (VF) technology can provide an alternative to physical fences, with the potential to remotely manage livestock within pasture-based systems (Anderson, 2007; Umstatter, 2011; Anderson et al., 2014). Pre-commercial VF neckbands (eShepherd®, Agersens, Melbourne, VIC, Australia) employ an operant conditioning, positive punishment associative learning training method to control animal location (Lee et al., 2007, 2009; Kearton et al., 2019). The device emits an audio tone (AT) as a conditioned stimulus at the VF boundary, paired with an electrical pulse (EP) as the unconditioned stimulus if an animal is unresponsive to the AT (Lee et al., 2007, 2009; Lomax et al., 2019). However, if the cow stops forward movement following AT delivery, turns back towards or returns to the inclusion zone, no further stimuli are delivered. The VF boundary is created using an online map interface with Global navigation satellite system (GNSS), consisting of an inclusion zone and exclusion zone. Cattle have been shown to associate the AT with the EP and will respond increasingly to the AT alone. This has been identified to occur from three (Lomax et al., 2017) to four test sessions in artificial test scenarios (Colusso et al., 2020), and between two (Campbell et al., 2017) and 4 days (Lomax et al., 2019) on pasture. There have been numerous studies using pre-commercial VF prototypes that have focused on learning context (Colusso et al., 2020), age and breed (Lomax et al., 2017), spatial utilisation (Lomax et al., 2019), moving fences (Campbell et al., 2017), and containment from riparian areas (Campbell et al., 2018a), and feed attractants (Lee et al., 2009; Campbell et al., 2018b; Colusso et al., 2020). However, to date no experiment has evaluated the effect of feed restriction on cattle response to VF stimuli.
Dairy cattle have a high motivation to perform foraging behaviours and to consume feed (Von Keyserlingk et al., 2017; Franchi et al., 2019), often irrespective of rumen fill (Lindström and Redbo, 2000), which can increase with additional physiological factors such as growth, pregnancy and stage of lactation. Schütz et al. (2006) showed high levels of motivation for lactating dairy cows to walk to access additional feed after feed deprivation of 3, 6, and 9 h compared to non-lactating dairy cows. Additionally, dairy heifers fed a restrictive diet (2.05% of body weight) pushed heavier levers to access additional feed after 3 and 21 h from feeding compared with heifers offered ad libitum feed (Greter et al., 2015). Dairy cattle experiencing feed restriction as either a restricted quantity and/or time deprived from last feed have an increased motivation to seek out and consume feed (Toates, 2002; Schütz et al., 2006; Greter et al., 2015), however, the association between such levels of feed, feed motivation and VF interactions are unknown. Within pasture-based dairy systems, the amount of pasture on offer and/or restricted (based on either size of the allocation or time spent), has the potential to increase the motivation of dairy cows to search for additional feed sources. This will be problematic for effective pasture management as the next allocation strip for the herd will be right alongside the current, separated by a VF. Feed-seeking behaviour, and associated hunger, caused by differences in metabolic demands (Cooper et al., 2010; Franchi et al., 2019) and/or levels of feed restriction (Schütz et al., 2006; Greter et al., 2015) are strong motivators that can influence animal behaviour and their decision making process (Toates, 2002; Von Keyserlingk et al., 2017; Franchi et al., 2019). Additionally, pasture quality can be influenced by seasonal fluctuations in pasture growth (Holmes et al., 2002b; Schütz et al., 2006), and significantly reduced during periods of extreme climatic events such as heatwaves, floods and droughts (Chang-Fung-Martel et al., 2017). An understanding of the degree of feed restriction has on the containment of dairy cows within VF systems is important for evaluating the commercial application and success of this technology within the intensive pasture-based grazing systems. The aim of this experiment was to determine whether the amount of feed offered (restricted or above maintenance rations) affected exclusion of dairy cows from feed using a VF in a controlled test setting. It was hypothesised that the cows fed a restricted ration would have greater motivation to break through the VF more to access the feed, and thus receive more VF stimuli in comparison to cows fed an above maintenance ration.
Materials and Methods
The experiment was conducted over the September 2018 to February 2019 period at The University of Sydney's research farm “Mayfarm” near Camden, NSW, Australia, 2570. All experimental protocols were approved by the University of Sydney's Animal Ethics Committee (Project 2018/1306).
Experimental Design and Animal Management
Thirty-four Holstein-Friesian non-lactating dry cows (5 ± 0.3 years old; 691 ± 13.8 kg liveweight; 6 ± 0.2 months pregnant) were used. The experiment was repeated across three blocks of time with n = 11–12 cows tested within each block using the same methodology. Two cows were removed, one in block 2 and another in block 3, due to lameness. Within each block cows were assigned a dominance rank (DR) as per Colusso et al. (2020). Briefly, successful agonistic behaviours between pairs of cows were recorded as a win (aggressor cow displaced another cow) or a loss (retreated from aggressor cow) which was tallied up for each cow and imported into a DR formula (Bowen and Brooks, 1978). Cows were given a DR between −1 to +1, with the higher values relating to dominance and lower values to subordinance (Bowen and Brooks, 1978). Cows were then ordered by DR from highest to lowest and randomly assigned a number using the RAND function in Excel® (Microsoft Corporation, Redmond, WA, USA), and sorted by descending order before being split in half to form two treatment groups of (n = 5–6), similarly seen in Colusso et al. (2020). The split by DR ensured the two groups were balanced for dominance (equal split of high and low ranked cows).
A randomised block design (non-bias to DR) was used to assess the effect of two feed treatment rations on group exclusion from feed using a VF. Lucerne cubes (Multicube; dry matter 88%, crude protein 18%, metabolisable energy 9.1 MJ/kg DM, Yarrawonga, Victoria) were used as both the feed in the exclusion zone, and the ration for the cows. The restricted ration (R) was allocated individually for each cow based on their liveweight-derived energy required to maintain body condition (average 12 ± 0.3 kg, ranging from 10 to 14 kg per cow per day). The above maintenance (+M) ration was allocated above the maximum maintenance requirement (20 kg per cow per day). The rations were designed to emulate differing amounts of feed that dairy cows may be allocated in their production lifetime due to their age or stage of lactation (Holmes et al., 2002a). The R ration was chosen based on the restricted allocation of pasture for non-lactating herds (dry cows) in the Australian dairy industry. The +M ration was included to represent a satiated cow. A pilot study prior to experimental work found that dry cows offered 20 kg of lucerne cubes were unable to consume the total amount within the feeding time (7 h). Each cow was fed individually in a feed pen, as described below, and all calculations were based on the MJ energy requirement per day, as determined by the formula (Corbett et al., 1987):
including additional MJ ME requirement for stage of pregnancy (ARC, 1980; Moran, 2005).
Three test paddocks (100 × 20 m, Figure 1) were used to evaluate the exclusion of cows from feed in a controlled environment. Each test used one of the three test paddocks. Six coloured feed buckets (60 L, 40 × 400 × 370 mm) containing 2 kg of lucerne cubes per bucket were used as feed, placed in the exclusion zone at the end of the test paddocks (Figure 1). One bucket per cow was allocated to minimise the impact of dominance on access to feed. Cows were housed in the home pen outside of training, habituation and testing (Figure 1), which was mowed to prevent any additional feed consumption.
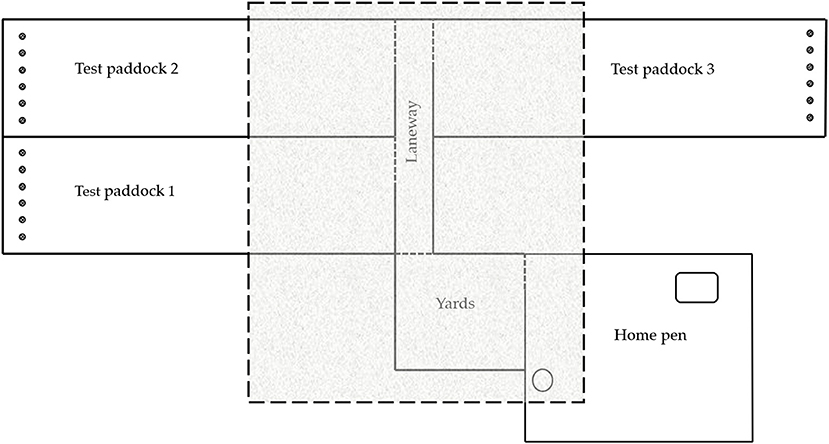
Figure 1. Diagrammatic representation (not to scale) of the experimental site used in all three blocks, similarity seen in Colusso et al. (2020). The experimental design consisted of a mowed home pen where the animals were housed outside of training and testing. Each day of testing the cows were moved from the home pen to the yards, and a virtual fence (VF) was activated (shaded area). For testing, a treatment group was moved from the yards along the laneway and through the access gate into a test paddock. Test paddocks were randomly alternated across tests for each block. Test paddocks 100 × 20 m contained lucerne cube feed in six buckets that were placed at the end of the paddock (60 m from VF). The test paddocks were mowed to prevent grazing during testing. The VF was positioned 30 m from the start of each test paddock.  = lucerne cube feed.
  = VF and inclusion zone.
  = Gate.
  = Shade.
  = water.
Virtual Fence Neckbands and Training Protocol
Pre-commercial prototype neckbands (eShepherd™, Agersens Pty Ltd., Melbourne, VIC, Australia) which have been previously described in similar studies (Campbell et al., 2017; Lomax et al., 2019; Colusso et al., 2020) were used in this experiment. Briefly, the VF experimental prototype neckbands consisted of a strap with a counterweight (total weight ~1.4 kg) and an electronic unit (~725 g and 17 cm L × 12 cm W × 13 cm H) positioned on the top of each animal's neck, with two electrodes that contact the skin on the right side of the neck. The VF neckbands use a GNSS within the unit to monitor cow movement and provided real-time data on cow location, heading and speed. A VF boundary separating the inclusion from the exclusion zones, specified using GNSS coordinates, was transmitted to the unit using a radio frequency link. As the animal reached the VF boundary, the unit emitted a distinctive AT within the cow's hearing range (values are commercial in confidence). If the cow remained at that location or turned away, no EP was emitted. If the animal continued to move through the VF boundary into the exclusion zone, the unit delivered a short, sharp pulse in the kilovolt range (values are commercial in confidence). This sequence of an AT followed by the EP was repeated if the animal continued through the VF and into the “exclusion zone.” The date, time, GNSS location and “event” which included where the cow was located, concerning the inclusion zone and details of stimuli delivery, were recorded for later download from the unit.
All cows were naïve to the VF neckbands and stimuli before the experiment. On the first day of each block, whilst restrained in a cattle crush cows were weighed (Gallagher G02601 TWI weigh scale, Gallagher Group Ltd, Hamilton, New Zealand) and spray marked with numbers on each side of the flank for identification purposes (Tell tail, GEA Fil Ltd, Mount Maunganui, New Zealand). During this time, each cow was fitted with their own inactive VF neckband. After fitting, the cows were released into a mowed “home pen” for 3 days to acclimate to the inactive neckbands (Figure 1). During the acclimation period, the cows were given ad libitum access to water and shade and offered a maintenance ration of lucerne hay (dry matter 89%, crude protein 16.4%, metabolizable energy 8.5 MJ ME/kg DM) as determined by above formula. On day four the cows were removed from the home pen for VF training. The cows were pre-trained to the VF system prior to VF testing in the test paddocks to ensure they had learnt the association of the paired stimuli.
Cows were trained to the VF system for 6 days in groups of n = 11–12 within each block, as per Lomax et al. (2019). Two, three-day pasture allocations of irrigated annual ryegrass were offered (Figure 2) at 3,000 kgDM/ha of ryegrass (Lomax et al., 2019). Cows were provided access to allocation A1 for 3 days after which time the VF was moved forward to offer A2, allowing the cows to graze both the residual of A1 and the fresh pasture in A2 for an additional 3 days. At the end of day six the VF neckbands were deactivated, and the cows were returned to the home pen.
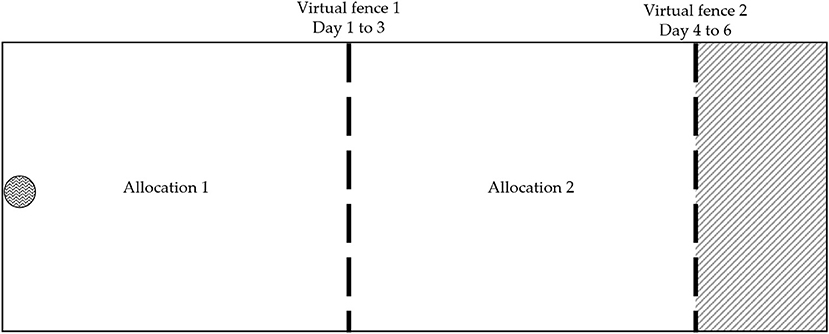
Figure 2. Diagrammatic representation (not to scale) of the training paddock used to train dairy cows in each block before experimental work, similarity seen in Lomax et al. (2019). The paddock was divided into three sections. Allocation one (A1) with the virtual fence (VF) 1 was allocated for days 1–3. At the end of day three the VF was moved forward to the VF 2 to allow dairy cows access to A1 and A2. The third section (grey shaded area) remained unallocated, as it was the exclusion zone for days 4–6. The water trough is indicated.  = Water.
  = Fixed fencing.
  = Virtual fence
  = Paddock not offered.
Animal Habituation to Experimental Design and Feed Treatments
After the VF training period, cows were allocated into their treatment ration groups (n = 5–6, as described in section Experimental Design and Animal Management) and trained to access the feed in the buckets at the end of each paddock between 0800 and 1100 h and again between 1300 and 1600 h each day for 20 min, alternating between test paddocks. The feed buckets were placed in identical locations in each of the test paddocks. Training continued for 2–3 days until all cows in each group walked unassisted to the feed, to ensure cows would participate in the testing and to avoid the requirement for observers to move cows during testing (Campbell et al., 2018b). During this time cows were also habituated to their feed rations. To ensure each cow consumed only their allocated ration, each cow was fed individually in customised pens (5 × 5 m, Figure 3). Each pen had shade, individual water and a bin that contained a feed bucket (60 L, 400 × 400 × 370 mm). Training to the pens involved first allowing all cows access to the open pens as a group (n = 11–12) for 4 h, repeated for 2 days. Shade, food (set at maintenance) and water were provided in the pen area to ensure cows habituated to the area and learned the location of resources. After this the cows were then trained to access the pen area from the cattle yards for an additional 2 days. This process involved releasing three cows together to walk from the cattle yards into individual pens and the fence closed behind them. After this the cows were then trained to access the pens on their own. Individual training continued for 3 days until each cow walked from the cattle yards into a pen and consumed their ration.
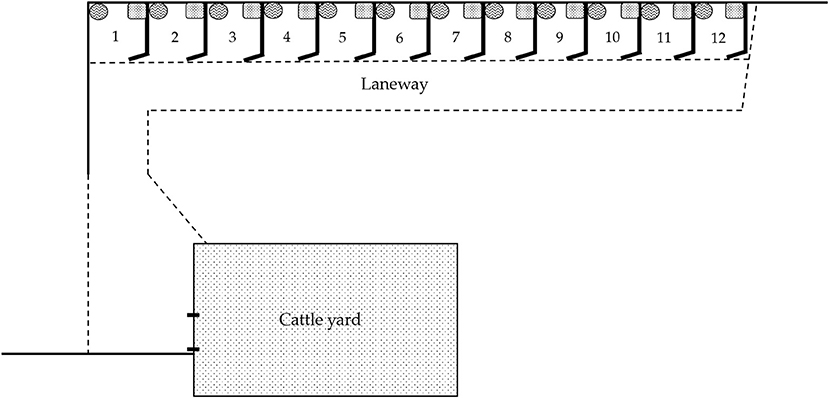
Figure 3. Diagrammatic representation (not to scale) of the feed pens used for feeding out rations. The feed pens 5 × 5 m were used to individually feed out rations. Pens 1–6 were assigned to the restricted cows. Pens 7–12 were assigned to the above maintenance cows. Pens consisted of individual water (60 L, 400 × 400 × 370 mm) and feed buckets of lucerne cubes (60 L, 400 × 400 × 370 mm). Shade was also provided over each pen (not shown in this figure). During feeding, the cows were individually moved from the cattle yards along the laneway and into their assigned feed pen (1–12) and closed in with the temporary fence. This was repeated until all cows were secured into their pens and eating. After feeding the temporary fence was removed, and all cows were walked back along the laneway into the cattle yards.  = Individual pen.
  = Water.
  = Feed bin.
  = Temporary fence.
  = Fixed fence.
  = Gate opening.
Every cow was assigned a pen based on their treatment group and DR. The +M cows were positioned in the last six pens and the R cows in the first six pens (Figure 3). The order of cow placement was determined by the DR to ensure cows were placed next to similar ranked animals to prevent unwanted dominance influencing the feeding periods. The consistency of set pens allowed the cows to learn their pen location and walk unassisted from the cattle yards into their pen for feeding. Additionally, the feed buckets were also assigned and labelled with cow ID for consistency and accurate feeding out of rations. After training was complete, cows were offered their designated rations for 3 days before the VF testing to ensure cows were both appropriately transitioned, and their gut fill represented their ration.
Virtual Fence Testing
Dairy cow exclusion from feed was evaluated across four tests for 30 min each. The tests were conducted over 3 consecutive days, which was repeated for all treatment groups (2 × n = 5–6), per block. On each day of VF testing the cows were moved from the home pen to the cattle yards and divided into their treatment groups based on their number identifiers between 0700 and 0800 h. The groups were then placed into their ration feed pens and offered their morning allocation from 0800 to 1100 h (Table 1). In the morning (AM) ration feeding, the R cows were given 4 kg (<40% ± 0.6) of their daily allocation and the +M cows were given their total daily ration of 20 kg (100%), to ensure at the time of testing their gut fill was reflective of their treatment group.
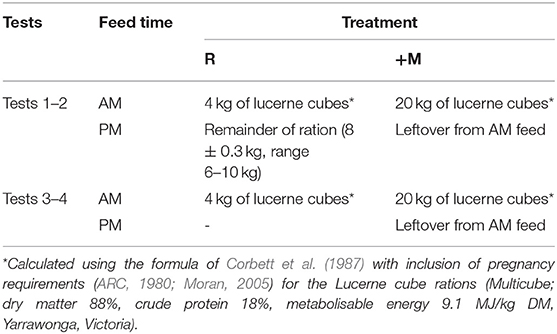
Table 1. The feed ration schedule for cows in the restricted (R) and above maintenance (+M) treatment groups per day for tests 1–4.
After the AM ration the cows were returned to the cattle yards. The VF neckbands were activated between 1100 and 1200 h, up to 30 min before testing. During this time the cows remained in the cattle yards, contained within the inclusion zone (Figure 1) to avoid VF stimuli delivery. One of the 3 test paddocks was then randomly selected (choosing a number out of a bag, 1–3) to ensure all paddocks were used, and the VF boundary activated using the online user interface (eShepherd®, Agersens, Melbourne, VIC, Australia). The VF was set 30 m from the paddock entry and the feed was placed in buckets at the end of the paddock, ~90 m from entry point for each paddock. The VF distance provided adequate space and time for the cows to receive and respond to VF stimuli when interacting with the VF and/or attempting to access the feed. For testing, the R treatment group were released from the cattle yards first and walked to the relevant test paddock, while the +M remained in the cattle yards during this time. The cows remained in the test paddock for a total of 30 min to provide time for cows to choose to approach the feed, or not (Figure 1). During the test session, visual observations of cows interacting with the VF (reaching the known location mapped out before every test with a non-test neckband), accessing the feed (defined as being within 5 m of the feed, including eating the feed), and/or returning to the inclusion zone were recorded as binomial data (yes = 1, no = 0). Four video cameras (Sony HDR-AS300 action cam) were used to record the general behaviour and response of cows during each 30 min test period for later review. One observer blind to the treatment groups reviewed the footage and recorded behaviour and location of each cow at 1 min intervals over the 30 min test period, this was repeated for every treatment group, test and block. Behaviour was recorded using an ethogram (Table 2) and a location description (Table 3).
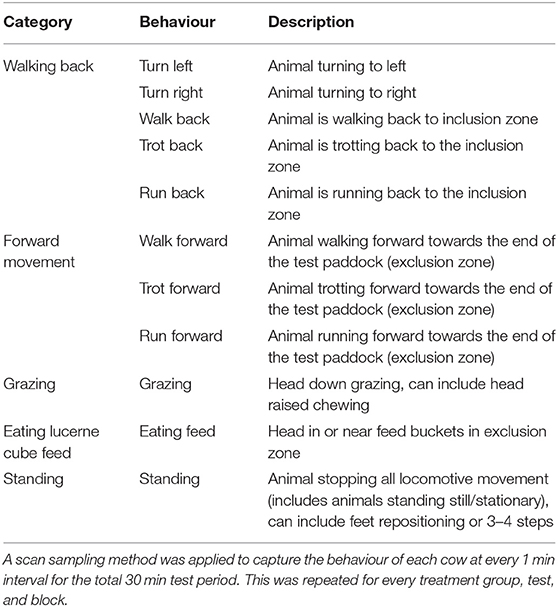
Table 2. The ethogram used to describe the behavioural responses during the VF testing.
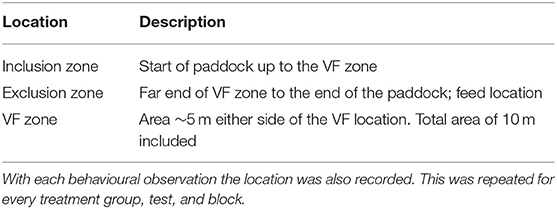
Table 3. The location description used during the behavioural observations.
After 30 min, the test session concluded, and an observer would enter the paddock and walk the cows back to the cattle yards. Cows did not receive stimuli when walking towards the yards, away from the exclusion zone. This was then repeated for the +M group. Once the two treatment groups were tested and returned to the yards the VF was deactivated. Cows remained in the cattle yards during the VF deactivation and during the setup of the ration pens for the PM feed. The remaining ration for the R group was placed in their feed pens and all water was topped up. All cows were then walked individually back into their pens and were left to consume the remainder of their ration for 4 h. After the PM ration the cows were then returned to the home pen overnight (Figure 1) and the pens were setup for the next day by refilling water, collecting feed bins, and then weighing out for the next day's ration. This method was repeated every day.
Tests 1 and 2 were conducted over two consecutive days, whilst Test 3 and 4 were conducted on the same day with a 2 h break period in between (Table 1). After Test 3 the R cows remained in the cattle yards with water and the +M cows were walked back into their pens and allowed to consume their ration. After the 2 h period the cows were tested using the same methodology as above. Tests 3 and 4 were conducted on the same day as the commercial cows in Block 1 required to return to the dairy and thus this was repeated in the remaining Blocks for continuity.
Virtual Fence Neckband Data Collection and Processing
Date and time stamped GNSS location and stimuli details (AT and EP) were downloaded from the neckbands for each individual cow after the 6-day training period and then again after Test 4. The process involved removing the VF neckbands in the cattle crush to access the SD card. The SD card produced a logged text file which was converted to a readable Excel® file (version 1908, 2016). This download process was repeated in every block. The VF neckbands logged a GNSS location and stimuli details (delivery of stimuli or not) for every second time point. There can be missing second to minute time points for animals as the data recording prioritises animal movement and closer proximity to the VF, which can alter the frequency of data logging outside of stimuli delivery. However, all stimuli data was captured for every cow. Stimuli data were then filtered from the Excel® file (version 1908, 2016) and stacked by block, cow and treatment (version 1908, 2016). The stacked data were categorised by stimuli and collated into a total count of AT and EP for each cow per test. The proportion of EP to AT was calculated by dividing the total number of electrical pulses (EP) by the total number of audio tones (AT) delivered to each cow per test, which can then presented as a percentage of audio tones that required an electrical pulse.
Statistical Analyses
Statistical analyses were conducted in RStudio© (v1.2.5019) (Rstudio, 2020), an integrated development environment for R (v4.0.2) (R Core Team, 2020). Stimuli data consisted of count data that were analysed using two generalised linear mixed models using the “MASS” package (Venables and Ripley, 2002). Negative binomial models were used to account for overdispersion of the data. The outcome variables were (1) AT count and (2) EP count. For both models the fixed effects were Treatment (Restrictive and above maintenance) and Test (Tests 1–4) with two-way biological interactions tested. Both GLMM's contained a nested random effect of Block and Cow ID (1|Block/Cow ID) to control for repeated measures from the same individuals and blocks. Model residuals were graphically inspected using the “DHARMa” package (Hartig, 2021), and overdispersion was checked using the dispersion function in “lme4” (Bates et al., 2015). The proportion of EP to AT was log-transformed (e/0.1) for normal distribution and analysed with a linear mixed model (LMM) with Block and Cow ID (1|Block/Cow ID) as a nested random effect. A two-way biological interaction between Treatment (Restrictive and above maintenance) and Test (Tests 1–4) was tested.
The final models for stimuli and proportion data were chosen based on likelihood-ratio χ2 tests of significance, that compared the interaction and non-interactions models. The final model was chosen based on the significance of the comparison, in conjunction with a lower Akaike's information criterion [AIC (Akaike, 1974)]. Post-hoc analyses were conducted using the “emmeans” package (Lenth, 2021) with results presented on the back-transformed scale (estimated marginal means +/- standard error). The confidence intervals are presented at 95%. Statistical tendencies were considered for P-values between 0.05 and 0.1. The behavioural observations were tabulated, and the observational data presented as descriptive summary statistics.
Results
Neckband Stimuli Data
There was an interaction between Treatment and Test for AT delivery (P = 0.01). The R cows received more AT's in Test 1 (P = 0.03) and 2 (P < 0.01), as compared to the +M cows (Table 4). There was no difference in the number of AT's delivered to +M cows between tests. R cows received more AT's in Test 1 compared to Test 3 (P = 0.05) and 4 (P < 0.01), and more in Test 2 compared to Test 3 (P = 0.01) and 4 (P < 0.01).
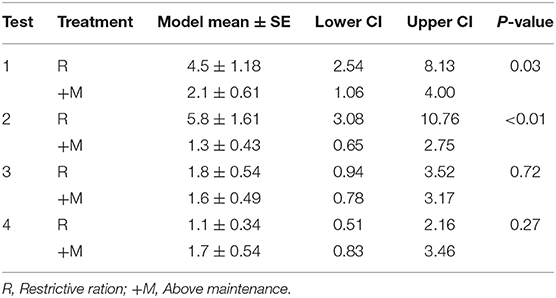
Table 4. The model means of the audio tone (AT) ± standard error of mean (SE), upper and lower confidence interval (CI), and P-value of cows within Treatment across Tests.
There was an interaction between Treatment and Test for EP delivery (P = <0.01). The R cows received more EP's in Test 1 (P = 0.02) and 2 (P = <0.01) than +M cows (Table 5). There was a statistical tendency for +M cows to receive more EP's in test 4. There was no difference in the number of EP's delivered to +M cows between Tests. The R cows received more EP's in Test 1 compared to 3 (P = 0.02) and 4 (P = 0.01) and Test 2 compared to 3 (P = 0.01) and 4 (P = 0.01).
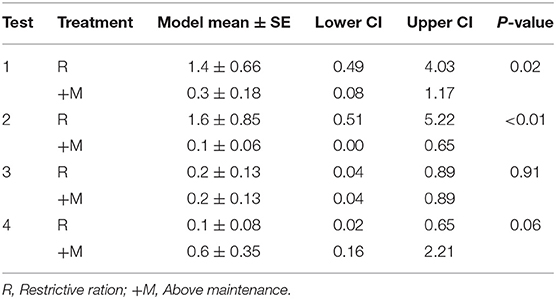
Table 5. The model means of the electrical pulse (EP) ± standard error of mean (SE), upper and lower confidence intervals (CI), and P-value of cows within Treatment across Tests.
There was an interaction between Treatment and Test for the proportion of EP to AT delivered (P = 0.01). The R cows received more EP to AT than +M cows in Test 1 (P = 0.01) and there was a statistical tendency in Test 2 (P = 0.06, Table 6). There was no difference between tests for +M cows. The R cows received greater EP to AT in Test 1 compared to Tests 3 (P < 0.01) and 4 (P < 0.01).
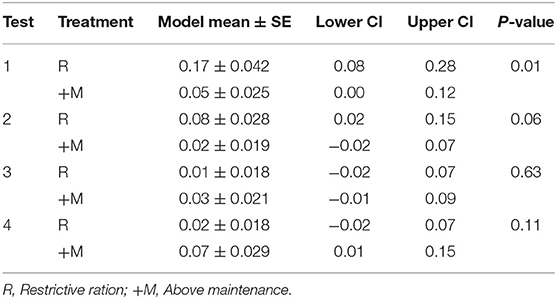
Table 6. The model means of the proportion of EP to AT (EP:AT) between Treatment by Test ± standard error of mean (SE), upper and lower confidence intervals (CI), and P-value of cows within Treatment across Tests.
Live Observations
The live observations were conducted for the number of cows that “Interacted with the VF,” “Accessed the feed,” and “Returned to the inclusion zone” and have been presented as descriptive statistics. From the total of 136 possible live observations (34 cows × 4 tests = 136) there were 11 events (11/136*100 = 8%) where a cow accessed the feed. This was a result of nine cows from the R treatment (six within block 1 and five in block 3), that accessed the feed across tests 1–3. There were two R cows (within block 1 and 3) that accessed the feed in two separate tests. No +M cows accessed the feed. Every cow that interacted with the VF returned to the inclusion zone unassisted.
Behavioural Observations
Grazing was the most common behaviour displayed within the inclusion zone and VF zones (Table 7). Grazing and standing mostly occurred within the inclusion zone, reflecting time spent within this area, though this was not empirically measured. The behaviour of forward movement for R cows was observed in all locations including the VF and exclusion zone areas, whereas the forward movement for +M cows was only observed within the inclusion zone. Additionally, only R cows were observed eating the feed (Table 7). All cows that either interacted with the VF and/or accessed the feed returned to the inclusion zone during the test period, reflective of the walking back behaviours within the exclusion zone and VF zone (Table 7).
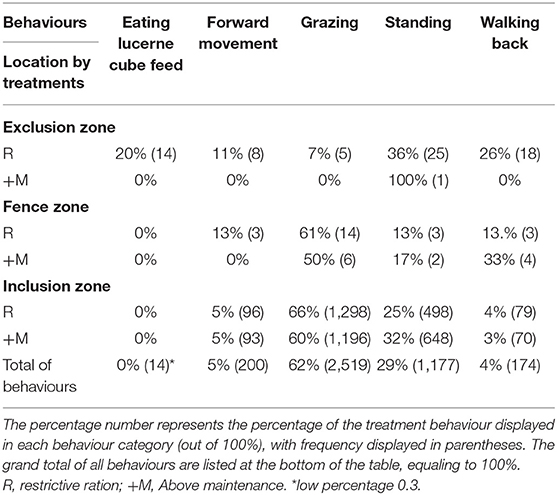
Table 7. Summary behaviour of cows within Treatments during VF testing.
Discussion
This experiment is the first to compare animal exclusion and VF system performance when levels of feed offered are restricted to maintenance from above maintenance levels. Dairy cows offered a restricted ration received more stimuli indicating increased motivation to cross the VF and reach the feed. However, this reduced across tests as cows learnt the location of the fence within the paddock and the experimental routine. Across all tests, cows were maintained within the inclusion zone as seen in the live and behavioural observations, demonstrating the importance of training.
Only cows offered a restricted ration (R) broke through the VF to access the feed, and therefore received more stimuli in tests 1 and 2 as compared to cows offered above maintenance (+M) feed. Only 4 kg of feed was fed to the R cows before testing, as compared to 20 kg to the +M cows, therefore the restricted ration likely increased the motivation of individuals to tolerate VF stimuli to consume additional feed within the first two tests. Cows are able to consume 6–8 kg of DM in 2–3 h (Holmes et al., 2002a), so it is likely the +M cows were able consume more feed than R cows, making them more satiated. Feed restriction and feed deprivation have been shown to increase a cow's motivation to work for additional feed (Schütz et al., 2006; Cooper et al., 2010; Greter et al., 2015). High yielding dairy cows that have a greater metabolic demand, have been shown to work harder to consume more of a grain concentrate feed reward in operant conditioning push-lever experiment, as compared to low-yielding cows with a lower metabolic demand (Cooper et al., 2010). Similarly, lactating dairy cows were willing to walk greater distances to access feed as compared to non-lactating cows after feed deprivation (Schütz et al., 2006), and limit-fed dairy heifers pushed heavier weighted levers to access additional feed after feed deprivation as compared to those fed ad libitum (Greter et al., 2015). Only R cows were observed continuing forward movement into the VF and exclusion zones, towards the feed. To access the feed, cows had to walk 60 m past the VF into the exclusion zone, which resulted in increased stimuli. On pasture the fresh allocation would be available at the VF line rather than further into the exclusion zone which may result in less stimuli delivered to grazing dairy cows when accessing additional feed. However, this could result in cows consuming more of the fresh allocation than in conventional fencing systems, as a VF cannot completely eliminate cows entering the exclusion zone compared to standard electric fencing (Langworthy et al., 2020). Grazing was the most commonly displayed behaviour by all cows across the experiment despite the test paddocks being continually mowed. The display of this behaviour regardless of feed treatment, even with minimal pasture availability, highlights the strong motivation of dairy cows to graze (Von Keyserlingk et al., 2017; Franchi et al., 2019). Future work should therefore evaluate the effect of feed restriction and motivation on the exclusion of cows from fresh pasture.
Stimuli reduced significantly in tests 3 and 4, with no difference in the number of AT's or proportion of EP to AT delivered to R and +M cows. This is because R cows made less attempts to reach the feed and increasingly remained within the inclusion zone after test 2. There was an average of 12 days between training and testing, and cows were trained to the VF system on a separate paddock than the testing was conducted. Therefore, we propose that cows required the time period across tests 1 and 2 (60 min in total) to re-learn where the VF was and recall the association between the AT and EP due to the change in context. An experiment evaluating how beef heifers responded to a moving VF reported that cattle took on average 4.25 h to learn where a new VF was located within a 6.15 ha paddock (Campbell et al., 2017), as compared to ~60 min in the 2,000 m2 test paddocks.
Dairy cows can learn routines and schedules surrounding feeding and milking (Jago and Kerrisk, 2011). By test 3 the R cows likely learned that feed was delivered upon conclusion of testing, which prevented them from attempting to access the feed. Above maintenance fed cows had a tendency to receive more EP's than R cows in test 4, however, there was no within treatment difference across tests and this tendency was not reflected in the proportion of EP to AT delivered. All +M cows were successfully excluded from the feed with none accessing it in any test. Cows were able to learn the location of the VF within the paddocks and remain within the inclusion zone after the two test periods even with restricted feed.
This experiment demonstrates the feasibility of keeping dairy cows contained within an inclusion zone using a virtual fence. The cows in this experiment remained within the VF area for majority of the observation periods, with only 11 total occurrences of VF breakthroughs, in addition to a greater frequency of behaviours observed within the inclusion zone. Similarly, in other VF studies beef cattle spent 97% of the time within an inclusion zone (Campbell et al., 2017), and non-lactating (Lomax et al., 2019) and lactating (Langworthy et al., 2020) dairy cows spent 99% of the time. In the current experiment, the proportion of AT that required an EP was ≤ 17% across the experiment, indicating the retention of associative learning from the training period. This is low compared to 49% in beef cattle after an initial learning period when contained from a feed attractant (Campbell et al., 2018b), and similar to dairy cows that received 14% paired stimuli after training in a feed attractant experiment (Colusso et al., 2020). Of all possible occurrences, only 8% resulted in cow(s) accessing the feed, all within the R treatment. Additionally, the nine cows that accessed the feed were in blocks 1 and 3, and within that two cows did so during two separate tests. The lack of cows accessing the feed in Block 2 further demonstrates the importance of individuality when evaluating response to VF systems (Campbell et al., 2018b; Lomax et al., 2019; Keshavarzi et al., 2020). Anecdotally we observed that some individual cows would not break through the VF unless they observed another cow doing so. Cattle are a gregarious species and thus the effect of social observation and facilitation on response to VF stimuli may have contributed to the VF break throughs. Similar differences in the individual response of beef cattle within groups has been reported (Keshavarzi et al., 2020). These socially influenced responses have been observed in other feed attractant studies (Campbell et al., 2018b; Colusso et al., 2020), indicating a strong “pull-push” dynamic between leader and follower cows. This complex relationship between individual cows in a group setting could have an impact on containment as key individuals may influence the group, resulting in occurrences of break throughs. Alternatively, there is a potential to use the strong social relationships to improve the VF training methods and overall application of the technology to ensure greater herd response to VF stimuli.
Conclusions
We have demonstrated that cows fed a restricted ration were more motivated to break through a VF to reach feed as compared to those fed an above maintenance ration. However, this effect was only evident in the first half of the experiment, with restricted cows increasingly remaining within the inclusion zone. This can be attributed to the cows requiring re- training to understand and adapt their response to stimuli delivery in the test context. It is evident that training reduced the number of electrical pulses delivered, and thus highlights the importance of training prior to application on farm. Future research will need to evaluate feed restriction in a grazing scenario to account for the natural foraging behaviour of cattle. In addition, evaluation of the effect of different motivational states (e.g., social motivation) on VF response will further inform operational used on farm settings.
Data Availability Statement
The raw data supporting the conclusions of this article will be made available by the authors, without undue reservation.
Ethics Statement
The animal study was reviewed and approved by University of Sydney Animal Ethics Committees (AEC).
Author Contributions
CC, SL, and PC: conceptualization and methodology. PC and AG: formal analysis. PC and SL: data curation. PC: writing—original draft preparation. SL: project administration. CC: funding acquisition. All authors writing—review and editing and read and agreed to the published version of the manuscript.
Funding
This research was funded by the Australian Commonwealth Government through their Department of Agriculture, Water and Environment as part of its Rural R&D for Profit program (Grant no: RnD4Profit-15-02-019).
Conflict of Interest
The authors declare that the research was conducted in the absence of any commercial or financial relationships that could be construed as a potential conflict of interest.
Publisher's Note
All claims expressed in this article are solely those of the authors and do not necessarily represent those of their affiliated organizations, or those of the publisher, the editors and the reviewers. Any product that may be evaluated in this article, or claim that may be made by its manufacturer, is not guaranteed or endorsed by the publisher.
Acknowledgments
The authors acknowledge Andrew Carlyon for his assistance in reviewing video footage for the behavioural analysis. The authors would also like to thank the University of Sydney's undergraduate students who assisted in field work, cattle husbandry procedures, and data collection. Thank you to the farm staff at Mayfarm for their support provided during the experimental period. The authors would also like to acknowledge the technical assistance of Kathrin Schemann of the Sydney Informatics Hub, a core research facility of The University of Sydney.
References
Akaike, H. (1974). A new look at the statistical model identification. IEEE Trans. Automat. Contr. 19, 716–723. doi: 10.1109/TAC.1974.1100705
Anderson, D. M. (2007). Virtual fencing–past, present, and future. Rangeland J. 29, 65–78. doi: 10.1071/RJ06036
Anderson, D. M., Estell, R. E., Holechek, J. L., Ivey, S., and Smith, G. B. (2014). Virtual herding for flexible livestock management–a review. Rangeland J. 36, 205–221. doi: 10.1071/RJ13092
ARC (1980). The Nutrient Requirements of Ruminant Livestock: Technical Review by an Agricultural Research Council Working Party. Slough: Commonwealth Agricultural Bureaux.
Bates, D., Mächler, M., Bolker, B., and Walker, S. (2015). Fitting linear mixed-effects models using lme4. J Stat Softw, 67, 1–48. doi: 10.18637/jss.v067.i01
Bowen, D. W., and Brooks, R. J. (1978). Social organization of confined male collared lemmings (Dicrostonyx groenlandicus Traill). Anim. Behav. 26, 1126–1135. doi: 10.1016/0003-3472(78)90102-1
Campbell, D. L. M., Haynes, S. J., Lea, J. M., Farrer, W. J., and Lee, C. (2018a). Temporary exclusion of cattle from a Riparian zone using virtual fencing technology. Animals 9, 1–12. doi: 10.3390/ani9010005
Campbell, D. L. M., Lea, J. M., Farrer, W. J., Haynes, S. J., and Lee, C. (2017). Tech-savvy beef cattle? how heifers respond to moving virtual fence lines. Animals 7, 1–12. doi: 10.3390/ani7090072
Campbell, D. L. M., Lea, J. M., Haynes, S. J., Farrer, W. J., Leigh-Lancaster, C. J., and Lee, C. (2018b). Virtual fencing of cattle using an automated collar in a feed attractant trial. Appl. Anim. Behav. Sci. 200, 71–77. doi: 10.1016/j.applanim.2017.12.002
Chang-Fung-Martel, J., Harrison, M. T., Rawnsley, R., Smith, A. P., and Meinke, H. (2017). The impact of extreme climatic events on pasture-based dairy systems: a review. Crop Past. Sci. 68:1158. doi: 10.1071/CP16394
Clark, C. E. F., Farina, S. R., Garcia, S. C., Islam, M. R., Kerrisk, K. L., and Fulkerson, W. J. (2016). A comparison of conventional and automatic milking system pasture utilization and pre- and post-grazing pasture mass. Grass Forage Sci. 71, 153–159. doi: 10.1111/gfs.12171
Colusso, P. I., Clark, C. E. F., and Lomax, S. (2020). Should dairy cattle be trained to a virtual fence system as individuals or in groups? Animals (Basel) 10:1767. doi: 10.3390/ani10101767
Cooper, M. D., Arney, D. R., and Phillips, C. J. C. (2010). The motivation of high- and low-yielding dairy cows to obtain supplementary concentrate feed. J. Vet. Behav. 5, 75–81. doi: 10.1016/j.jveb.2009.09.045
Corbett, J. L., Freer, M., and Graham, N. M. (1987). A generalised equation to predict the varying maintenance metabolism of sheep and cattle. Energy Metab. Farm Anim. 32, 62–65.
Franchi, G. A., Herskin, M. S., and Jensen, M. B. (2019). Dairy cows fed a low energy diet before dry-off show signs of hunger despite ad libitum access. Sci. Rep. 9:16159. doi: 10.1038/s41598-019-51866-7
Greter, A. M., Miller-Cushon, E. K., McBride, B. W., Widowski, T. M., Duffield, T. F., and DeVries, T. J. (2015). Short communication: limit feeding affects behavior patterns and feeding motivation of dairy heifers. J. Dairy Sci. 98, 1248–1254. doi: 10.3168/jds.2014-8879
Hartig, F. (2021). DHARMa: Residual Diagnostics for Hierarchical (Multi-Level/Mixed) Regression Models. R package version 0.4.3. Available online at: https://CRAN.R-project.org/package=DHARMa
Holmes, C. W., Brookes, I. M., Garrick, D. J., Mackenzie, D. D. S., Parkinson, T. J., and Wilson, G. F. (2002a). Milk Production From Pasture. Palmerston North: Massey University, 53–68.
Holmes, C. W., Brookes, I. M., Garrick, D. J., Mackenzie, D. D. S., Parkinson, T. J., and Wilson, G. F. (2002b). Milk Production From Pasture. Palmerston North: Massey University, 91–118.
Jago, J., and Kerrisk, K. (2011). Training methods for introducing cows to a pasture-based automatic milking system. Appl. Anim. Behav. Sci. 131, 79–85. doi: 10.1016/j.applanim.2011.02.002
Kearton, T., Marini, D., Cowley, F., Belson, S., and Lee, C. (2019). The effect of virtual fencing stimuli on stress responses and behavior in sheep. Anim. Open Access J. MDPI 9:30. doi: 10.3390/ani9010030
Keshavarzi, H., Lee, C., Lea, J. M., and Campbell, D. L. M. (2020). Virtual fence responses are socially facilitated in beef cattle. Front. Vet. Sci. 7:543158. doi: 10.3389/fvets.2020.543158
Langworthy, A., Verdon, M., Freeman, M., Corkrey, R., Hills, J., and Rawnsley, R. (2020). Virtual fencing technology to intensively graze lactating dairy cattle I: technology efficacy and pasture utilisation. J. Dairy Sci. 104, 7071–7083. doi: 10.3168/jds.2020-19796
Lee, C., Henshall, J. M., Wark, T. J., Crossman, C. C., Reed, M. T., Brewer, H. G., et al. (2009). Associative learning by cattle to enable effective and ethical virtual fences. Appl. Anim. Behav. Sci. 119, 15–22. doi: 10.1016/j.applanim.2009.03.010
Lee, C., Prayaga, K., Reed, M., and Henshall, J. (2007). Methods of training cattle to avoid a location using electrical cues. Appl. Anim. Behav. Sci. 108, 229–238. doi: 10.1016/j.applanim.2006.12.003
Lenth, R. (2021). Estimated Marginal Means, aka Least-Squares Means. R package version 1.6.0. Available online at: https://CRAN.R-project.org/package=emmeans
Lindström, T., and Redbo, I. (2000). Effect of feeding duration and rumen fill on behaviour in dairy cows. Appl. Anim. Behav. Sci. 70, 83–97. doi: 10.1016/S0168-1591(00)00148-9
Lomax, S., Colusso, I. P., Gargulio, J., and Clark, C. E. F. (2017). “Determining learning and behavioural response to a virtual fence for dairy cows,” in European Conference on Precision Livestock Farming (Nantes).
Lomax, S., Colusso, P., and Clark, C. E. F. (2019). Does virtual fencing work for grazing dairy cattle? Animals 9:429. doi: 10.3390/ani9070429
Moran, J. (2005). Tropical Dairy Farming: Feeding Management for Small Holder Dairy Farmers in the Humid Tropics. Melbourne, VIC: Csiro Publishing.
R Core Team. (2020). R: A Language and Environment for Statistical Computing. Vienna: R Foundation for Statitical Computing.
Schütz, K., Davison, D., and Matthews, L. (2006). Do different levels of moderate feed deprivation in dairy cows affect feeding motivation? Appl. Anim. Behav. Sci. 101, 253–263. doi: 10.1016/j.applanim.2006.02.008
Toates, F. (2002). “Physiology, motivation, and the organization of behaviour,” in The Ethology of Domestic Animals: An Introductory Text, 3rd Edn, ed P. Jensen (Wallingford: CABI), 31–50.
Umstatter, C. (2011). The evolution of virtual fences: a review. Comput. Electron. Agric. 75, 10–22. doi: 10.1016/j.compag.2010.10.005
Venables, W. N., and Ripley, B. D. (2002). Modern Applied Statisitcs With S. New York, NY: Springer.
Keywords: virtual fence, audio tone, electrical pulse, dairy cattle, restricted, above maintenance, treatment
Citation: Colusso PI, Clark CEF, Green AC and Lomax S (2021) The Effect of a Restricted Feed Ration on Dairy Cow Response to Containment From Feed Using a Virtual Fence. Front. Anim. Sci. 2:710648. doi: 10.3389/fanim.2021.710648
Received: 17 May 2021; Accepted: 02 July 2021;
Published: 26 July 2021.
Edited by:
Suresh Neethirajan, Wageningen University and Research, NetherlandsReviewed by:
Bradley Heins, University of Minnesota Twin Cities, United StatesAnthony Waterhouse, Scotland's Rural College, United Kingdom
Copyright © 2021 Colusso, Clark, Green and Lomax. This is an open-access article distributed under the terms of the Creative Commons Attribution License (CC BY). The use, distribution or reproduction in other forums is permitted, provided the original author(s) and the copyright owner(s) are credited and that the original publication in this journal is cited, in accordance with accepted academic practice. No use, distribution or reproduction is permitted which does not comply with these terms.
*Correspondence: Patricia I. Colusso, cGF0cmljaWEuY29sdXNzb0BzeWRuZXkuZWR1LmF1