 Steffen Küster
 Philipp Nolte
 Cornelia Meckbach
 Bernd Stock
 Imke Traulsen
- 1Department of Animal Sciences, Georg-August-University, Göttingen, Germany
- 2Faculty of Engineering and Health, HAWK University of Applied Sciences and Arts, Göttingen, Germany
- 3Campus Institute Data Science, Georg-August-University, Göttingen, Germany
The monitoring of farm animals and the automatic recognition of deviant behavior have recently become increasingly important in farm animal science research and in practical agriculture. The aim of this study was to develop an approach to automatically predict behavior and posture of sows by using a 2D image-based deep neural network (DNN) for the detection and localization of relevant sow and pen features, followed by a hierarchical conditional statement based on human expert knowledge for behavior/posture classification. The automatic detection of sow body parts and pen equipment was trained using an object detection algorithm (YOLO V3). The algorithm achieved an Average Precision (AP) of 0.97 (straw rack), 0.97 (head), 0.95 (feeding trough), 0.86 (jute bag), 0.78 (tail), 0.75 (legs) and 0.66 (teats). The conditional statement, which classifies and automatically generates a posture or behavior of the sow under consideration of context, temporal and geometric values of the detected features, classified 59.6% of the postures (lying lateral, lying ventral, standing, sitting) and behaviors (interaction with pen equipment) correctly. In conclusion, the results indicate the potential of DNN toward automatic behavior classification from 2D videos as potential basis for an automatic farrowing monitoring system.
Introduction
The monitoring of farm animals and the automatic detection of abnormal behavior has recently gained considerable importance in farm animal science research. In practical agriculture it can be used, for example, as indicators of cycle-related hormonal changes (Widowski et al., 1990) or the occurrence of diseases (Weary et al., 2009). Compared to manual data collection, the advantage of automatic recording/sensor systems is that the documentation is continuous, objective and can lead to significant time and cost savings (Cornou and Kristensen, 2013). With the progressive development of machine learning methods, especially in digital image processing, the possibility of contactless, continuous monitoring of animals is emerging. Computer Vision (CV) algorithms allow monitoring of the entire visible body of an animal, are non-invasive, do not influence the animal and are theoretically not limited in their runtime (external power supply), (Brünger et al., 2020). If real-time processing is possible, the video data can be processed via live stream and do not have to be saved. The relevant data-output can be backed up to a small amount of storage, by saving as e.g., table. Such capabilities are consistent with most of the characteristics required for a sensor to assess animal welfare (Rushen et al., 2012) and have already ensured that several research approaches have been investigated using different camera systems and algorithms of varying complexity (examples are described in detail in the following passages). These approaches can be separated by different camera types (e.g., 2D images, 3D depth images), and different type of monitoring (e.g., single pigs with detailed behavioral observation (mainly sows) or multiple pigs and animal interactions).
For multiple pigs, Viazzi et al. (2014) developed a detection algorithm for aggressive behaviors among fattening pigs using intensity and specific pattern of movement recognized by 2D CV-algorithms. Nasirahmadi et al. (2019) developed a 2D CV and deep learning-based method to detect standing and lying posture of multiple pigs under varying conditions. Matthews et al. (2017) used 3D-data to detect basic behavior such as standing, feeding, and drinking with individual tracking among group-housed pigs for the purpose of getting information about individual animal health and welfare aspects. Approaches for single pigs can be found in the farrowing sector. E.g., the monitoring of the prenatal behavior of sows for the estimation of the onset of farrowing using natural given behavior deviations like nest-building and the varying amount of position changes before farrowing using 3D accelerometer or 2D pixel-movement (Pastell et al., 2016; Traulsen et al., 2018; Küster et al., 2020). More detailed approaches focused on inter birth interval and prevention of asphyxia as well as counting of piglets or the postpartum lying behavior of sows in regard to prevent piglet crushing and gathering information of nursing behavior from 2D-images (Yang et al., 2018) and 3D-depth images (Okinda et al., 2018; Zheng et al., 2018). Leonard et al. (2019) developed an accurate algorithm for sow postures like sitting, standing, kneeling and lying as well as behaviors, such as feeding and drinking using a 3D-depth threshold-based decision algorithm of crated sows body regions. Summarizing, most of the approaches addressing behavior or posture detection are using 3D cameras as data input.
With the objective of avoiding complex setups in practical production systems in mind, which are prone to errors but essential for high data transmission with 3D-cameras. The aim of this study was to determine, if behavior and posture of sows without farrowing crate during late pregnancy can be automatically detected by CV in 2D-images, acquired from a simpler, less error-prone surveillance system. The predicted postures/behaviors could be used, for example, to achieve breeding goals with regard to maternal behavior, to optimize birth management or to enable timely birth support for sows and piglets and decrease diseases and losses (Welp, 2014), as well as a better understanding of sow interactions with different pen environments/equipment without restrictions of a farrowing crate.
Materials and Methods
Video Material and Editing
The RGB-video material was recorded at the agriculture research farm Futterkamp of the Chamber of Agriculture of Schleswig-Holstein from April 2016 to January 2017 in a group-housing farrowing compartment. Each sow had her own pen [6.24 m2 (large version), 5.28 m2 (small version)] for farrowing (Figure 1) and first days of the suckling period. Before farrowing, all sows can freely move between the pen areas and the common area of the compartment until 3 days antepartum (a.p.) (for more information about the group-housing compartment see Grimberg-Henrici et al., 2019; Lange et al., 2020). The cameras (Axis M3024LVE) were placed as central as possible on one side of each pen (see Figure 1) and recorded 24/7 with IR-Light during night. The data of six cameras was stored on one Synology® network attached storage (NAS) with 8 TB storage space via Ethernet cable (25 m) connection with Power over Ethernet (PoE). Since the pens were reconstructed during data acquisition, there were two different designs for the piglet nest type and location in the farrowing pens (new and old, see Figure 1). The sows were not restrained and were able to move freely in the pen area during the whole time. Randomly chosen videos of eleven sows, 2 days before farrowing until the onset of farrowing, recorded with a resolution of 1,280 × 800 pixels and five frames per second, were used for training and evaluation in this study.
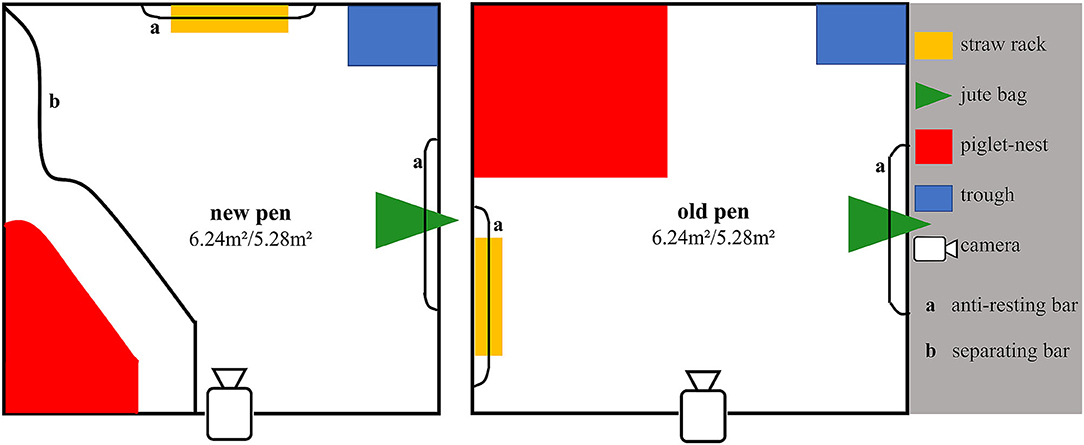
Figure 1. Schematic illustration of the camera installation for a new (left) and an old (right) design of the farrowing pens within a group farrowing compartment. Due to different size of compartments, the pens were 2.6 × 2.4 m (big) or 2.4 × 2.2 m (small). The white areas within a pen show the areas that are freely available to a sow.
Using a Python-script (Version 3.6), 1,500 images were randomly (uniform distribution) extracted from the previously defined subset (48 h a.p. until partum) out of the videos, containing 525 images with the new and 975 images with the old pen design. The relevant objects for posture detection (head, tail, legs, teats) and for interaction detection (head, trough, straw rack and jute bag) were annotated manually by two individuals in the form of rectangular “Bounding Boxes” (BB's) using the open source-tool “Ybat”1 (Figure 2). Since the annotation in form of rectangular BB's was difficult to carry out for large objects without marking a large part of the entire image, the classes jute bag and teats were annotated differently. The jute bag was annotated only on the top of the pen wall where it was attached. The teats were annotated in varying form or in several BB's, according to its appearance. After annotation, the data set was randomly divided into a training set 63% (945 images) and a test set 37% (555 images) based on the common 2/3 (training set) 1/3 (test set) split (Witten et al. 2011, p. 152). Detailed information about the dataset structure for YOLO training and evaluation can be found in Table 1. Note, that the classes jute bag and legs can occur more than once per image (Legs up to four and the jute bag up to two, because the bag of the neighbor pen was partly visible too).
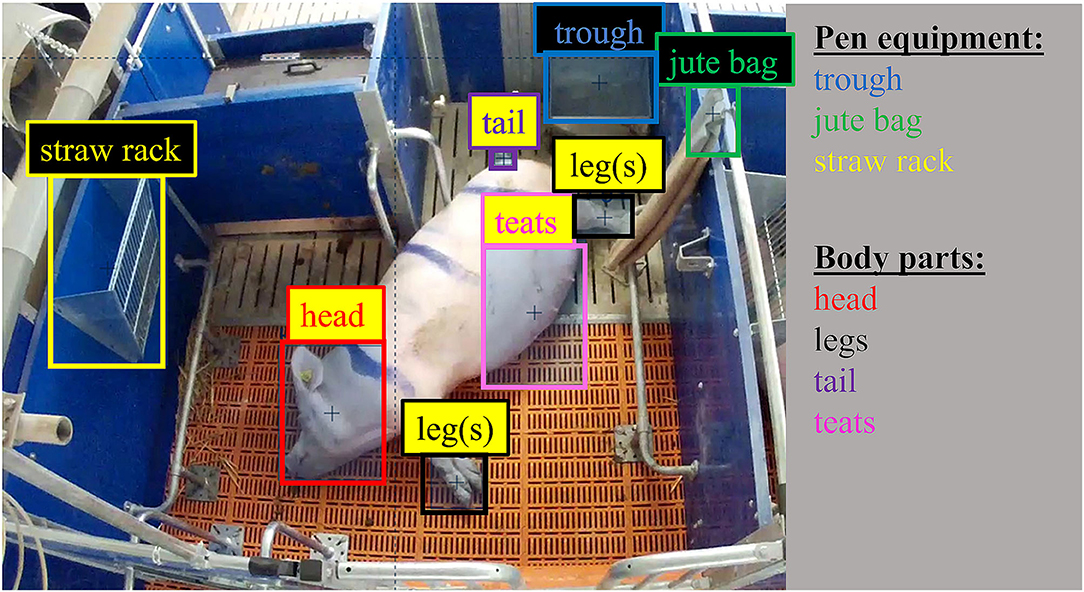
Figure 2. Example of an annotated image (old pen) from the data set with Ybat [Edited to highlight the annotated pen equipment (black background) and body parts of the sow (yellow background)].
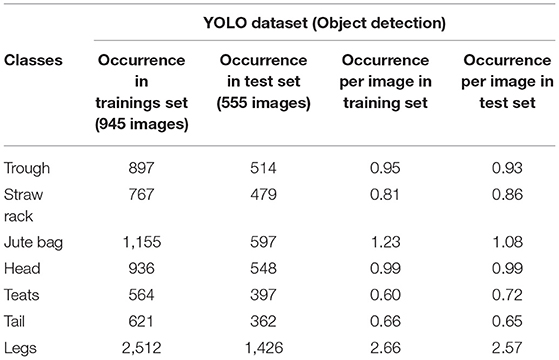
Table 1. Structure of the YOLO-datasets.
Training Object Detection
The annotated dataset was used without further conversions for the training process of the “You Only Look Once”-Version 3 (YOLO V3) object detection algorithm (Redmon et al., 2016). YOLO V3 was implemented using the Dark net framework (Redmon and Farhadi, 2018) via the Jupyter notebook development environment (Kluyver et al., 2016) on a computer with 11 GB GPU. Darknet-53 was used as backbone of the neural network and only the YOLO-Layers were fine-tuned with the present data.
As starting weights, pre-existing YOLO V3-weights2, which are pre-trained on the ImageNet-dataset3, were used. In total 14,000 iterations with a batch size of 64 were performed to fine-tune the weights for the given detection tasks. The learning rate was set to 0.001, after 11,200 iterations (80% of total iterations) and after 12,600 iterations (90%) the learning rate was multiplied by 0.1. The input images were down sampled to a resolution of 352 × 352 px. Following 1,000 iterations, the Average Precision (AP) and the F1-Score on the test set were automatically determined after every 500th iteration with an Intersection over Union (IoU) of ≥ 0.5 (Everingham et al., 2010) and a Class Confidence Score (YOLO V3 threshold) ≥ 0.5 for each class (Redmon et al., 2016) (see Figure 5). Formula for evaluation metrics can be found in Table 2.
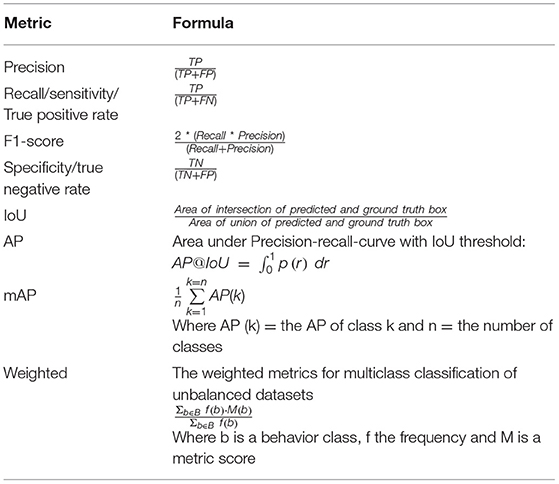
Table 2. Evaluation metrics (TP, true positive; FP, false positive; TN, true negative; FN, false negative).
Classification of an Interaction or a Posture
The posture or the behavior of a sow were classified inside the test set according to an ethogram, reflecting typical definitions for manual behavior observation (Table 3). Following these behavioral definitions with taking human expert knowledge into account, a hierarchical conditional statement was developed. Using the detected objects (body parts and pen equipment), their positions (pixel coordinates of the corresponding BB) recognized by the trained model (Section Training Object Detection), as well as their distance to each other, this statement was implemented inside a deterministic algorithm to assign a behavior or a body posture from the ethogram to each image. Behaviors involving interactions with the trough (eating/drinking) and interactions with jute bag or straw rack (nest-building behavior) are summarized as “interactions” since the number of images showing these behaviors is underrepresented in the data set due to the fact that sows are sitting or lying about 85–90% of the day (Lao et al., 2016). The algorithm can be subdivided into (i) the analysis of the pen environment (feeding trough, jute bag, straw rack) in relationship/distance (activation area) to the position of the head with the purpose to classify interactions (see Figure 3) and (ii) the distance of the sow body parts [teats, head, tail and leg(s)] to each other to classify a posture (see Figure 4). In its first step (i), the algorithm checks in hierarchical order (1. trough, 2. jute bag, 3. straw rack) if pen classes are detected, where they are and if the head is within the activation area. Note that the “feeding/drinking”-interaction is different, since the feeding trough is not visible, due to viewing angle, when the sow is feeding or drinking. Therefore, the path of the algorithm is triggered when no trough is detected and the head is next to the coordinates of the last detected trough (since the trough is fixed). If no interaction is classified, the second part of the algorithm (ii) loops, also in hierarchical order [1. teats, 2. head, 3. tail, 4. leg(s)], through the detected body parts. Every posture has several unique paths, which are triggered dependent on the composition of the other body parts (see Figure 4). At the end of each path, a posture is classified to the image. If YOLO V3 does not detect a body part, the image is classified as “Not classified.” The performance of this multiclass classification was evaluated using the metrics in Table 2.
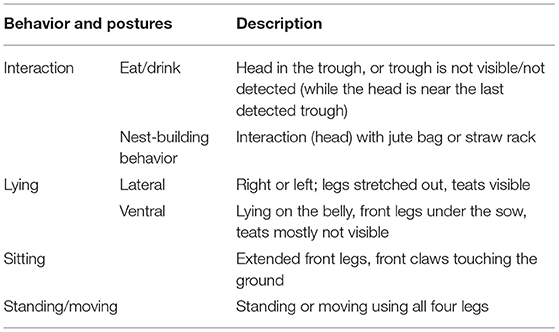
Table 3. Ethogram of sow behavior/postures based on the study by Baxter et al. (2011).
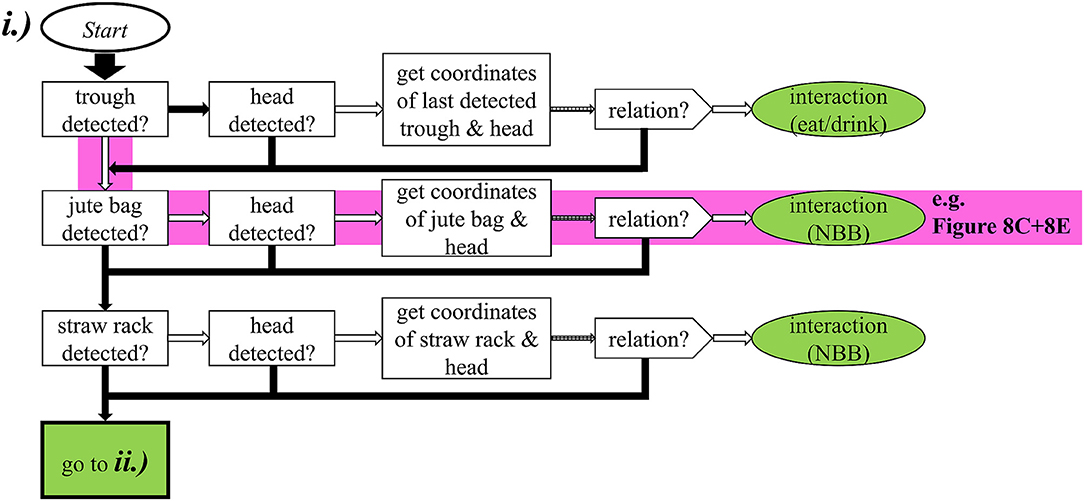
Figure 3. Illustration of the hierarchical conditional statement for classification of interactions (eating/drinking with the trough or nest-building-behavior (NBB) with jute bag or straw rack). White arrow means “yes,” black arrow “no” and striped arrows are highlighting calculation-/threshold-steps. The pink highlighted path is an example of the situations in Figure 8C (interaction with jute bag and Figure 8E (interaction with jute bag classified, although the sow is actually lying with a displaced jute bag).
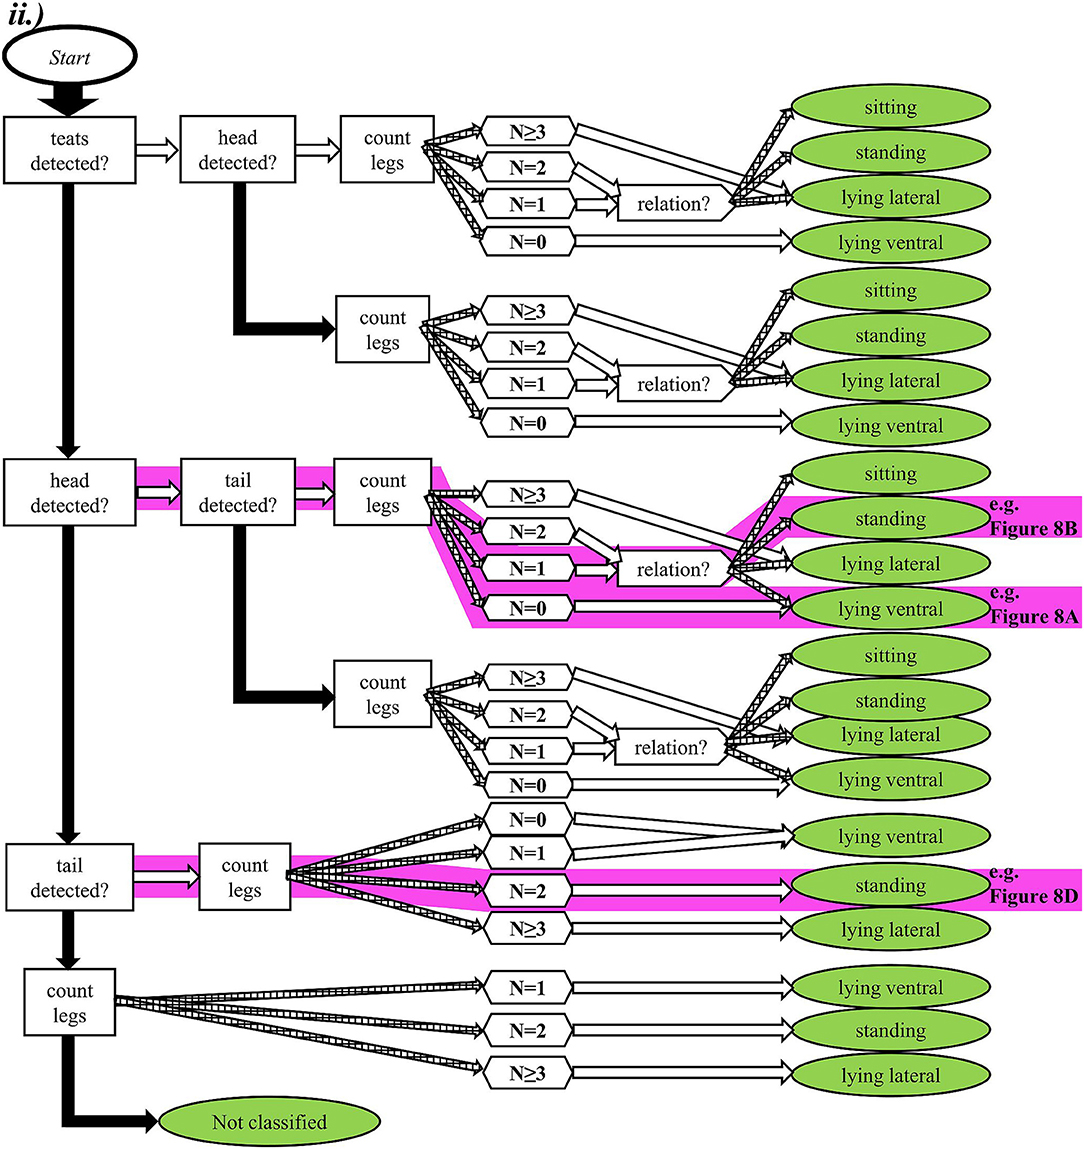
Figure 4. Illustration of the hierarchical conditional statement for the body posture classification of a sow. White arrow means “yes,” black arrow “no” and striped arrows are highlighting calculation-/threshold-steps. The algorithm can be separated in four different paths + “Not classified” with up to four side paths. The final classification of a body posture (lying lateral, lying ventral, sitting or standing) depends on the location of all detected features within a path. If there are no detected features, the body posture is set to “Not classified”. The pink highlighted paths are examples of the situations in Figure 8A (lying ventral classified, although the sow is actually standing), Figure 8B (standing with detected head) and Figure 8D (standing without detected head).
Evaluation of Video Sequences
For automatic evaluation of video sequences, the algorithm considers contextual, geometric and temporal relationships of successive images with consistent interval. In order to verify the resulting detection and deduct a qualified labeling of each image, we implemented plausibility checks. One verification method is to check for a reasonable number of detected classes and their geometrical context (e.g., Is there more than one head detected? If yes, determine which head has the closest proximity to the other detected features). After saving an interaction or a posture, the algorithm performs the other plausibility check using temporal threshold [a new posture/interaction needs to endure more than 2 s based on the defined duration of a drink nipple visit (Kashiha et al., 2013)]. If this threshold is not reached, the posture/interaction is deleted and the image gets the assignment accordingly to the last classification (Table 4 and Equation 1).
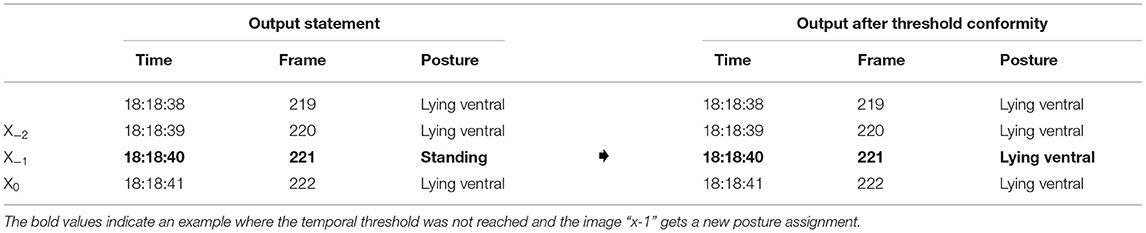
Table 4. Example temporal threshold (One frame per second analyzed).
Equation 1: Temporal threshold:
where X0 is the actual image and X−1 and X−2 are respectively previous and pre-previous images.
Results
In this section, we first show the results of the object detection (Section YOLO V3 Object Detection Algorithm) and afterwards the performance of the hierarchical conditional statement for sow behavior/posture classification (Section Behavior/Posture Classification). Additionally, we present the diurnal posture changes of one sow as an example for possible usage and evaluation (Section Diurnal Amount of Interactions and Postures Changes) as well as examples of situations where the algorithm struggles (Section Examples for Struggling Situations).
YOLO V3 Object Detection Algorithm
The accuracy of the detection of the trained classes (body parts and pen equipment) with YOLO V3, is given in the form of the Average Precision (AP), defined as the Area under Curve (AuC) of the recall-precision graph, evaluated on the test set (555 images). The mean Average Precision (mAP), which is the arithmetic mean of the AP from all classes, was 0.84. The pen equipment was detected with an AP of 0.97 (straw rack), 0.95 (feeding trough) and 0.86 (jute bag). The body parts show more diverse accuracy values ranging from 0.97 (head), 0.78 (tail), 0.75 (legs) to 0.66 (teats) (see Figure 5). The average intersection over Union (IoU) of all classes was improved from 0.59 to 0.69 and the average F1-Score of all classes, which represents the harmonic mean of precision and recall for all classes, was raised from 0.73 to 0.88 during the training process. An i7 CPU with 2.1 GHz needs in mean 2.57 s to predict the boxes and save them to a table for 1 frame on the test set.

Figure 5. The Average Precision (AP) of all trained classes in the YOLO V3 training/learning process with settings of intersection over Union (IoU) ≥ 0.5. After 14,000 iterations the classes straw rack, feeding trough and head are detected with an AP of 1.0–0.9. The classes jute bag and legs have an AP in the area of 0.89–0.7. Whereas, the class teats is the only class with an AP < 0.7.
Behavior/Posture Classification
The classification of posture/interaction of sows by the deterministic algorithm with implemented hierarchical conditional statement was evaluated on the test set (555 images), since we know the performance level of object detection for this data (Table 5). Multiclass classification metrics (Precision, Sensitivity (Recall/True Positive Rate), Specificity (True Negative Rate) and F1-Score) are given for postures: lying lateral, lying ventral, standing, sitting and behaviors summarized as interactions as well as no classification and a weighted metric score of all classes equal weighted based on their occurrence on the test set (Table 6). In total, the overall accuracy was 59.6% on the test set (Table 5). It is notable that the postures lying ventral, standing, and sitting account for over 80% of the total FP predictions of the algorithm, even though they make up only 30% of the data set (Table 5). These result are confirmed by the low values for Precision, Recall and F1-Score for these three classes (Table 6). An i7 CPU with 2.1 GHz needs on average 0.047 s for the classification step of one frame of the test set.
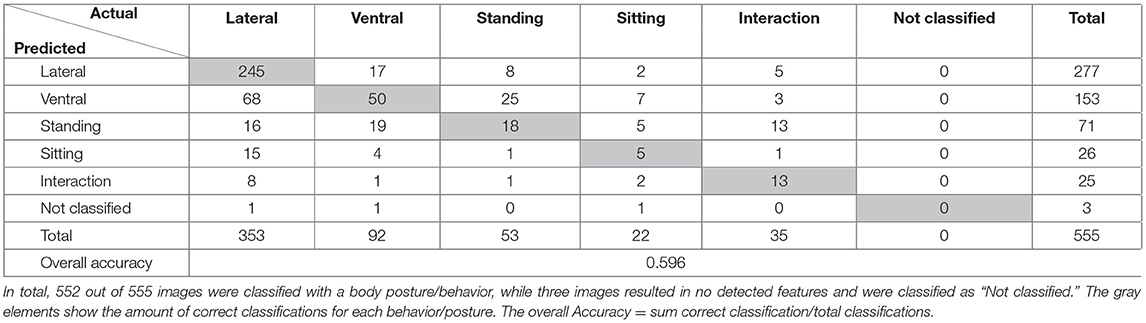
Table 5. Confusion matrix of the body posture/behavior classifications identified by the hierarchical conditional statement.
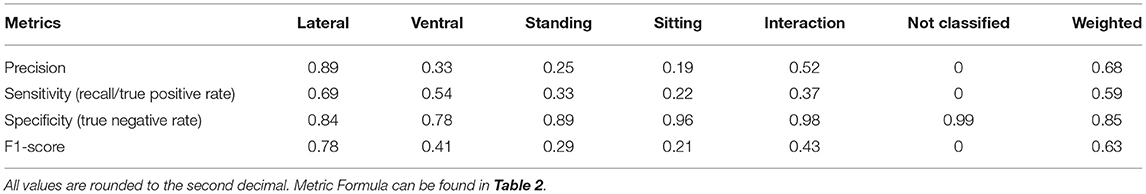
Table 6. Multiclass classification performance for body posture/behaviors.
Diurnal Amount of Interactions and Postures Changes
As an example, the mean amount in minutes per hour of postures/interactions of one sow for 48 consecutive hours (48 h a.p.–partum) was evaluated. One frame per second was analyzed and both plausibility checks (Section Evaluation of Video Sequences) were performed (Figure 6). During nighttime [46 h a.p.−36 h a.p. (8:15 p.m.−6:15 a.m.)] the sow spent most time lying lateral with low amount of changes. The interval from 36 h a.p.−32 h a.p. (6:15–10:15 a.m.) indicates feeding time, where the sow shows a high amount of standing and interactions (which includes interactions with the feeding trough) as well as a high amount of behavior/posture changes which indicates mobility and activity. The timespan from 32 h a.p.−22 h a.p. (10:15 a.m.−8:15 p.m.) shows resting time and an activity peak in the afternoon (4:15–6:15 p.m.). 22 h a.p.−10 h a.p. (8:15 p.m.−8:15 a.m.) indicates the second nighttime, where an influence of pre-farrowing behavior like nest-building and restlessness can be observed as an increase in changes per hour compared to the first night. From 10 h a.p.−6 h a.p. (8:15 a.m. −12:15 p.m.) the amount of changes and interactions continues to rise. Within the last 6 h before farrowing (12:15–6:15 p.m.) the amount of time spent with interactions decreases, which matches with results of other studies about pre-farrowing behavior of sows (Hartsock and Barczewski, 1997). Compared to the 1st daytime (34 h a.p.−22 h a.p.) the amount of standing and interactions rises while the amount of lying lateral decreases. Figure 7 shows the variation of posture and behavior changes per hour of the same sow in 8-h intervals with regard to daytime and time until farrowing. Especially the last 16 h before the onset of farrowing differ from the first 32 h with higher mean amount and lower variance between each hour within an interval.
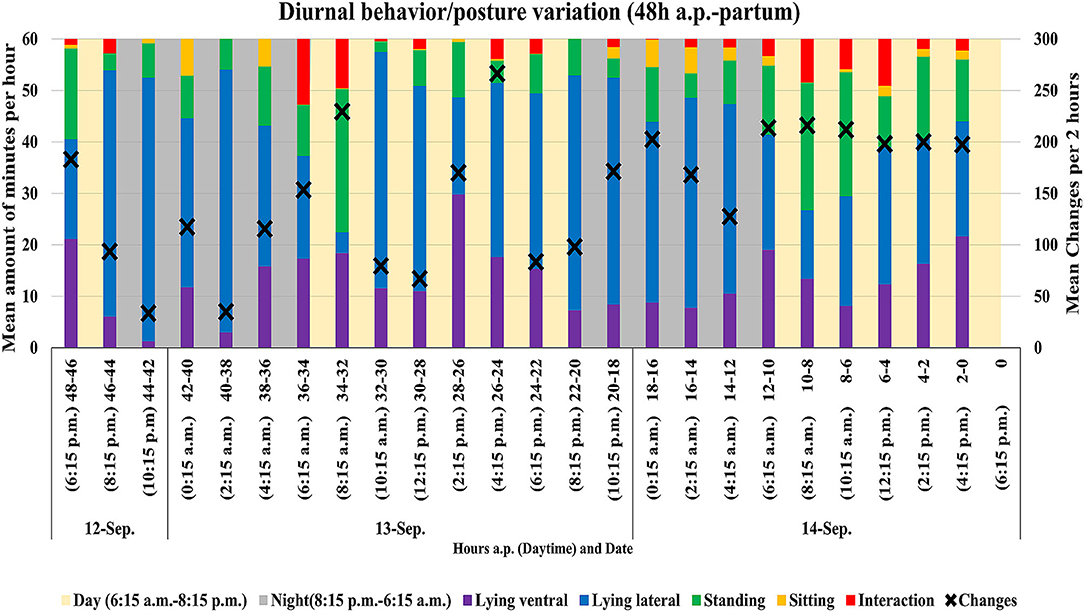
Figure 6. Demonstration of the varying amount (in min per hour) of behavior/posture (lying ventral, lying lateral, standing, sitting and interaction) in mean for 2 h intervals. The black crosses indicate the mean total amount of behavior/posture changes per 2 h. The yellow and gray colors between the intervals indicate day and night. One frame per second was analyzed. Note that zero indicates the birth of first piglet.
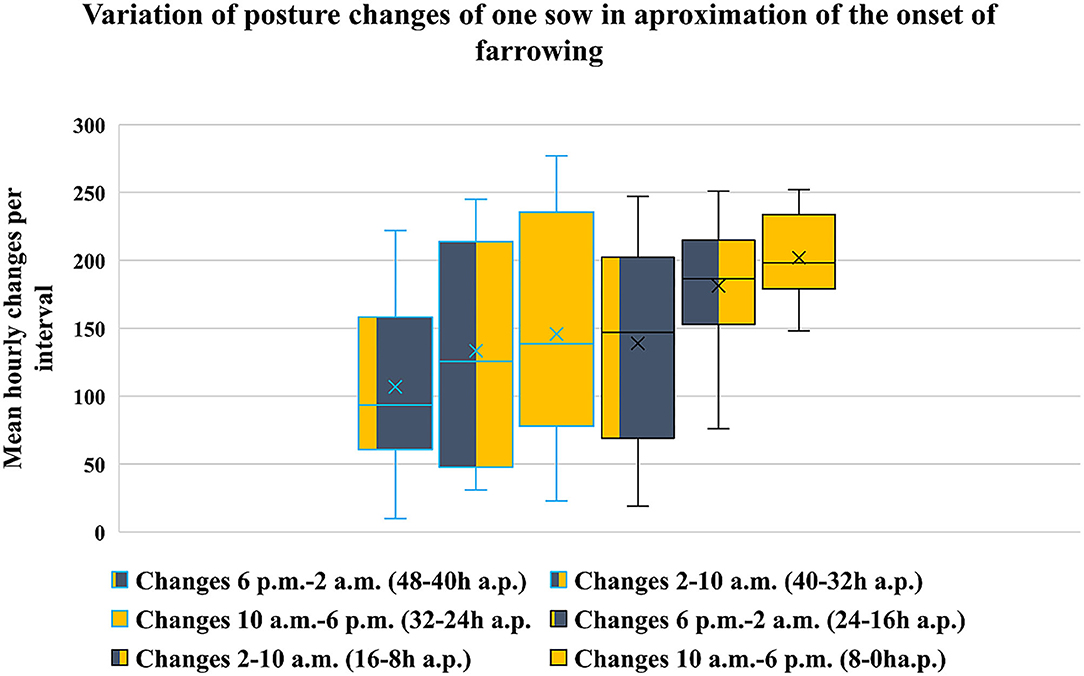
Figure 7. Variation of the mean hourly behavior/posture changes per 8-h interval with diverging time until farrowing. Blue bordered 48–24 h before farrowing and black bordered 24–0 h before farrowing. One frame per second was analyzed.
Examples for Struggling Situations
Figure 8 shows three examples of fail classifications due to struggling of feature detection (Figures 8A–D) or displacement of the normally fixed class jute bag (Figure 8E). Every time YOLO V3 does not detect all visible features in an image, the classification algorithm can struggle with the output for this image. Image A and B showing the same sow and consecutive frames. On both images, the sow is standing. On image A YOLO V3 fails to detect the left front leg of the sow, which results in a wrong posture classification (lying ventral). Image C and D are also showing the same sow and situation (nest-building-behavior/interaction in IR-mode vision). Because the head is not detected on image D. The posture is classified as standing, since the head is not in the activation area of the jute bag. Image E shows a situation where the algorithm detects and classifies correct, but the jute bag has fallen from the pen wall and changed its position. With the position change of the jute bag the regularities of the statement changed, which was not considered in the development and therefore results in a classification of an interaction while the sow is lying.
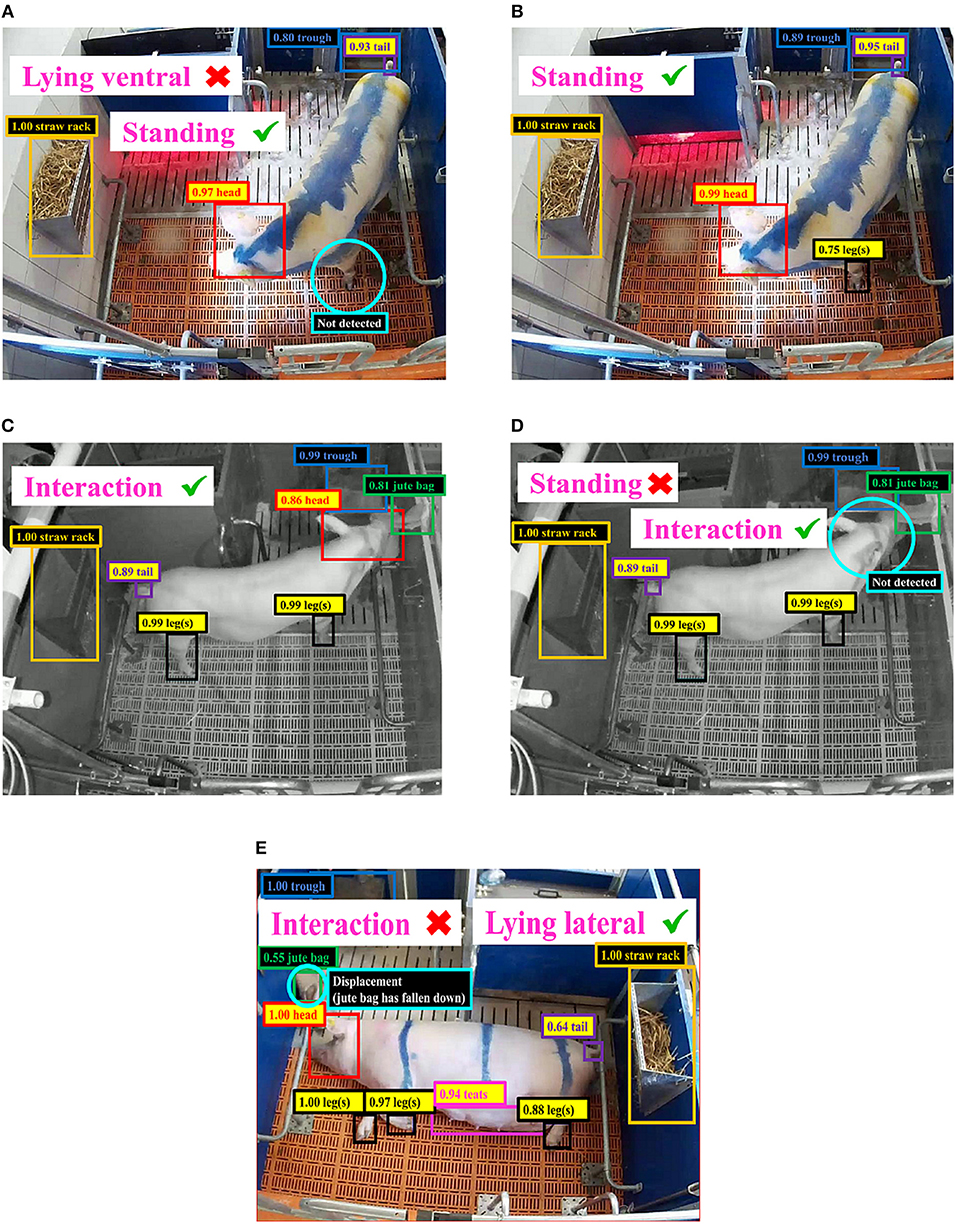
Figure 8. (A–E) Examples of struggling situations resulting in fail classification (The BB's were edited to highlight the features and the cyan circles highlight the fail detections/problems).
Discussion
The results show that the present approach to analyze behavior 2D-sequences in sows before farrowing automatically works. Up to our knowledge, this was the first attempt of fine-tuning a pre-trained network for object detection in combination with a deterministic behavior classification. The benefits are that the need of large annotated data sets for object detection can be bypassed by using a pre-trained network (Shin et al., 2016) and the classification using the hierarchical conditional statement is transparent and easy adaptable also with changing human expert knowledge about sow behavior. Another benefit is the facilitation of using videos without pre-processing, which can be beneficial toward real-time execution. The implementation of plausibility checks enables the individual analysis of videos even if there is an additional sow next to the focus sow inside the videos. Which can be very helpful, when videos are showing areas from adjacent pens to the focus pen too. The training effect (Figure 5) was relatively small, which indicates the good capability of detecting shapes and objects similar to our tasks of the pre-trained YOLO V3-weights. The pen equipment has been recognized with a high AP. This is partly due to the good visibility, but can also be explained with the static placement of pen equipment. The body parts were partly recognized with a lower AP, but all above 0.6. Especially the classes teats (0.66), leg(s), (0.75) and tail (0.73) can be optimized. Their mobility as well as their biological variance and the change of their position in relation to the camera (viewing angle) are making them more difficult to be annotated and detected correctly.
The main reason for only reaching average accuracy (59.6% overall) is in our opinion the behavior/posture classification step. The dataset was created by selecting single images with a uniform distribution and with that heterogeneity and variance of visible situations were not controlled. Machine learning classification methods such as decision tree or support vector machines might increase accuracy, but need a larger dataset with increased homogeneity in terms of class quantity and higher variation in terms of class appearance. To accomplish these needs, methods of dataset augmentation and expansion, with techniques like geometrical transformations, flipping and rotation might be helpful (Cubuk et al., 2019). A positive attribute of the conditional statement is, that it is easier to transfer to other husbandry conditions than a machine learning classification approach. As Figure 8E shows, the classification is adaptable when it comes to differences in positions of pen equipment (e.g., trough, straw rack or jute bag). When objects are different in design, the object detection step still has to be retrained to minimize accuracy losses. Regarding the results of the present approach the weighted F1-Score, which contains precision and recall, should be seen as the best metric to describe the performance of the present approach since the data is unbalanced. It is remarkable, that especially the differentiation of the postures lying ventral, standing and sitting (see Tables 5, 6) is insufficient. The problem of the differentiation arises from the fact that in the mentioned postures almost the same body parts are visible from the top-view camera perspective (head, tail, no teats, two or fewer legs). Nasirahmadi et al. (2019) found the same problems for differentiation of standing and lying on belly for fattening pigs. This leads to the assumption that the differentiation of these postures is more complex than just combining visible body parts with one another. More information on these behavior classes would be necessary for automatic behavioral analysis systems.
Toward a practical implementation, the overall accuracy needs to be optimized. Machine learning methods for behavior/posture detection should be tested. Furthermore, a good performance of the first step (object detection) is fundamental for the second step and therefore the basis for the overall accuracy. To improve this step a polygon based annotation such as (Bolya et al., 2019) might be beneficial as BB's include also non-object information particularly for objects that are large and varying in position and shape such as the teats of a sow. This could optimize the accuracy of annotation, detection and localization within the image. If relevant objects (especially body parts) are not visible in the image, due to occlusion, key point pose estimation, using a “skeleton-form,” could be a useful annotation approach too (Mathis et al., 2018; Graving et al., 2019; Pereira et al., 2019). The skeleton-form enables the prediction of occluded body parts, which could be an additional feature for machine learning classification methods if the accuracy is sufficient. Nevertheless, for further studies an annotation guideline with precise definitions of shape and percentage of visibility for annotating polygon masks and/or key point features within a class should be considered. The annotation guidelines of the PASCAL Visual Object Classes Challenge 2007 (VOC2007)4 could be helpful in this context. Furthermore, the execution speed of the present approach is optimizable. A refactoring of the algorithm is planned. Additionally, a possible implementation of the newest version of YOLO (V5) seems to work promisingly faster than V3.
The example for diurnal evaluation of an individual sow suites the results of established studies well and shows great potential to identify the onset of farrowing or possible diseases, which can affect individual diurnal act out of behavior/postures. Like in previous work, a sow individual diurnal pattern needs to be taken into account to detect diseases or the onset of farrowing (Cornou and Lundbye-Christensen, 2012; Küster et al., 2020).
Conclusion
In conclusion, an approach to analyze 2D-video sequences of single loose housed sows (top view) with regard to automatically output individual postures and interactions of sows, was developed. This solution is composed of two-steps including as first step object detection implemented with YOLO V3 and as second step posture and interaction classification implemented as a human knowledge based deterministic conditional statement using spatiotemporal information with implemented plausibility checks. It enables the automatic evaluation of 2D-videos without further pre-processing and has advantages when it comes to transferability to other environments, but still the overall accuracy only achieved 59.6%. While the accuracy of the object detection was sufficient, but still optimizable, the implemented classification step, which was developed as a solution to overcome issues of the present dataset composition in form of balance, variation and size, can only be seen as a proof of concept. All in all, after adapting the suggested future works, this approach has potential toward a practically implementable automatic behavior surveillance of sows housed in free farrowing systems based on 2D-videos.
Data Availability Statement
The videos belong to the InnoPig-project (project no: 2817205413; 758914). Requests to access these datasets should be directed to Imke Traulsen, aW1rZS50cmF1bHNlbkB1bmktZ29ldHRpbmdlbi5kZQ== or Joachim Krieter, amtyaWV0ZXJAdGllcnp1Y2h0LnVuaS1raWVsLmRl.
Ethics Statement
Ethical review and approval was not required for the animal study because the animals (sows) included in this study were only videotaped. Any treatment of animals in this study was in accordance with the German legal and ethical requirements of appropriate animal procedures. Written informed consent was obtained from the owners for the participation of their animals in this study.
Author Contributions
SK and IT contributed to concept and design of the study. SK organized the database, wrote the first draft of the manuscript with support, and statistical supervision from CM. PN performed methodology. PN and SK carried out statistical analysis. BS and IT supervised this work. All authors contributed to manuscript revision, read, and approved the submitted version.
Funding
We acknowledge support by the Open Access Publication Funds of the Göttingen University.
Conflict of Interest
The authors declare that the research was conducted in the absence of any commercial or financial relationships that could be construed as a potential conflict of interest.
Publisher's Note
All claims expressed in this article are solely those of the authors and do not necessarily represent those of their affiliated organizations, or those of the publisher, the editors and the reviewers. Any product that may be evaluated in this article, or claim that may be made by its manufacturer, is not guaranteed or endorsed by the publisher.
Acknowledgments
The authors would like to thank Dr. R. Y. Ladewig, Dr. C. Grimberg-Henrici and Prof. Dr. J. Krieter for the provision of the videos from the Federal Office of Agriculture and Food Germany (BLE) funded project InnoPig.
Footnotes
1. ^https://github.com/drainingsun/ybat (accessed March 22, 2021).
2. ^https://pjreddie.com/media/files/yolov3.weights (accessed March 22, 2021).
3. ^https://www.image-net.org/ (accessed March 3, 2021).
4. ^Annotation Guidelines. Available online: http://host.robots.ox.ac.uk/pascal/VOC/voc2007/guidelines.html (accessed on 22 March, 2021).
References
Baxter, E. M., Jarvis, S., Sherwood, L., Farisch, M., Roehe, R., Lawrence, A. B., et al. (2011). Genetic and environmental effects on piglet survival and maternal behavior of the farrowing sow. Appl. Anim. Behav. Sci. 130, 28–41. doi: 10.1016/j.applanim.2010.11.020
Bolya, D., Zhou, C., Xiao, F., and Lee, Y. J. (2019). “YOLACT real-time instance segmentation,” in Proceedings of the IEEE/CVF International Conference on Computer Vision (ICCV) (Seoul), 9157-9166. doi: 10.1109/ICCV.2019.00925
Brünger, J., Gentz, M., Traulsen, I., and Koch, R. (2020). Panoptic segmentation of individual pigs for posture recognition. Sensors 20:3710. doi: 10.3390/s20133710
Cornou, C., and Kristensen, A. R. (2013). Use of information from monitoring and decision support systems in pig production: collection, applications and expected benefits. Livest. Sci. 157, 552-567. doi: 10.1016/j.livsci.2013.07.016
Cornou, C., and Lundbye-Christensen, S. (2012). Modeling of sows diurnal activity pattern and detection of parturition using acceleration measurements. Comput. Electron. Agric. 80, 97–104. doi: 10.1016/j.compag.2011.11.001
Cubuk, E., Zoph, B., Mane, D., Vasudevan, V., and Le, Q. (2019). “AutoAugment: learning augmentation policies from data,” in Proceedings of the 2019 IEEE/CVF Conference on Computer Vision and Pattern Recognition (CVPR) (Long Beach, CA). doi: 10.1109/CVPR.2019.00020
Everingham, M., Van Gool, L., Williams, C. K. I., Winn, J., and Zisserman, A. (2010). The PASCAL visual object classes (VOC) challenge. Int. J. Comput. Vis. 88, 303–338. doi: 10.1007/s11263-009-0275-4
Graving, J. M., Chae, D., Naik, H., Li, L., Koger, B., Costelloe, B. R., et al. (2019). DeepPoseKit, a software toolkit for fast and robust animal pose estimation using deep learning. Elife 8:e47994. doi: 10.7554/eLife.47994.sa2
Grimberg-Henrici, C. G. E., Büttner, K., Lohmeier, R. Y., Burfeind, O., and Krieter, J. (2019). The effect of group-housing with free-farrowing pens on reproductive traits and the behaviour of low-risk and high-risk crushing sows. Appl. Anim. Behav. Sci. 211, 33-30. doi: 10.1016/j.applanim.2018.12.001
Hartsock, T. G., and Barczewski, R. A. (1997). Prepartum behavior in swine: effects of pen size. J. Anim. Sci. 75, 2899–2904. doi: 10.2527/1997.75112899x
Kashiha, M., Bahr, C., Haredasht, S. A., Ott, S., Moons, C. P. H., Niewold, T. A., et al. (2013). The automatic monitoring of pig water use by cameras. Comput. Electron. Agric. 90, 164–169. doi: 10.1016/j.compag.2012.09.015
Kluyver, T., Ragan-Kelley, B., Pérez, F., Granger, B., Bussonnier, M., Frederic, J., et al. (2016). “Jupyter notebooks–a publishing format for reproducible computational workflows. Positioning and power in academic publishing: players, agents and agendas,” in Proceedings of the 20th International Conference on Electronic Publishing (Göttingen), 87–90.
Küster, S., Kardel, M., Ammer, S., Brünger, J., Koch, R., and Traulsen, I. (2020). Usage of computer vision analysis for automatic detection of activity changes in sows during final gestation. Comput. Electron. Agric. 169:105177. doi: 10.1016/j.compag.2019.105177
Lange, A., Gentz, M., Hahne, M., Lambertz, C., Gauly, M., Burfeind, O., et al. (2020). Effects of different farrowing and rearing systems on post-weaning stress in piglets. Agriculture 10:230. doi: 10.3390/agriculture10060230
Lao, F., Brown-Brandl, T. M., Stinn, J. P., Teng, G., Liu, K., and Xin, H. (2016). “Sow lying behaviors before, during and after farrowing,” in Proceedings of the ASABE Annual International Meeting 2016 (Orlando, FL). doi: 10.13031/aim.20162461921
Leonard, S. M., Xin, H., Brown-Brandl, T. M., and Raminez, B. C. (2019). Development and application of an image acquisition system for characterizing sow behaviors in farrowing stalls. Comput. Electron. Agric. 163:104866. doi: 10.1016/j.compag.2019.104866
Mathis, A., Mamidanna, P., Cury, K. M., Abe, T., Murthy, V. N., Mathis, M. W., et al. (2018). DeepLabCut: markerless pose estimation of user-defined body parts with deep learning. Nat. Neurosci. 21, 1281–1289. doi: 10.1038/s41593-018-0209-y
Matthews, S. G., Miller, A. L., Plötz, T., and Kyriazakis, I. (2017). Automated tracking to measure behavioural changes in pigs for health and welfare monitoring. Sci. Res. 1, 1–12. doi: 10.1038/s41598-017-17451-6
Nasirahmadi, A., Sturm, B., Edwars, S., Jeppsson, K.-H., Olsson, A.-C., Müller, S., et al. (2019). Deep learning and machine vision approaches for posture detection of individual pigs. Sensors 17:3738. doi: 10.3390/s19173738
Okinda, C., Lu, M., Nyalala, I., Li, J., and Shen, M. (2018). Asphyxia occurrence detection in sows during the farrowing phase by inter-birth interval evaluation. Comput. Electron. Agric. 152, 221–232. doi: 10.1016/j.compag.2018.07.007
Pastell, M., Hietaoja, J., Yun, J., Tiusanen, J., and Valros, A. (2016). Predicting farrowing of sows housed in crates and pens using accelerometers and CUSUM charts. Comput. Electron. Agric. 127, 197–203. doi: 10.1016/j.compag.2016.06.009
Pereira, T. D., Aldarondo, D. E., Willmore, L., Kislin, M., Wang, S. S.-H., Murthy, M., et al. (2019). Fast animal pose estimation using deep neural networks. Nat. Methods 16 1, 117–125. doi: 10.1038/s41592-018-0234-5
Redmon, J., Divvala, S., Girshick, R., and Fahrhadi, A. (2016). You Only Look Once: Unified, Real-Time Object Detection. Available online at: https://arXiv.org/abs/1506.02640v5 (accessed March 22, 2021).
Redmon, J., and Farhadi, A. (2018). YOLOv3: An Incremental Improvement. Available online at: https://arxiv.org/abs/1804.02767v1 (accessed March 22, 2021).
Rushen, J., Chapinal, N., and De Passillé, A. (2012). Automated monitoring of behavioural based animal welfare indicators. Anim. Welf. 21, 339–350. doi: 10.7120/09627286.21.3.339
Shin, H. C., Roth, H. R., Gao, M., Lu, L., Xu, Z., Nogues, I., et al. (2016). Deep convolutional neural networks for computer-aided detection: CNN architectures, dataset characteristics and transfer learning. IEEE Trans. Med. Imag. 35, 1285–1298. doi: 10.1109/TMI.2016.2528162
Traulsen, I., Scheel, C., Auer, W., Burfeind, O., and Krieter, J. (2018). Using acceleration data to automatically detect the onset of farrowing in sows. Sensors 18:170. doi: 10.3390/s18010170
Viazzi, S., Ismayilova, G., Oczak, M., Sonoda, L. T., Fels, M., Guarino, M., et al. (2014). Image feature extraction for classification of aggressive interactions among pigs. Comput. Electron. Agric. 104, 57–62. doi: 10.1016/j.compag.2014.03.010
Weary, D., Huzzey, J., and Von Keyserlingk, M. (2009). Board-invited review: using behavior to predict and identify ill health in animals. Sci. J. Anim. Sci. 87, 770–777. doi: 10.2527/jas.2008-1297
Welp, S. (2014). Untersuchungen zur Reduzierung der Ferkelverluste und zur Verbesserung der täglichen Zunahme der Ferkel bei hochfruchtbaren Sauen (dissertation), Justus-Liebig-Universität Gießen, Gießen, Germany.
Widowski, T., Curtis, S., Dziuk, P., Wagner, W., and Sherwood, O. (1990). Behavioral and endocrine responses of sows to prostaglandin F2 and cloprostenol. Biol. Reprod. 43, 290–297. doi: 10.1095/biolreprod43.2.290
Witten, I. H., Frank, E., and Hall, M. A. (2011). Data Mining. Practical Machine Learning Tools and Techniques, 3rd Edn. Burlington, MA: Morgan Kaufmann.
Yang, A., Huang, H., Zhu, X., Yang, X., Chen, P., Li, S., et al. (2018). Automatic recognition of sow nursing behaviour using deep learning-based segmentation and spatial and temporal features. Biosyst. Engi. 175, 133–145. doi: 10.1016/j.biosystemseng.2018.09.011
Keywords: convolutional neural network, free farrowing, object recognition, computer vision, individual surveillance, YOLO
Citation: Küster S, Nolte P, Meckbach C, Stock B and Traulsen I (2021) Automatic Behavior and Posture Detection of Sows in Loose Farrowing Pens Based on 2D-Video Images. Front. Anim. Sci. 2:758165. doi: 10.3389/fanim.2021.758165
Received: 13 August 2021; Accepted: 11 October 2021;
Published: 03 November 2021.
Edited by:
Suresh Neethirajan, Wageningen University and Research, NetherlandsReviewed by:
Yongwha Chung, Korea University, South KoreaRafael Vieira de Sousa, University of São Paulo, Brazil
Copyright © 2021 Küster, Nolte, Meckbach, Stock and Traulsen. This is an open-access article distributed under the terms of the Creative Commons Attribution License (CC BY). The use, distribution or reproduction in other forums is permitted, provided the original author(s) and the copyright owner(s) are credited and that the original publication in this journal is cited, in accordance with accepted academic practice. No use, distribution or reproduction is permitted which does not comply with these terms.
*Correspondence: Steffen Küster, c3RlZmZlbi5rdWVzdGVyQHVuaS1nb2V0dGluZ2VuLmRl