 Melissa C. Cantor
 Enrico Casella
 Simone Silvestri
 David L. Renaud
 Joao H. C. Costa
- 1Dairy Science Program, Department of Animal and Food Sciences, University of Kentucky, Lexington, KY, United States
- 2Department of Population Medicine, University of Guelph, Guelph, ON, Canada
- 3Department of Computer Science, University of Kentucky, Lexington, KY, United States
The objective of this retrospective cohort study was to evaluate a K-nearest neighbor (KNN) algorithm to classify and indicate bovine respiratory disease (clinical BRD) status using behavioral patterns in preweaned dairy calves. Calves (N=106) were enrolled in this study, which occurred at one facility for the preweaning period. Precision dairy technologies were used to record feeding behavior with an automated feeder and activity behavior with a pedometer (automated features). Daily, calves were manually health-scored for bovine respiratory disease (clinical BRD; Wisconsin scoring system, WI, USA), and weights were taken twice weekly (manual features). All calves were also scored for ultrasonographic lung consolidation twice weekly. A clinical BRD bout (day 0) was defined as 2 scores classified as abnormal on the Wisconsin scoring system and an area of consolidated lung ≥3.0 cm2. There were 54 calves dignosed with a clinical BRD bout. Two scenarios were considered for KNN inference. In the first scenario (diagnosis scenario), the KNN algorithm classified calves as clinical BRD positive or as negative for respiratory infection. For the second scenario (preclinical BRD bout scenario), the 14 days before a clinical BRD bout was evaluated to determine if behavioral changes were indicative of calves destined for disease. Both scenarios investigated the use of automated features or manual features or both. For the diagnosis scenario, manual features had negligible improvements compared to automated features, with an accuracy of 0.95 ± 0.02 and 0.94 ± 0.02, respectively, for classifying calves as negative for respiratory infection. There was an equal accuracy of 0.98 ± 0.01 for classifying calves as sick using automated and manual features. For the preclinical BRD bout scenario, automated features were highly accurate at -6 days prior to diagnosis (0.90 ± 0.02), while manual features had low accuracy at -6 days (0.52 ± 0.03). Automated features were near perfectly accurate at -1 day before clinical BRD diagnosis compared to the high accuracy of manual features (0.86 ± 0.03). This research indicates that machine-learning algorithms accurately predict clinical BRD status at up to -6 days using a myriad of feeding behaviors and activity levels in calves. Precision dairy technologies hold the potential to indicate the BRD status in preweaned calves.
1 Introduction
Respiratory disease in cattle has a multifactorial etiology; an external stressor can lead to a bacterial infection that compromises the respiratory tract (McGuirk and Peek, 2014). The outward signs of respiratory disease include labored respiration (Love et al., 2016), coughing, cloudy or colored nasal and eye discharge, fever, and head tilt (cumulative scoring of abnormal categories, referred to as the Wisconsin scoring system (McGuirk and Peek, 2014)). The Wisconsin scoring system has moderate sensitivity (=0.62) and specificity (=0.74) for diagnosis compared to lung ultrasonography scoring (>1cm2 = clinical BRD; Buczinski et al. (2015)). Indeed, lung ultrasonography in combination with the Wisconsin scoring system has improved the sensitivity (=0.79) and specificity (=0.94) for diagnosis of respiratory diseases in calves, and thus, it is the optimal system to date (Buczinski et al., 2014). However, many producers are adopting precision technology on farm, and the utility of these automated technologies to find calves who show outward signs of respiratory disease and have lung consolidation needs investigation.
Precision dairy technology (PDT) devices could alert for calves who change their behavioral patterns prior to outward signs of respiratory disease, but producers will ignore alerts that have poor sensitivity for detecting disease in cattle (Eckelkamp and Bewley, 2020). Thus, it is imperative to develop an algorithm to indicate the respiratory status in calves using behaviors captured by precision technology. One of the largest barriers for a producer to adapt a PDT on farm is the producer’s familiarity with the technology and the producer’s perceived value of the data (Drewry et al., 2019). For socially housed calves, automated milk feeders were reported to be used by 16% of Canadian dairy producers (Medrano-Galarza et al., 2017), providing an opportunity for researching PDT, which is familiar to some producers. Similarly, accelerometers were reported to be a commonly researched PDT on dairy farms (Slob et al., 2020). Additionally, less than half of producers in the UK use individual housing, demonstrating a need for methods that detect diseases in socially housed calves (Mahendran et al., 2021). Thus, investigating the potential of familiar PDT such as an automated feeder and an accelerometer to indicate a calf that has outward signs of respiratory disease and is positive for lung consolidation is valuable.
Sickness behaviors are well documented in research with automated milk feeders in calves. It was observed in a scoping review by Morrison et al. (2021) that calves decreased their milk intake, drinking speed, and unrewarded visits prior to clinical diagnosis of the disease. To a less researched extent, sickness behaviors were also reported in research with accelerometers. As reviewed by Costa et al. (2021), calves decreased their daily lying bouts and step counts, and increased their lying time prior to calves showing signs of respiratory disease. Thus, automated milk feeders and accelerometers are technologies that may capture sickness behaviors in calves, but more research is needed to develop an accurate algorithm for indicating calves who show outward signs of respiratory disease and have lung consolidation.
Machine learning techniques combined with data collected in real-time from automatic milk feeder might be useful to detect respiratory bouts in dairy calves. This is possible because such an automated milk feeder can frequently collect many behaviors related to changes in the individual calf’s patterns (the per animal approach; Cockburn, 2020). However, in order to develop algorithms that detect changes in behavioral patterns in individual calves, machine-learning research must first quantify if automatically collected variables are indicative of the disease. Specifically, it is important to find calves with lung consolidation and outward signs of respiratory disease. This has been the case with dairy cattle research. For example, Slob et al. (2020) concluded in a systematic review that changes in behavioral patterns (e.g., activity levels, rumination etc.), can accurately predict ketosis or mastitis in dairy cattle; 21 studies used either decision tree algorithms, support vector machines, or neural networks to accurately detect these diseases. However, to our knowledge, only one study has used machine-learning techniques (e.g., decision tree algorithms or deviations from rolling averages in lying time) to indicate a respiratory disease in calves (Bowen et al., 2021). Furthermore, Bowen et al. (2021) observed only a moderate sensitivity (=0.54) and accuracy (=0.75) for these algorithms to indicate respiratory disease, highlighting that more research is needed.
A promising machine-learning technique used for studying inference problems is the K-nearest neighbor (KNN) algorithm. KNN classifies input data by considering the nearest k neighbors in a multidimensional space based on a distance metric (Wang, 2011). KNN has the advantage of labeling time series data. For example, the days leading up to diagnosis of clinical disease of the respiratory tract could be labeled as “preclinical BRD bout.” Thus, the KNN algorithm can project data into a multidimensional space to label samples closer to disease diagnosis as well as after the diagnosis as “sick.” Similarly, this algorithm might be able to distinguish behavioral patterns that are in high similarity between the behavior of preclinical BRD-labeled samples and the behavior of samples labeled as positive for respiratory infection. Furthermore, KNN requires less training data than neural network-based approaches. Thus, we suggest that a KNN algorithm has the potential to accurately indicate changes in respiratory status in preweaned dairy calves, but it is unknown how accurate PDT data would be.
The objective of this study was to use a novel approach to the industry challenge of automatically finding calves that were positive for clinical bovine respiratory disease. We also aimed to investigate if the algorithm could accurately label data as a preclinical BRD bout in the 14 days leading up to the diagnosis of respiratory infection using automated features such as feeding behavior and activity levels collected by PDT and manual features such as health scores, body weights, and passive immunity status at 48 h of age. Specifically, we aimed to find calves with lung consolidation and outward signs of respiratory disease. We hypothesized that the KNN could label calves with preclinical BRD bouts using only automatic features since others observed associations of these behaviors with disease status in calves.
2 Materials
This study was conducted at the University of Kentucky Coldstream Research Dairy Farm in Lexington, KY, USA from 28 May 2018 to 9 September 2019. All calves enrolled were part of the Institutional Animal Care and Use Committee approval number 2018: 2864. This study and manuscript were conducted following the quality standards of Strengthening the Reporting of Observational Studies in Epidemiology Veterinary Guidelines (Sargeant et al., 2016).
2.1 Enrollment Criteria and Automated and Manual Attributes
Calves (N=106) were enrolled in this study, which occurred at one facility for the preweaning period of 50 days. Precision technologies (referred to hereafter as automated attributes) were used to record feeding behavior, activity levels, and the barn ambient temperature and humidity level (seasonal data) for all calves enrolled in this study. Feeding behavior was recorded with an automated feeder that recorded daily milk intake (L/day), average daily milk allotment consumed (percentage), drinking speed (ml/min), a rolling 12-day average drinking speed (speed percent), rewarded visits (visits/day; where milk was consumed), and unrewarded visits to the feeder (non-nutritive visits per day when calves were ineligible to retrieve milk). A separate automated feeder recorded calf starter intake daily (g/day; e.g., solid feed intake). All calves in this study also wore a pedometer (IceQube, IceRobotics, Scotland) attached to the left rear leg to track activity levels including lying time (h/day), lying bouts (bouts/day), total step count (steps/day), and activity index (a metric generated by the commercial algorithm based on the average rate of acceleration and total activeness).
Daily, calves were manually health-scored for bovine respiratory disease (clinical BRD; Wisconsin scoring system, WI, USA). Twice weekly, calves were scored with thoracic ultrasonography to confirm clinical BRD diagnosis. A clinical BRD bout (day 0) was classified as two categories of abnormal scores as defined by the Wisconsin scoring system and an area of consolidated lung ≥3.0cm2. There were 54 calves diagnosed with a clinical BRD bout at 29.0 ± 9.0 days of age (mean ± SD). Health features such as outward signs of clinical BRD (e.g., further described in health section), body weight, rectal temperature, and calf passive immunity status at 48 h of age are referred to hereafter as manual attributes. Since some manual attributes required calf restraint to collect such as body weight, passive immunity status, and rectal temperature, it was also of interest to quantify the additional accuracy gained when collecting these attributes in the days approaching clinical BRD diagnosis. We assessed for 48 h serum the BRIX value as an input feature since Lombard et al. (2020) observed that increasing serum IgG status at 48 h was associated with improved health outcomes in calves. Thus, manual attributes were also categorized by effort (e.g., further described in the statistical analysis section). A complete list of features evaluated is available in Table 1.
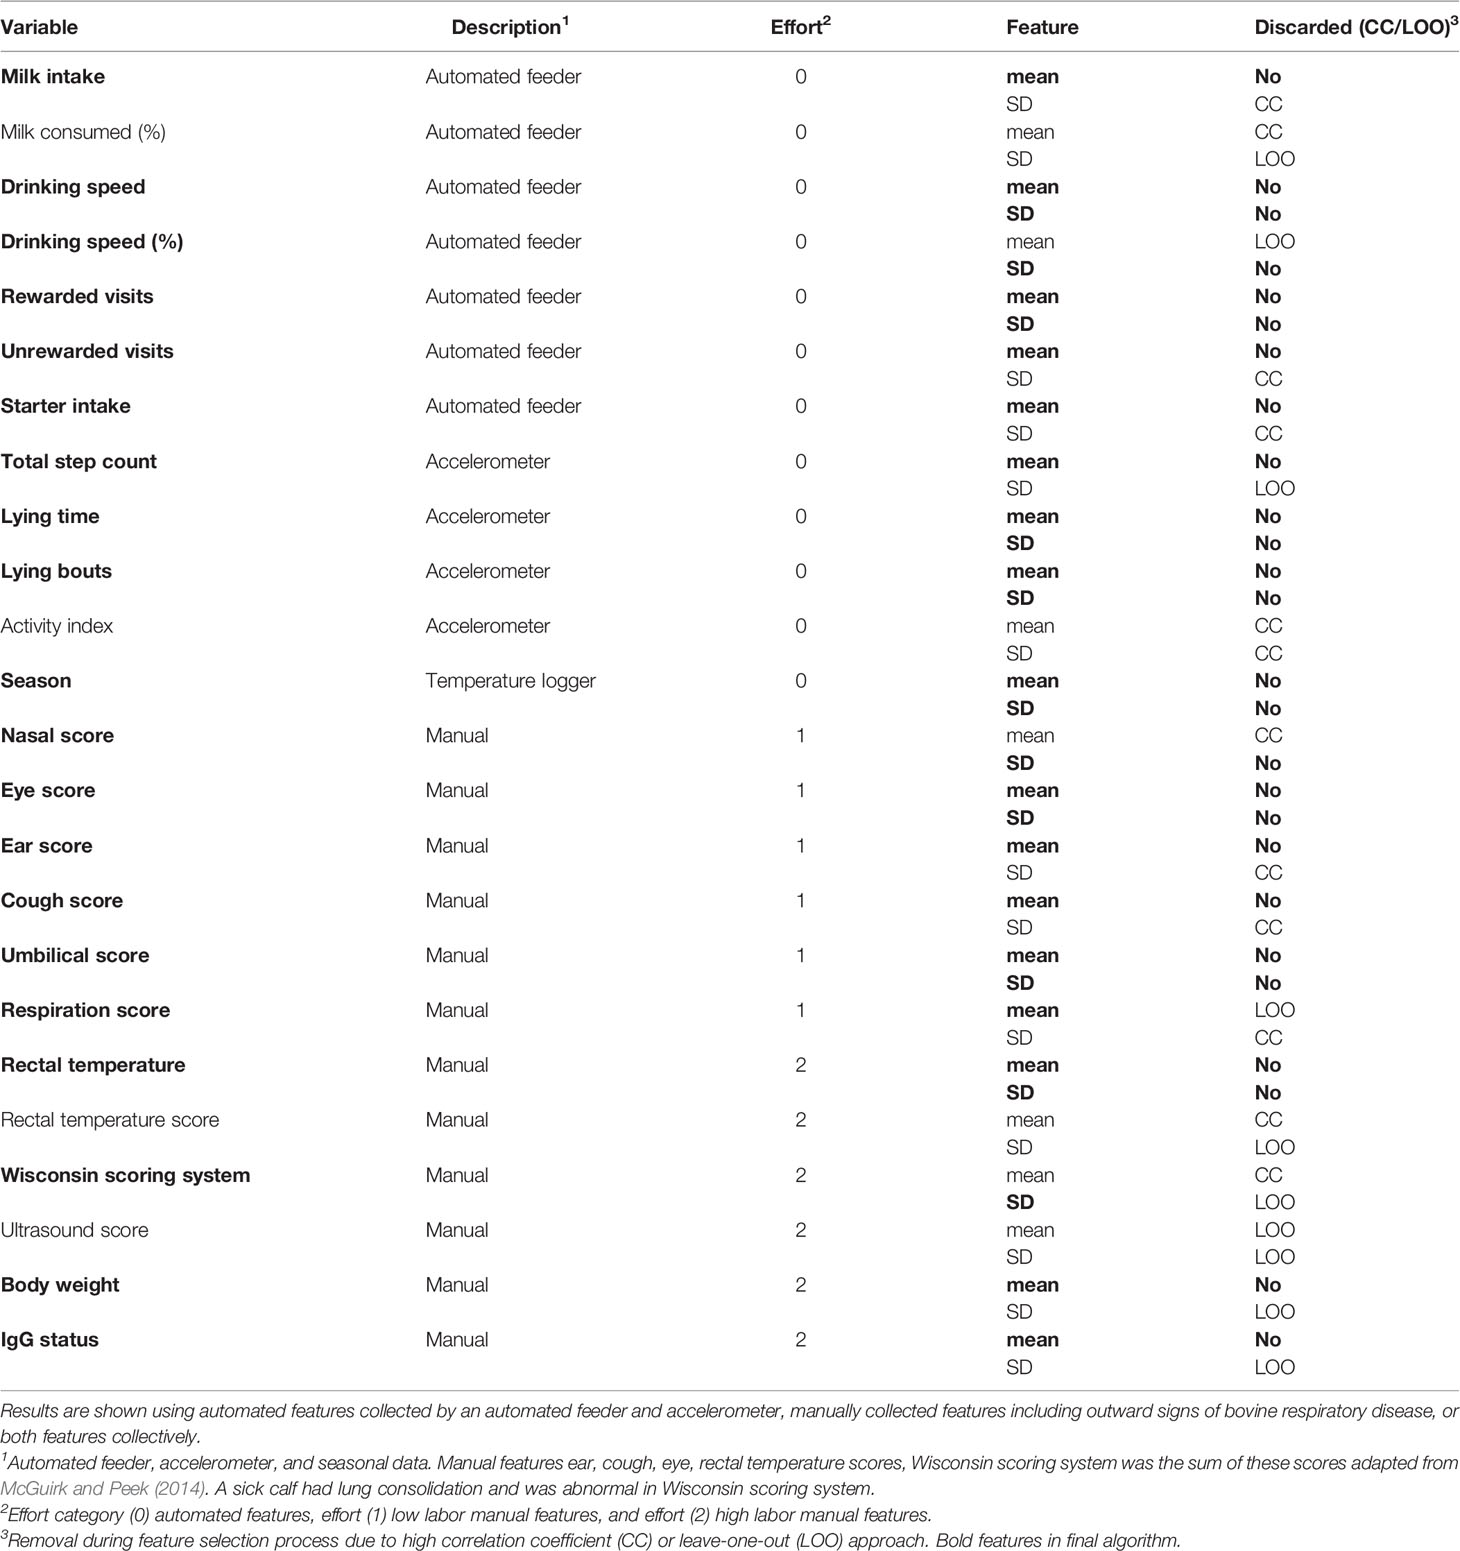
Table 1 Features used by algorithm to indicate Bovine Respiratory Disease status in 106 calves.
All calves enrolled in this study had, on average, 49.5/50 complete days of pedometer and automated feeder data, with a maximum of 16% data loss (e.g., more details in the statistical section). Calves were excluded from this study and sold if they were a twin or had indication of low passive immunity status at 48 h of life (e.g., less than 80% BRIX).
2.2 Management and Feeding
A complete description of the care and management of calves in this study can be found in Cantor et al. (2021). Each calf was fitted with an RFID tag in the left ear for identification by the automated feeders, and each calf wore a pedometer (IceQube, IceRobotics, Edinburgh, Scotland) attached above the metatarsal of the rear left leg using a Velcro band to track activity behaviors. Calves were allotted up to 10L milk replacer every day from the automated milk feeder (Cow’s Match Cold Front; Land O’ Lakes Animal Milk Products Co., Shoreview, MN) for 50 days. Calves enrolled in this study were trained to drink milk from the automated feeder at 3.0 ± 2.0 days of age. Calves could consume milk in a minimum meal size of 0.5 and a maximum meal size of 3L. There was one automated milk feeder located within a group pen (4.57 × 10.67m2) and the stocking density was 6 ± 3 calves (mean ± SD).
A separate automated calf starter feeder (Compact Smart, Förster-Technik, Engen, Germany) was present in each pen and contained calf starter (Special Calf Starter and Grower, Baghdad Feeds, Baghdad, KY); calves were also offered chopped alfalfa hay in a trough. Both the automated milk feeder and the calf starter feeder were calibrated weekly according to manufacturer instructions. All calves had ad libitum access to an automated waterer.
2.3 Health Exams
Calves were health-scored by one of three trained researchers daily every morning (inter-observer agreement κ > 0.90) for clinical BRD (McGuirk and Peek (2014)), diarrhea (Renaud et al., 2020), and umbilical infection. The main researcher health-scoring the calves was not blind to the health status of the calves due to performing health exams daily. The decision of treatment was performed by the farm staff manager who administered antimicrobial treatments to the calves and was blinded to the daily examination. The other 2 observers were blinded to the health status of the calves.
Bovine respiratory disease signs were recorded daily by trained observers using the Wisconsin scoring system (McGuirk and Peek, 2014). The observer assigned a nasal discharge score, eye discharge score, ear tilt score, cough score, and temperature score to each calf every day. Furthermore, a dichotomous score for heavy respiration was also recorded. The heavy respiration variable was not used for clinical BRD diagnosis and was only collected for evaluation as a potential manual feature in the machine-learning algorithm. A trained observer performed the lung ultrasonography scoring system on all calves twice weekly (e.g., every Tuesday and Friday) using a portable linear rectal ultrasound (Ibex Pro, E.I. Medical, Loveland, CO) and 70% isopropyl alcohol as a transducing agent; lung lobes of each calf were evaluated by 1 of 2 observers (inter-observer agreement Cohens’ kappa; κ = 0.90). The ultrasound was set to a depth of 9 cm, frequency of 6.2 MHz, and gain of 23 (near 13 dB; far 36 dB). The observers used the lung ultrasonography methodology first described by Ollivett et al. (2015). Briefly, both sides of the thorax were scanned starting at the tenth intercostal space as positioned dorsally at the level of the scapula of the calf with the probe held parallel to the rib. The observer first scanned the dorsal aspect of the tenth intercostal space, advancing cranially toward the ventral aspect of the first to second intercostal space (Ollivett et al., 2015). Lungs were scored for consolidation according to previous methodology (Dunn et al., 2018). Briefly, normal lungs had a hyperechoic line and reverberation artifact. Calves with lung consolidation had a lung that was hypoechoic and both the bright white band at the pleural interface and reverberation artifact were absent. The extent of the lung consolidation was measured using 1-cm grid marks on the ultrasound screen. We scored calf lungs based on the maximum lung consolidation found: normal, 1 cm2, 2 cm2, and 3 cm2. For calves with 3 cm2 in at least two lung lobes, we assigned a score of 4, and for calves with lung consolidation in 3 lobes, we assigned a score of 5 to differentiate these clinical BRD calves from clinical BRD calves with only one lobe of consolidation. However, only calves that relapsed with clinical BRD and were re-treated at day 15 had lung consolidation at score 4 or 5.
The diagnosis and treatment of a clinical BRD bout for preweaned calves in this study required two criteria, and these criteria were selected due to the improved sensitivity and specificity of diagnosing clinical BRD in calves when using the Wisconsin scoring system and lung ultrasonography collectively (Buczinski et al., 2015). Lung consolidation at 3 cm2 was selected to reduce misclassification error in the observers and since lung consolidation at this level was associated with long-term effects such as reduced milk in the first lactation (Dunn et al., 2018). This was also the selected herd veterinary protocol for this research station and was also chosen per consult of an expert veterinary researcher. We also selected 3≥cm2 lung consolidation to maximize the sensitivity of the algorithm to diagnose a case of clinical BRD, as using a lower threshold of lung consolidation at 1 cm2 in this dataset resulted in a poor sensitivity 32% (13/41) compared to our current definition for disease since many of our calves never had this level of lung consolidation. Specifically, a calf was clinical BRD positive on the Wisconsin scoring system, which required two or more examination parameters to be moderately (score of 2) or severely (score of 3) abnormal [adapted from McGuirk and Peek (2014)]. A calf was also positive for lung consolidation, as described in Dunn et al. (2018); a consolidated lung at 3 cm2 appeared hypoechoic and both the bright white band at the pleural interface and the reverberation artifact were absent. Hence, a clinical BRD bout diagnosis on day 0 was the first day that a calf had an abnormal Wisconsin scoring system score and a consolidated lung at 3 cm2. For simplicity, the -14 days before a clinical BRD bout diagnosis are referred to as preclinical BRD bout to classify calves destined for a clinical BRD diagnosis. Calves were labeled as clinical BRD for the day of clinical BRD bout diagnosis and the days after clinical BRD diagnosis until lung consolidation and signs of clinical BRD resolved.
There were 54 calves that had a clinical BRD bout at an average age of diagnosis at 29.0 ± 9.0 days (mean ± SD). Calves received antimicrobials on day 0 for a clinical BRD bout. On the same day of clinical BRD bout diagnosis, calves received enrofloxacin subcutaneously with dosage calculated by BW (Baytril, Bayer, Leverkusen, Germany; 100 mg/15 kg body weight) according to the herd veterinarian protocol. Calves were treated with tulathromycin on day 15 if clinical BRD had not resolved per our definition (Draxxin, Zoetis Animal Health, USA; 2.5mg/kg, once at second diagnosis, subcutaneously). Body weights were recorded at birth and twice weekly using an electronic scale (Brecknell PS1000, Avery Weigh-Tronix LLC, and Fairmont, MN) for all calves.
2.4 Automated Technology Data
2.4.1 Pedometer
The pedometer was a tri-axial accelerometer that recorded behavioral activity (IceQube, IceRobotics, Edinburgh, Scotland). The frequency was recorded at 4 Hz, and an automated summary was generated for each behavior for every calf every 15 min and transmitted to a data cloud wirelessly. Daily summaries were automatically generated by the software for each calf on the following behaviors: lying bouts, lying time, and total step count as validated by Silper et al. (2015). Moreover, an activity index score was generated daily by an algorithm from this accelerometer’s software (IceQube, Ice Robotics, Scotland). This algorithm evaluated each calf’s average daily rate of acceleration and daily step count to generate an activity index (Gladden et al., 2020).
2.4.2 Automated Calf Feeder
The automated feeder’s software (KalbManagerWIN, Förster-Technik, Engen Germany) summed milk intake, drinking speed, calf starter intake, and milk feeder visits (rewarded and unrewarded visits) into daily summaries for each calf and transmitted the data to a data cloud associated with the automated feeder software.
2.4.3 Season
Seasonal temperature and humidity were recorded by a wireless logger placed in the calf barn (Hoboware, Onset, MA, USA). Seasonal data were summarized into winter, spring, summer, and fall based on temperature and humidity thresholds. These seasons were then assigned to each calf day as a categorical variable. Details about seasonal summary data were further described in Cantor et al. (2021). A summary of all attributes is provided in Table 1.
3 Methods
In this section, we present the technical details of our algorithms to manipulate and process the dataset, as well as lower-level information about the machine-learning algorithm we used.
All coding and algorithm development was performed using open-source Python coding (from Python Software Foundation1) along with several open-source sector leading libraries such as pandas for data structures (Wes, 2010), NumPy for scientific computing (Harris et al., 2020), scikit-learn for machine-learning algorithm development (Buitinck et al., 2013) (e.g., further described in this section), and matplotlib for the generation of figures (Hunter, 2007). All libraries are NumFOCUS-sponsored projects.2
3.1 Labels and Experimental Scenarios
Data were collected from 106 calves. Each row was a data point of daily information including automated features and manual features as listed in Table 1. Each data point also had a class column indicating the clinical BRD status of the calf on that day.
The value of clinical BRD status decreased by 1 for every day prior to clinical BRD diagnosis until 14 days prior to clinical BRD diagnosis. All other data points had a clinical BRD status value of -∞. Given such distribution of the clinical BRD status values, we adopted the following labeling of the clinical BRD status. Data points with a clinical BRD status value of -∞ were labeled as no-clinical BRD (H(-)). Data points with a clinical BRD status value greater than or equal to 0 were labeled as sick (s(+)). Data points within the range (-14,0) were labeled as preclinical BRD (PS). In summary:
The definition of such labels is strictly related to the experiments we carried out. The first experimental scenario is the diagnosis scenario, in which we evaluated the performance of our algorithm to correctly label calves as sick with clinical BRD or negative for the disease. We excluded preclinical BRD data from this experiment. The second experimental scenario is called the preclinical BRD scenario, in which we evaluated the performance of our algorithm to label calves with preclinical BRD bouts. More specifically, in the preclinical BRD scenario, we evaluated the algorithm’s accuracy to correctly label calves as preclinical BRD on a daily basis from day -14 to day -1 prior to clinical BRD diagnosis.
3.2 Data Cleaning
Figure 1 summarizes the processing pipeline of this approach. Data cleaning represents the first step in the pipeline that we have implemented to process the dataset, and it consists of removing data points that may potentially alter patterns that the algorithm tries to capture in order to make predictions (Chai, 2020). Note that, hereafter, we use the words “data point” and “day” interchangeably to refer to a row of our dataset, representing the data of a calf on a single day.
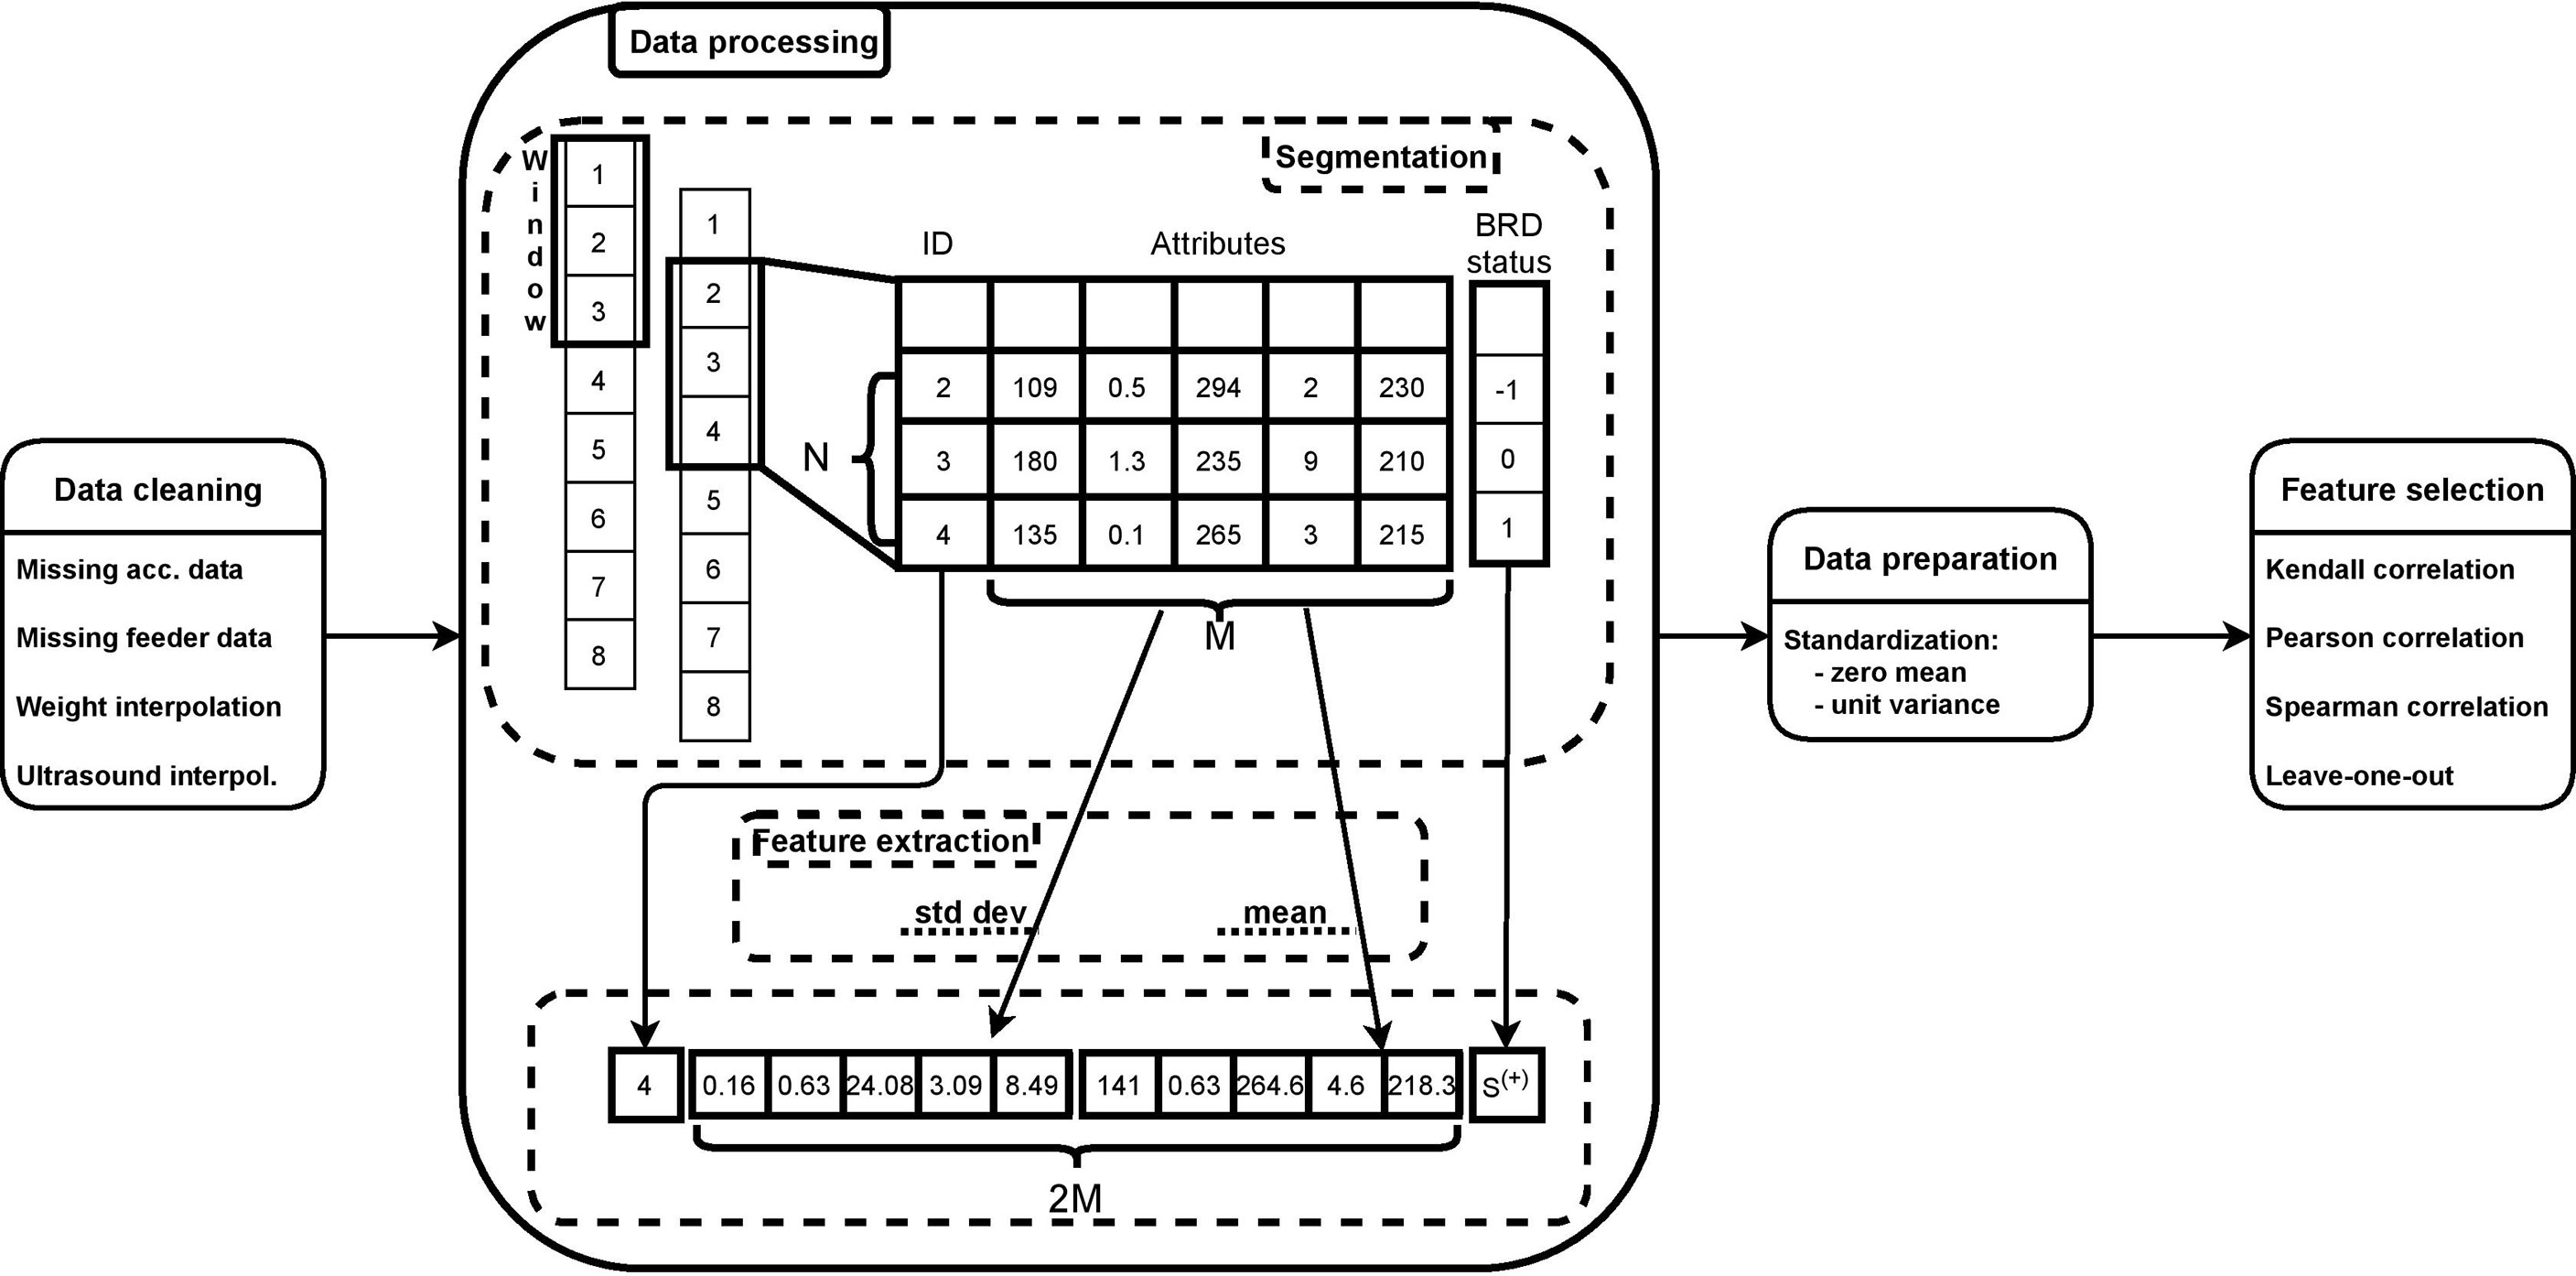
Figure 1 Data processing pipeline.
First, we removed days where calves had missing pedometer values. Only 1/5300 days for one clinical BRD negative calf was removed. Second, we removed days where calves had missing automated feeder values. A total of 8 consecutive days for 5 clinical BRD negative calves (40/5299) were deleted due to an error with the automated feeder card storing the data. Furthermore, one day on 5 different calves was removed since they had at least one variable with incomplete feeder data. Overall, the data cleaning process removed data for 46/5300 day observations, which represented less than 1% of the enrolled days. A total of 106 calves were represented by the remaining 5254 day observations, with an average of 49.5/50 days per calf.
Another step of data cleaning consisted of handling missing data for weight and ultrasound attributes, since both features were collected once every three days. Missing values of weight data were filled in by means of a linear interpolation. Specifically, considering a window of 4 data points (i.e., 4 days) where second and third were null, we replaced such null values with a linear interpolation of the first and the fourth data points, hence simulating a realistic linear growth of a calf’s body weight. Finally, we filled in the ultrasound score by propagating the last valid observation forward until the next valid observation.
3.3 Data Processing
In order to prepare the data for the machine-learning model, we performed aggregation and feature extraction. Aggregation is the process of summarizing the information from a window of consecutive data points into one single sample of data by means of feature extraction. Hereafter, the term “sample” refers to the result of such aggregation on a window of consecutive data points. Aggregation is necessary because while outward signs of respiratory disease may provide meaningful instantaneous information, other information such as the activity level of a calf simply would not be meaningful if not observed within a certain time window. Aggregation takes a window of data as input. A window is a matrix of size N × M, where N is the number of consecutive data points (or days), and M is the number of features as listed in Table 1. Each column of the window was processed through feature extraction techniques, i.e., mean and standard deviation, hence leading to a sample of size 1 × 2M, which summarizes the information of all N data points into 1 single sample. This aggregation approach was repeated for the whole dataset by shifting the window one data point at a time, as illustrated in Figure 1.
A sample from the dataset (e.g., represented as a calf day) was assigned to one of 3 labels, not-sick, sick, or preclinical BRD. During the aggregation, given a window of N × M, the set of clinical BRD status was an array of size N × 1. We assigned the label of the last element of such an array to the corresponding sample according to Eq. 1.
3.4 Data Preparation
Data preparation affects the values of each feature since the mean and standard deviation for each feature were calculated before they were fed to the machine-learning algorithm. This step was necessary because machine-learning algorithms are often sensitive to different data distributions that each input feature has. By applying a transformation, we helped the algorithm to make the best use of each input feature and avoided some features to be improperly dominant over others. Specifically, standardization transformed the input data by scaling its values to have mean equal to 0 and standard deviation equal to 1, hence normalizing the distribution of each column.
3.5 Feature Selection
Feature selection was the last step before we ran the machine-learning algorithm, and this was performed to remove redundant data and to remove variables that were closely related to improve the prediction accuracy of the KNN algorithm.
For example, we selected one variable from a pair of features that provided the same knowledge to the machine-learning model. We investigated this by calculating multiple correlation coefficients, such as Kendall Tau, Pearson, and Spearman rank (Chok, 2010), which work well with continuous data and categorical ordinal data. Information such as season was removed and analyzed in the second step of feature selection since this variable was a categorical nominal feature. For the first step of feature removal, correlation coefficients were calculated using a portion of the dataset that included clinical BRD positive sick labels and clinical BRD negative labels. This decision was guided by the fact that as calves start developing clinical BRD in the preclinical BRD stage, the corresponding data may demonstrate an overlap of the data, which may have significantly altered the feature selection process.
The correlation score of each coefficient was within the range [-1,1], where values closer to 1 and -1 represented high correlation. We calculated the absolute value of each pair and grouped those features with a value higher than 0.75 as similar. We then picked one feature to be eliminated for each pair. Specifically, if we found one feature to be present in multiple pairs, then we eliminated its “partners” in each pair; otherwise we eliminated one of the two randomly to avoid favorably selecting one variable over the other. This step allowed us to remove a total of 12 out of the 48 extracted features, most of which showed high correlation with respect to the mean or standard deviation counterpart. Features discarded during the correlation coefficient process are described in the “Discarded” column of Table 1 with the value “CC.”
In the next feature removal step, performance was tested with preclinical BRD calves only, since we evaluated for high performance of this algorithm to indicate calves who had preclinical BRD bouts. We carried out a leave-one-out approach where we tested the performance of our algorithm by removing one feature at a time. Specifically a feature was removed from the final dataset if algorithm performance improved following its removal, or if the algorithm performance remained unchanged. This was done separately for the subgroups of automated features and manual features. We removed 8 additional features. Features discarded during the leave-one-out approach are described in the “Discarded” column of Table 1 with the value “LOO.” We had a final set of 28 features for the KNN algorithm.
The final list of features after performing feature selection is reported in bold in Table 1. We grouped these features into categories by labor effort and also by their data collection method. The purpose of this labeling was to determine if additional information that required additional labor to retrieve improved the accuracy of the algorithm’s ability to indicate a calf destined for clinical BRD diagnosis. We performed this analysis since we wanted to quantify the value of variables that are associated with calf health outcomes but are labor-intensive for a dairy producer to collect. All automated features were labeled as 0 effort. Manual features that were passively observed by visual observation on calves were labeled as 1 effort and included the outward visual signs of clinical BRD in calves. Manual variables requiring calf restraint were labeled as 2 effort and included passive immunity status, body weight, and rectal temperature. These groupings were used to evaluate what is the effort and prediction accuracy trade-off of a system, which indicates calves destined for clinical BRD status. A full summary of what features were fed to the machine learning after the selection process are listed in bold in Table 1, along with information regarding their effort category and data collection method.
3.6 Machine-Learning Predictions
3.6.1 Training and Testing Sets
It is common practice to split the data into a training set and a testing set when developing a machine-learning algorithm. A training set is a part of the dataset used to feed the data to the machine-learning model, which allows it to create the knowledge it needs in order to classify new samples accordingly. A testing set is the remaining portion of the dataset, which can be used to evaluate the algorithm performance. Figure 2 shows how our dataset was split into training and testing sets. Our machine-learning model was trained with only clinical BRD positive and clinical BRD negative samples. Not-sick and sick samples were balanced in the training set to avoid labeling bias from unbalanced data. We left out preclinical BRD samples from the training set since preclinical BRD samples had some similarity to both clinical BRD positive and clinical BRD negative samples that would have prevented proper training. Furthermore, not enough preclinical BRD samples were available to be used for training. A testing set was created for the diagnosis scenario, and another was created for the preclinical BRD scenario introduced in Section 3.1. For the preclinical BRD scenario, we trained the algorithm with varying proportions: 80% training and 20% testing of the data samples, 70% training and 30% testing, as well as 75% training and 35% testing. We chose the best algorithm performance (training 80% testing 20% data samples) to determine variables, which required labor to collect improved algorithm accuracy.
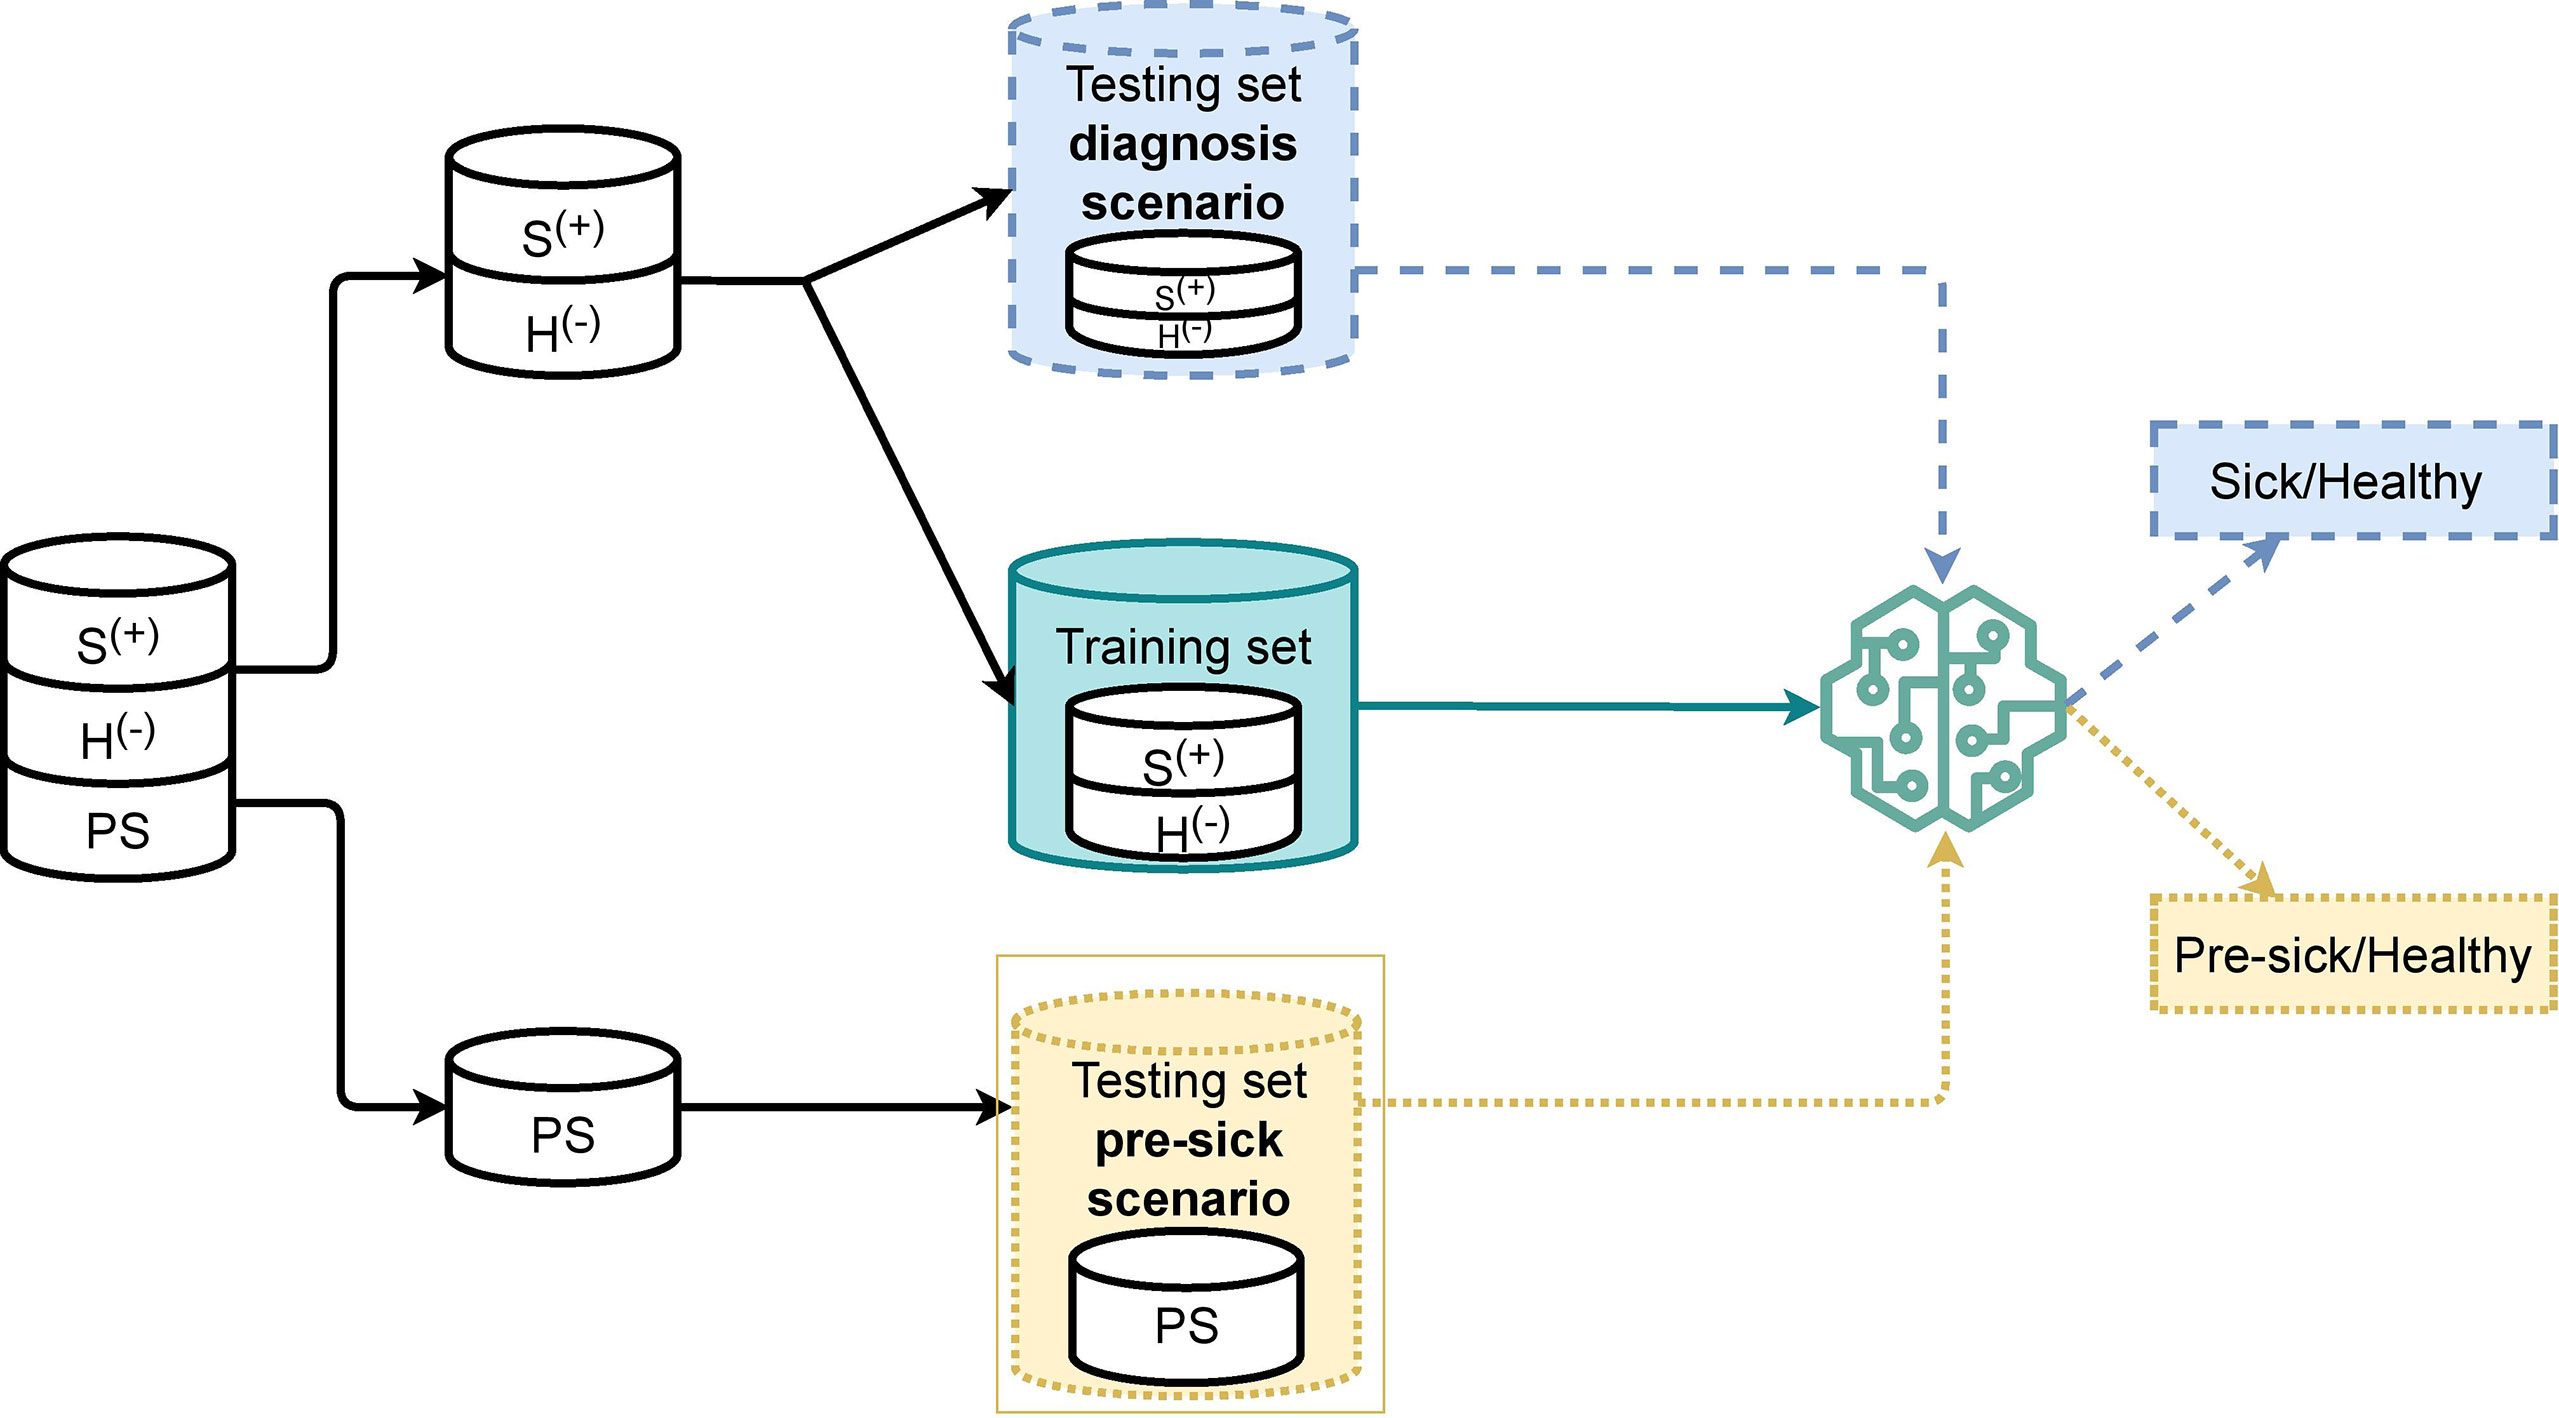
Figure 2 Overview of training and testing splitting scheme for a K-Nearest Neighbor algorithm to classify 106 calves as sick (S+) or without respiratory disease (H-) (diagnosis scenario), and to predict calves as pre-clinical BRD (PS) (pre-clinical BRD scenario) for Bovine Respiratory Disease.
Note that, as further discussed in Section 4, several iterations of cross-validation were performed for both training and testing sets to improve the robustness of our findings.
3.6.2 K-Nearest Neighbor Algorithm
We relied on a machine-learning algorithm that makes predictions based on a distance metric. Intuitively, we expected that, if any similarity existed between preclinical BRD calves and sick calves, a distance-based approach would be the best fit to predict preclinical BRD samples accordingly. Based on these assumptions, we decided to use the K-nearest neighbor (KNN) algorithm (Fix and Hodges, 1989). The idea behind this algorithm is shown in Figure 3. On a high level, the training process is equivalent to placing each sample in the training set in a multidimensional space and was shown as a bi-dimensional space in the figure for simplicity. The algorithm performed a prediction by projecting the sample in a multidimensional space. Then, it calculated the Euclidean distance of the k nearest samples and labeled the new samples by means of majority voting on the k nearest samples. Moreover, we used a kernel function that assigned weights to each sample and allowed a higher separation of data into a bigger multidimensional space, which increased the accuracy of predictions. This function was a major parameter of the algorithm along with the k number of neighbors used to make a prediction. In order to calculate the distance between a sample and its neighbors, we used a Euclidean metric coupled with a Gaussian kernel function: , where di is the Euclidean distance of a sample with a neighbor, and σ2 is a parameter we set experimentally, as explained in Section 4.2. In summary, the placement of a training sample in the multidimensional space was affected by a Euclidean distance and a weight given by our Gaussian kernel. Specific details on the values we set for σ2 and k, as well as any other important parameter such as window size are provided in Section 4.
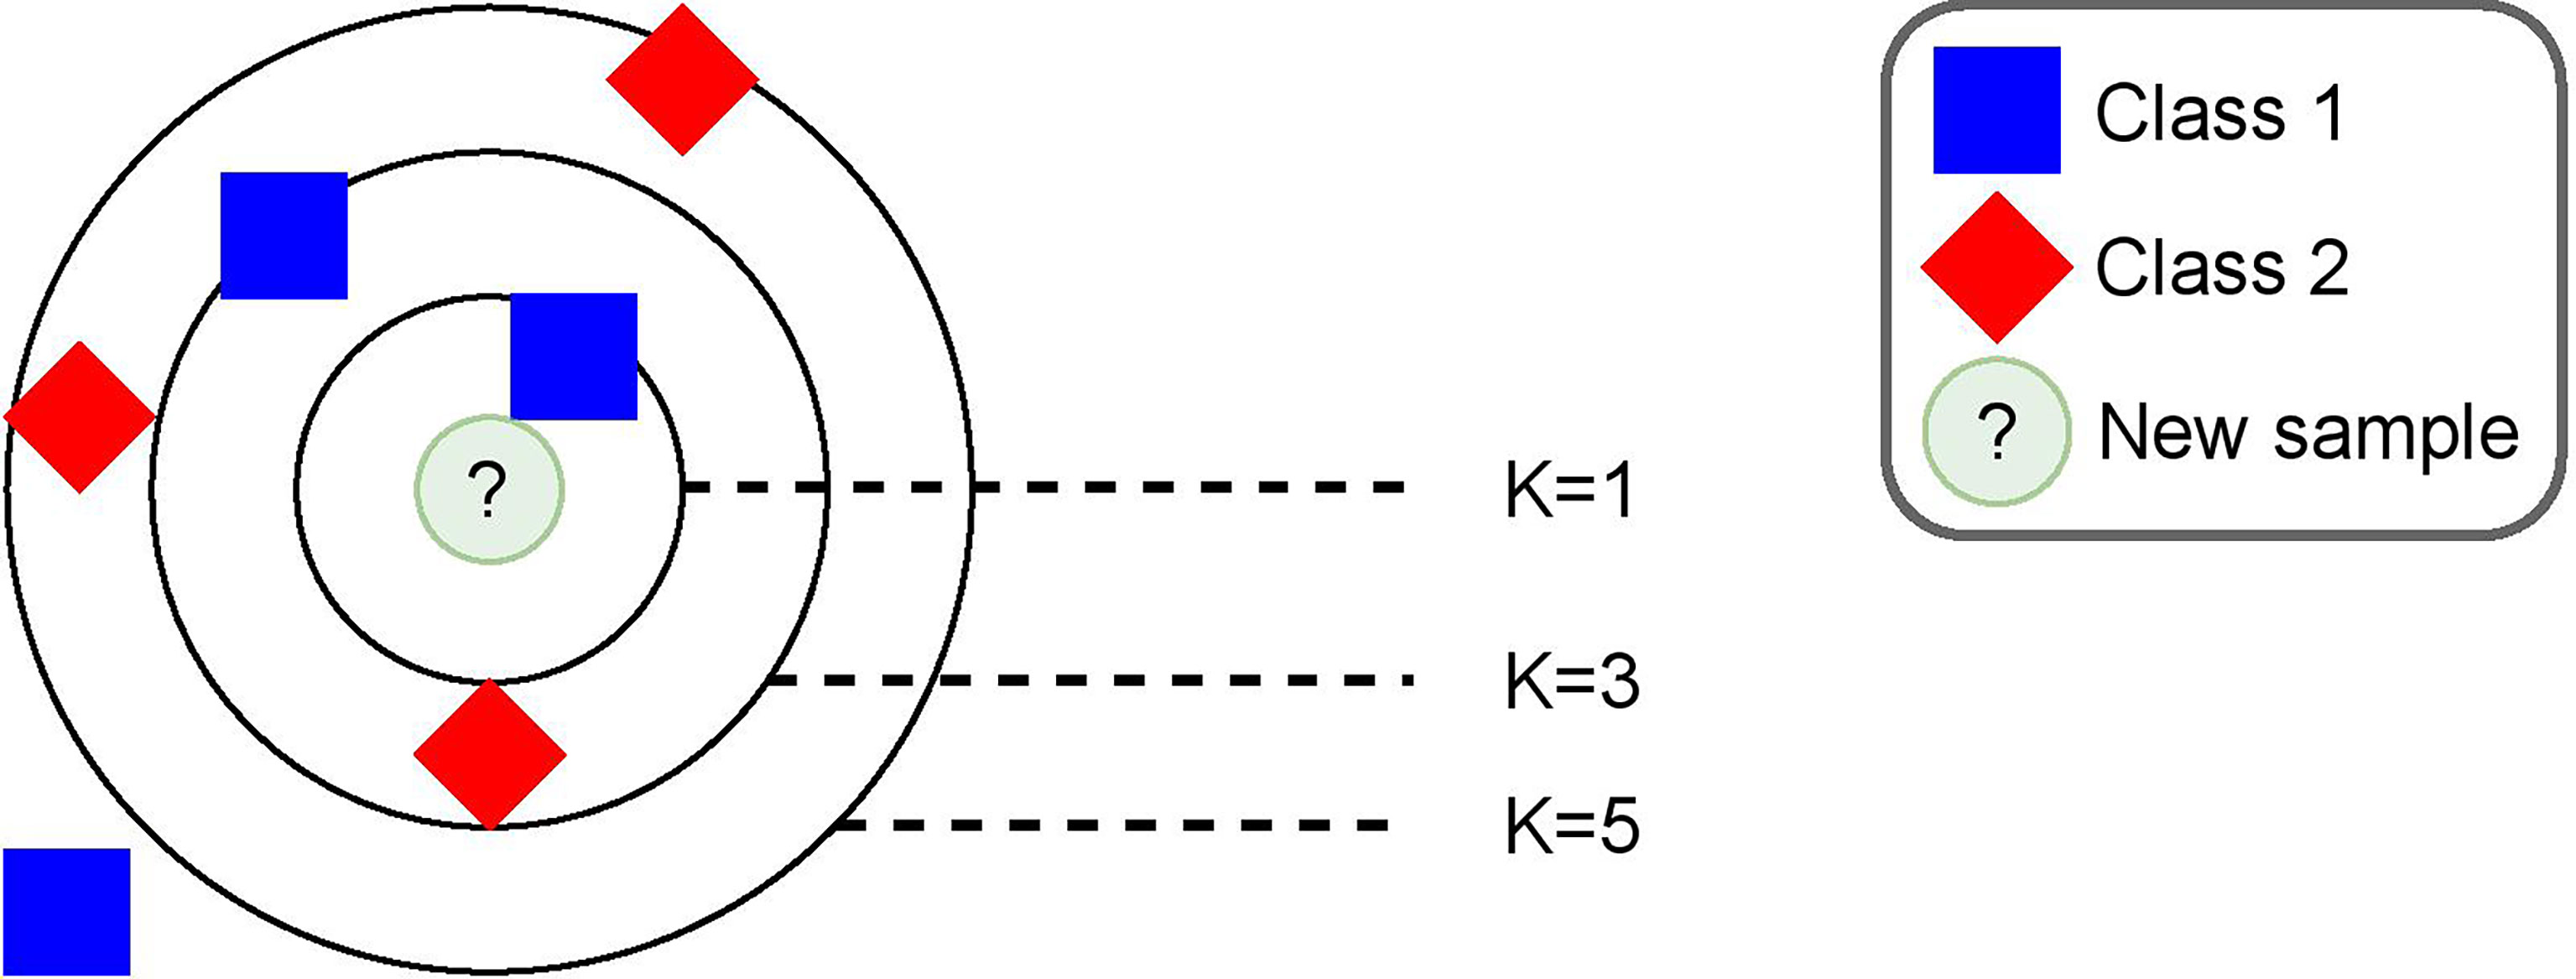
Figure 3 Intuitive diagram of KNN.
4 Results
In this section, we provide details about the experimental setup and show the performance of the proposed approach across different scenarios.
4.1 Population Parameters
Calves (54/106) were diagnosed with a clinical BRD bout on average at 29 ± 7 days. The proportion of calves with lung consolidation for the -14 days before clinical BRD diagnosis is shown in Figure 4. The majority of calves 64% (35/54) resolved lung consolidation 0 cm after the first antimicrobial treatment within 10 days after clinical BRD diagnosis. Calves that did not resolve lung consolidation after 10 days of antimicrobial treatment 35%(19/54) were monitored from day 11 to day 14, and since lung consolidation was still present, they were considered relapsed and re-treated at day 15 per veterinary protocol. Of the relapsed calves 3/19 did not resolve lung consolidation after the second antimicrobial intervention by day 30 (in relation to the first clinical BRD diagnosis), and these calves were euthanized per veterinary recommendation. A necropsy was performed on all calves and pneumonia was confirmed. The days on which a calf was still positive for lung consolidation 3cm2 were labeled as sick days for the algorithm to label data by day when a calf was not convalescent.
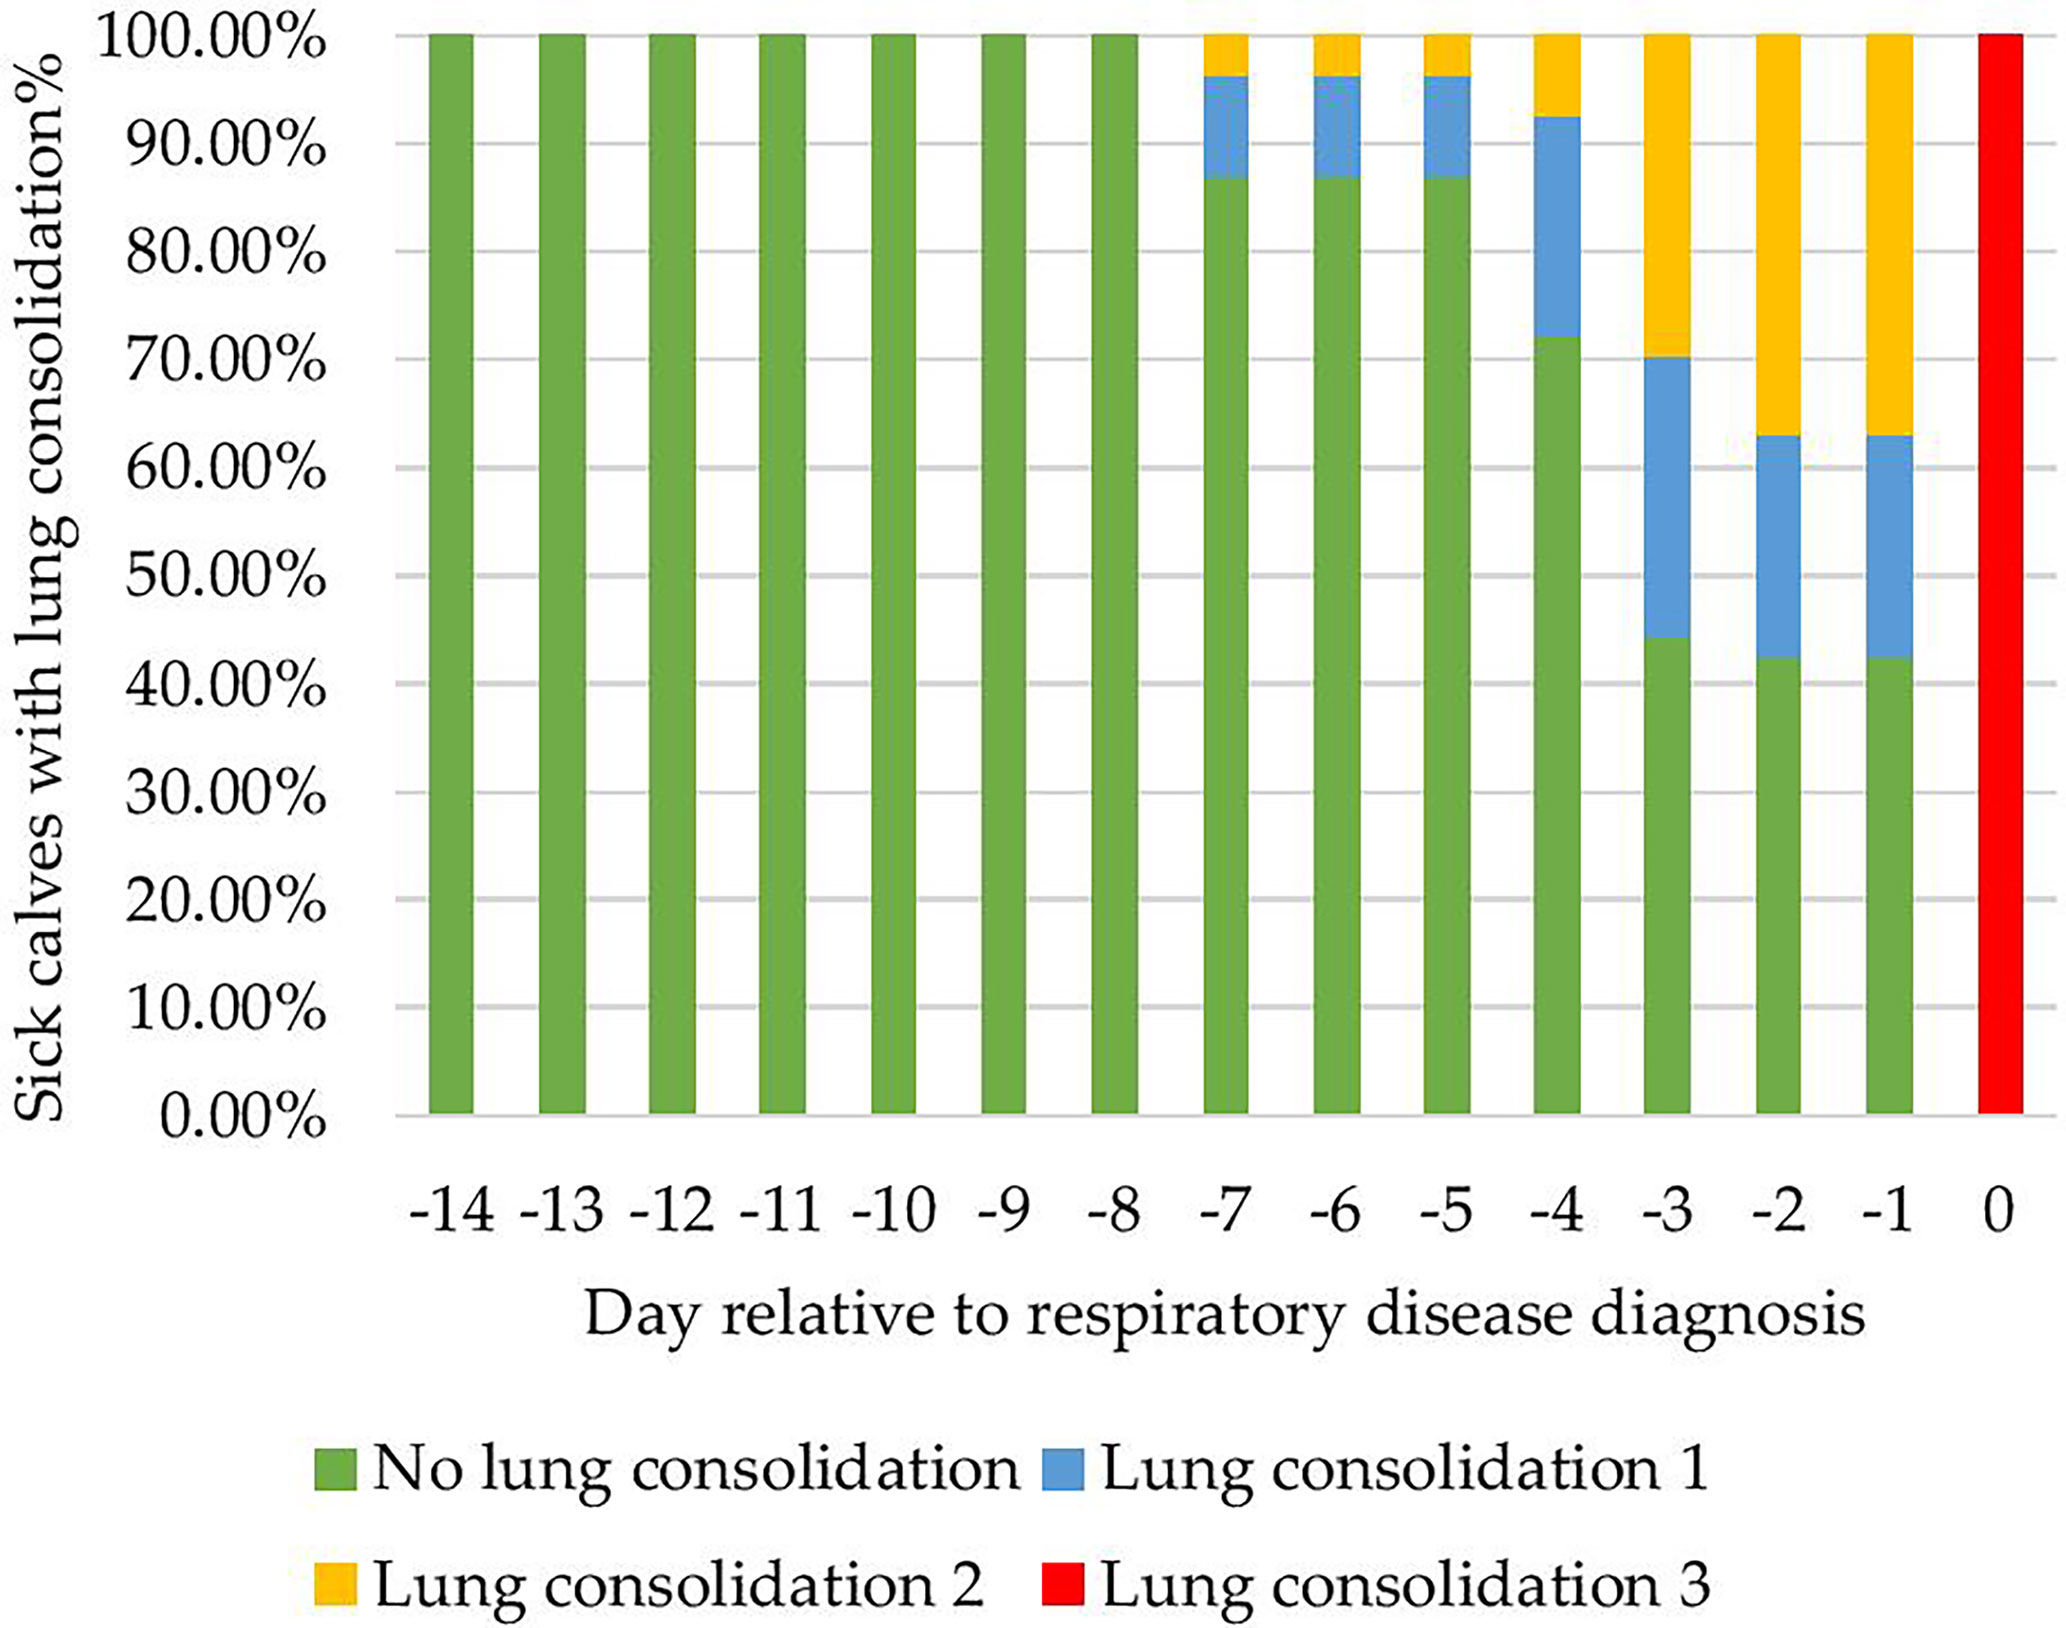
Figure 4 Proportion of 54 calves with lung consolidation in the 14 days prior to clinical bovine respiratory disease diagnosis.
4.2 Experimental Setup
We validated our approach for machine-learning predictions with the data described in Section 3 by creating training and testing sets as described in Section 3.6.1. Training and testing sets were split in 80% and 20%, respectively, and 10 runs of cross-validation were performed to provide robust results. We used the following settings for the KNN algorithm. These settings were identified by performing a grid search to provide the best results in terms of accuracy in the considered scenarios. The considered parameters were window size N, number of neighbors k, and σ2 (parameter of the Gaussian kernel presented in Section 3.6.2). Specifically, we tested N = {7,10,12,14}, k = {1,3,5,7} and σ2 = {2,4,6,8}. We found the best performing values to be N = 14, k =7, and σ2 = 2. Note that we tested the performance of other machine-learning algorithms such as support vector machines (Platt, 2004), random forest (Ho, 1995), and neural networks (Hopfield, 1982). We found that KNN outperformed such algorithms.
4.3 Diagnosis Scenario
We carried out the diagnosis scenario with the same model trained on 3 different feature sets, manual features + automatic features, only manual features, and only automatic features.
We found that the performance of KNN on the diagnosis scenario was nearly perfect, achieving an accuracy score of 0.99 on average and a standard deviation of 0.01, both for the prediction of sick and clinical BRD negative samples when using all the available features, as shown in Table 2. Briefly, the features of our dataset provided a clear separation between labeling data as sick or not, and that the fine-tuning of our KNN parameters accurately labeled sick and clinical BRD negative data. The manual feature KNN performed slightly but negligibly better than the automated feature KNN, while the KNN that used automatic features + manual features made close-to-perfect predictions. Thus, we suggest that the use of automated features may be useful to develop an algorithm to use these features to indicate clinical BRD status in calves.
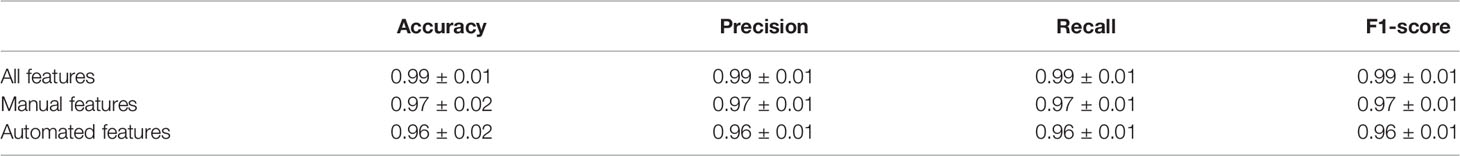
Table 2 Diagnose scenario: K-nearest neighbor algorithm’s accuracy, precision, recall, and F1 score for classifying 106 calves as sick (s(+)) or negative (H(-)) for bovine respiratory disease.
4.4 Preclinical BRD Scenario
We carried out the preclinical BRD scenario with the same model trained on 3 different feature sets, manual features + automated features, only manual features, and only automated features, as shown in Figures 5–8. Each data point represented the accuracy of the KNN prediction for a set of days prior to clinical BRD diagnosis, specifically from -1 to -14 days prior to clinical BRD diagnosis as represented using 80% training and 20% testing of the data samples. As shown in Figure 5, the PDT automatic features outperformed the manually collected features, and this KNN algorithm was highly accurate at up to -6 days prior to clinical BRD diagnosis. Thus, we suggest that feeding behaviors and activity levels may be useful indicators of changes in behavioral patterns in preclinical BRD calves. However, as calves approached clinical BRD diagnosis such as days -4 to -1, the manual + automatic features performed as well as the automatic feature KNN algorithm. We would expect that calves would demonstrate sickness behavior such as reduced feeding behavior and activity prior to clinical BRD diagnosis as this is well documented in the literature as reviewed by Morrison et al. (2021) and Costa et al. (2021). However, our KNN algorithm labeled calves as preclinical BRD quite early, at -6 days prior to clinical BRD diagnosis with an accuracy above 90%. Thus, we suggest that monitoring changes in mean + SD feeding behavior and activity levels of calves might be indicative of clinical BRD development. Our results suggest that a KNN algorithm might be well suited for monitoring feeding behaviors and activity levels daily to flag potential preclinical BRD calves, but more research is needed to test this in practice.
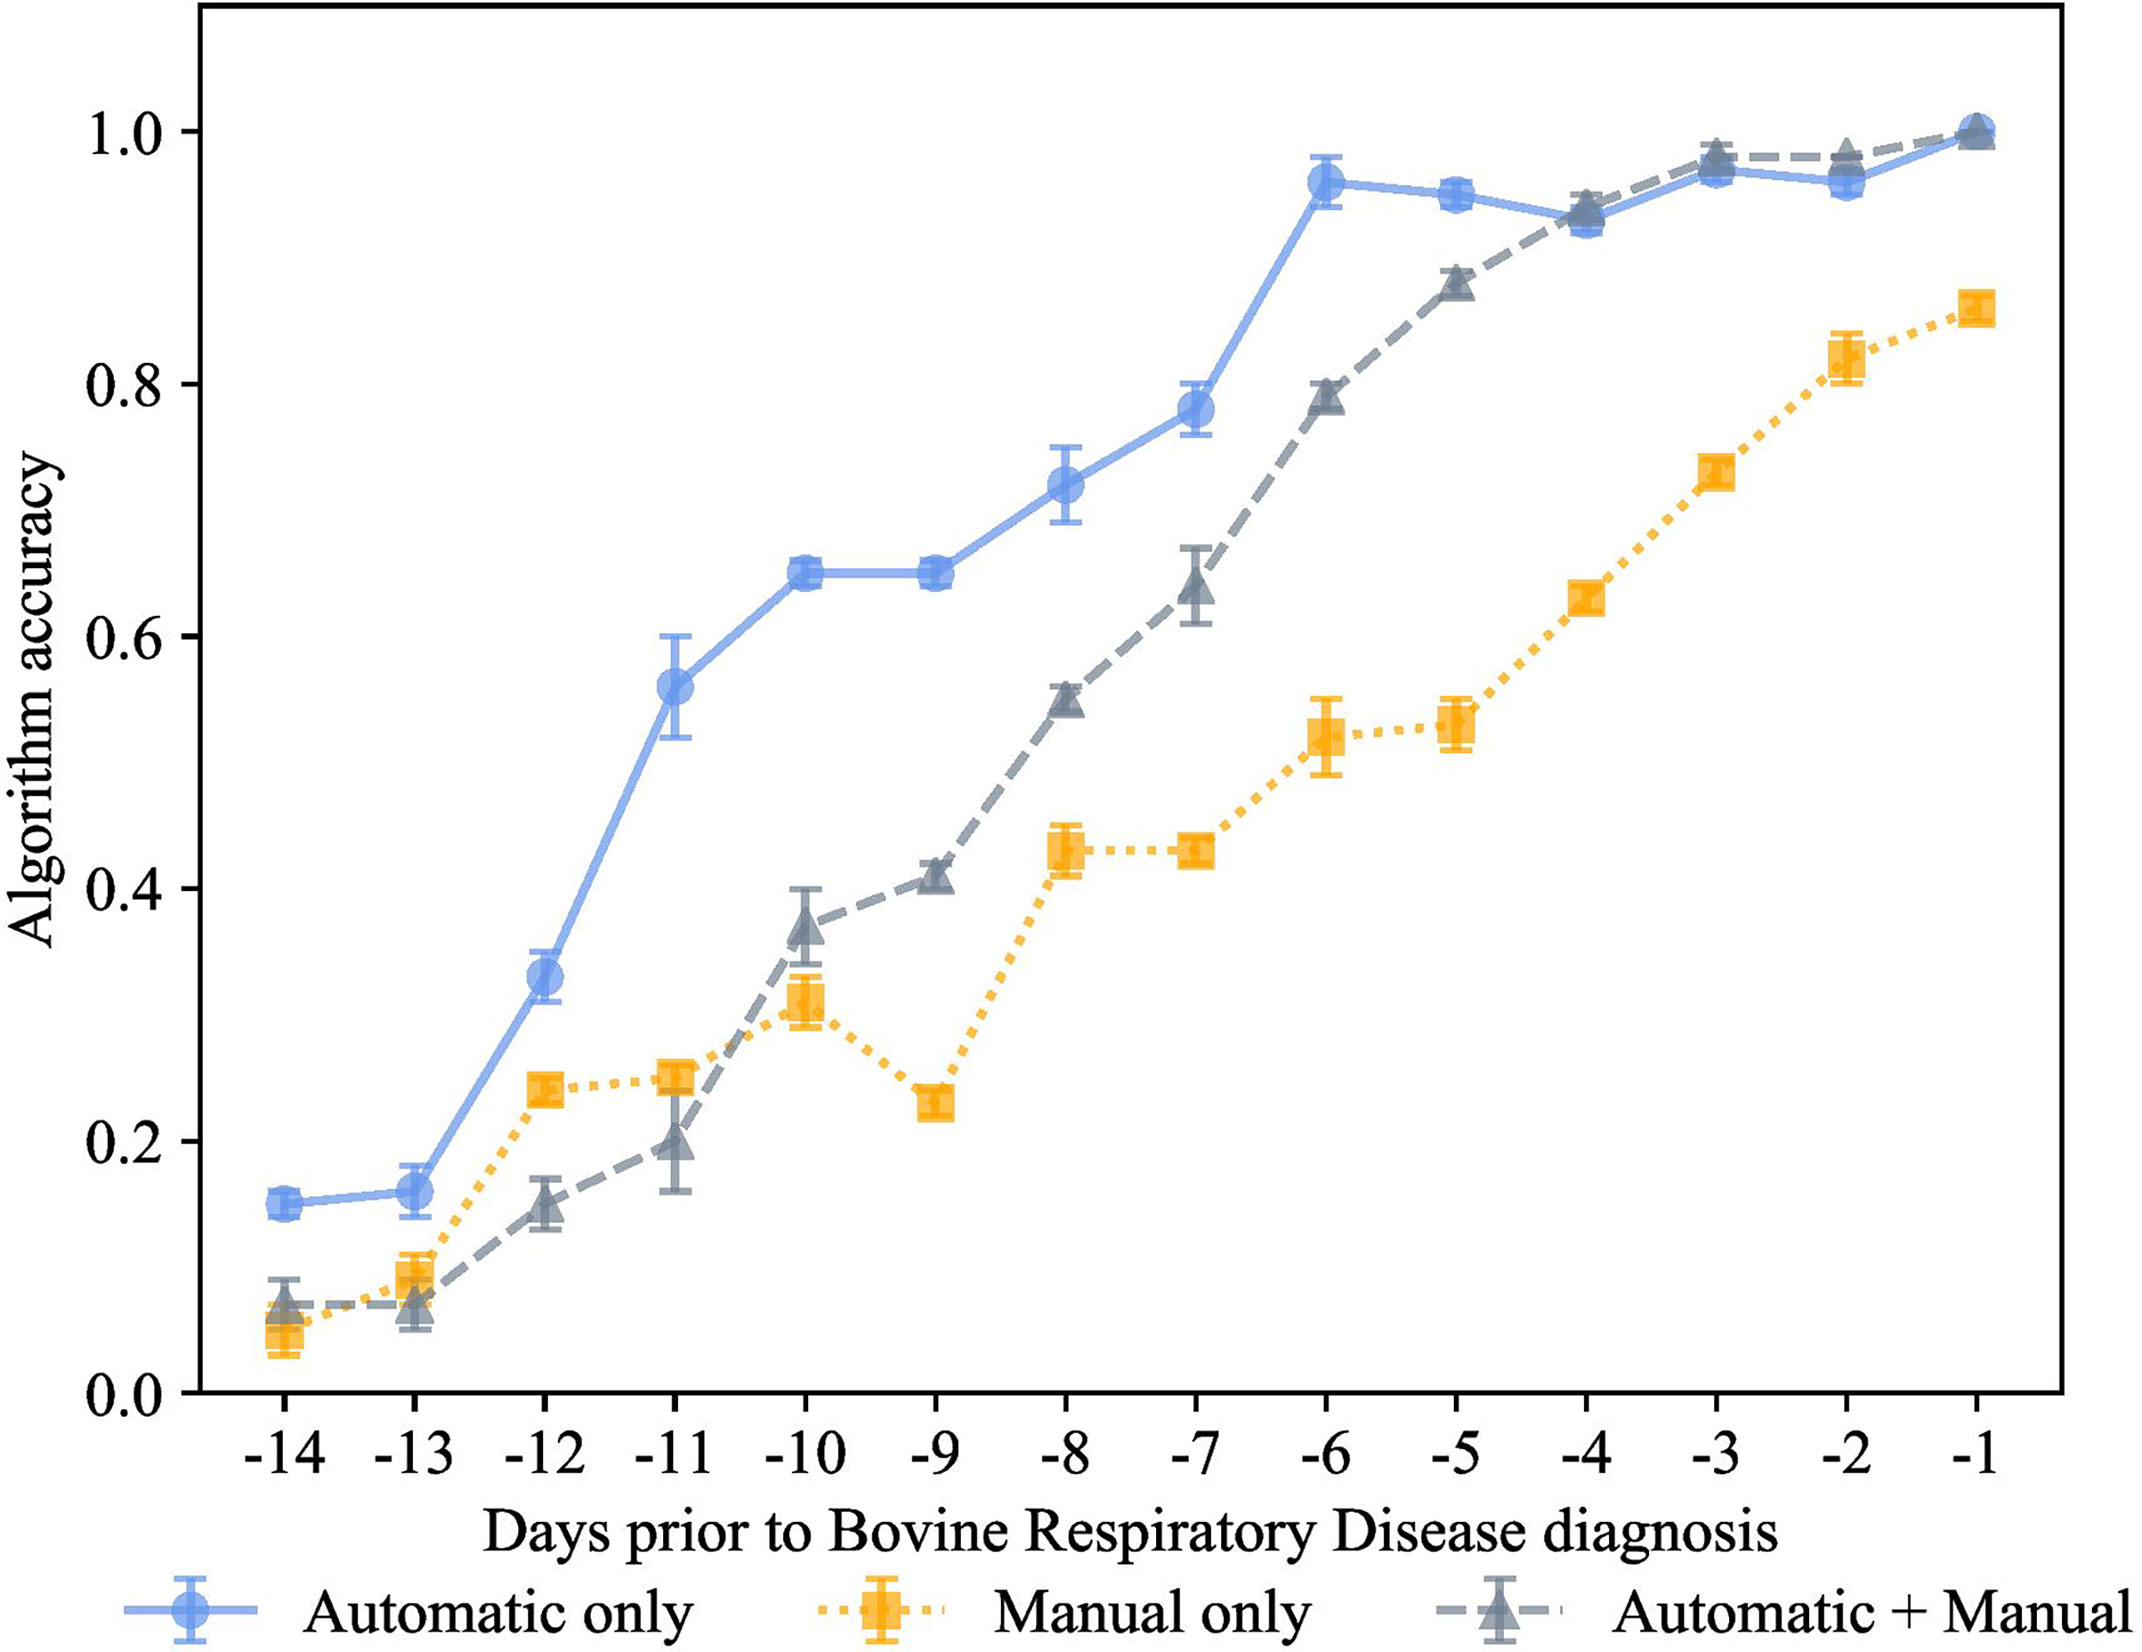
Figure 5 K-nearest neighbor’s algorithm accuracy (mean ± SD) with 80% of training and 20% of testing from 10 runs of cross-validation for predicting calves destined for bovine respiratory disease diagnosis using automatically collected features by an automated milk feeder and accelerometer and manually collected features using outward clinical signs of bovine respiratory disease in a 106 dairy calf cohort.
Finally, for the preclinical BRD scenario, we also used 70% training and 30% testing proportion as shown in Figure 6. The proportion of 70% training and 30% testing proportion is also shown in Figure 7. This was tested on the 3 different feature sets, manual features + automated features, only manual features, and only automated features. Each data point represented the accuracy of the KNN prediction for a set of days prior to clinical BRD diagnosis, specifically from -1 to -14 days prior to clinical BRD diagnosis. We see that varying the proportions for training and testing the data samples resulted in very similar performance to 80% training and 20% testing scenario. Specifically, high accuracy above 90% was observed for the KNN using only automated features for up to -6 days before clinical BRD diagnosis. The automated KNN performance with manual features was similar to the automated features-only algorithm starting at -4 days prior to clinical BRD diagnosis.

Figure 6 K-nearest neighbor’s algorithm accuracy (mean ± SD) with 75% of training and 25% of testing from 10 runs of cross-validation for predicting calves destined for bovine respiratory disease diagnosis using automatically collected features by an automated milk feeder and accelerometer and manually collected features using outward clinical signs of bovine respiratory disease in a 106 dairy calf cohort.
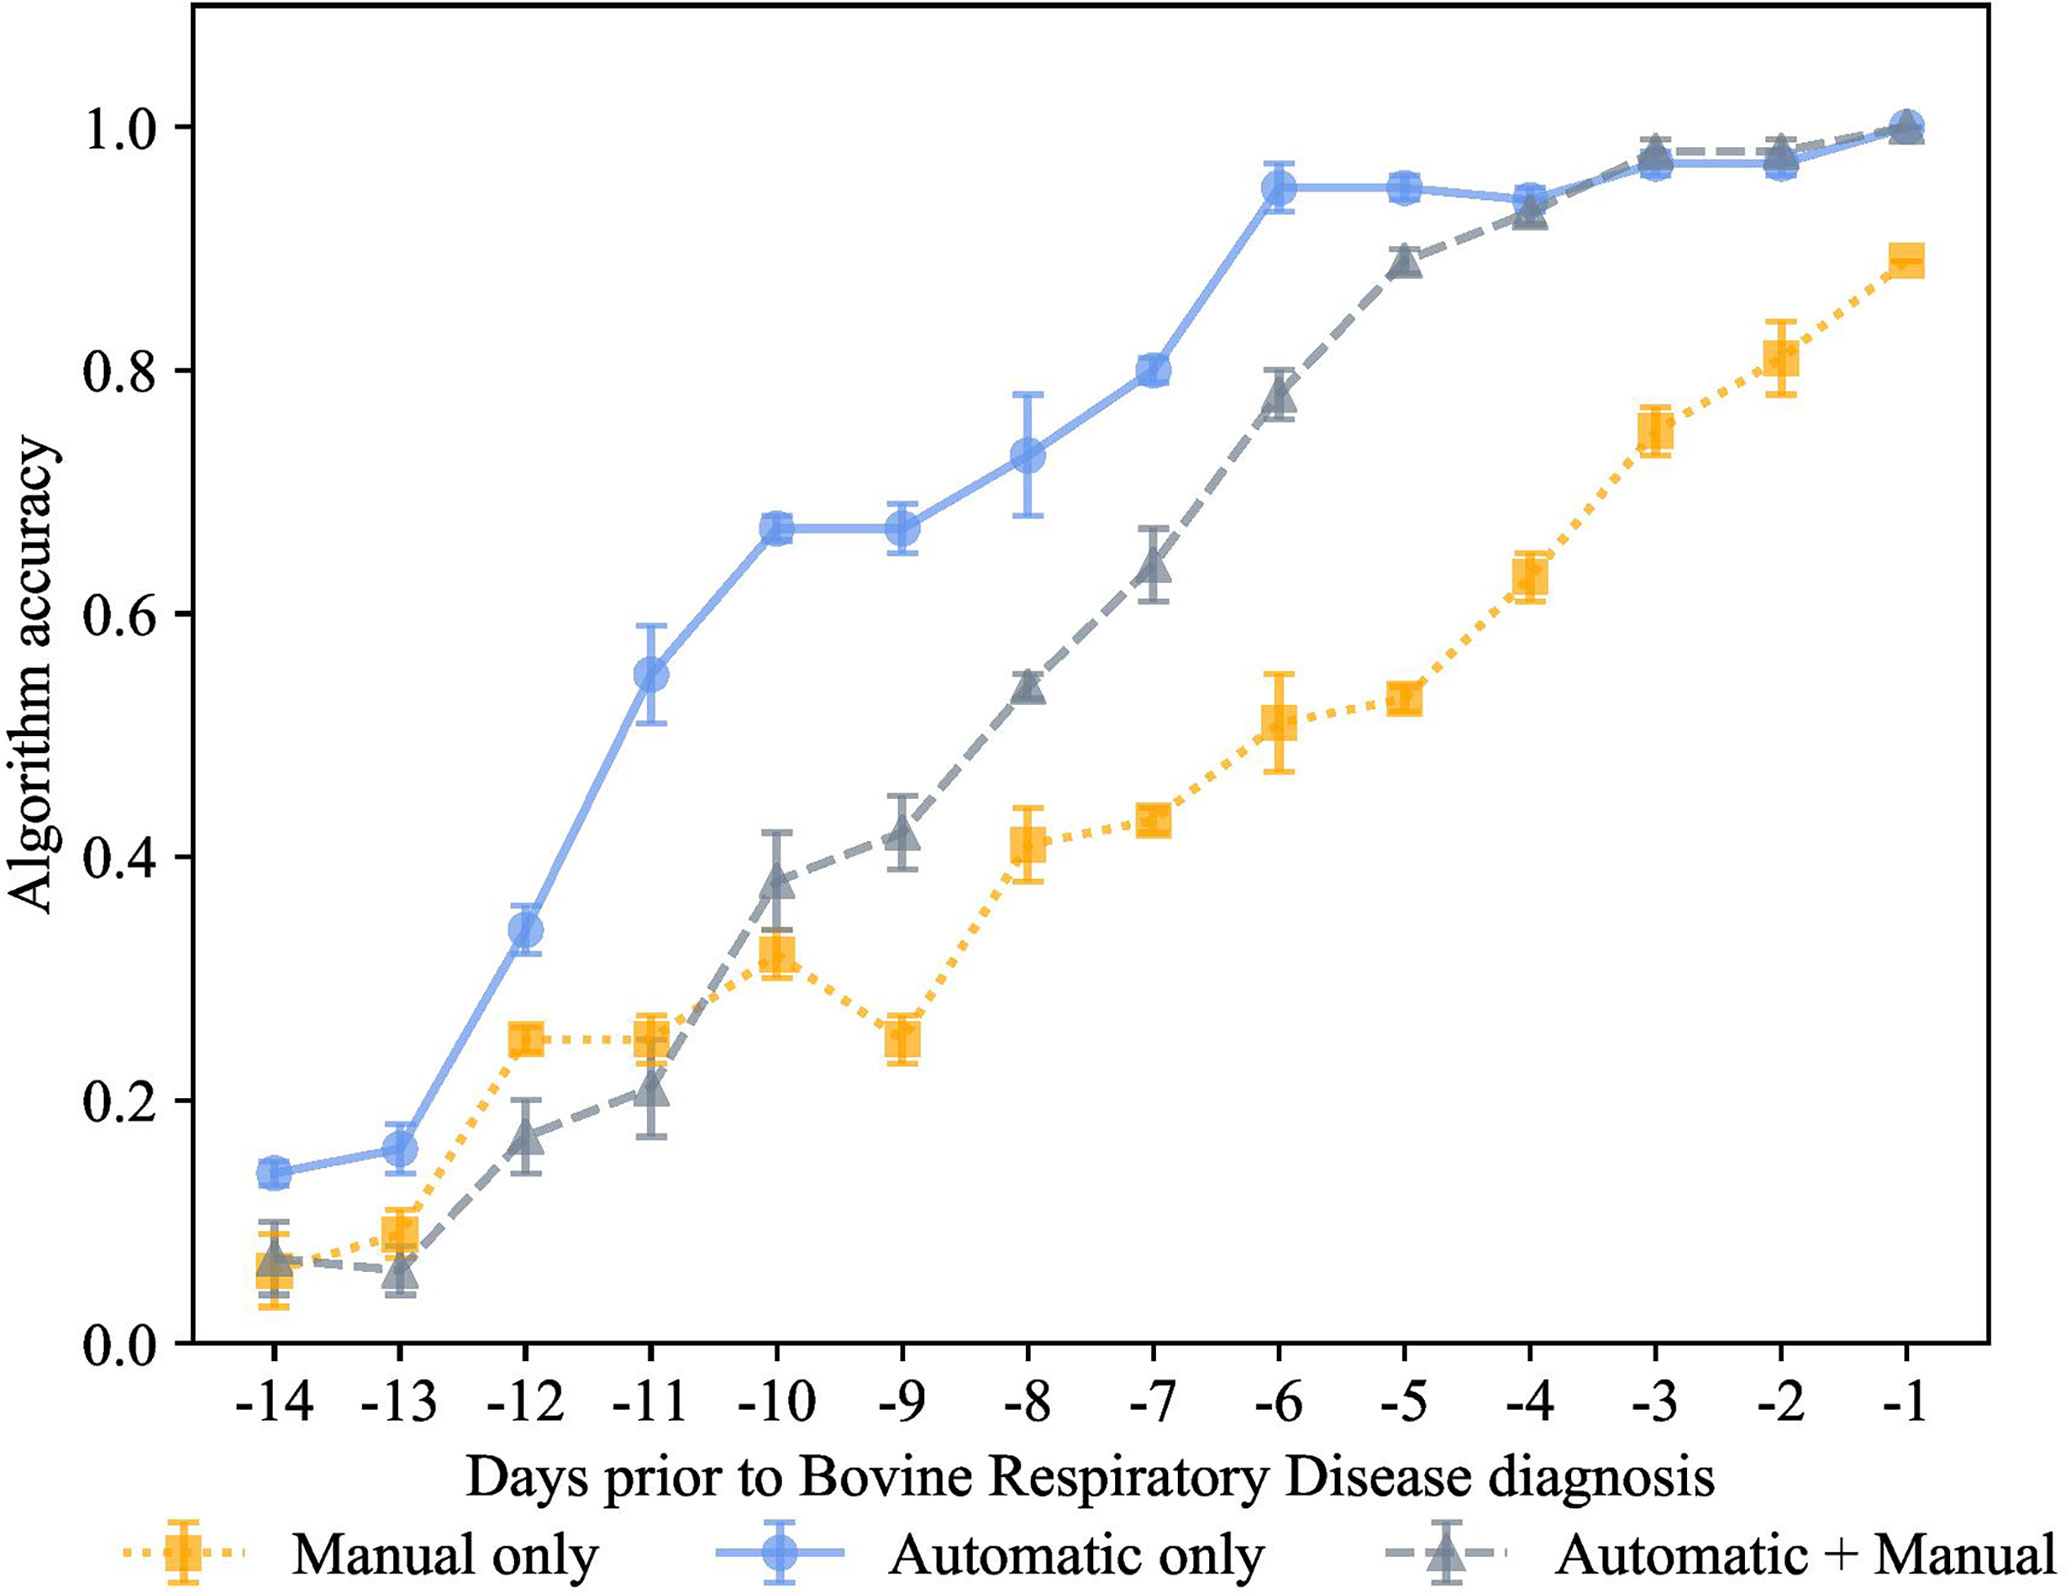
Figure 7 K-nearest neighbor’s algorithm accuracy (mean ± SD) with 70% of training and 30% of testing from 10 runs of cross-validation for predicting calves destined for bovine respiratory disease diagnosis using automatically collected features by an automated milk feeder and accelerometer and manually collected features using outward clinical signs of bovine respiratory disease in a 106 dairy calf cohort.
In the experiment shown in Figure 8, we combined automatic and manual features together. The goal of this experiment was to quantify the value of features considered essential for calf health, but which are difficult for dairy producers to collect. The subgroups were effort 0, automatic features, effort 1 outward signs of clinical BRD such as eye score, nasal score, ear score, labored respiration, cough score + automatic features, and effort 2 features requiring calf restraint that are associated with calf health outcomes body weight, passive immunity status, and rectal temperature + effort 0 and effort 1.
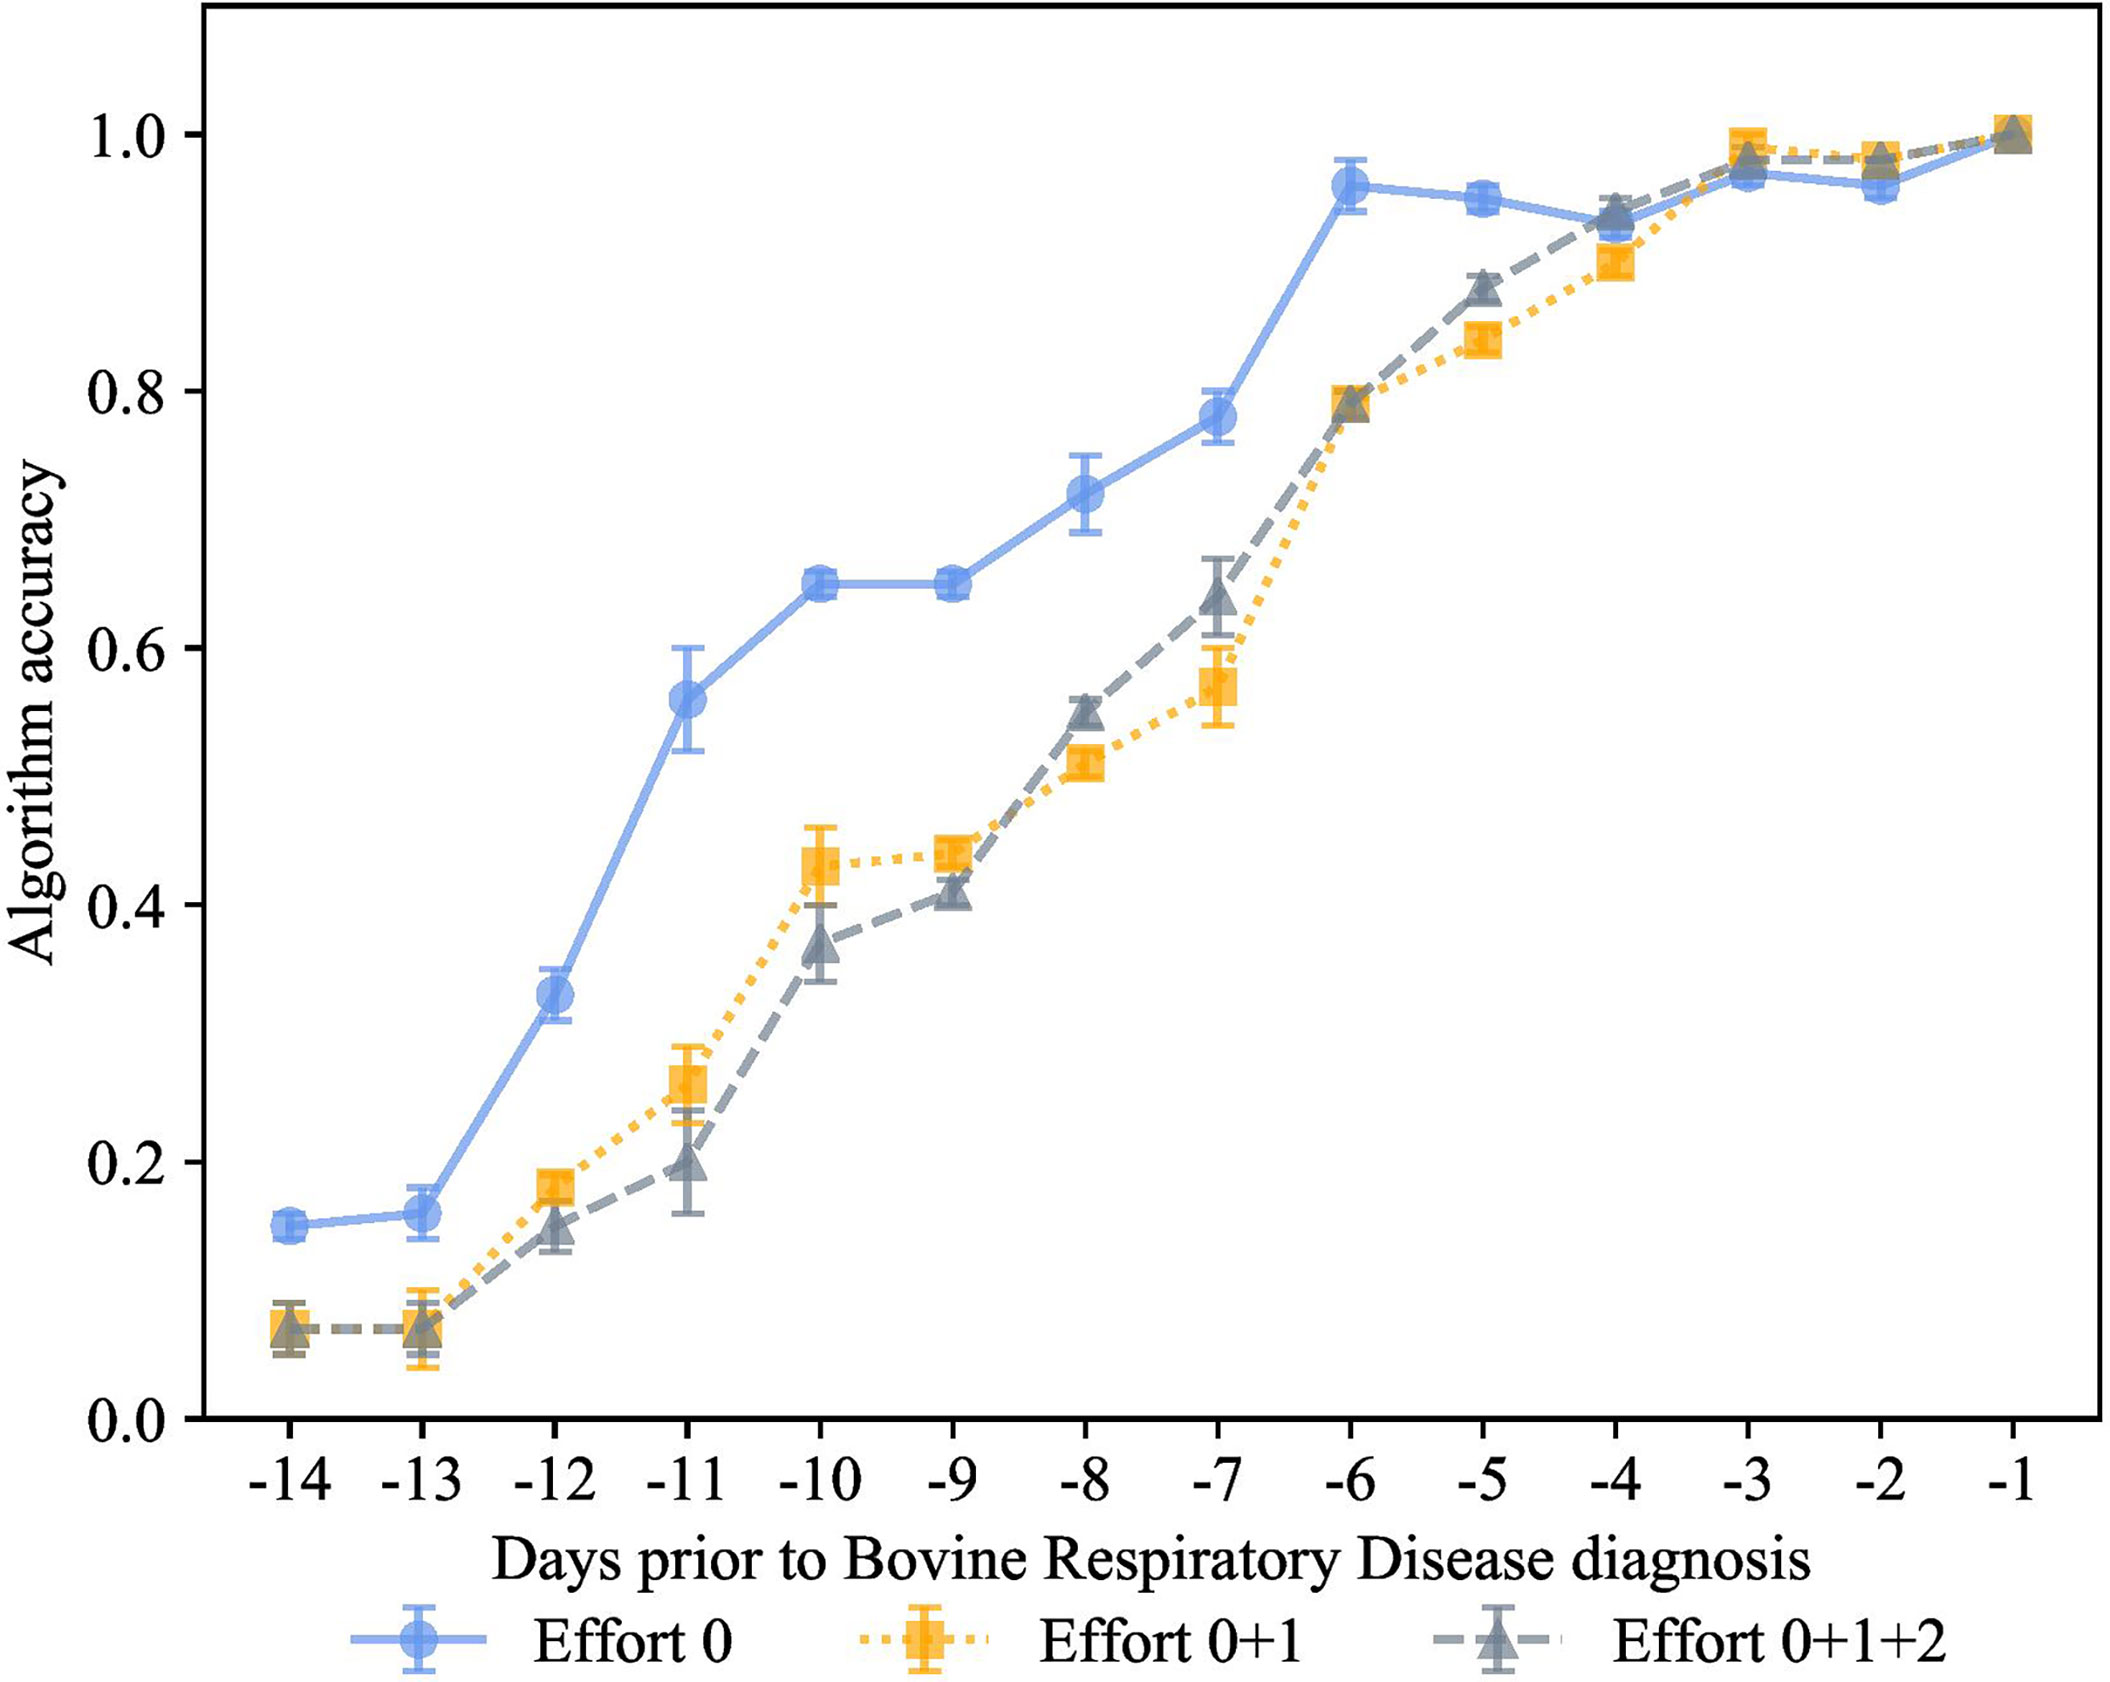
Figure 8 How much information is needed to accurately indicate calves destined for bovine respiratory disease diagnosis? K-closest neighbor’s algorithm accuracy (mean ± SD) from 10 runs of cross-validation for predicting calves destined for bovine respiratory disease diagnosis using effort 0 features recorded by an automated milk feeder and accelerometer (blue line), effort 1 features of outward clinical signs of bovine respiratory disease + effort 0 (yellow line), or effort 2 features requiring calf restraint such as body weight, passive immunity status at 48 h of age, and rectal temperature + effort 0 + effort 1 (grey line) in a 106 dairy calf cohort followed for 50 days.
Surprisingly, the prediction accuracy of the algorithm was only slightly improved when effort categories were combined. However, higher effort categories (effort 1 and effort 2) only negligibly improved the prediction performance in the first -3 days prior to diagnosis, while the performance of automatic features alone guaranteed great accuracy as early as -6 days prior to diagnosis. To the best of our knowledge, no prior work was able to achieve similar performance in the context for identifying calves destined for clinical BRD status. Furthermore, precision technology data can accurately classify calves preclinical BRD with bovine respiratory disease.
5 Discussion
The objective of this study was to use a novel approach to the industry challenge of automatically finding calves that were positive for clinical respiratory disease. A secondary objective was to determine which variables were fundamental for high algorithm accuracy. Specifically, we investigated the accuracy trade-offs for predicting calves’ clinical BRD bouts including investigating the value of features, which required high effort to retrieve from calves. We found that a KNN algorithm was very highly accurate and very precise at classifying calves as clinical BRD positive and clinical BRD negative. Furthermore, this algorithm performed well for the preclinical BRD scenario, in the 14 days prior to clinical BRD bout diagnosis. Specifically, the accuracy of this algorithm using only automatic features was over 0.96 up to six days before clinical BRD bout diagnosis compared to the algorithm accuracy of 0.52 for manual attributes at this timepoint, and algorithm performance was similar for varying proportions of training and testing the data samples. This was sooner than we predicted, demonstrating the applicability of this algorithm for future development regarding respiratory status in calves. Furthermore, we observed that high effort variables such as body weight, rectal temperature, and passive immunity status at 48 h of life only negligibly improved the accuracy of indicating clinical BRD status in calves. We suggest that feeding behaviors and activity levels generated by precision technology in conjunction with seasonal data are excellent features for indicating calves at risk for respiratory disease using a KNN algorithm. Future research should investigate the potential of this algorithm for use in real time on a commercial facility.
In this study, we used machine learning due to its ability to exploit the training data in order to label unseen data. Furthermore, advanced statistical techniques such as controlled variable charts were not successful at classifying disease status in dairy calves when feeding behavior was used (Knauer et al., 2018). Thus, we opted to use machine-learning techniques, and specifically KNN, to investigate the potential of sickness behavior in calves to indicate clinical BRD status. Specifically, because our biggest goal was to classify preclinical BRD calves, we employed a KNN algorithm due to its ability to label samples based on the nearest neighbors. In fact, after training the model with not-sick and sick calves, we were able to detect preclinical BRD calves that exhibited behaviors similar to the sick calves accordingly.
It is well known that there is an association of decreased feeding behavior (Morrison et al., 2021) and reduced activity levels (Duthie et al., 2021) up to three days before diagnosis of respiratory disease in calves. Sickness behavior precedes clinical signs of disease in mammals (Hart and Hart, 2019), and thus behavior can be an early indicator of a calf at risk for disease diagnosis. However, to our knowledge, only one research study has used machine-learning techniques to identify respiratory disease in calves. Bowen et al. (2021) investigated the potential of decision trees (e.g., random forest) and deviations from average lying time to indicate respiratory disease in calves. Bowen et al. (2021) observed a moderate sensitivity (=0.54) and accuracy (=.75) to indicate respiratory diseases in calves when both a random forest algorithm and deviations in rolling average lying time were used. This disagreed with our findings, where we observed a very high accuracy and precision for the algorithm to classify clinical BRD positive and clinical BRD negative calves. Our findings likely disagreed with Bowen et al. (2021) since we used a different machine-learning algorithm, and we also classified clinical BRD using both outward signs of clinical BRD and lung ultrasonography, which was recently validated as a diagnostic tool (Berman et al., 2021). While Bowen et al. (2021) observed a very high specificity (=0.95) when combining both feeding behavior and activity levels, only a moderate sensitivity (=0.54) and accuracy (=0.75) were observed; it is possible that these were the limitations of the Wisconsin scoring system used to diagnose respiratory disease in that study. Furthermore, decision-tree algorithms are excellent data mining tools, but the categorical output is highly dependent on how root nodes are classified as input data (Charbuty and Abdulazeez, 2021). Thus, it is likely that our data differed from Bowen et al. (2021) due to our daily health scoring and the different machine-learning techniques used.
We observed 28 features that were valuable to the KNN for labeling clinical BRD calves. Some of these manual features were selected as they were used to label a calf as clinical BRD positive on day 0. These manual features such as nasal score, eye score, ear score, cough score, and rectal temperature were part of a system validated for diagnosing calves with respiratory disease, the Wisconsin Scoring System (McGuirk and Peek, 2014). Respiration score was also found to be a useful manual feature, and labored breathing is part of the UC Davis scoring system to indicate respiratory disease in calves (Love et al., 2016). Therefore, it is not surprising that these manual health features were found to be useful for the algorithm. We also observed that 48-h serum BRIX was a useful feature in this study. Serum BRIX at 48 h is an indirect measure of passive immunity status in dairy calves, and recently a higher total IgG at this age was associated with improved health outcomes in calves (Lombard et al., 2020). Therefore, we suggest to researchers that even if enrollment criteria for passive immunity status are required for a health study, researchers should collect this information as it is valuable. However, we were surprised that the ultrasound score was removed during the leave-one-out approach during our feature selection. Ultrasound score was used to label calves with clinical BRD status on day 0, and ultrasound score is considered as good as radiography for diagnosing calves as respiratory disease positive when hospitalized (Berman et al., 2021). However, Berman et al. (2021) used calves with severe nonresponsive respiratory disease; it is possible that in early disease development, ultrasonography is not valuable to predicting disease when other variables such as behavior are provided about the calf. We also observed that body weight was removed during our feature selection process. Rhodes et al. (2021) observed that decreased average daily gains in calves occurred after diagnosis with lung consolidation. It is possible that in the early phase of disease development, body weight is not a useful indicator, or alternatively, perhaps the inclusion of many other important variables such as feeding behavior, activity levels, and seasonal information explains some of the variation that ultrasound score may have added to the algorithm. Season is a well-known indicator for calf health as calves are easily subject to cold stress due to low brown fat reserves and a high body/surface ratio when compared to cows (NRC, 2001).
All of the features collected by the automated feeder except percent of milk intake consumed, which was highly correlated with milk intake, were useful in this study for indicating clinical BRD status in calves. For automated feeding behavior, we observed that mean milk intake, starter intake, mean and SD visits to the automated feeder, and mean and SD drinking speed were valuable for labeling these calves as preclinical BRD when destined for clinical BRD status. As discussed above, a wealth of literature has observed that feeding behaviors are associated with respiratory disease in calves. For example, prior to disease diagnosis, sick calves had lower milk intakes up to - 5 days, slower drinking speeds up to -4 days, and unrewarded visits up to -3 days when compared to healthy calves (Morrison et al., 2022). Similar results were also observed in Cantor and Costa (2022) who offered calves with milk levels similar to this study, milk intake, and unrewarded visits, and starter intakes were lower within the -5 days prior to diagnosis of respiratory disease when compared to healthy calves. Indeed, Cantor and Costa (2022) also observed that individual calves had relative changes in their own unrewarded visits and starter intake prior to disease diagnosis when day -5 was set as a baseline. However, we also found rewarded visits as a valuable feature in this study, which disagreed with the findings of others who found no association with disease status with linear mixed modeling approaches (Duthie et al., 2021; Morrison et al., 2021; Cantor and Costa, 2022). Perhaps rewarded visits are a useful feature when used collectively with other feeding behavior information, but that rewarded visits alone as an outcome are not associated with clinical BRD status in calves. This is an advantage of machine learning: we can use a collective of features to make meaningful predictions rather than one variable at a time (Coates et al., 2011). This body of literature suggests that, in fact, calves do exhibit sickness behavior prior to disease diagnosis and that feeding behavior may be useful features to include in a machine-learning algorithm, which identifies calves destined for diagnosis of respiratory disease.
We also observed that several activity levels collected by a pedometer were useful for indicating clinical BRD status in the calves in this study. For activity levels, we observed that mean and SD lying time and lying bouts, as well as mean total step counts, were useful features for the algorithm to correctly identify clinical BRD status in these calves. Our findings agree with others who have used activity levels in association with respiratory disease in calves using mixed linear modeling approaches. For example, Duthie et al. (2021) observed that calves increased their lying times and decreased their lying bouts for the three days prior to diagnosis compared to healthy calves. Cantor and Costa (2022) also observed that calves increased their lying times, but that these calves also decreased their lying bouts and step counts, and activity index within the -5 days prior to diagnosis with respiratory disease. Once accounting for relative changes in individual calf behavior, Cantor and Costa (2022) observed that activity levels were no longer associated with disease status in the calves when day -5 was used as a baseline. However, Bowen et al. (2021) quantified that lying time yielded the best sensitivity for indicating respiratory diseases in calves when using a decision-tree algorithm as a machine-learning approach. Thus, it is not surprising that activity levels in this study were useful features to include in our algorithm. This body of literature suggests that calves do exhibit signs of lethargy such as less activity in general prior to diagnosis with respiratory disease, and that activity levels may be useful features to include in a machine-learning algorithm, which identifies calves destined for disease diagnosis. Future research should investigate the value of individual features to indicate respiratory disease in calves.
To our knowledge, this study was the first to develop a highly accurate algorithm for indicating a preclinical BRD calf approaching a clinical BRD diagnosis while also investigating the value of different features. However, there are a myriad of machine-learning applications that have predicted the onset of disease status in lactating dairy cattle as reviewed by Slob et al. (2020). For example, support vector machine algorithms using automated milk quality features have accurately predicted mastitis (Miekley et al., 2013), and gradient boosted tree algorithms using automated milk quality features (Ebrahimi et al., 2019) have also accurately labeled mastitis in dairy cattle. Furthermore, random forest algorithms using deep learning and manually collected milk features (Hyde et al., 2020) were successful algorithms at labeling dairy herds with a high prevalence of mastitis. Support vector machine and decision-tree algorithms were also successful at indicating metabolic status in fresh dairy cattle using manually collected blood parameters (Xu et al., 2019). Thus, we can conclude that machine-learning algorithms are a useful application to identify cattle requiring further attention. While these studies did not use behavior-associated parameters, the results from these studies suggest that automated features are useful for machine learning, and this is partially due to the frequency of which these data can be collected. For example, Borchers et al. (2017) was successful at predicting calving onset in lactating dairy cattle using activity behavior and automated rumination data due to the frequency at which these data were retrieved. Thus, we suggest that machine learning has a value for indicating behavioral changes in calves. We suggest future research should investigate the potential of KNN algorithms for indicating respiratory status in calves in a commercial setting.
There were some limitations for this study. One of the limitations for this study is that we used retrospective data in a research facility. While we can state that the algorithm used was successful in indicating a calf destined for clinical BRD diagnosis, this cannot replace diagnostics on farm at this time. Another limitation to this study was the use of data samples to train and test the algorithm. We suggest that a larger sample size is required to determine if algorithm performance varies using animals rather than data samples for testing and training. There is large individual variability in feeding behavior and activity levels in calves (Cantor and Costa, 2022), and thus, more animals are required to represent clinical BRD if the algorithm is trained in this way. However, we still believe that this novel exploration of using features to classify clinical BRD status in calves is useful for the reader since only one other study has used machine-learning techniques to classify respiratory disease in calves using decision trees, and that study only used a definition for disease that has limited sensitivity (Bowen et al., 2021). This study is proof of concept that automated features may be useful for indicating clinical BRD status in calves, but we cannot use this algorithm on farm in this setting. Future research is needed to validate this algorithm on farm and to test algorithm performance when using individual calves to train and test the algorithm. Finally, while we can indicate that the feeding behaviors and activity levels used in this algorithm were excellent at indicating a calf destined for clinical BRD, we did not evaluate which features were most impactful. The next direction for our research is to determine which features had the highest contribution to explain variance associated with clinical BRD status in this study.
In summary, we observed that a KNN algorithm can accurately and precisely label calves as clinical BRD positive or negative. Furthermore, a KNN algorithm can very accurately label a calf destined to develop clinical BRD at up to six days beforehand using feeding behavior, activity level, and season-related features. Furthermore, the addition of intensive features that require calf restraint to collect only negligibly improved the performance of our algorithms. This study demonstrated the value of precision dairy technology as a utility tool for flagging calves as potentially sick for clinical BRD and future research is needed to refine this algorithm for use on farm.
6 Conclusion
We observed that the KNN algorithm accurately and precisely labeled calves as clinical BRD positive or clinical BRD negative. We also found that a KNN algorithm can accurately indicate approaching clinical BRD status in calves when just precision dairy technology devices were used at up to 6 days prior to clinical BRD diagnosis when compared to a KNN that used only physical signs of disease about the calf, which was accurate at two days prior to clinical BRD diagnosis. Similarly, varying the training and testing proportions of the dataset resulted in similar algorithm performance for diagnosing calves as preclinical BRD prior to clinical BRD status. Thus, we suggest that precision technology and machine learning holds tremendous potential for indicating respiratory disease in calves. Finally, manual features that require calf restraint such as body weight, passive immunity status, and rectal temperature only negligibly improved algorithm accuracy for labeling preclinical BRD calves. Thus, we suggest that the use of automated features from an automated feeder, a pedometer, and a seasonal data logger may be useful for future algorithm development. Future research needs to develop this algorithm on farm to detect calves at risk for respiratory disease in real time.
Data Availability Statement
The raw data supporting the conclusions of this article will be made available by the authors, without undue reservation.
Ethics Statement
The animal study was reviewed and approved by the University of Kentucky’s Animal Care and Use Committee approval number 2018: 2864.
Author Contributions
MC collected the data. EC analyzed the data. MC and EC wrote the manuscript. SS, DR, and JC provided supervision, interpreted the data, and provided critical feedback on the manuscript. All authors contributed to the article and approved the submitted version.
Funding
The research for this study was funded by a United States Department of Agriculture NIFA Hatch Grant Project KY007100 at the University of Kentucky and by the National Science Foundation Smart and Connected Communities grant nr. 1952045 “SCC-IRG Track 2: Smart Integrated Farm Network for Rural Agricultural Communities (SIRAC).
Conflict of Interest
The authors declare that the research was conducted in the absence of any commercial or financial relationships that could be construed as a potential conflict of interest.
Publisher’s Note
All claims expressed in this article are solely those of the authors and do not necessarily represent those of their affiliated organizations, or those of the publisher, the editors and the reviewers. Any product that may be evaluated in this article, or claim that may be made by its manufacturer, is not guaranteed or endorsed by the publisher.
Acknowledgments
The authors also thank IceRobotics for the pedometer data. The authors would like to thank Megan Woodrum Setser, Charlotte Pertuisel, Justine Alary, Clemence Dudoit, Mathilde Campedelli, Giulia Gobbo Rodrigues, Anna Hawkins, Gustavo Mazon, Emily Rice, Maria Eduarda Reis, and all other staff and students for assistance with the trial.
Footnotes
References
Berman J., Masseau I., Fecteau G., Buczinski S., Francoz D. (2021). Comparison of Thoracic Ultrasonography and Thoracic Radiography to Detect Active Infectious Bbronchopneumonia in Hospitalized Dairy Calves. J. Veter. Internal Med. 35, 2058–2068. doi: 10.1111/jvim.16157
Borchers M., Chang Y., Proudfoot K., Wadsworth B., Stone A., Bewley J. (2017). Machine-Learning-Based Calving Prediction From Activity, Lying, and Ruminating Behaviors in Dairy Cattle. J. Dairy. Sci. 100, 5664–5674. doi: 10.3168/jds.2016-11526
Bowen J., Haskell M., Miller G., Mason C., Bell D., Duthie C. (2021). Early Prediction of Respiratory Disease in Preweaning Dairy Calves Using Feeding and Activity Behaviors. J. Dairy. Sci. 104, 12009–12018. doi: 10.3168/jds.2021-20373
Buczinski S., Forté G., Francoz D., Bélanger A.-M. (2014). Comparison of Thoracic Auscultation, Clinical Score, and Ultrasonography as Indicators of Bovine Respiratory Disease in Preweaned Dairy Calves. J. Veter. Internal Med. 28, 234–242. doi: 10.1111/jvim.12251
Buczinski S., Ollivett T. L., Dendukuri N. (2015). Bayesian Estimation of the Accuracy of the Calf Respiratory Scoring Chart and Ultrasonography for the Diagnosis of Bovine Respiratory Disease in Pre-Weaned Dairy Calves. Prev. Veter. Med. 119, 227–231. doi: 10.1016/j.prevetmed.2015.02.018
Buitinck L., Louppe G., Blondel M., Pedregosa F., Mueller A., Grisel O., et al. (2013). API Design for Machine Learning Software: Experiences From the Scikit-Learn Project. ECML. PKDD. Workshop.: Lang. Data Min. Mach. Learn., 108–122.
Cantor M., Costa J. (2022). Daily Behavioral Measures Recorded by Precision Technology Devices may Indicate Bovine Respiratory Disease Status in Preweaned Dairy Calves. J. Dairy. Sci. doi: 10.3168/jds.2021-20798
Cantor M. C., Renaud D., Costa J. H. (2021). Nutraceutical Intervention With Colostrum Replacer: Can We Reduce Disease Hazard, Ameliorate Disease Severity, and Improve Performance in Preweaned Dairy Calves? J. Dairy. Sci. 104, 7168–7176. doi: 10.3168/jds.2020-19654
Chai C. P. (2020). The Importance of Data Cleaning: Three Visualization Examples. Chance 33, 4–9. doi: 10.1080/09332480.2020.1726112
Charbuty B., Abdulazeez A. (2021). Classification Based on Decision Tree Algorithm for Machine Learning. J. Appl. Sci. Technol. Trends 2, 20–28. doi: 10.38094/jastt20165
Chok N. S. (2010). Pearson’s Versus Spearman’s and Kendall’s Correlation Coefficients for Continuous Data. Ph.D. Thesis (Pennsylvania, USA: University of Pittsburgh).
Coates A., Ng A., Lee H. (2011). “An Analysis of Single-Layer Networks in Unsupervised Feature Learning,” in Proceedings of the Fourteenth International Conference on Artificial Intelligence and Statistics (Hamilton, New Zealand: Proceedings on Machine learning Research), 215–223.
Cockburn M. (2020). Application and Prospective Discussion of Machine Learning for the Management of Dairy Farms. Animals 10, 1690. doi: 10.3390/ani10091690
Costa J. H., Cantor M. C., Neave H. W. (2021). Symposium Review: Precision Technologies for Dairy Calves and Management Applications. J. Dairy. Sci. 104, 1203–1219. doi: 10.3168/jds.2019-17885
Drewry J. L., Shutske J. M., Trechter D., Luck B. D., Pitman L. (2019). Assessment of Digital Technology Adoption and Access Barriers Among Crop, Dairy and Livestock Producers in Wisconsin. Comput. Electron. Agric. 165, 104960. doi: 10.1016/j.compag.2019.104960
Dunn T., Ollivett T., Renaud D., Leslie K., LeBlanc S., Duffield T., et al. (2018). The Effect of Lung Consolidation, as Determined by Ultrasonography, on First-Lactation Milk Production in Holstein Dairy Calves. J. Dairy. Sci. 101, 5404–5410. doi: 10.3168/jds.2017-13870
Duthie C.-A., Bowen J., Bell D., Miller G., Mason C., Haskell M. (2021). Feeding Behaviour and Activity as Early Indicators of Disease in Pre-Weaned Dairy Calves. Animal 15, 100150. doi: 10.1016/j.animal.2020.100150
Ebrahimi M., Mohammadi-Dehcheshmeh M., Ebrahimie E., Petrovski K. R. (2019). Comprehensive Analysis of Machine Learning Models for Prediction of Sub-Clinical Mastitis: Deep Learning and Gradient-Boosted Trees Outperform Other Models. Comput. Biol. Med. 114, 103456. doi: 10.1016/j.compbiomed.2019.103456
Eckelkamp E., Bewley J. (2020). On-Farm Use of Disease Alerts Generated by Precision Dairy Technology. J. Dairy. Sci. 103, 1566–1582. doi: 10.3168/jds.2019-16888
Fix E., Hodges J. L. (1989). Discriminatory Analysis. Nonparametric Discrimination: Consistency Properties. Int. Stat. Review/Rev. Internat. Stat. 57, 238–247. doi: 10.2307/1403797
Gladden N., Cuthbert E., Ellis K., McKeegan D. (2020). Use of a Tri-Axial Accelerometer can Reliably Detect Play Behaviour in Newborn Calves. Animals 10, 1137. doi: 10.3390/ani10071137
Harris C. R., Millman K. J., van der Walt S. J., Gommers R., Virtanen P., Cournapeau D., et al. (2020). Array Programming With NumPy. Nature 585, 357–362. doi: 10.1038/s41586-020-2649-2
Hart B. L., Hart L. A. (2019). Sickness Behavior in Animals: Implications for Health and Wellness. Ency. Anim. Behav. 1, 171–175. doi: 10.1016/B978-0-12-809633-8.20750-4
Ho T. K. (1995). “Random Decision Forests,” in In Proceedings of 3rd International Conference on Document Analysis and Recognition, vol. 1. (Montreal, CA: IEEE), 278–282.
Hopfield J. J. (1982). Neural Networks and Physical Systems With Emergent Collective Computational Abilities. Proc. Natl. Acad. Sci. 79, 2554–2558. doi: 10.1073/pnas.79.8.2554
Hunter J. D. (2007). Matplotlib: A 2d Graphics Environment. Comp. Sci. Eng. 9, 90–95. doi: 10.1109/MCSE.2007.55
Hyde R. M., Down P. M., Bradley A. J., Breen J. E., Hudson C., Leach K. A., et al. (2020). Automated Prediction of Mastitis Infection Patterns in Dairy Herds Using Machine Learning. Sci. Rep. 10, 1–8. doi: 10.1038/s41598-020-61126-8
Knauer W. A., Godden S. M., Dietrich A., Hawkins D., James R. (2018). Evaluation of Applying Statistical Process Control Techniques to Daily Average Feeding Behaviors to Detect Disease in Automatically Fed Group-Housed Preweaned Dairy Calves. J. Dairy. Sci. 101, 8135–8145. doi: 10.3168/jds.2017-13947
Lombard J., Urie N., Garry F., Godden S., Quigley J., Earleywine T., et al. (2020). Consensus Recommendations on Calf-and Herd-Level Passive Immunity in Dairy Calves in the United States. J. Dairy. Sci. 103, 7611–7624. doi: 10.3168/jds.2019-17955
Love W. J., Lehenbauer T. W., Van Eenennaam A. L., Drake C. M., Kass P. H., Farver T. B., et al. (2016). Sensitivity and Specificity of on-Farm Scoring Systems and Nasal Culture to Detect Bovine Respiratory Disease Complex in Preweaned Dairy Calves. J. Veter. Diagn. Invest. 28, 119–128. doi: 10.1177/1040638715626204
Mahendran S., Wathes D., Booth R., Blackie N. (2021). A Survey of Calf Management Practices and Farmer Perceptions of Calf Housing in Uk Dairy Herds. J. Dairy. Sci. 105, 409–423. doi: 10.3168/jds.2021-20638
McGuirk S. M., Peek S. F. (2014). Timely Diagnosis of Dairy Calf Respiratory Disease Using a Standardized Scoring System. Anim. Health Res. Rev. 15, 145–147. doi: 10.1017/S1466252314000267
Medrano-Galarza C., LeBlanc S. J., DeVries T. J., Jones-Bitton A., Rushen J., de Passillé A. M., et al. (2017). A Survey of Dairy Calf Management Practices Among Farms Using Manual and Automated Milk Feeding Systems in Canada. J. Dairy. Sci. 100, 6872–6884. doi: 10.3168/jds.2016-12273
Miekley B., Traulsen I., Krieter J. (2013). Mastitis Detection in Dairy Cows: The Application of Support Vector Machines. J. Agric. Sci. 151, 889–897. doi: 10.1017/S0021859613000178
Morrison J., Renaud D. L., Churchill K. J., Costa J. H., Steele M. A., Winder C. B. (2021). Predicting Morbidity and Mortality Using Automated Milk Feeders: A Scoping Review. J. Dairy. Sci. 104, 7177–7194. doi: 10.3168/jds.2020-19645
Morrison J. L., Winder C. B., Medrano-Galarza C., Denis P., Haley D., LeBlanc S. J., et al. (2022). Case-Control Study of Behavior Data From Automated Milk Feeders in Healthy or Diseased Dairy Calves. JDS. Commun. 3, 201–206. doi: 10.3168/jdsc.2021-0153
NRC I. (2001). Nutrient Requirements of Dairy Cattle Vol. 519 (Washington DC, USA: National Research Council).
Ollivett T., Caswell J., Nydam D., Duffield T., Leslie K., Hewson J., et al. (2015). Thoracic Ultrasonography and Bronchoalveolar Lavage Fluid Analysis in Holstein Calves With Subclinical Lung Lesions. J. Veter. Internal Med. 29, 1728–1734. doi: 10.1111/jvim.13605
Platt J. (2004). Probabilistic Outputs for Svms and Comparisons to Regularized Likelihood Methods. Adv. Large. Margin. Classif., 61–74.
Renaud D., Buss L., Wilms J., Steele M. (2020). Is Fecal Consistency Scoring an Accurate Measure of Fecal Dry Matter in Dairy Calves? J. Dairy. Sci. 103, 10709–10714. doi: 10.3168/jds.2020-18907
Rhodes V., Ryan E. G., Hayes C. J., McAloon C., O’Grady L., Hoey S., et al. (2021). Diagnosis of Respiratory Disease in Preweaned Dairy Calves Using Sequential Thoracic Ultrasonography and Clinical Respiratory Scoring: Temporal Transitions and Association With Growth Rates. J. Dairy. Sci. 104, 11165–11175. doi: 10.3168/jds.2021-20207
Sargeant J., O’Connor A. M., Dohoo I., Erb H., Cevallos M., Egger M., et al. (2016). Methods and Processes of Developing the Strengthening the Reporting of Observational Studies in Epidemiology–Veterinary (Strobe-Vet) Statement. Zoonos. Public Health 63, 651–661. doi: 10.1111/zph.12314
Silper B., Robles I., Madureira A., Burnett T., Reis M., de Passillé A., et al. (2015). Automated and Visual Measurements of Estrous Behavior and Their Sources of Variation in Holstein Heifers. I: Walking Activity and Behavior Frequency. Theriogenology 84, 312–320. doi: 10.1016/j.theriogenology.2014.12.029
Slob N., Catal C., Kassahun A. (2020). Application of Machine Learning to Improve Dairy Farm Management: A Systematic Literature Review. Prev. Veter. Med. 187, 105237. doi: 10.1016/j.prevetmed.2020.105237
Wang X. (2011). “A Fast Exact K-Nearest Neighbors Algorithm for High Dimensional Search Using K-Means Clustering and Triangle Inequality,” in The 2011 International Joint Conference on Neural Networks (San Jose, CA, USA: IEEE), 1293–1299. doi: 10.1109/IJCNN.2011.6033373
Wes M. K. (2010). “Data Structures for Statistical Computing in Python,” in In Proceedings of the 9th Python in Science Conference. Eds. van der Walt S., Millman J., (Austin, Texas, USA: Python in Science) 56–61. doi: 10.25080/Majora-92bf1922-00a
Keywords: activity, disease detection, precision livestock farming, technology, sickness behavior, pneumonia, cattle
Citation: Cantor MC, Casella E, Silvestri S, Renaud DL and Costa JHC (2022) Using Machine Learning and Behavioral Patterns Observed by Automated Feeders and Accelerometers for the Early Indication of Clinical Bovine Respiratory Disease Status in Preweaned Dairy Calves. Front. Anim. Sci. 3:852359. doi: 10.3389/fanim.2022.852359
Received: 11 January 2022; Accepted: 30 May 2022;
Published: 06 July 2022.
Edited by:
Joao R. R. Dorea, University of Wisconsin-Madison, United StatesReviewed by:
Dario Augusto Borges Oliveira, Technical University of Munich, GermanyTiago Bresolin, University of Illinois at Urbana-Champaign, United States
Copyright © 2022 Cantor, Casella, Silvestri, Renaud and Costa. This is an open-access article distributed under the terms of the Creative Commons Attribution License (CC BY). The use, distribution or reproduction in other forums is permitted, provided the original author(s) and the copyright owner(s) are credited and that the original publication in this journal is cited, in accordance with accepted academic practice. No use, distribution or reproduction is permitted which does not comply with these terms.
*Correspondence: Joao H. C. Costa, Y29zdGFAdWt5LmVkdQ==