 Lindsey Davis1
 Kalyanmoy Deb
 Janice Siegford
 Ahmed B. A. Ali
- 1Animal and Veterinary Sciences Department, Clemson University, Clemson, SC, United States
- 2Department of Electrical and Computer Engineering, Michigan State University, East Lansing, MI, United States
- 3Department of Animal Science, Michigan State University, East Lansing, MI, United States
- 4Animal Behavior and Management, Veterinary Medicine, Cairo University, Cairo, Egypt
Lameness is an endemic disorder causing health problems and production losses in the dairy cow industry. The objective of this study was to identify cow and farm-level factors associated with lameness on Automatic Milking System (AMS) farms, using decision tree analysis to assign probabilities to each input. AMS farms across Canada and Michigan were evaluated to identify the most substantial farm (i.e., stall design, bedding) and cow-level (i.e., BCS, leg injuries) factors associated with prevalence of lameness. To assess lameness, videos of cows were used, and cows with a head bob or noticeable limp were categorized as lame. A decision tree classification model used 1378 data points from 39 pens across 36 farms to predict the value of the target class through “tree function” in MATLAB. The primary classifier was identified as type of stall base, dividing the data set into 3 categories: 1) rubber, sand, or geotextile mat flooring, 2) concrete base, and 3) other types of stall base. Within the first category (class membership (CM) = 976), bedding quantity was the secondary classifier, which was divided by cows standing on ≥2 cm (CM=456) or <2 cm (CM=520) of bedding. Bedding quantity was divided into the third most important classifier of BCS, and cow fit stall width. Cows with BCS of 3.25 to 4.5 (CM=307) were defined as non-lame with an estimated probability (EP) of 0.59, while cows with BCS of 2 to 2.5 (CM=213) were further split by hock lesion incidence. Cows without lesions were defined non-lame (EP=0.93) and cows with lesions were defined lame (EP=0.07). Cows that fit stall width were defined as non-lame (EP=0.66) and cows that did not fit were further divided by the width of the feed alley. Farms with ≥430 cm feed alley were defined as non-lame (EP=0.89), whereas farms with <430 cm feed alley were defined as lame (EP=0.11). Through implementing a novel multifactorial approach of data analysis, we were able to highlight the critical points that can be focused on to enhance farm-level housing and management practices or mitigate or monitor cow-level issues to reduce incidence and severity of lameness in AMS farms.
1 Introduction
Lameness is one of the core endemic disorders causing health and welfare problems and production losses within the dairy cow industry, and its incidence has increased over the last 45 years (Adams et al., 2019; Jewell et al., 2019; Randall et al., 2019). As the dairy industry continues efforts to increase production to feed the constantly growing world population over the coming decades, challenges associated with reducing the incidence of lameness are most likely to increase. Lameness is associated with sole ulcers and white line disease which creates pain, preventing cows from performing natural behaviors and functions (Bicalho et al., 2008). Previous studies confirmed that lameness is associated with pain (Huxley, 2013), reduced milk yield (Bicalho et al., 2008), poor fertility (Bicalho et al., 2007), higher culling rates (Cramer et al., 2009), and substantial economic losses (Huxley, 2013). Lame cows show increased lying and resting times, and while lying is often associated with positive outcomes for overall health welfare and production in dairy cows, excessive lying indicates health problems like lameness (Westin et al., 2016a). Lame cows also spend less time feeding, causing decreased nutrition intake leading to poor body condition scores (BCS) and negatively impacting milk production (Green et al., 2014).
Dairy cows’ daily routine in Automatic Milking System (AMS) is notably different compared to that of cows milked in manual parlors. Cows milked in AMS are expected to voluntarily enter a milking robot numerous times throughout the day, as opposed to milking parlors, where cows are taken to following a rigorous schedule two or three times daily. Essential criteria of successful AMS farms include the ability to maintain high milk yield, good health conditions, and little labor spent fetching cows for milking. Lame cows are less likely to voluntarily enter milking robots when compared to sound cows (Borderas et al., 2008; Miguel-Pacheco et al., 2014), and additional labor is required to fetch lame cows for milking (Bach et al., 2007). Therefore, reducing lameness is an essential element in managing successful AMS-based dairy farms. Lameness incidence can be mitigated by various farm management practices like routine hoof maintenance, prevention plans, and the ability of farmers to properly detect lameness for early treatment (Leach et al., 2012; Sadiq et al., 2021). While lameness is difficult to treat once diagnosed, many researchers have found a reduced prevalence of lameness after rapid treatment through improving the prognosis and decreasing the duration and treatment costs associated with lameness (Leach et al., 2012; Gundelach et al., 2013). Similar to other endemic diseases, prevention of lameness in dairy cows is imperative in terms of maintaining high milk production rates and a healthy herd (Bicalho et al., 2008). However, a thorough investigation of both cow and herd level factors associated with incidence of lameness in AMS farms is required to achieve the optimum barn design and management practices that counteract such problems. So far, previous herd-level AMS studies have focused on barn design (e.g., cow traffic systems as reviewed by Jacobs and Siegford, 2012), supplemental feed (Scott et al., 2015), and associations of barn design and management practices with production per cow and per AMS (Tremblay et al., 2016). Westin et al. (2016b) investigated both cow and farm-level risk factors associated with lameness through univariable and multivariable regression modeling using data from 36 AMS farms in Canada and Michigan, which is the same data set in the current study. They were able to identify the most significant factors that were independently associated with the prevalence of lameness on these farms. However, in the current study, we pushed such investigation to a more descriptive, multifactorial, and multi-directional level of data analysis to reveal comprehensive associations between cow and farm-level inputs, resulting in incidence of lameness in AMS farms through decision tree modeling.
Decision trees are thought to be one of the most powerful approaches for data classification using machine learning algorithms (Ebrahimi et al., 2015). Due to their uncomplicated structure, they are easily assimilated by humans, easily assembled, and advanced compared to other known methods of classification (Gehrke et al., 1998). Decision trees are a visual illustration of data where an attribute is classified by its relation to other attributes. Our objective in the current study was to identify the potential cow and farm-level factors associated with lameness in AMS farms through using decision trees to assign probabilities to these different inputs. This, in turn, will help in determining the critical control points that can be employed for developing successful strategies to enhance housing and management plans and reduce the incidence of lameness in AMS farms. We hypothesized decision tree analysis would allow a more realistic understanding of the relationship between farm and cow-level factors and incidence of lameness in AMS farms that is necessary to reduce incidence of lameness on farm. Unlike regression modeling, implementing the decision tree analysis will not only identify the significant individual cows and/or management factors associated with lameness in lactating dairy cows but also arrange these factors based on their magnitude of involvement in inducing lameness in dairy herds. Moreover, we hypothesized decision tree would enable us to quantify the estimated probabilities of these different factors and order them based on importance in relation to lameness while being able to visualize the pathways to monitor and control incidence of lameness in dairy herds.
2 Materials and methods
The current study is a part of a larger study that included dairy cow farms from several locations across Canada and Michigan and aimed to assess the welfare and comfort of dairy cows on AMS dairies. Prior to the start of the study, all protocols were submitted to and approved by the Institutional Animal Care Committees and Research Ethics Boards at Universite Laval, the University of Guelph, the University of Calgary, and Michigan State University.
2.1 Herd and cow selection
Data were gathered over a two- and half–year period, from 36 farms with AMS across Canada (Quebec (QC); n = 10, Ontario (ON); n = 10, British Columbia (BC); n = 4, and Alberta (AB); n = 5), as well as in Michigan (MI; n = 7). Farms were included after their acceptance to mailed invitation to participate in the study. Interested farms were then interviewed to assure they met study inclusion criteria, including but not limited to: barns with free-stall housing for at least 1 year, no outdoor access, and operating an AMS for at least 6 months (See Westin et al., 2016b for further details). A total of 40 lactating Holstein cows were selected at each of the participated farms as a focal sample for detailed cow-based measurements. The number of focal cows that were ≤ 120 DIM was maximized whenever possible. Whenever the milking herd had less than 40 cows ≤ 120 DIM, the selection criterion was expanded above 120 DIM until a sample of 40 cows was obtained. Focal cows were also selected to reflect the ratio of primiparous to multiparous cows in the overall herd. Data were successfully obtained from 1,378 cows in total, with focal samples of less than 40 lactating cows (range = 25–39 cows) in 5 herds (See Westin et al., 2016b for further details).
2.2 Measurements
2.2.1 Cow measures
Focal cows were scored for hock and knee injuries using a 4-point scale following Gibbons et al. (2012) and Zaffino Heyerhoff et al. (2014). Score 3 included presence of major swelling (in area more than 2.5 cm), with presence of bald area or skin lesion; score 2 included presence of medium swelling (1-2.5 cm), or lesion on bald area; and score 1 included presence of minor swelling (less than 1 cm) with presence of bald area or hairless region; and score 0 was given when there was no change in the skin (See Westin et al., 2016b for further details). Cows were also assessed for leg cleanliness using a 4-point scoring system adapted from Cook (2006) by examining the lateral lower hind right leg from the top of the claw to the middle of the hock. Body condition of focal cows was recorded on a 5-point scale in 0.25 increments using the Elanco Animal Health body condition scoring chart for dairy cattle (Elanco Animal Health, 1996; based on Wildman et al. (1982) and Ferguson et al. (1994), then adapted by Vasseur et al. (2013)). Physical measurements were also taken from focal cows. Hip width was measured between the points of the 2 hook bones with a flexible measuring tape when the cow was in a standing position. Rump height was measured from the ground to the spine parallel to the hook bone using a height stick. Standardized procedures were used to collect each animal-based measure as described by (Vasseur et al., 2013; 2015), and these are available on the Canadian Dairy Research Portal (https://www.dairyresearch.ca/animal-comfort-tool.php). Measuring and scoring were done while cows were locked in self-locking headgates at the feed alley (See Westin et al., 2016b for further details).
Finally, focal cows identified by unique numbers on neck collars were individually video recorded immediately after milking while walking in the feeding alley after being released from the headlocks. Videos were then used to assess lameness. Cows that showed a head bob or had an obvious limp (defined as uneven weight bearing of one or more limbs) as described by Flower and Weary (2006) were classified as lame cows. Parity and DIM of each focal cow were retrieved from farm records (See Westin et al., 2016b for further details). Parity was categorized in two levels, as either less than or ≥ 2 years.
2.2.2 Farm measurements
Pens containing focal cows were used to take farm measurements. Focal cows were housed in a single pen in 34 farms, while on 2 farms they were spread across 2 and 3 pens, respectively (for more details please see Westin et al., 2016b). In each pen, the length of the feed bunk was measured, and feeding space per cow was calculated by dividing the feed bunk space by the number of cows in the pen. The type of feed barrier, flooring type adjacent to the feed bunk, and width of feed alley (alley where cows stood to feed, distance from feed bunk to the rear curb of laying stalls) were also recorded. The width of the feed alley was scored as less than or ≥ 430 cm, as a width of ≥ 430 cm is recommended in the Canadian Dairy Code of Practice (DFC-NFACC, 2009). Cleanliness of the feed alley floor was assessed before and after scraping using a 2-point score representing whether the height of manure collected on the heel of a clean rubber boot was more or less than 1 cm (for further details please see Westin et al. (2016b)).
Stall measurements were recorded using the first and last usable stalls in 3 representative rows within each of pen containing focal cows for an average of 6 ± 1 stalls per pen (range = 4 to 10 stalls). The stocking density of stalls was calculated by dividing the number of cows by the number of useable lying stalls. Stall width was measured as the average width of 3 consecutive stalls on either side of the middle stall of each row that was measured (range = 9 to 24 stalls per pen). Other stall measurements such as bed length (distance from rear curb to brisket board), stall length, neck rail height, brisket board height, distance of neck rail from the rear curb, and the height of the upper edge of bottom divider rail, were recorded during the visit. Also, lunge space was estimated for an average of 6 ± 1 stalls per pen (range = 4 to 10 stalls) and recorded as adequate if no obstruction was present in the bob-zone (≤ 76 cm in front of the top of brisket board as described by Nordlund and Cook (2003)). Other parameters such as the type of bedding and stall base (surface under bedding), bedding quantity, cleanliness, and dryness were also assessed in the selected stalls within each pen (for more details please see Westin et al., 2016b). Bedding quantity was evaluated and scored as none (when bedding was unable to be raked), < 2 cm (when raked flat for organic bedding, or below the curb for sand bedding), or ≥ 2 cm (when raked flat for organic bedding, or even with or above the curb for sand bedding), see Westin et al., 2016b for further details). Measurements were taken based on the standard operating procedures described by Zaffino Heyerhoff et al. (2014) and Vasseur et al. (2015), which are available on the Canadian Dairy Research Portal (www.dairyresearch.ca/animal-comfort-tool.php), and, as noted, a detailed description of the methodology used to obtain cow and farm measurements has been previously published (Westin et al., 2016b).
2.3 Data handling
Data were collected during a single visit by 2 assessors. Each assessor took the same measures on all cows. In total, 11 assessors collected data on different farms. To ensure high repeatability, all assessors took part in the same training program before the study started, which is described in detail by Gibbons et al. (2012) and Vasseur et al. (2013). For further details regarding inter-observer reliability please see Westin et al. (2016b). Data were entered into a relational database (Access 2010; Microsoft Corp., Redmond, WA) and then exported to Excel files (Excel 2010; Microsoft Corp.) and into MATLAB (MATLAB and Statistics Toolbox Release 2012, The MathWorks, Inc., Natick, MA) for conducting decision tree analysis.
In alignment with the Canadian Dairy Code of Practice (DFC-NFACC, 2009) recommendations, feeding space was dichotomized as less than or ≥ 60 cm. Then cows were assessed to either fit or to not fit stall width. Cows were considered as not fitting the stall width when the average stall width was narrower than 2× the cow’s hip width, as proposed by Ceballos et al. (2004) and Anderson (2007). Hock or knee lesion scores that include mild or no swelling with broken hair and/or bald area on one or both limbs (Score 0 and 1) were then lumped together and recorded as “absent”, while scores that included medium to major swelling with bald area and/or lesion (score 2 and 3) were recorded as “present”. For leg cleanliness, scores that included the presence of fresh manure or dried caked for <50% of the area were then lumped together and recorded as “clean”, while those included presences of fresh manure or dried caked for >50% were recorded as “dirty”. BCS was categorized into 3 categories (2: ≤ 2.5, > 2.5: < 3.25, and ≥ 3.25: ≤ 4.5). Lunge space was classified as “adequate” at the pen level if no obstruction was present in ≥ 75% of the measured stalls. Similarly, bedding quantity, cleanliness, and dryness was classified as > 2 cm, clean (score 0 – 1), and dry (score 0) if ≥ 75% of the measured stalls in the pen received the corresponding scores.
2.4 Decision tree analysis
In the decision tree model, data are presented as an inverted tree-like graph, which has a root at the top and grows downwards for easy interpretation. The main goal of decision tree models is to create a classification model that predicts the value of the label/target class (Breiman et al., 1984). They are constructed by partitioning predictors into rectangles (nodes) using a series of rules (Attribute Selective Measure) to identify the most homogeneous responses to predictors and determine the yes/no rule that best splits the data with respect to one feature. The best split is the most homogeneous responses to the predictors or output nodes (mincriterion). The previous steps are then repeated until all the data are correctly classified or a stopping rule is reached (Elith et al., 2008; Valletta et al., 2017; Tyasi et al., 2021). This results in an inverted tree-like frame branching off from a homogeneous probability distributed root node (mtry) to a highly heterogeneous leaf nodes for deriving the output (prediction) (Elith et al., 2008).
The decision tree analysis in this study was conducted by passing the data that were collected from the 36 AMS farms from the root node to leaf nodes that were connected through arcs or lines. Decision nodes were used to indicate input variables with a designated probability that generally represented influence or effect on the incidence of lameness. Class membership or the number of records per each output node in the population is also provided. Decision tree analysis was implemented by applying the “tree function”, (Loh, 2002) in MATLAB (MATLAB and Statistics Toolbox Release 2012, The MathWorks, Inc., Natick, MA). The target class or output variable was the occurrence of lameness in AMS farms with two class of “Lame cows” or “Non-lame cows” based on several input features or variables. Cow-level factors included: [1] parity, [2] DIM, [3] BCS, [4] leg cleanliness, [5] hock lesions, [6] knee lesions, [7] cow fits stall width, [8] cow fits bed length, [9] feeding space per cow, and [10] cows per stall. Farm-level factors included: [1] stall base, [2] stall bedding, [3] bedding quantity, [4] bedding dryness, [5] stall racking frequency, [6] lunge space, [7] feed barrier, [8] width of feed alley, [9] floor at feed alley, and [10] feed alley cleanliness. In the current study, root (classifier) and leaf (decision) nodes were presented as horizontal rectangles, connected with arrows showing the designated categories and corresponding cut-off points. Whereas the output variables (prediction nodes) were presented as snipped top coroner rectangles with white shape filling for “Non-lame cows” and 15% darker shape filling for “Lame cows”, both including the prediction values or the estimated predicted probability associated with each factor (Figure 1). The dataset was randomly subdivided into a training cluster (75%) and a test cluster (25%). The training set was used to fit the model, and the test set was used to provide an impartial evaluation of a model fit on the training dataset while tuning model parameters.
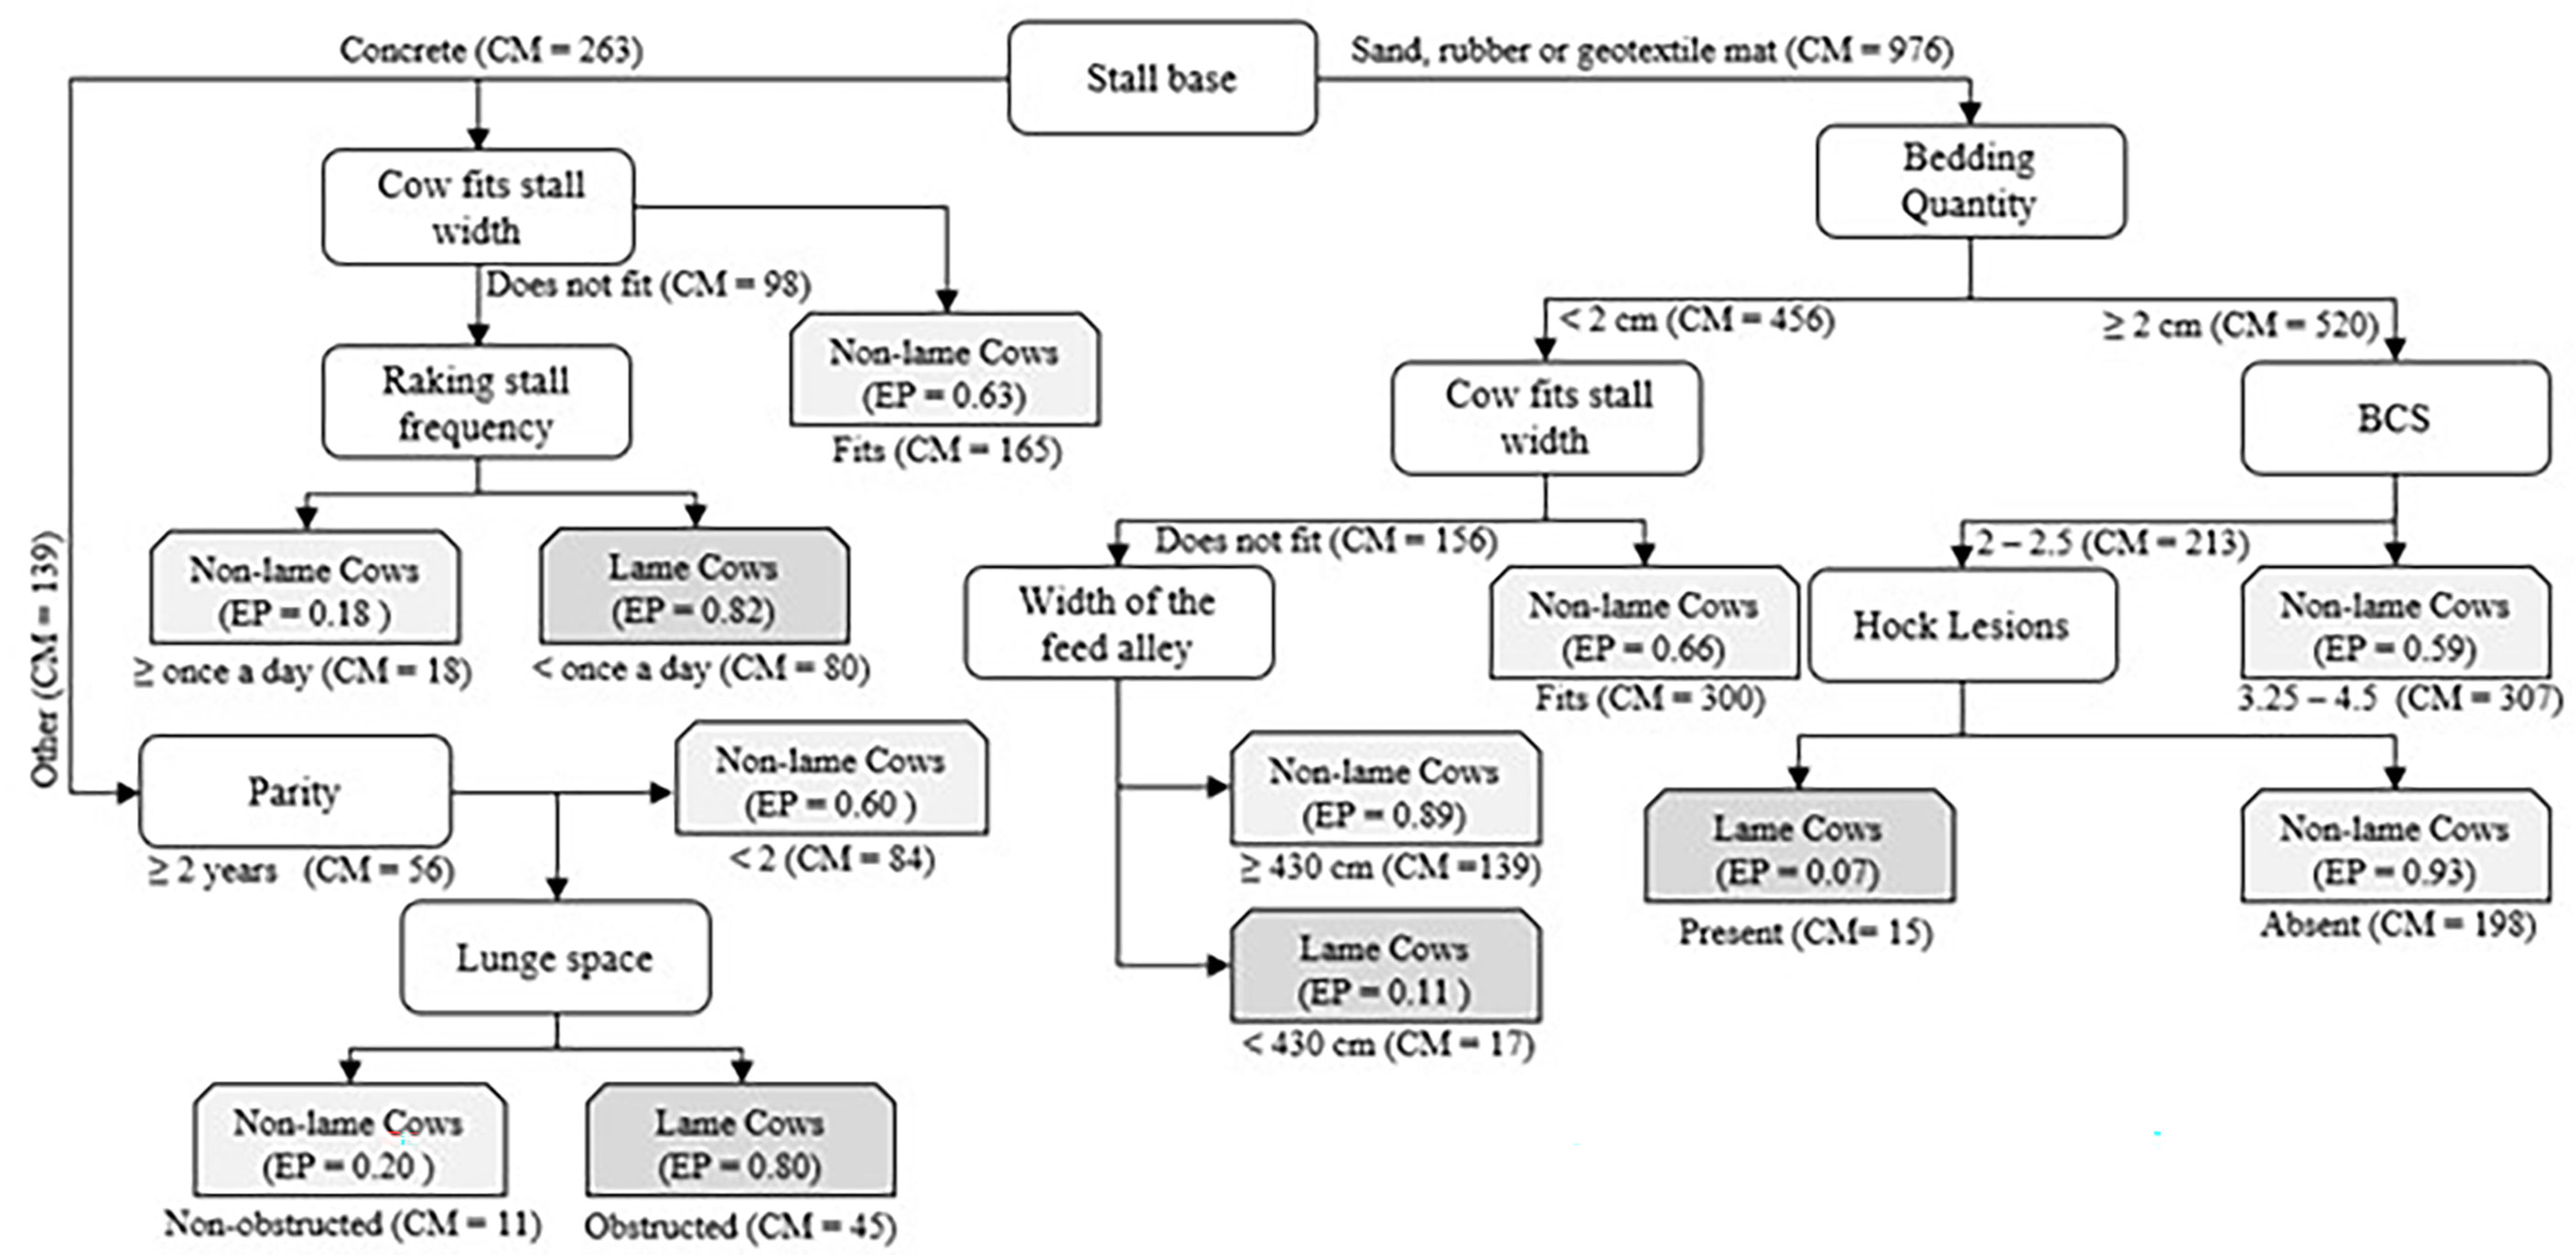
Figure 1 Decision-tree model for the incidence of lameness and associated cow- and farm-level measurements for 1,378 cows from 39 pens across 36 farms. Input variables or root and leaf nodes are presented in horizontal rectangles beside the corresponding cut-off value. The decision tree classified each cow into one category of the lameness output variable, with a cow being either “lame” (gray) or “non-lame” (light gray). Lameness output variables are shown in snipped corner-rectangles containing the corresponding estimated probabilities for each category. Class membership (the number of records per category of input variables) are shown beside the cut-off point, either above or below nodes as space permits.
The decision tree analysis arranges, and splits nodes or input variables based on their relevance or influence on the classifier or occurrence of the output variable “lameness”, using a threshold level of 0.05. All the values > 0.05 were considered positive predictors of lameness, while values ≤ 0.05 were considered as negative predictors of lameness. If at any time, all records at a node have the same classification, or the classified number of records were equal to 11 records (nodesize), that part of the tree stops developing.
3 Results
Due to missing data, the number of cows on each farm varied from measure to measure (Table 1). Data on parity and knee lesions were obtained from 34 and 33 herds, respectively. Additionally, all farm-level categorical predictors considered for analyses had at least 5 pens or farms per category (Table 2).
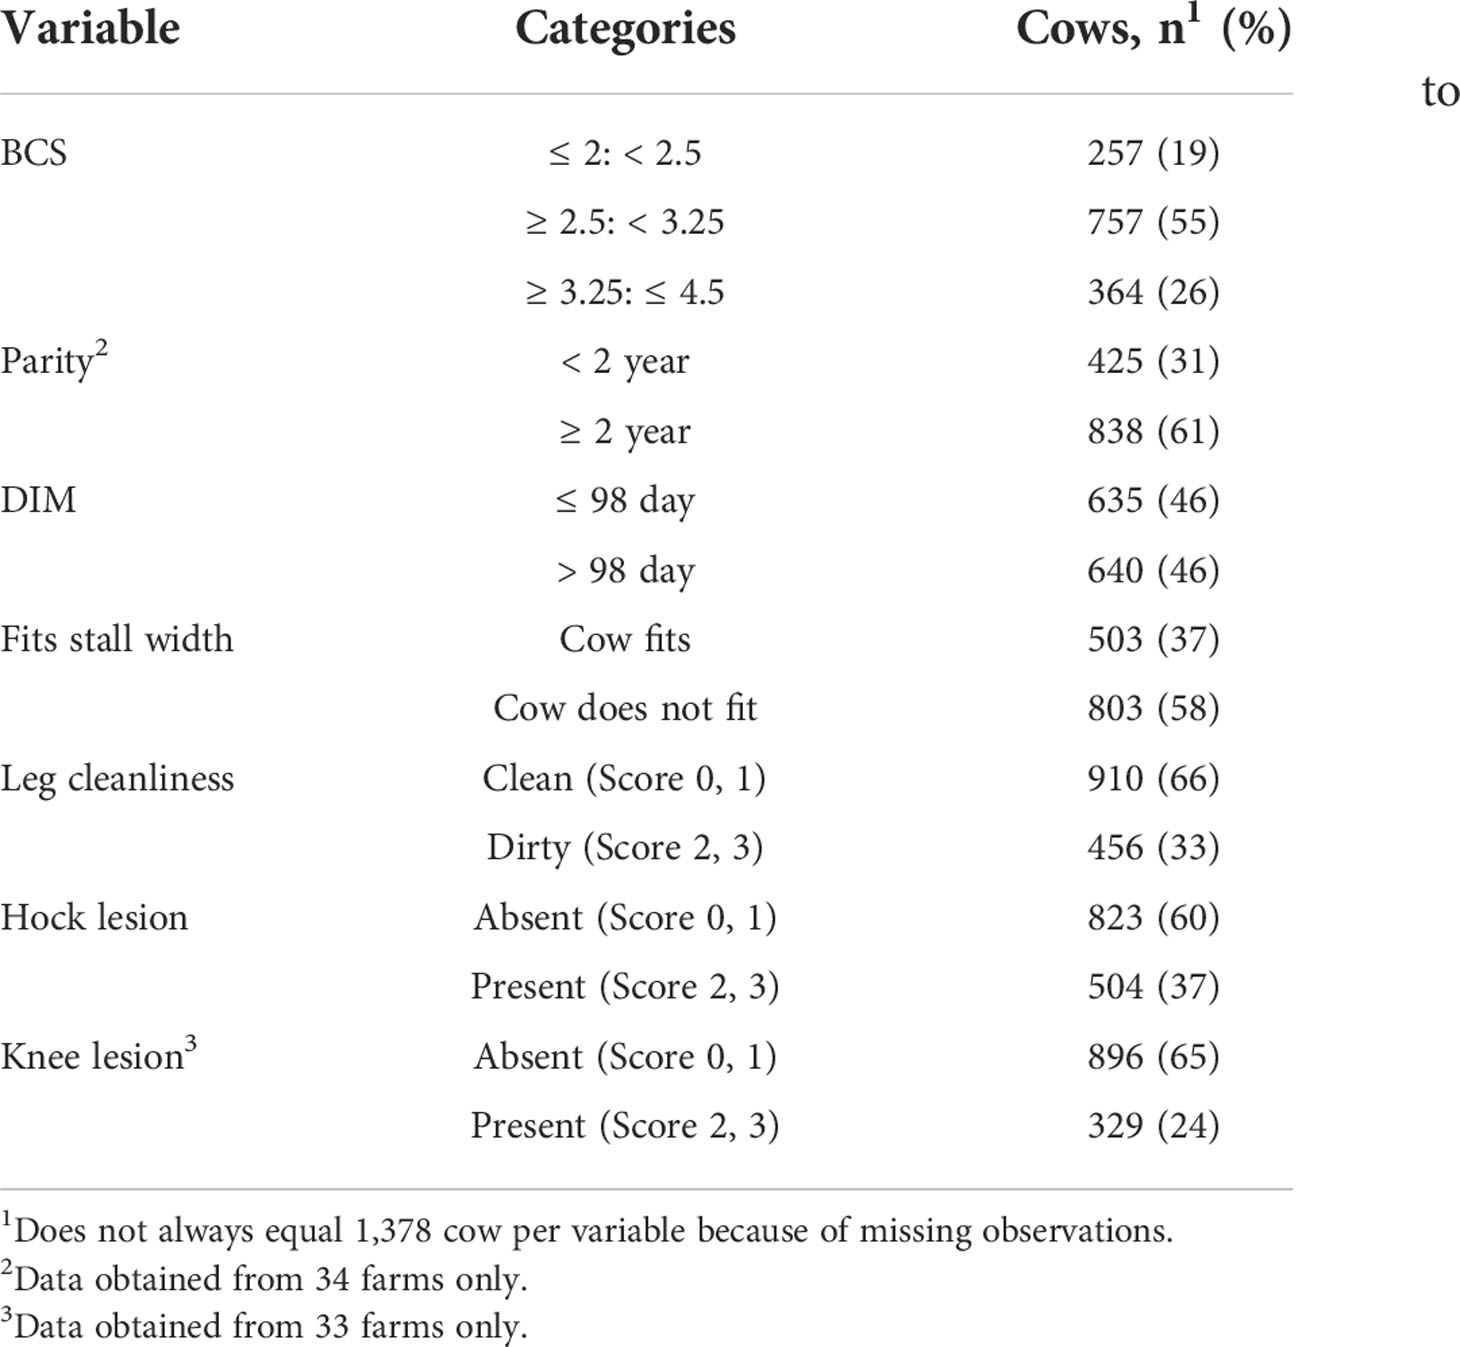
Table 1 Number of cows per measurement from 1,378 cows on 36 dairy farms with AMS.
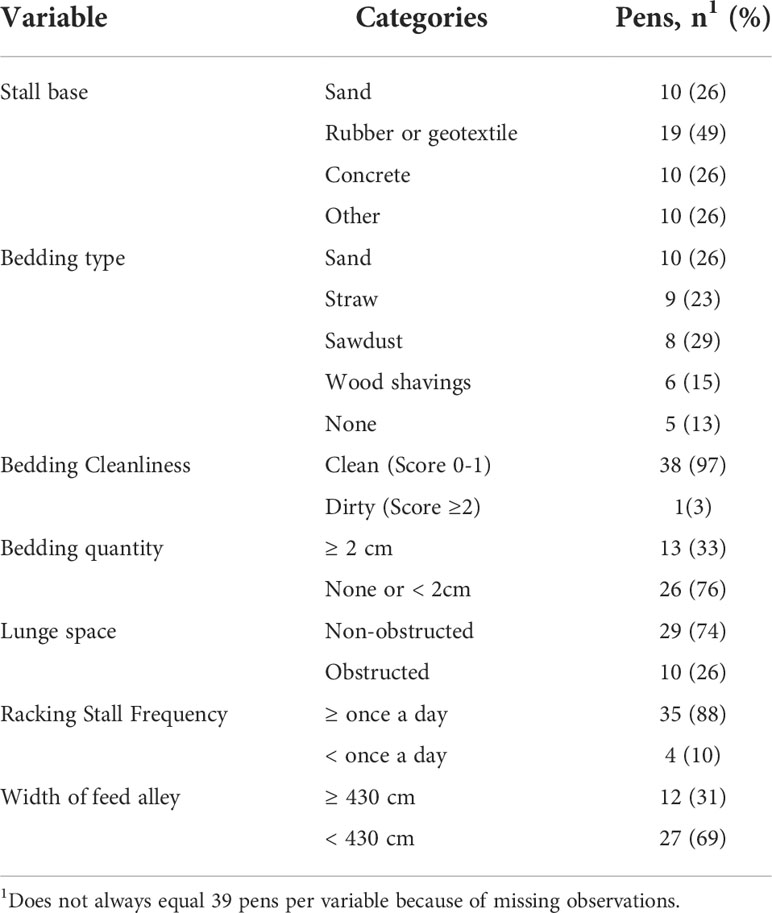
Table 2 Farm-level variables as measured in 39 pens from 36 dairy farms with AMS.
Figure 1 shows the decision tree model for the incidence of lameness and associated cow and farm-level measurements, a total of 22 nodes with 10 decision and 12 prediction nodes, and it was generated using the entire data set of 1,378 from 39 pens and across 36 farms. The primary classifier (root/root/principal node) divided the entire dataset based on the type of stall base into 3 categories as follows: the first category included 71.84% of cows were standing on either sand, rubber, or geotextile mat; the second category included 18.07% of cows on a concrete base; while the third category contained 10.09% of cows on other types of stall base.
Within the first category, bedding quantity was determined as the second most important classifier after stall base for the sand, rubber geotextile category (Figure 1). Around 52.5% of cows within this classifier were standing on ≥2 cm of bedding while 47.5% of cows were on less than 2 cm bedding. Continuing from the ≥2 cm bedding quantity category, BCS was the third most important classifier. Around 59.1% of cows within this attribute showed BCS of 3.25 to 4.5 and they were apparently defined as non-lame with an estimated probability (EP) of 0.59. Subsequently, cows with BCS from 2 to 2.5 (41%) were further classified according to the presence (36.2%) or absence (63.8%) of hock lesion. Cows recorded to be free from hock lesions were determined as non-lame cows with an EP of 0.93, while cows that suffered from hock lesions were further divided according to leg cleanliness. Finally, cows with clean legs were defined as non-lame cows (80.5%) with an EP of 0.81, while remaining cows with dirty legs were clearly determined as lame cows.
Going back to the primary classifier, cows that were on either sand, rubber or geotextile mat with less than 2 cm bedding material in stalls were furtherly classified based on cows’ ability to fit the stall width (Figure 1). Around 63.8% of cows within this attribute fitted stall width and they were defined as non-lame with an EP of 0.66. Around 36.2% cows within this attribute did not fit the measured stall width, and they were furtherly divided based on the available width of the feed alley. Around 81.8% cows had ≥430 cm of feed alley, and these cows were recognized as non-lame cows (EP = 0.89) while the remaining cows within this attribute were defined as lame cows 18.2%.
Within the second category of the primary classifier that included the 18.1% of cows stalled on a concrete base, a cow’s ability to fit the available stall width was determined to be the second most important classifier after stall base (Figure 1). Cows that fit stall width (66.3%) were defined as non-lame (EP = 0.63), while cows that did not fit stall width were further divided based on the frequency of stall raking into 21.4% of cows with ≥ 1 raking per day (defined as non-lame cows, EP = 0.18), and 78.6% with < 1 raking a day (defined as lame cows, EP = 0.82).
In the third category of the primary classifier, there were 10.1% cows kept on a stall base other than concrete, sand, or geotextile mat (Figure 1). Cows within that category were further classified based on their parity, with 60.4% of cows with less than 2 parities categorized as non-lame (EP = 0.60) while the cows with ≥ 2 parities were furtherly classified based on the available lunge space. Within this attribute, 19.6% cows with enough non-obstructed lunge space were defined as non-lame (EP = 0.20), while the remaining cows, which had an obstructed lunge space were categorized as lame cows (EP = 0.80).
4 Discussion
4.1 Decision tree and lameness
Lameness, like most production diseases, is multifactorial in nature, making it difficult to identify possible associated risk factors with complete conviction. The risks factors involved are often complex and interrelated (Vermunt, 2005). There are still many aspects of our understanding of how lameness arises that are missing; therefore, we used a new approach to identify and analyze the prevalence of lameness in AMS farms to allow use to view potential risk factors in a more complex way.
In animal science, causal relationships are often revealed by multiple statistical approaches like simple or multiple linear regression analysis, but decision trees are an alternative method when evaluating animal data (Koc et al., 2017). Decision tree algorithms are used to solve regression and classification problems by using multiple algorithms to split a classifier node into two or more sub-nodes (leaf or child nodes) and organize risk factors into a flow of critical control points based on their influence on the output factor (Koc et al., 2017). Moreover, decision trees can handle categorical and continuous data in a single model, accommodate missing data in predictors through surrogates, and are insensitive to outliers, unlike regression models (Breiman et al., 1984; Valletta et al., 2017). Several studies have indicated that decision trees algorithms are superior to linear, multiple, and logistic regression models and can be applied to continuous, nominal, and ordinal dependent variables (Topal et al., 2010; Valletta et al., 2017; Tyasi et al., 2021). Moreover, decision trees result in a graphical interpretation of complex results, making them advantageous to other regression models (Elith et al., 2008; Topal et al., 2010).
Lameness is a painful condition and is considered to be one of the major welfare concerns in dairy industry (Whay et al., 2003), affecting 15 to 55% of North American lactating dairy cows (von Keyserlingk et al., 2012; Westin et al., 2016b). Lameness is not only a welfare concern but also has a large financial impact on the dairy industry, for instance, lame cows in Canadian automated milking system (AMS) herds produced 1.6 kg/d less milk (King et al., 2017), showed a reduced reproductive performance (Garbarino et al., 2004; Bicalho et al., 2007), and had an elevated rate of being culled (Bicalho et al., 2007; Cramer et al., 2009). Therefore, reducing the number of clinically lame cows would help improve welfare of dairy cattle and simultaneously improve financial outcomes for producers. However, a thorough understanding of the risk factors that either directly or indirectly associated with lameness in AMS is required to reduce prevalence of lameness in the dairy industry.
Previous reports have related many individual cows and/or management factors to the incidence of lameness in lactating dairy cows. However, no previous research has arranged these factors based on their magnitude of involvement in inducing lameness in dairy herds. Therefore, in the current study, we implemented decision trees algorithm to a dataset of cow- and farm-level measurements for 1,378 cows from 39 pens and across 36 farms. Using such an approach enabled us not only to identify potential cow- and farm-level factors associated with lameness on AMS farms but also to quantify the estimated probabilities of these different factors and order them based on importance in relation to lameness and while being able to visualize the pathways to monitor and control incidence of lameness in dairy herds.
4.2 Mapping of risk factors associated with lameness
Besides ranking farm- and cow-level factors based on their association with the incidence of lameness, the decision tree also created a model presenting various pathways of farm and cow-level critical control points to better understand lameness on dairy cow farms. Such pathways can help in understanding the complex relationships between risk factors and lameness by ranking such factors and mapping the inter-relationships between them in a continuous and branched manner based on their significance. Likewise, such pathways serve as a unique prediction model for the incidence of lameness based on a given set of implemented farm and cow management practices, not only a single factor as in regression models.
The current decision tree model was created using the 1,378 observational data points to train the algorithm to identify specific animal and management practices related to incidence of lameness on AMS dairy farms. The decision tree model created in this study can be used as a prediction model for AMS dairy farmers in the future. The decision tree model is not currently equipped to make such predictions; however, the decision tree can be used as a prediction model with further research and a more extensive dataset introduced to the algorithm. For instance, dairy farmers could collect their cow- and farm-based data points and input the data into the trained decision tree algorithm. The algorithm would compare the new dataset factors to the trained algorithm to generate new expected probabilities of lameness based on the new facility’s factors. The decision tree could then be used to suggest recommendations to improve lameness based on the ranking and significance of each factor and the pathway of factors related to probability of lameness determined by the algorithm.
The decision tree presents a visual representation of pathways of factors related to lameness that can be translated in both directions. For instance, the decision tree from the current study can be interpreted starting at the root node of stall base. Stall base was divided into 3 categories of sand, rubber, and geotextile mat; concrete; and other types of stall base. Such as, facilities with sand, rubber or geotextile mat were further classified by bedding quantity, followed by BCS, ability of cows to fit average stall width, presence of hock lesions, and width of feed alley. These pathways branch off in multiple directions based on rank and significance of factors and led to various probabilities of lameness. For example, all factors considered, the pathways following type of stall base, bedding quantity, cow fit stall width, BCS, width of feed alley, and hock lesions were responsible for a predicted probability of 0.93, and 0.89, respectively, for the absence of lameness.
Additionally, decision trees can be interpreted starting at each prediction node toward the root node. Based on the current decision tree model, probability of lameness was presented at the end of the model in prediction nodes. Interpreting the decision tree in this direction allows for visualization of risk factors associated with lameness and alternative pathways that lead to differing incidences of lameness. For instance, the decision tree algorithm from the current study resulted in an 82% chance of lameness for AMS facilities that raked bedding < once daily, with cows that do not fit average stall width, and stood on concrete base. However, the probability of lameness differs as alternate pathways are followed, enabling us to make suggestions to improve prevalence of lameness based on a farm’s specific cow- and farm-level factors.
For instance, the current decision tree resulted in a higher probability of non-lameness when cows fit inside the average stall width for both sand, rubber, geotextile mat, and concrete stall base. Therefore, this factor is considered a high priority for AMS farmers and could be used as a recommendation to improve incidence of lameness on AMS farms in the future. The decision tree enables visualization of alternative pathways of risk factors that could be changed or adjusted to increase the prevalence of non-lameness. For example, the most apparent recommendation to improve probability of non-lameness would be to transition into sand, rubber, or geotextile mat stall base. However, this is not feasible for all AMS facilities; therefore, additional decision tree pathways can be followed to determine alternative solutions. Another option would be to increase stall raking frequency to ≥ once daily or make changes that enable the cows to fit inside the stall width. For instance, farmers can select smaller-framed cows that better fit the current stall width in their facility or change the barn’s overall design to create a more suitable stall size for their existing herd. Moreover, the decision tree allows us to visualize various pathways that result in probability of lameness, enabling us to make housing and farm management recommendations based on specific cow- and farm-based factors to potentially decrease prevalence of lameness on AMS farms.
4.3 Classifiers of lameness determined by decision tree analysis
In the current study, we confirmed Westin et al.’s (2016b) findings, and in fact, pinpointed stall base as the single most important factor related to lameness. By implementing a decision tree analysis, we then went beyond identifying odds of lameness related to stall base to further distinguish specific risks associated with various stall base types like sand, concrete, rubber, and geotextile mats. Decision tree analysis enabled us to rank each type of stall base based on their association with incidence of lameness. The type of stall base (surface under bedding) was classified as the single most important critical control point of lameness and revealed that the majority of non-lame cows were housed on deep-bedded sand stalls or on rubber/geotextile mat flooring. On the other hand, more lame cows were observed on other types of stall bases, such as concrete.
The current findings are also consistent with previous studies reported decreased risks of lameness in herds with deep-bedded sand stalls (Chapinal et al., 2013; Solano et al., 2016; Cook et al., 2016) and rubber flooring throughout the pen (Vanegas et al., 2006). Sand bedding also results in greater lying times in lame cows, promoting more time to recover compared to cows on other bedding types, who spend more time standing in the stalls (Jewell et al., 2019). Additionally, similar to our current findings, several previous studies demonstrated that the use of rubber or geotextile mats was associated with better locomotion and lower incidence of lameness to dairy cows housed in freestall barns through decreasing the trauma and wear (Vanegas et al., 2006; Eicher et al., 2013), and improving their lying behavior (Bak et al., 2016) when compared to concrete flooring. Moreover, the amount of time cows spend lying down is highly dependent of the bedding material provided (Norring et al., 2008), therefore remains a high priority to AMS dairy farm managers.
Similarly, by executing a decision tree analysis, we were able to further distinguish the ranking of each farm-based measure and the risks associated with prevalence of lameness. This enabled us to identify bedding quantity as the second most critical control point of lameness after stall base, as cows with adequate bedding quantity (≥ 2cm in the current study) on stall base of sand, rubber or geotextile mat, appeared to be less susceptible to lameness. Comparably, in Westin et al., 2016b, adequate bedding quantity (≥ 2cm, of sand, straw, sawdust, or wood shavings) was associated with lower odds of lameness (0.72). Moreover, the quantity of bedding material has an influence on cow comfort and lying behavior, thus, the depth of bedding material provided in AMS dairy farms should a high priority to farm managers as it can reduce prevalence of lameness (Leach et al., 2021).
In the present study, we also confirmed Westin et al., 2016b findings that BCS and the cow’s capability to fit stall width is significant in relation to incidence of lameness. However, by using the decision tree model, we were able to pinpoint these cow-level factors as substantial classifiers related to prevalence of lameness in AMS farms. Cow fitting stall width and cow’s BCS were classified as the third most critical factors associated with lameness, after stall base and bedding quantity. Overall, around 62% of cows in the current study were too big to fit the average stall width (2× the cow’s hip width needed), while 13% of cows had a BCS ≤2.25 (range: 0 to 40% of cows across herds). On the other hand, a correlation between low BCS and lameness has been demonstrated in numerous studies (reviewed by Huxley, 2013), and some studies suggest low BCS could predispose dairy cows to lameness (Green et al., 2014; Lim et al., 2015; Randall et al., 2015). Therefore, it is imperative that AMS farm managers provide stalls of adequate width to accommodate the size of their cows and to take corrective action for cows with a BCS <2 in order to reduce incidence of lameness and increase cow health and welfare (Westin et al., 2016b).
Finally, by using the novel decision tree approach we could determine the last classifier related to prevalence on lameness. Westin et al., 2016b identified the presence hock lesions and narrow feed alleys (<430 cm) as important risk factors for lameness. However, through the decision tree were able not only to identify risk associated with these parameters to the incidence of lameness but to rank these parameters based on their significant risk. Hock lesions and width of feed alley were identified as the last critical control points associated with lameness after stall base, bedding quantity, stall width, and cow’s BCS. Hock lesion incidence varies based on the type of stall base provided. Previous research has shown lower incidence of hock lesions on sand bedding than geotextile mats, concrete, or sawdust (Weary and Taszkun, 2000; Norring et al., 2008), and found best recovery is achieved through sand bedding (Vokey et al., 2001). Sand bedding conforms to the cow’s body allowing them to better position their legs to avoid excess pressure on the lesion, resulting in a quicker healing process and reduced incidence of lameness (Norring et al., 2008). Moreover, type of stall base and width of feed alley are associated with the risk of hock lesions and agonistic interactions within narrow feed alleys (<430 cm), causing an increased prevalence of lameness (Westin et al., 2016b), making this of significant concern to AMS dairy farmers.
5 Conclusion
The decision tree model enabled us to highlight the most important cow- and farm-based factors related to incidence of lameness in AMS herds and rank them based on their magnitude. Moreover, the decision tree model approach was able to arrange these factors into an organized flow that illustrate a pathway to monitor and control incidence of lameness in dairy herds. The current study presents a promising approach in classifying datasets and determining the criteria to achieve the most accurate predictable outcomes. Such an approach would help significantly in assessing and identifying the variables that control incidence of lameness in AMS herds. Further research still necessary to validate and improve the application of decision tree algorithms in identifying and arranging the critical farm- or animal-based factors that influence lameness on AMS farms and link them to the predictable probability of incidence. This, in turn, will help develop successful strategies to enhance housing designs and management plans to reduce the incidence of lameness in AMS farms.
Data availability statement
The data that supports the findings of this study are available upon request to the corresponding author.
Author contributions
AA, JS, KD conceptualized the study. KD, built up the decision tree algorithm. LD, and AA organized and analyzed the data. LD, AA, and JS prepared and the manuscript with input from KD. LD wrote the manuscript. AA and JS participated in the discussion and editing of the manuscript. All authors contributed to the article and approved the submitted version.
Acknowledgments
The authors thank the research team (R. Westin, A. Vaughan, A. M. de Passillé, T. J. DeVries, E. A. Pajor, D. Pellerin, E. Vasseur, D. Haley, and J. Rushen) for all their efforts with coordinating the study and onsite data collection and for allowing us to process the data further. We would also like to thank Proteek Chandan Roy for his assistance running the “Tree function” on MATLAB.
Conflict of interest
The authors declare that the research was conducted in the absence of any commercial or financial relationships that could be construed as a potential conflict of interest.
Publisher’s note
All claims expressed in this article are solely those of the authors and do not necessarily represent those of their affiliated organizations, or those of the publisher, the editors and the reviewers. Any product that may be evaluated in this article, or claim that may be made by its manufacturer, is not guaranteed or endorsed by the publisher.
References
Adams A. E., Lombard J. E., Fossler C. P., Román-Muñiz I. N., Kopral C. A. (2019). Associations between housing and management practices and the prevalence of lameness, hock lesions, and thin cows on US dairy operations. J. Dairy Sci. 100 3, 2119–2136. doi: 10.3168/jds.2016-11517
Anderson N. (2007). “Free stall dimensions,” in Infosheet - livestock technology. ministry of agriculture (Fergus, Ontario, Canada: Food and Rural Affairs).
Bach A., Dinarés M., Devant M., Carré X. (2007). Associations between lameness and production, feeding and milking attendance of Holstein cows milked with an automatic milking system. J. Dairy Res. 74, 40–46. doi: 10.1017/S0022029906002184
Bak A. S., Herskin M. S., Jensen M. B. (2016). Effect of sand and rubber surface on the lying behavior of lame dairy cows in hospital pens. J. Dairy Sci. 99, 2875–2883. doi: 10.3168/jds.2015-9937
Bicalho R. C., Vokey F., Erb H. N., Guard C. L. (2007). Visual locomotion scoring in the first seventy days in milk: Impact on pregnancy and survival. J. Dairy Sci. 90, 4586–4591. doi: 10.3168/jds.2007-0297
Bicalho R. C., Warnick L. D., Guard C. L. (2008). Strategies to analyze milk losses caused by diseases with potential incidence throughout the lactation: A lameness example. J. Dairy Sci. 91, 2653–2661. doi: 10.3168/jds.2007-0744
Borderas T. F., Fournier A., Rushen J., de Passillé A. M. B. (2008). Effect of lameness on dairy cows’ visits to automatic milking systems. Can. J. Anim. Sci. 88, 1–8. doi: 10.4141/CJAS07014
Breiman L., Friedman J. H., Olshen R. A., Stone C. J. (1984). Classification and regression trees (New York: Routledge), 42–83.
Ceballos A., Sanderson D., Rushen J., Weary D. M. (2004). Improving stall design: Use of 3-d kinematics to measure space use by dairy cows when lying down. J. Dairy Sci. 87, 2042–2050. doi: 10.3168/jds.S0022-0302(04)70022-3
Chapinal N., Barrientos A. K., von Keyserlingk M. A. G., Galo E., Weary D. M. (2013). Herd-level risk factors for lameness in freestall farms in the northeastern united states and California. J. Dairy Sci. 96, 318–328. doi: 10.3168/jds.2012-5940
Cook N. B. (2006) Footbath alternatives (United States of America: University of Wisconsin Madison). Available at: http://www.vetmed.wisc.edu/dms/fapm/fapmtools/6lame/Footbath_Alternatives.pdf (Accessed 2016-01-23).
Cook N. B., Hess J. P., Foy M. R., Bennett T. B., Brotzman R. L. (2016). Management characteristics, lameness, and body injuries of dairy cattle housed in high-performance dairy herds in Wisconsin. J. Dairy Sci. 99, 5879–5891. doi: 10.3168/jds.2016-10956
Cramer G., Lissemore K. D., Guard C. L., Leslie K. E., Kelton D. F. (2009). The association between foot lesions and culling risk in Ontario Holstein cows. J. Dairy Sci. 92, 2572–2579. doi: 10.3168/jds.2008-1532
Ebrahimi M., Esmaeil E., Michael B. C. (2015). Minimizing the cost of translocation failure with decision-tree models that predict species’ behavioral response in translocation sites. Conserv. Biol. 29 (4), 1208–1216. doi: 10.1111/cobi.12479
Eicher S. D., Lay J. D. C., Arthington J. D., Schutz M. M. (2013). Effects of rubber flooring during the first 2 lactations on production, locomotion, hoof health, immune functions, and stress. J. Dairy Sci. 96, 3639–3651. doi: 10.3168/jds.2012-6049
Elanco Animal Health (1996). Body condition scoring (Indianapolis, IN: Elanco Animal Health). Bulletin AI 8478, Rev. 9/96.
Elith J., Leathwick J. R., Hastie T. (2008). A working guide to boosted regression trees. J. Anim. Ecol. 77, 802–813. doi: 10.1111/j.1365-2656.2008.01390.x
Ferguson J. D., Galligan D. T., Thomsen N. (1994). Principal descriptors of body condition score in Holstein cows. J. Dairy Sci. 77, 2695–2703. doi: 10.3168/jds.S0022-0302(94)77212-X
Flower F. C., Weary D. M. (2006). Effect of hoof pathologies on subjective assessments of dairy cow gait. J. Dairy Sci. 89, 139–146. doi: 10.3168/jds.S0022-0302(06)72077-X
Garbarino E. J., Hernandez J. A., Shearer J. K., Risco C. A., Thatcher W. W. (2004). Effect of lameness on ovarian activity in postpartum Holstein cows. J. Dairy Sci. 87, 4123–4131. doi: 10.3168/jds.S0022-0302(04)73555-9
Gehrke J., Ramakrishnan R., Ganti V. (1998). Rainforest-a framework for fast decision tree construction of large datasets. VLDB 98, 416–427.
Gibbons J., Vasseur E., Rushen J., de Passillé A. (2012). A training programme to ensure high repeatability of injury scoring of dairy cows. Anim. Welf. 21, 379–388. doi: 10.7120/09627286.21.3.379
Green L. E., Huxley J. N., Banks C., Green M. J. (2014). Temporal associations between low body condition, lameness and milk yield in a UK dairy herd. Prev. Vet. Med. 113, 63–71. doi: 10.1016/j.prevetmed.2013.10.009
Gundelach Y., Schulz T., Feldmann M., Hoedemaker M. (2013). Effects of increased vigilance for locomotion disorders on lameness and production in dairy cows. Anim. (Basel) 3, 951–961. doi: 10.3390/ani3030951
Huxley J. N. (2013). Impact of lameness and claw lesions in cows on health and production. Livestock Sci. 156, 64–70. doi: 10.1016/j.livsci.2013.06.012
Jacobs J. A., Siegford J. M. (2012). Invited review: The impact of automatic milking systems on dairy cow management, behavior, health, and welfare. J. dairy Sci. 95, 2227–2247. doi: 10.3168/jds.2011-4943
Jewell M. T., Cameron M., Spears J., McKenna S. L., Cockram M. S., Sanchez J., et al. (2019). Prevalence of lameness and associated risk factors on dairy farms in the maritime provinces of Canada. J. Dairy Sci. 102, 3392–3405. doi: 10.3168/jds.2018-15349
King M. T. M., LeBlanc S. J., Pajor E. A., DeVries T. J. (2017). Cow-level associations of lameness, behavior, and milk yield of cows milked in automated systems. J. Dairy Sci. 100, 4818–4828. doi: 10.3168/jds.2016-12281
Koc Y., Eyduran E., Akbulut O. (2017). Application of regression tree method for different data from animal science. Pak. J. Zool. 49, 599–607. doi: 10.17582/journal.pjz/2017.49.2.599.607
Leach K. A., Charlton G. L., Green M. J., Lima E., Gibbons J., Black D., et al. (2021). Bedding system influences lying behaviour in dairy cows. Vet. Rec. 190, 15–23. doi: 10.1002/vetr.1066
Leach K. A., Tisdall D. A., Bell N. J., Main D. C. J., Green L. E. (2012). The effects of early treatment for hindlimb lameness in dairy cows on four commercial UK farms. Vet. J. 193, 626–632. doi: 10.1016/j.tvjl.2012.06.043
Lim P. Y., Huxley J. N., Willshire J. A., Green M. J., Othman A. R., Kaler J. (2015). Unravelling the temporal association between lameness and body condition score in dairy cattle using a multistate modelling approach. Prev. Vet. Med. 118, 370–377. doi: 10.1016/j.prevetmed.2014.12.015
Loh W.-Y. (2002). Regression tress with unbiased variable selection and interaction detection. Stat. Sin. 1, 361–386.
Miguel-Pacheco G., Kaler J., Remnant J., Cheyne L., Abbott C., French A. P., et al. (2014). Behavioural changes in dairy cows with lameness in an automatic milking system. Appl. Anim. Behav. Sci. 150, 1–8. doi: 10.1016/j.applanim.2013.11.003
Nordlund K., Cook N. B. (2003). A flowchart for evaluating dairy cow freestalls. Bovine Pract. 1, 89–96. doi: 10.21423/bovine-vol37no2p89-96
Norring M., Manninen E., de Passillé A. M., Rushen J., Munksgaard L., Saloniemi H. (2008). Effects of sand and straw bedding on the lying behavior, cleanliness, and hoof and hock injuries of dairy cows. J. Dairy Sci. 91, 570–576. doi: 10.3168/jds.2007-0452
Randall L. V., Green M. J., Chagunda M. G. G., Mason C., Archer S. C., Green L. E., et al. (2015). Low body condition predisposes cattle to lameness: An 8-year study of one dairy herd. J. Dairy Sci. 98, 3766–3777. doi: 10.3168/jds.2014-8863
Randall L. V., Heather J., Thomas J., Remnant G., Nicola J. B., Huxley J. N. (2019). Lameness prevalence in a random sample of UK dairy herds. Vet. Rec. 184 (11), 350. doi: 10.1136/vr.105047
Sadiq M. B., Ramanoon S. Z., Shaik Mossadeq W. M., Mansor R., Syed-Hussain S. S. (2021). A modified functional hoof trimming technique reduces the risk of lameness and hoof lesion prevalence in housed dairy cattle. Prev. Vet. Med. 195, 105463. doi: 10.1016/j.prevetmed.2021.105463
Scott V. E., Kerrisk K. L., Thomson P. C., Lyons N. A., Garcia S. C. (2015). Voluntary cow traffic and behaviour in the premilking yard of a pasture-based automatic milking system with a feed supplementation regime. Livestock Sci. 171, 52–63. doi: 10.1016/j.livsci.2014.11.002
Solano L., Barkema H. W., Pajor E. A., Mason S., LeBlanc S. J., Nash C. G. R., et al. (2016). Associations between lying behavior and lameness in Canadian Holstein-friesian cows housed in freestall barns. J. Dairy Sci. 99, 2086–2101. doi: 10.3168/jds.2015-10336
Topal M., Aksakal V., Bayram B., Yağanoğlu A. M. (2010). An analysis of the factors affecting birth weight and actual milk yield in Swedish red cattle using regression tree analysis. J. Anim. Plant Sci. 20, 63–69.
Tremblay M., Hess J. P., Christenson B. M., McIntyre K. K., Smink B., van der Kamp A. J., et al. (2016). Factors associated with increased milk production for automatic milking systems. J. Dairy Sci. 99, 3824–3837. doi: 10.3168/jds.2015-10152
Tyasi T. L., Eyduran E., Celik S. (2021). Comparison of tree-based regression tree methods for predicting live body weight from morphological traits in hy-line silver brown commercial layer and indigenous potchefstroom koekoek breeds raised in south Africa. Trop. Anim. Health Prod. 53, 7. doi: 10.1007/s11250-020-02443-y
Valletta J. J., Torney C., Kings M., Thornton A., Madden J. (2017). Applications of machine learning in animal behaviour studies. Anim. Behav. 124, 203–220. doi: 10.1016/j.anbehav.2016.12.005
Vanegas J., Overton M., Berry S. L., Sischo W. M. (2006). Effect of rubber flooring on claw health in lactating dairy cows housed in free-stall barns. J. Dairy Sci. 89, 4251–4258. doi: 10.3168/jds.S0022-0302(06)72471-7
Vasseur E., Gibbons J., Rushen J., de Passillé A. M. (2013). Development and implementation of a training program to ensure high repeatability of body condition scoring of dairy cows. J. Dairy Sci. 96, 4725–4737. doi: 10.3168/jds.2012-6359
Vasseur E., Gibbons J., Rushen J., Pellerin D., Pajor E., Lefebvre D., et al. (2015). An assessment tool to help producers improve cow comfort on their farms. J. Dairy Sci. 98, 698–708. doi: 10.3168/jds.2014-8224
Vermunt J. J. (2005). The multifactorial nature of cattle lameness: A few more pieces of the jigsaw. Vet. J. 169, 317–318. doi: 10.1016/j.tvjl.2004.05.005
Vokey F. J., Guard C. L., Erb H. N., Galton D. M. (2001). Effects of alley and stall surfaces on indices of claw and leg health in dairy cattle housed in a free-stall barn. J. Dairy Sci. 84, 2686–2699. doi: 10.3168/jds.S0022-0302(01)74723-6
von Keyserlingk M. A. G., Barrientos A., Ito K., Galo E., Weary D. M. (2012). Benchmarking cow comfort on north American freestall dairies: Lameness, leg injuries, lying time, facility design, and management for high-producing Holstein dairy cows. J. Dairy Sci. 95, 7399–7408. doi: 10.3168/jds.2012-5807
Weary D. M., Taszkun I. (2000). Hock lesions and free-stall design. J. Dairy Sci. 83, 697–702. doi: 10.3168/jds.S0022-0302(00)74931-9
Westin R., Vaughan A., de Passillé A. M., DeVries T. J., Pajor E. A., Pellerin D., et al. (2016a). Lying times of lactating cows on dairy farms with automatic milking systems and the relation to lameness, leg lesions, and body condition score. J. Dairy Sci. 99, 551–561. doi: 10.3168/jds.2015-9737
Westin R., Vaughan A., de Passillé A. M., DeVries T. J., Pajor E. A., Pellerin D., et al. (2016b). Cow- and farm-level risk factors for lameness on dairy farms with automated milking systems. J. Dairy Sci. 99, 3732–3743. doi: 10.3168/jds.2015-10414
Whay H. R., Main D. C. J., Green L. E., Webster A. J. F. (2003). Assessment of the welfare of dairy cattle using animal-based measurements: Direct observations and investigation of farm records. Vet. Rec. 153, 197–202. doi: 10.1136/vr.153.7.197
Wildman E. E., Jones G. M., Wagner P. E., Boman R. L., Troutt H. F., Lesch T. N., et al. (1982). And its relationship to selected production characteristics. J. Dairy Sci. 65, 495–501. doi: 10.3168/jds.S0022-0302(82)82223-6
Keywords: dairy cows, lameness, automatic milking system, decision tree, welfare
Citation: Davis L, Deb K, Siegford J and Ali ABA (2022) Decision tree analysis to evaluate risks associated with lameness on dairy farms with automated milking systems. Front. Anim. Sci. 3:999261. doi: 10.3389/fanim.2022.999261
Received: 20 July 2022; Accepted: 22 August 2022;
Published: 12 September 2022.
Edited by:
Genaro C. Miranda-de La Lama, University of Zaragoza, SpainReviewed by:
Siti Zubaidah Ramanoon, Universiti Putra Malaysia, MalaysiaVivi Mørkøre Thorup, Aarhus University, Denmark
Copyright © 2022 Davis, Deb, Siegford and Ali. This is an open-access article distributed under the terms of the Creative Commons Attribution License (CC BY). The use, distribution or reproduction in other forums is permitted, provided the original author(s) and the copyright owner(s) are credited and that the original publication in this journal is cited, in accordance with accepted academic practice. No use, distribution or reproduction is permitted which does not comply with these terms.
*Correspondence: Ahmed Ali, QWxpOUBjbGVtc29uLmVkdQ==