 S-K. Lindberg
 E. Durland
 K. Heia
 C. Noble
 R. Alvestad
 G.F. Difford
- 1Department of Seafood Industry, Nofima AS, Tromsø, Norway
- 2Department of Breeding and Genetics, Nofima AS, Ås, Norway
- 3Department of Production Biology, Nofima AS, Tromsø, Norway
- 4Department of Animal and Aquaculture Sciences, Norwegian University of Life Sciences, Ås, Norway
Introduction: Morphological injuries are well-established Operational Welfare Indicators (OWIs) for farmed animals including fish. They are often scored manually by human observers and this process can be laborious and prone to subjectivity and error. In this study we evaluated the use of a hyperspectral imaging system to quantify the presence and severity of external haemorrhaging in Atlantic salmon focusing on dorsal fins as a proof of concept OWI.
Methods: Two inexperienced observers manually audited dorsal fin injuries on 234 post-smolt Atlantic salmon following a standardized protocol that scored fin erosion on a 0-3 scale and also classified the injury as active/healed. The same fish were then imaged with a hyperspectral camera system and the manually scored visual assessments were compared with hyperspectral images of the same fin. Hyperspectral images were processed to segment out the dorsal fin of each fish and the presence of blood in the tissue was quantified by analysing the spectral information, yielding a fin haemorrhaging index.
Results: The hyperspectral imaging platform was robust at detecting blood in fins and could help classify active injuries more accurately than human observers. The agreement between human scorers and the image analysis tool for classifying active bleeding vs healed/undamaged fins was good with a Cohen’s kappa of 0.81 and 0.90. Accuracy between the fin haemorrhaging index and the human observers was moderate (0.61 and 0.57) and on par with the agreement between the two human observers (0.68), demonstrating the difficulty in classifying injuries that result in a reduction in fin size but may or may not result in fin haemorrhaging.
Discussion: These results demonstrate the potential power of hyperspectral imaging to improve welfare audits in aquaculture, especially where manual injury classification schemes have potentially mixed traits that involve haemorrhaging. The data also suggests that the hyperspectral camera can detect bleeding that is not readily visible to the human eye. There is a need for further testing and validation to integrate these tools into existing welfare auditing programs, but the potential advantages of the automated approach include increased sensitivity, accuracy and throughput, while producing quantitative data for researchers or management.
1 Introduction
Norway is the world’s largest producer of Atlantic salmon (Salmo salar), with more than 360 million Atlantic salmon put out to sea in 2021 (Sommerset et al., 2022). A large number of salmon are also used in research related to the industry challenges. For example, in 2020 it was reported that more than 1.7 million Atlantic salmon were used for research purposes in Norway, which accounted for 74.5 percent of the total number of reported research animals in Norway (Kristiansen et al., 2021; Mattilsynet, 2021). In both commercial and research settings the assessment and monitoring of fish welfare is increasingly important. However, the sheer number of fish in a single production system means representative recording remains a significant bottleneck. For instance, Atlantic salmon are cultured commercially in marine net-pen systems with individual units reaching e.g., 130,000 m3 and containing up to 200,000 fish (Føre et al., 2018a; Føre et al., 2018b). This makes direct human observation at commercial sites infeasible and obtaining representative samples of fish a major challenge. In practice, within each production unit the welfare is audited using a suite of Operational Welfare Indicators (OWIs). While some of these may be assessed at a group level, many (e.g., external injuries) are audited by manually examining a limited number of fish per group. In research settings the numbers of fish per tank or unit are generally far smaller, which eases the burden of obtaining representative samples. However, researchers often need to evaluate the welfare of fish before and after interventions or multiple times throughout a study, meaning individual fish are often handled numerous times in order to conduct a welfare audit. Fish must be netted, anesthetized and handled in or out of water during the auditing process and it is imperative that each part of the process is brief and minimally stressful to ensure that the act of recording welfare does not itself impair the welfare of the fish under study.
Currently, the majority of morphological OWI monitoring relies on human observers assigning scores based on a preapproved scoring scheme (see the Salmon Welfare Index Model (SWIM) (Stien et al., 2013; Pettersen et al., 2014), or the standardized scoring scheme in FISHWELL (Noble et al., 2018)). In these frameworks, injuries are scored on an ordinal rating scale (e.g., 0-3) where zero is little or no evidence of an injury and levels 1-3 indicate that the injury is increasingly evident and severe. Different scoring schemes may employ different scales, and some schemes may use different scales for different indicators (e.g. Stien et al. (2013) and Tschirren et al. (2021)). Even with training (e.g. Kristiansen et al. (2020)), the accuracy and precision of manually scored OWIs is inherently variable. Studies from both terrestrial and aquatic farming scenarios indicate that, in an operational setting, the performance of observers may be negatively impacted by adverse work conditions, fatigue, and variable base-line conditions of the stock under inspection (Kristensen et al., 2006; Heuch et al., 2011; Elmoslemany et al., 2013).
Physical injuries are well-established OWIs for farmed aquatic and terrestrial species (Noble et al., 2018; Kristiansen et al., 2020). Many injuries can include haemorrhaging to the relevant tissue, indicating acute mechanical trauma, infection, or other health problems (e.g. Noble et al. (2018) and references therein). Fin haemorrhaging, which is a common injury throughout the production cycle of Atlantic salmon, may exhibit itself throughout the fin area, or around a specific location such as the base of the fin rays (Noble et al., 2012). Haemorrhaging is indicative of an active injury which can be directly related to ongoing welfare problems in the rearing system (see Noble et al. (2012) and Noble et al. (2018)). Thus, accurate identification of fin haemorrhaging is a valuable tool for fish welfare management, allowing for the identification of current and recent welfare challenges and can help direct active mitigation in relation to these threats. In practice, fin wounds are often bundled into a mixed-type OWI termed “active fin damage” that potentially includes one or more traits such as haemorrhaging, thickening and/or splitting of fin rays (see Noble et al. (2018)). These distinct traits are frequently coalesced into a single metric for both speed and ease of use in farming situations. Trait “bundling” within an OWI can also be due to difficulties in quantifying a specific trait in operational settings due to many factors including poor lighting conditions, fatigue and unintentional bias. Fin haemorrhaging is one of these traits.
Advances in the sophistication and availability of under-water cameras and image analysis tools have made machine automated fish OWI monitoring and documentation feasible in commercial cages (Barreto et al., 2022). These tools may enable non-invasive and continuous monitoring of some individual based OWIs on a much larger proportion of the population within each production unit. In theory, this would increase the reliability and accuracy of welfare monitoring in fish culture, aiding farmers in making more precise and timely decisions (Føre et al., 2018a). Currently, standard cameras using traditional Red-Green-Blue (RGB) sensors are used for automated lice counting, passive OWI monitoring, and remote control of feeding in Atlantic salmon farming. However, water turbidity and light distortion may challenge their precision and reliability (Barreto et al., 2022). Another potential limitation to these technologies is that only one side of the fish is evaluated when the fish swim by the camera, and as the fish are currently not individually identified and tracked through the production cycle so it is not possible to link different sides to an individual fish or follow OWI progression on individuals.
Hyperspectral imaging is a spectroscopic technique that captures reflection of light at narrow wavelength bands with a level of detail that exceeds the visual perception of humans and traditional cameras. Hyperspectral cameras produce images where each pixel contains a graph that shows the composition of the light recorded by that pixel across a range of the electromagnetic spectrum. The composition of the light is dependent on the chemical and physical composition of the object being imaged, and hyperspectral images can therefore provide more information about an object’s composition than RGB images (Cancio et al., 2006; Gowen et al., 2007; ElMasry and Sun, 2010). Applications of hyperspectral imaging hitherto include food quality and safety assessments, medical diagnostics, and measurements of vegetation and crop parameters in forestry and agriculture (Dale et al., 2013; Lu and Fei, 2014; Xu et al., 2017; Lu et al., 2020). In addition, hyperspectral imaging in conjunction with automated conveyor belt delivery has resulted in numerous inline applications of non-destructive food grading, for instance nematode detection in Atlantic cod or freshness in Atlantic salmon (Sivertsen et al., 2012; Kimiya et al., 2013). Crucially, hyperspectral images can capture the oxygenation states of haemoglobin which has applications in an array of non-invasive measurement of injuries such as diabetic foot ulcers (Yudovsky et al., 2011), peripheral vascular disease (Chin et al., 2011), open wounds (Calin et al., 2015a) and burns (Calin et al., 2015b) in humans. Recently, this approach has been successfully adapted for the seafood industry to measure different oxidative states of haemoglobin in Atlantic cod fillets to detect and quantify blood (Skjelvareid et al., 2017). This imaging approach, then, is seemingly well suited for use as a tool to improve OWI assessments in aquaculture by enhancing our ability to detect and quantify wounds in fish.
In order to rigorously evaluate the technique, we constrained this study to an audit of haemorrhaging in the dorsal fin of juvenile Atlantic salmon. This is a particularly useful trait in this context as haemorrhaging, especially in eroded fins, is often difficult to assess and quantify in operational settings. Thus, the aim of this study was to evaluate the utility of inline hyperspectral imaging to quantify haemorrhaging as a specific OWI trait amongst a mixed trait classification. For this purpose, the agreement between the hyperspectral imaging and each of two human observers was compared with that of the agreement between two human observers on the same fish. Although the estimated haemorrhaging on the fins is compared to the manual fin erosion registration, we assume that there should be a correspondence between the two. To the best of our knowledge, this is the first example of using hyperspectral imaging for monitoring morphological OWIs in aquaculture.
2 Materials and methods
2.1 Terminology
In this study the following terminology will be used to describe the status of the dorsal fins (adapted from Noble et al., 2018 and Turnbull et al., 1996):
Undamaged: The fin has no or little evidence of visible injury
Degree of erosion: used to quantify reductions in fin size, manually scored 0-3, with 0 = little or no evidence of erosion, 1 = most of the fin remaining, 2 = half of the fin remaining, and 3 = very little of the fin remaining.
Active: The fin has a visible injury (splitting, thickening) that may include bleeding
Healed: The fin has a historic injury that is now healed (with e.g., a smooth distal edge) and is no longer bleeding
Haemoglobin abundance: The sum of the three regression coefficients for haemoglobin obtained by performing a regression analysis on the signal from the hyperspectral camera using pure haemoglobin spectra as predictor variables (see methods)
Fin haemorrhaging index: A compound index (square root of area of wound x haemoglobin abundance/total fin area) from the hyperspectral imaging pipeline (see methods)
2.2 Fish
The use of fish was performed in strict accordance with the Norwegian Animal Welfare Act of the 19th June 2009, in force from 1st January 2010. The study was based on post-mortem sampling of material from fish undergoing a growth and smoltification experiment which included fish biopsied for gill filaments and haematological parameters under ethical approval 19679 Forsøksdyrforvaltningens tilsyns- og søknadssystem (FOTS). The regulation states that it is legal to sample from animals post-mortem without a specific license.
A total of 1044 individually PIT (Passive Integrated Transponder) tagged Atlantic salmon parr of the Benchmark genetic strain (Benchmark Genetics AS), average weight 76.3 g, were kept in a single freshwater flow through tank (volume = 3.2 m3, diameter = 2 m) at the Nofima Centre for Recirculation Aquaculture at Sunndalsøra (Sunndalsøra, Nofima AS). For the duration of the trial, the fish had ad libitum access to 3-4 mm Nutria Olympic pellets (Skretting, Norway). After a two-week acclimation period, the fish were subjected to a standard smoltification scheme: a 6-week short day length (12 hour light: 12 hour dark) period, followed by 7 weeks on a 24 hour light regime (Handeland & Stefansson, 2001). During each of the 7 weeks of the 24-hour light regime, groups of 60 salmon were transferred to a recirculation sea water tank (3.2 m3) to study longitudinal variation in smoltification parameters. The fish remained in the seawater tank for a further 18 weeks at which point the fish were euthanized with a lethal dose (20 g/L) of MS-222 (Finquel, USA) for 20 minutes. Euthanasia was confirmed by observing a lack of eye reflex (Kestin et al., 2002). Individual identity (PIT) and OWIs were recorded as described below.
2.2.1 Manual scoring of OWIs
A total of 20 fish from each of the weekly experimental groups were each assigned a unique alias number linked to their respective PIT tag identification number. Each of the fish was then independently manually scored by two human observers, each in a separate room before imaging. The manual observers had a fixed work surface with additional lighting, and the manual scoring of fish was conducted as per the standardised FISHWELL scoring scheme (Noble et al., 2018) with the FISHWELL scoring poster within direct line of sight of each scorer. The manual observers were naïve OWI scorers and had never used the FISHWELL scoring scheme before. They therefore conferred on the scoring scheme before measurement and again after the first 50 fish were scored. The scores from the first 50 fish were then discarded from further analysis. In total, 290 fish were scored for OWIs over two consecutive days. Fin damage on these fish was classified according to the degree of fin erosion (see terminology above). The scorers then further classified each erosion category (0-3) as either active (ongoing welfare problem) or healed (injury is no longer active and the distal edge of the fin is smooth) according to Noble et al. (2018). The correspondence between the two scorers, as well as each scorer and the camera values, was then analysed for both fin size score and injury status (active injury, healed injury or no injury) with the limitation that the camera only aims to separate between active injuries vs healed or no injury. After merging the data sources, a total of 234 fish were scored by both human observers and imaged with the camera.
2.2.2 Hyperspectral image acquisition
The imaging platform consisted of a hyperspectral line scanning camera mounted above a conveyor belt with a custom illumination setup (Figure 1). The hyperspectral camera was a Hyspex VNIR-1800 (Hyspex, Norway). A 1 m focusing lens was fitted to the aperture, and the camera was mounted at a 1 m distance facing the nadir, which resulted in a 300 mm field of view across the conveyor belt. This camera operates with 186 spectral bands in the spectral range 400-1000 nm, and it has 1800 spatial pixels. This yielded a cross-track spatial resolution of 0.17 mm. The conveyor belt was operated at 200 mm/s, and with a frame rate of 265 frames per second, the along-track resolution was 0.75 mm.
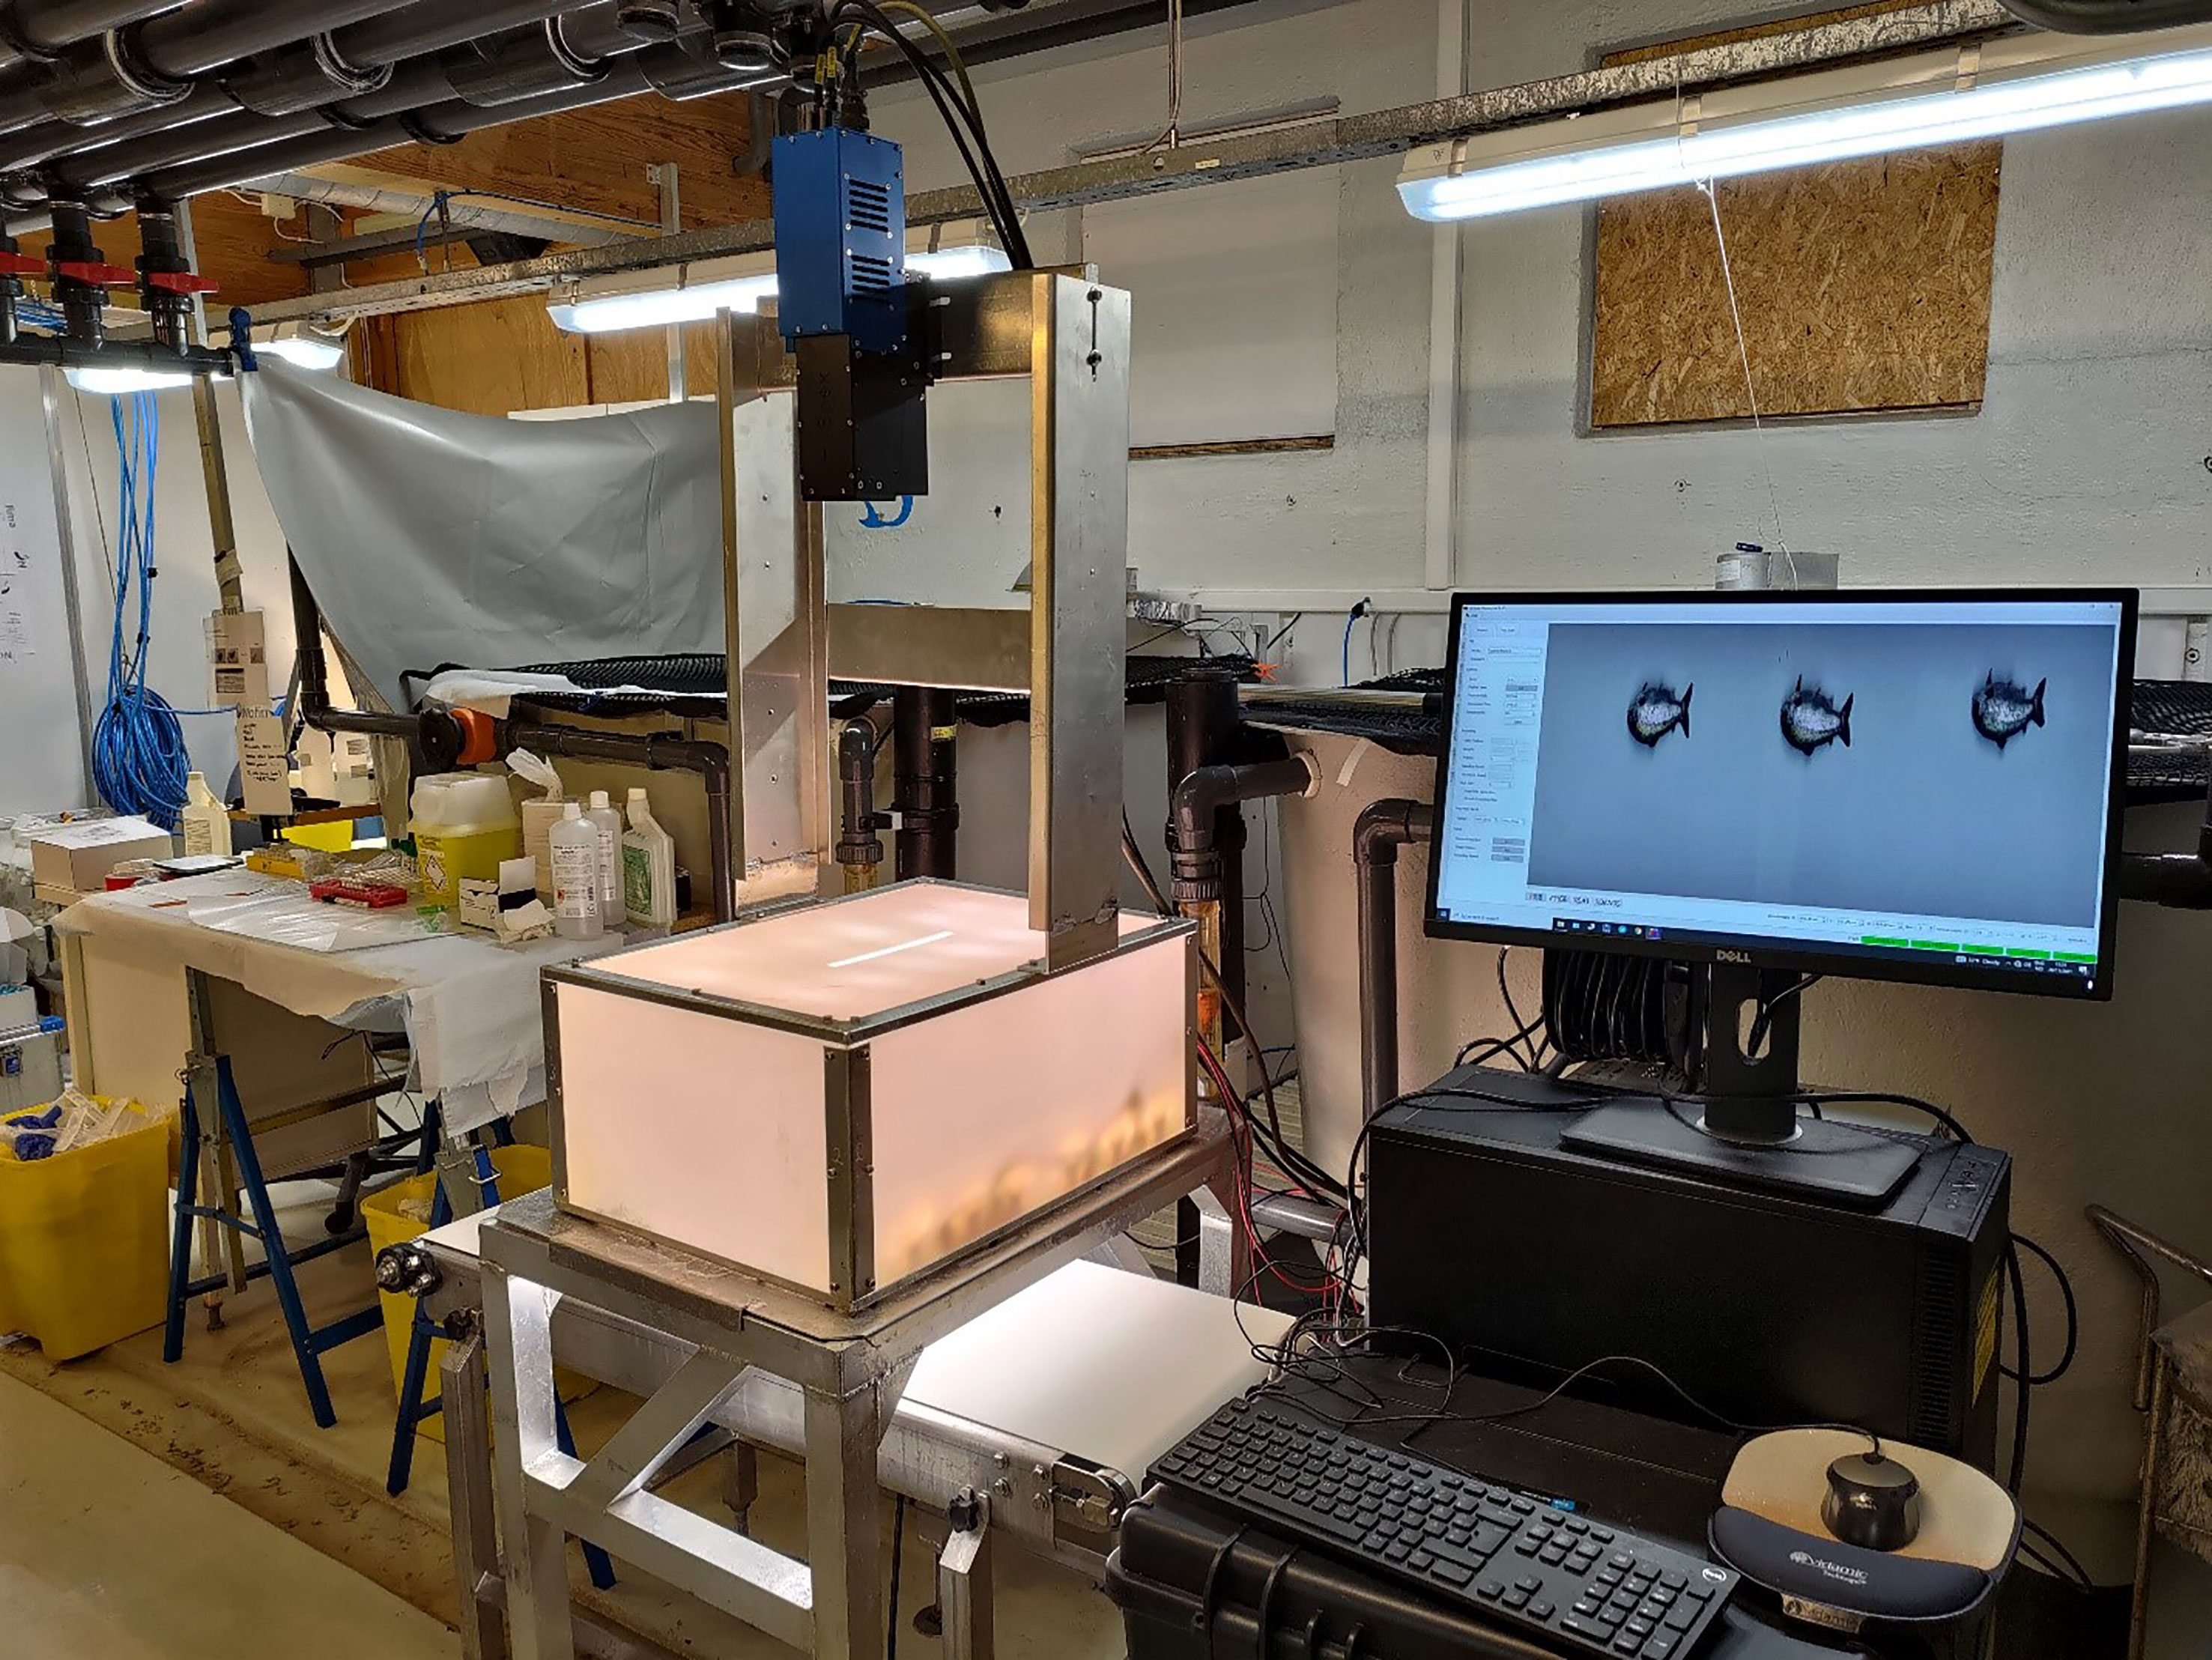
Figure 1 Imaging setup. A conveyor belt is illuminated by halogen light bulbs in an open-bottomed Teflon box, which produces an even diffuse field of light. A hyperspectral pushbroom camera is mounted above the Teflon box and scans the conveyor belt through a slit in the top of the box. The camera is operated by a computer alongside the conveyor belt.
The illumination consisted of a Teflon box with 14 conventional halogen light bulbs of 50 W each mounted on the inside. This box had a slit in the top for the camera field of view and an open bottom which allowed the light to spread diffusely over the conveyor belt.
The images were transformed from digital numbers to reflectance values by dividing by a white reference obtained by imaging a 2 cm thick Teflon plate. Both the images and the white reference were corrected by subtracting the dark reference (image obtained with shutter closed) prior to the transformation. The reflectance values (R) were transformed to apparent absorbance (A) by the relation:
The images were spatially down-sampled in both the cross-track direction and the along-track direction to produce square pixels with 0.5 mm sides.
2.3 Hyperspectral analysis
The spectral analysis was done using a custom program written in IDL version 8.7.1 (L3Harris Geospatial Solutions, Inc). The fish were segmented from the conveyor belt background, and then further into individual fins. The hyperspectral images were then analysed for blood using constrained spectral unmixing as described in Skjelvareid et al. (2017). Oxyhaemoglobin, deoxyhaemoglobin and methaemoglobin, the three oxidation states of blood haemoglobin, were used as reference spectra for the blood. Water and fat were also included to account for the absorbance in the near infrared range, as well as a selection of pigments (astaxanthin, cantaxanthin and betacarotene) since these can occur in farmed salmon tissue depending on the composition of the feed. Finally, a reference spectrum for the colouration of the muscle, excluding the blood and pigments, was included to improve the fit of the light absorption model.
An index for dorsal fin injuries was calculated from the images based on the apparent absorption contribution of haemoglobin and the area of the fin as visible in the images. The estimates of the three haemoglobin oxidation states were summed to yield one blood abundance value per pixel, and a threshold was set on the blood abundance manually via a grid search at increments of 0.1 and visual appraisal to effectively delineate areas of the fish with very obvious haemorrhaging like those from wounds or in the fins. An example of this is shown in Figure 2, and the manual OWI scores for different image outputs are shown in Figure 3 for observer 1 (Figure 3A) and observer 2 (Figure 3B). For each threshold, the mean blood abundance was multiplied with the area of the corresponding region, and these products were then summed for each feature (fin). These values were then averaged for each of two images (left and right) per fish and divided by the area of the fin calculated from the images to account for fin erosion. Finally, the values were square-root transformed to achieve an approximation to a gaussian distribution. We will refer to the result of these readings and computations as the fin haemorrhaging index in order to keep subsequent references succinct.
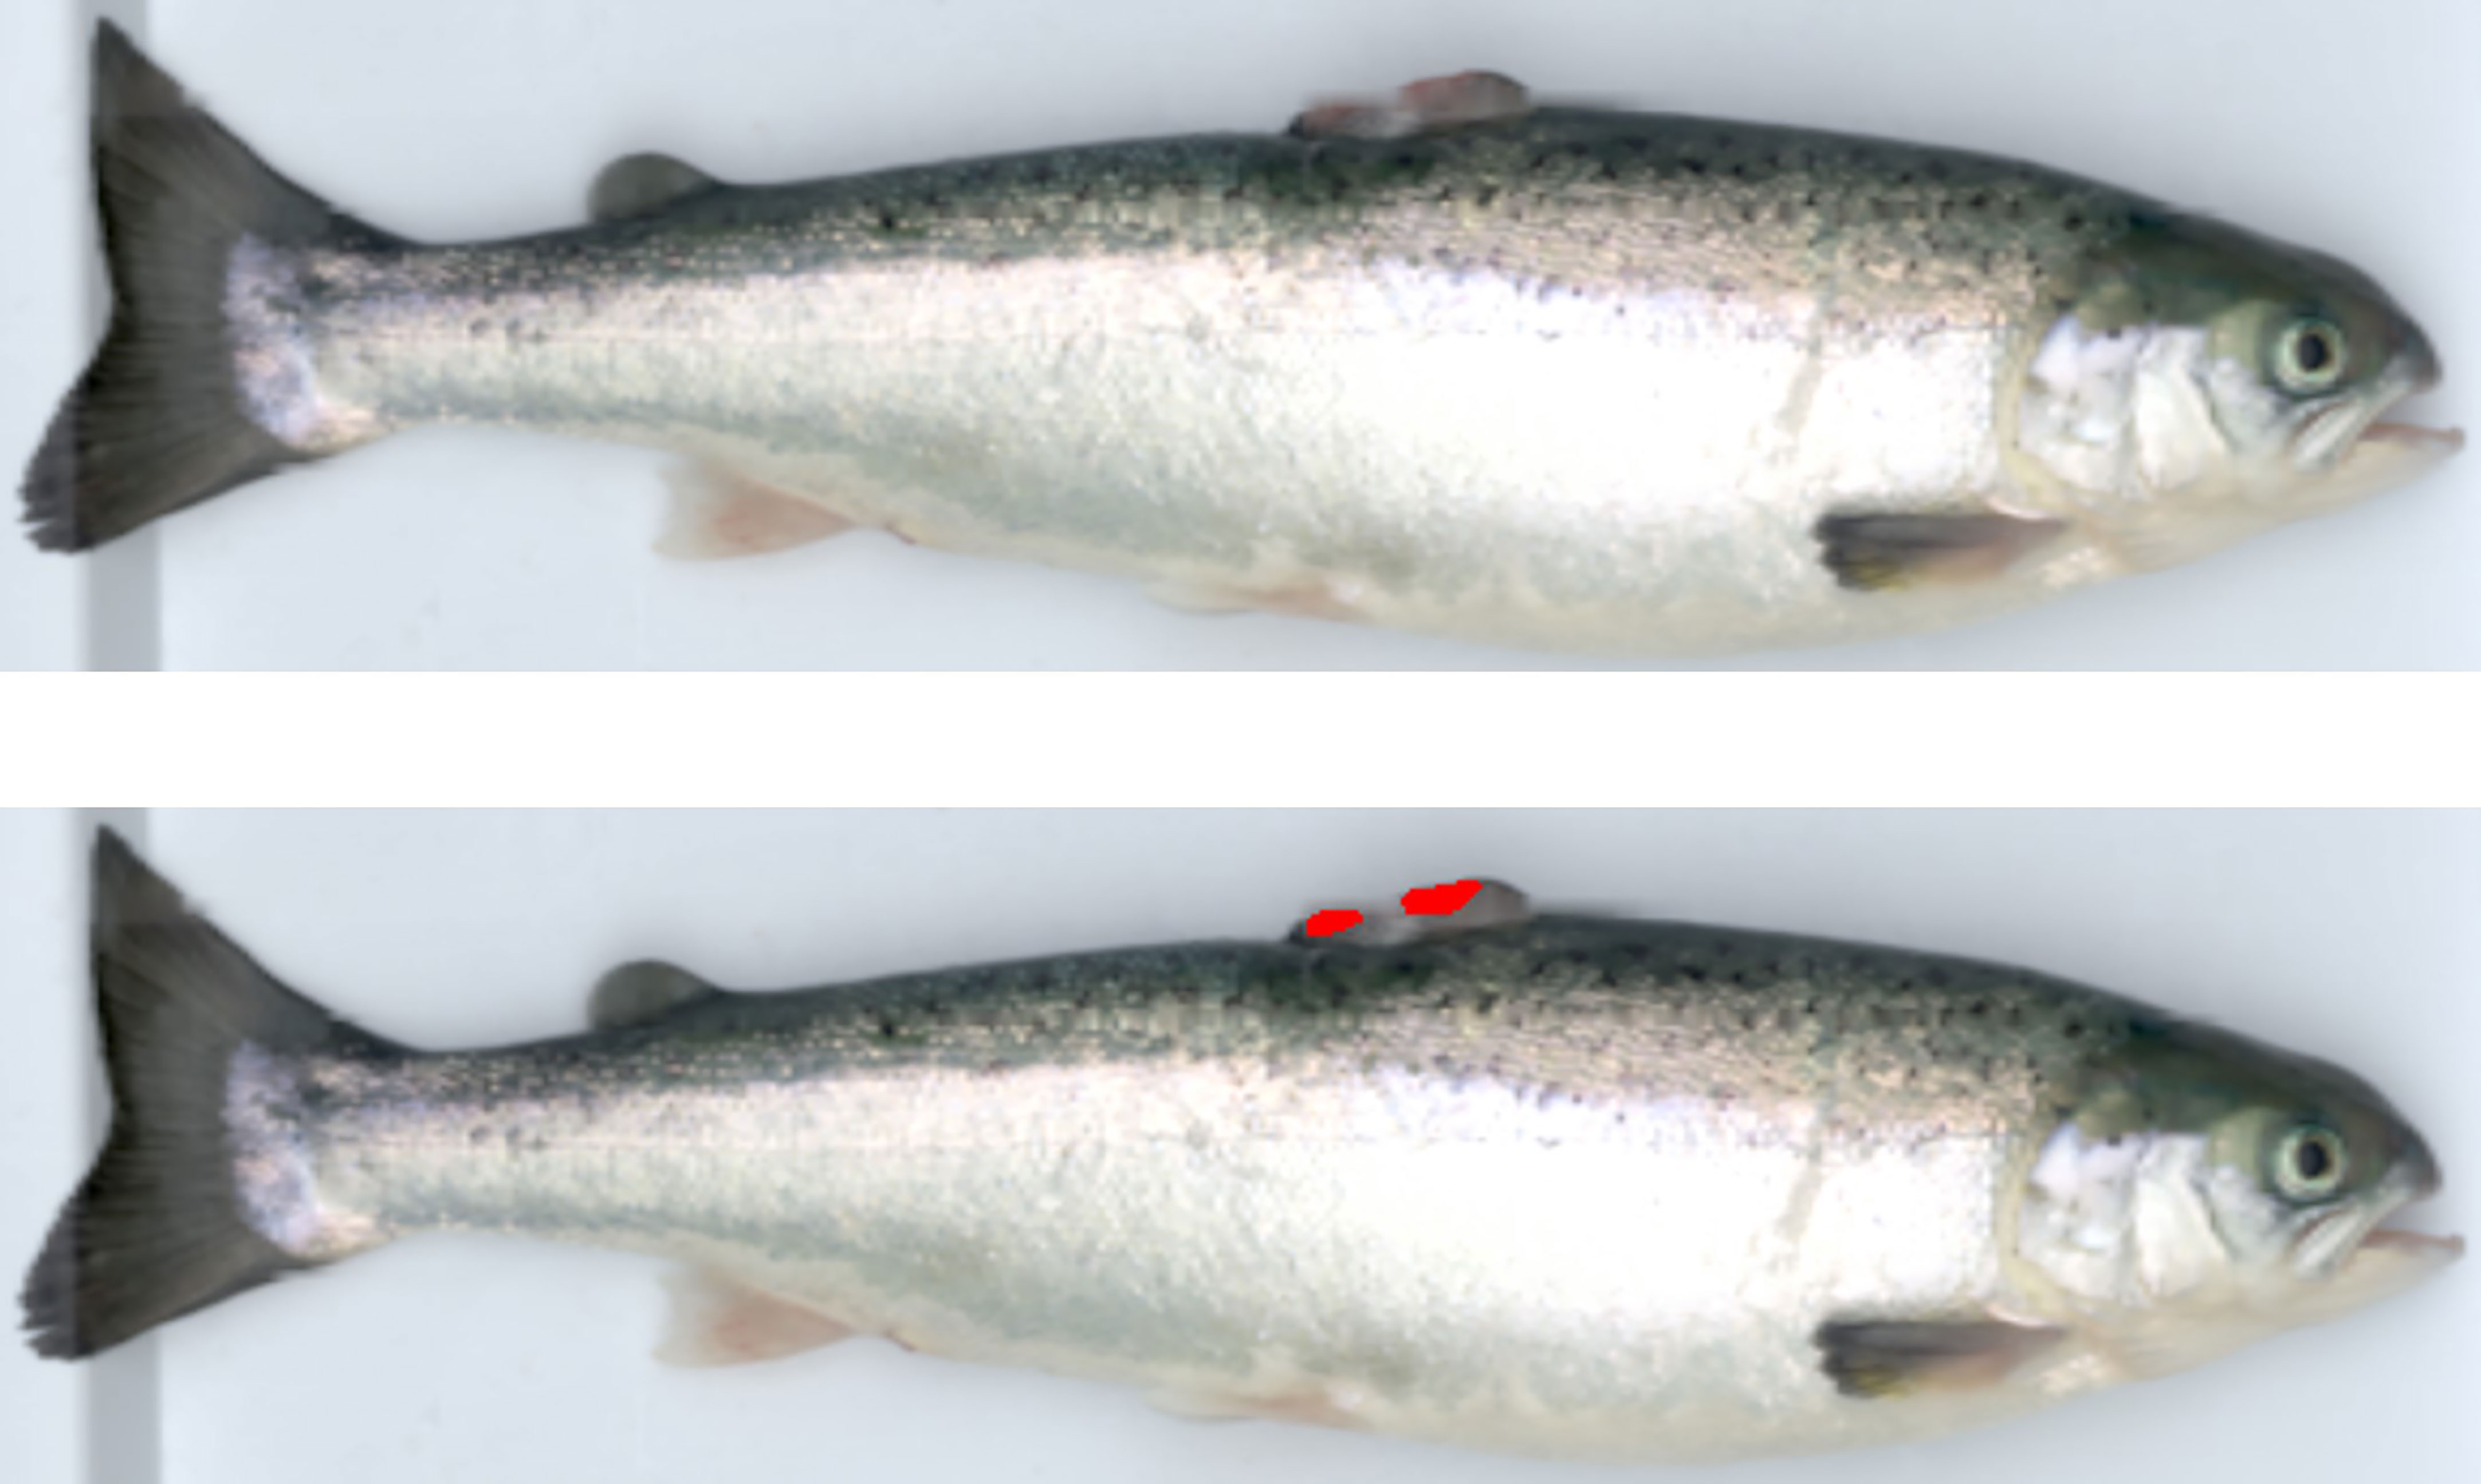
Figure 2 An example of the blood analysis for the dorsal fin. These RGB images were made from CIE RGB colour values calculated from the spectral data (see e.g., Broadbent, 2004). The red areas show the parts of the dorsal fin where active haemorrhaging was detected from the image.
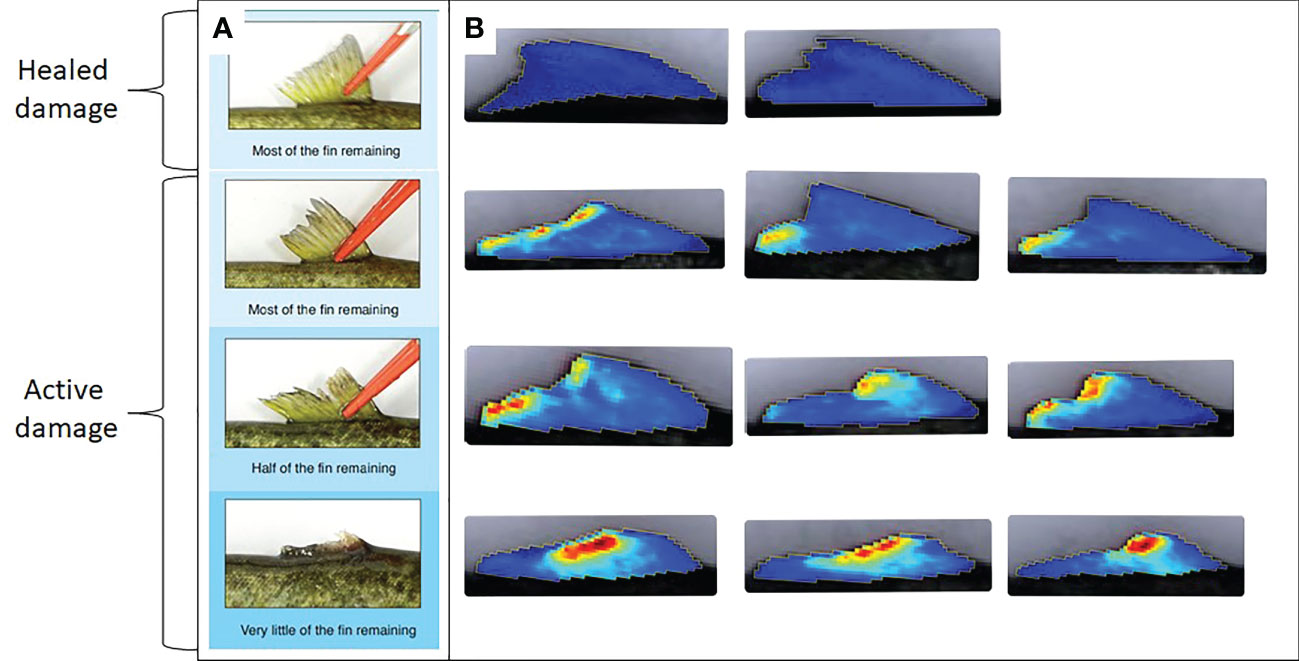
Figure 3 (A) Different categories of fin erosion reproduced from FISHWELL with permission; Noble et al., 2018 distinguishing severity category as well as active vs healed/undamaged status. (B) corresponding fin images from the present study with blood intensity visualized on a blue-red color scale from Breeze; Prediktera 2022).
2.4 Statistical analyses
All statistical analyses were conducted using the statistical software R (R Core Team, 2021). This included the following packages: caret (Kuhn, 2020), dplyr (Wickham et al., 2021), ggdist (Kay, 2022), ggplot2 (Wickham, 2016), irr (Gamer et al., 2019) and openxlsx (Schauberger & Walker, 2019).
A presence/absence analysis was used to distinguish between blood in active dorsal fin injuries and healed or undamaged dorsal fins. The ground-truth presence of an active injury was defined as any non-zero fin size score which was classified as active by the human observers. For the automatic scoring with hyperspectral images, the presence of an active injury was defined as a fin haemorrhaging index higher than zero. The accuracy, sensitivity, specificity, and Cohen’s kappa (κ) were used to compare manual to automatic scoring approaches. Accuracy was calculated as the overall proportion of correct binary classifications, while sensitivity was the proportion of correctly classified true positives, and specificity was the proportion of correctly classified true negatives. Cohen’s κ is an alternative metric to accuracy and takes into account the number of instances of present and absent, and the probability that the reference and prediction agree by chance (see Cohen (1960) for details).
Fish with active injuries were analysed further to test the correlation between the severity of haemorrhaging detected in images and the score assigned by each of the human observers. Correlations between OWI scores and fin haemorrhaging index values were investigated with polychoric correlation (Cox, 1974; Shiina et al., 2018), which is useful for studying the correlation between a discrete ordinal variable and a continuous variable since it assumes that the discrete variable is an expression of an unobserved latent variable.
Finally, the human scores from the two scorers were compared. The percentage agreement, and Cohen’s κ were used as measures of inter-observer reliability. The percentage agreement is the proportion of scores where both observers agree, while Cohen’s κ, as described above, corrects for the possibility that the scorers can agree by chance, for which it was originally derived.
3 Results
Tables 1, 2 show the distribution of OWI scores across the different fin size scores for the dorsal fin according to observer 1 and 2 respectively. Due to the spontaneous nature of the injuries the score distribution is somewhat uneven across the different categories.
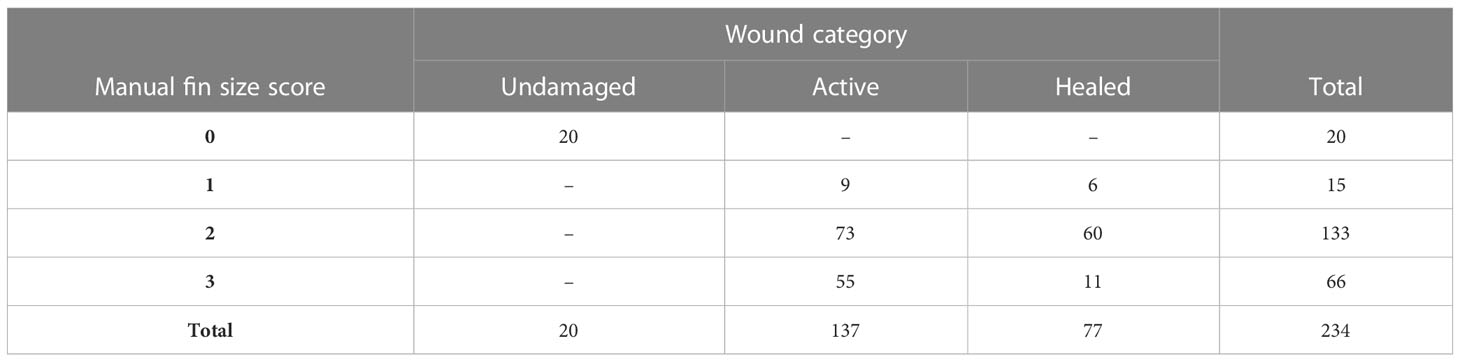
Table 1 Distribution of OWI scores distributed across dorsal fins with active injuries and undamaged or healed fins as scored by observer 1.
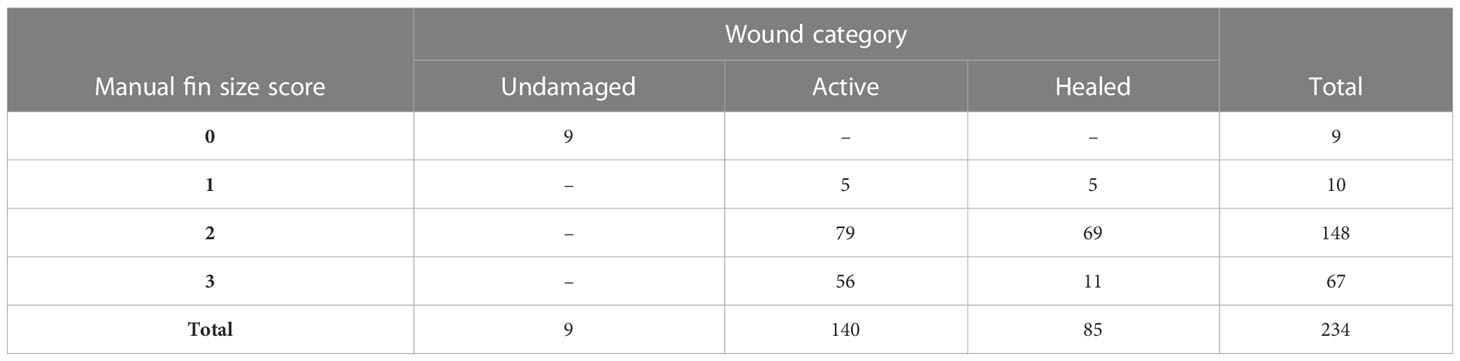
Table 2 Distribution of OWI scores distributed across dorsal fins with active injuries and undamaged or healed fins as scored by observer 2.
Fish with undamaged fins n=9 - 20 depending on observer, had an overall lower length to weight ratio (Figure 4). This was It was noted during the trial by one of the human observers that some of these were clearly pinheaded or emaciated. This suggests that the fish with undamaged fins might have avoided injuries due to behavioural differences from the otherwise healthy fish.
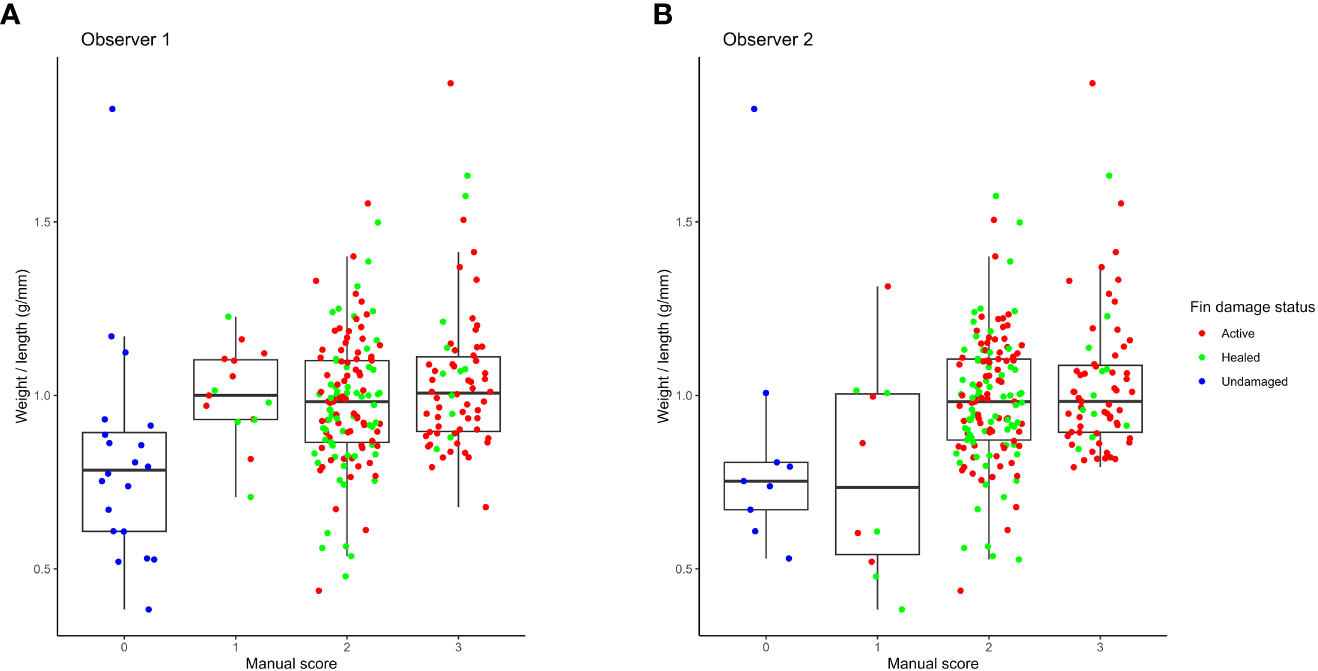
Figure 4 Distributions of weight to length ratios for the different fin size scores as scored by observer 1 (A) and observer 2 (B).
The relationship between OWI scores and the haemorrhaging index for all fin damage statuses is represented in Figure 5, while Figure 6 shows the same relationship for the active injuries only, with panel A corresponding to observer 1 and panel B to observer 2. Fins classified by the human observers as undamaged or healed were largely absent of detectable blood, with a few (n=15) exceptions. We also observed a generally positive correlation between OWI score categories and the haemorrhaging index.
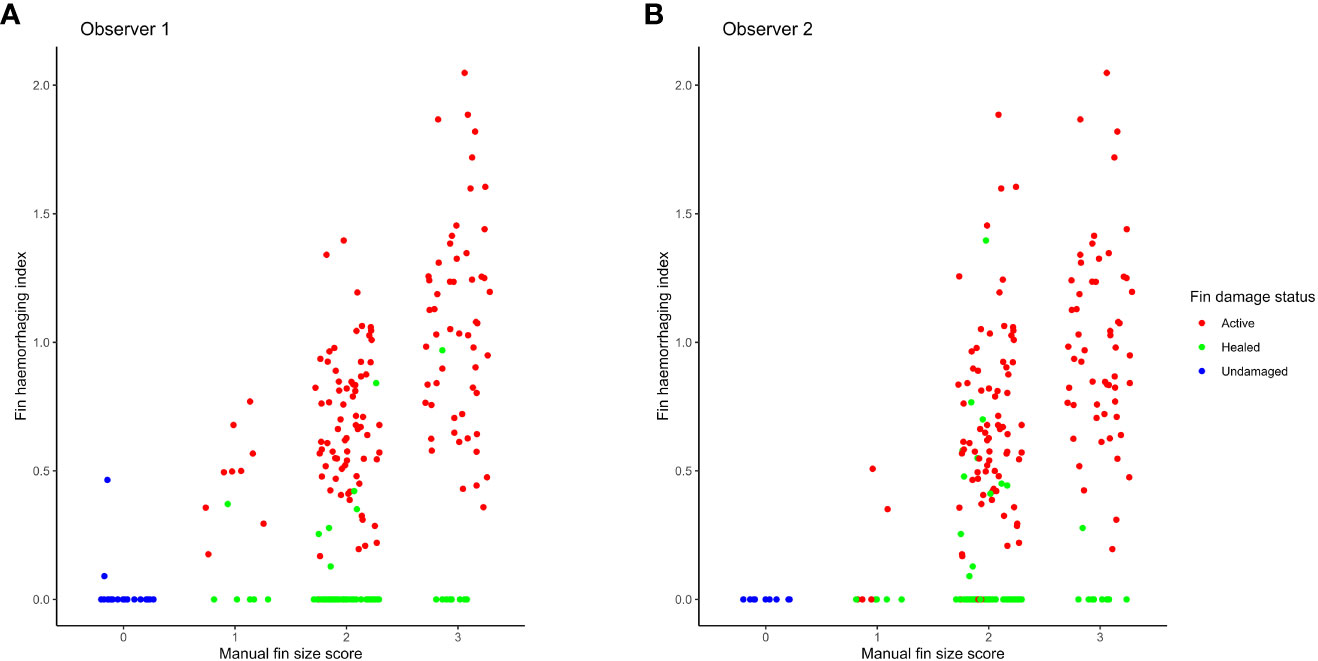
Figure 5 Fin haemorrhaging index relative to manual fin size scores, colored according to injury status, for observer 1 (A) and observer 2 (B).
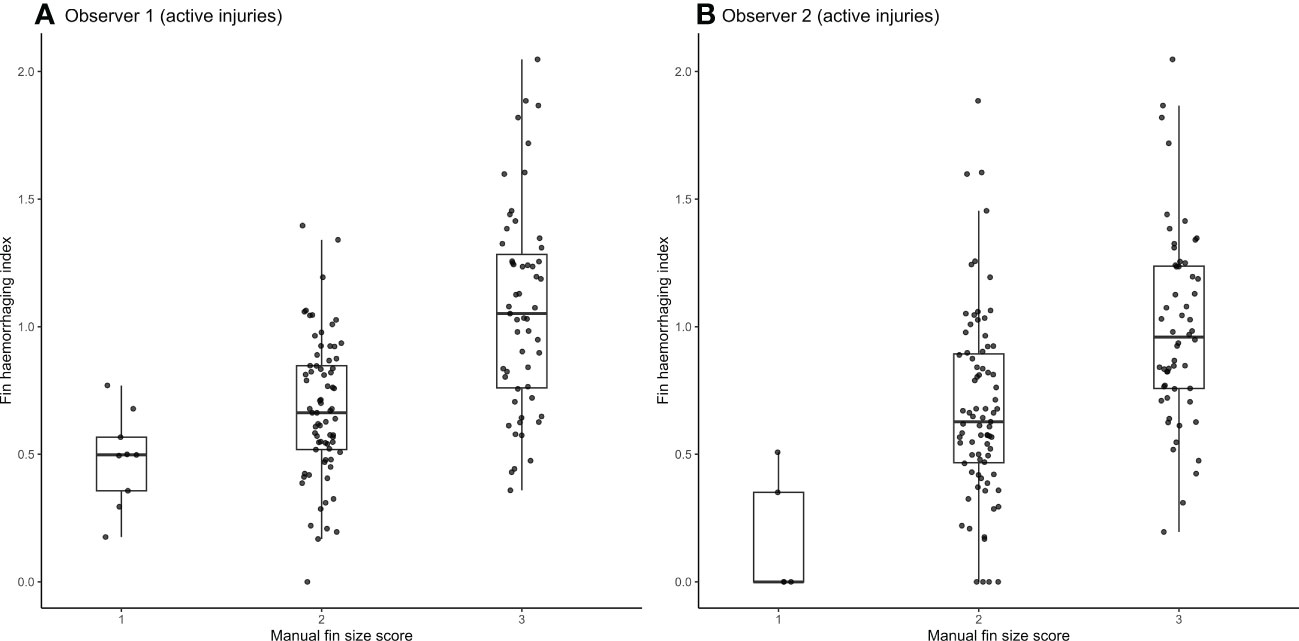
Figure 6 Fin haemorrhaging index for active fin injuries across differing fin size scores by manual observer 1 (A) and manual observer 2 (B).
3.1 Detection of active versus healed and undamaged fins
The results of the predicted classification of fins with active wounds versus healed and undamaged fins using the fin haemorrhaging index against the human observers is displayed in the confusion matrices in Table 3. Manual and automatic scoring methods had broad agreement, with few false positives and false negatives.
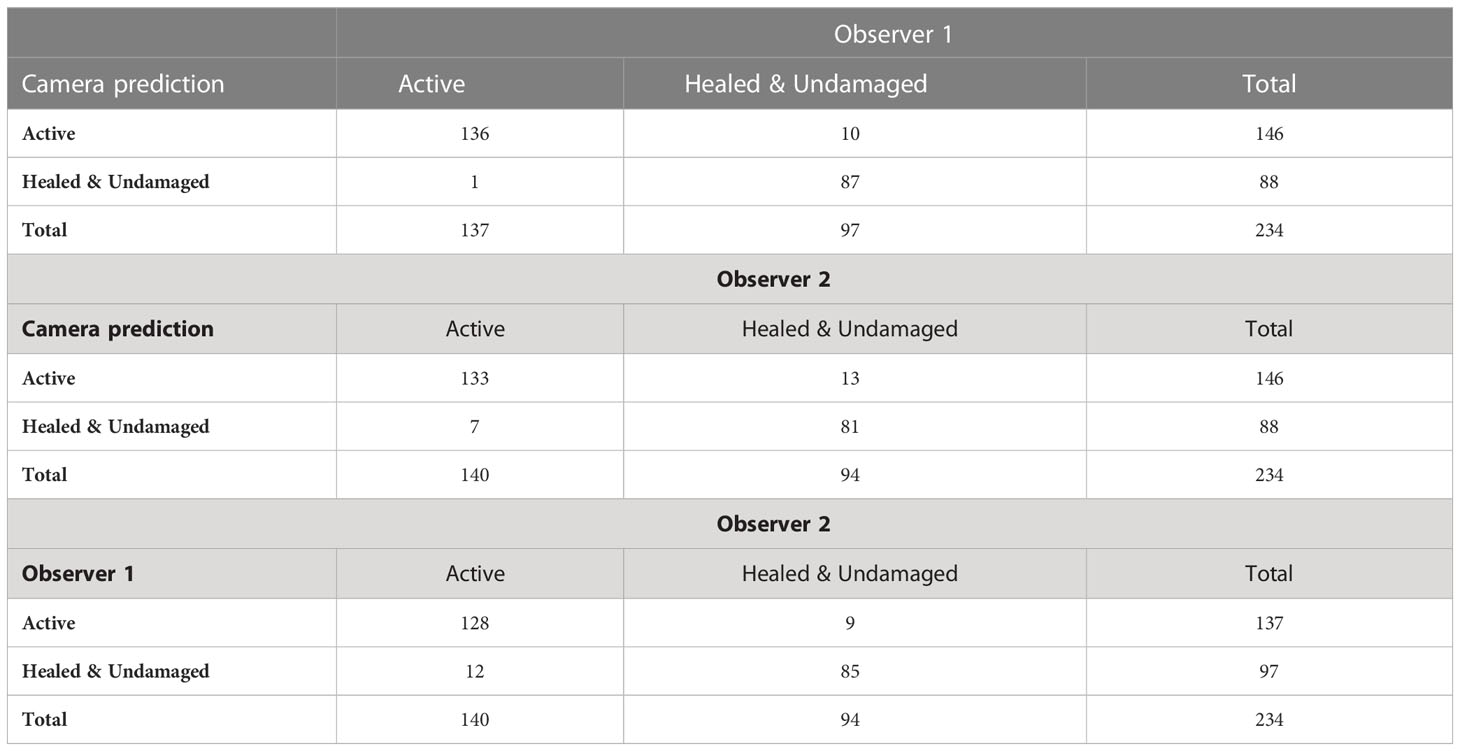
Table 3 Confusion matrices for distinguishing active injuries from healed or undamaged dorsal fins between dorsal fin haemorrhaging index and human observers, as well as between human observers.
The agreement indices for classifying active versus healed or undamaged dorsal fin injuries for the fin haemorrhaging index between observer 1, observer 2 and the camera are contrasted in Table 4. In general, the agreement was high between all parties with Cohen’s kappa values in the range 0.81-0.90.
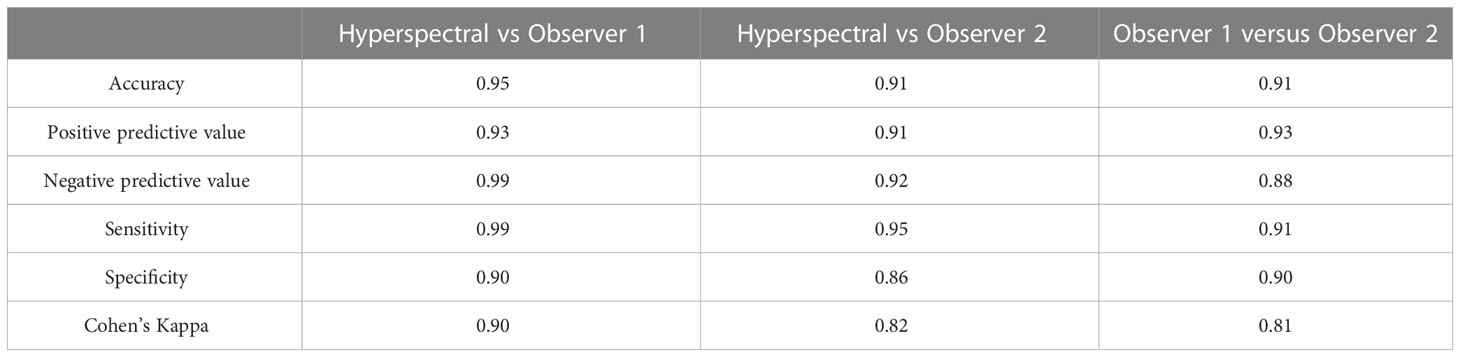
Table 4 Measures of performance in classifying active versus healed or undamaged dorsal fins using hyperspectral imaging as compared to two human observers.
3.2 Correlation analysis
The confusion matrix for fin size scores between observer 1 and observer 2 is shown in Table 5.
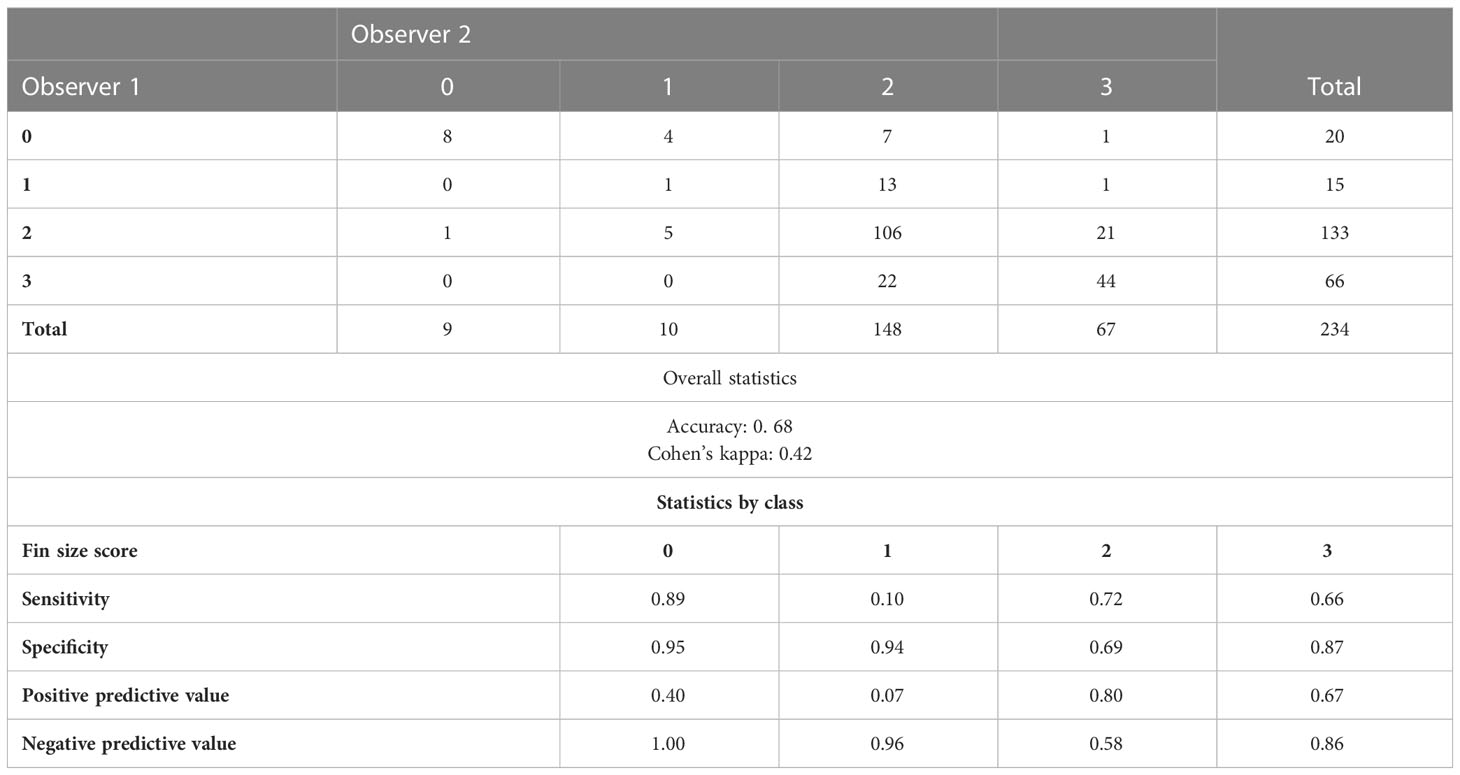
Table 5 Confusion matrices for fin size scores between the two human observers for 234 post-smolt Atlantic salmon.
The polychoric correlation between manual fin size scores and fin haemorrhaging index was 0.61 for observer 1 and 0.57 for observer 2. This is to be interpreted as the correlation between the fin hamorrhaging index and a latent normal distribution that, when partitioned into discrete scores, yields the manual fin size scores.
4 Discussion
The present study describes an innovative high throughput hyperspectral imaging system for quantifying the presence and severity of dorsal fin haemorrhaging as an OWI for Atlantic salmon. By targeting spectral signatures of fish haemoglobin, we detected active injuries with greater sensitivity than human observers and did so with greater precision and throughput than manual methods. Furthermore, we found that despite the inherent difficulties in comparing ordinal scales to quantitative data, the overall agreement between the spectral image analysis and two human observers is comparable to the comparison between two independent human observers. Moreover, the increased information provided through this approach (i.e. a haemorrhaging index rather than a score) is expected to substantially improve welfare assessments for salmon aquaculture.
4.1 Distinguishing active haemorrhaging injuries from healed or undamaged fins
The handling of Atlantic salmon in research and commercial settings is usually kept to a minimum due to the potential negative effects handling can have upon production and welfare. As a consequence, OWIs are often either sparsely and infrequently recorded or recorded in very small numbers of fish (< 20) during routine operations such as lice counting. For welfare assessments, distinguishing between active and healed wounds is a critical task as it can have an impact on ongoing and future welfare risk assessments in relation to, for example, the choices the researcher or farmer makes in relation to any potential fish handling events. This information can also be linked to historical management information to help diagnose whether the injury is likely the result of mechanical processes (e.g., crowding or handling) or potentially the result of pathogenic agents (Sveen et al., 2019).
We found that the classification of active and healed or undamaged wounds on dorsal fins using hyperspectral imaging was highly effective with an accuracy of 0.95 and 0.91 for observer 1 and 2 respectively. This is a slight improvement to the same assessment by two human observers who classified injuries as active or healed/undamaged with an accuracy of 0.91. The very high agreement between automatic and manual classifications was also robust, even accounting for random probability and the disparity of numbers across classes (κ = 0.90 and κ = 0.82) which was on par with that of the two human observers (κ = 0.81) (Landis and Koch, 1977). Notably, hyperspectral imaging also identified several cases where measurable blood was detected that was not observed by the human scorers. This adds to the evidence base that manual detection and scoring of fin haemorrhaging is a difficult task. It appears that this is true even in experimental settings where there can be substantial agreement between human observers, and where OWI auditing conditions can often be more stable than those encountered in the field.
Unexpectedly, human observers identified several fish with undamaged dorsal fins. In smoltification trials, such as the one conducted here, completely ndamaged dorsal fins are rare. It was observed, however, that the mean length to weight ratio for these fish was notably lower than the rest, supporting the findings of MacLean et al. (2000) who suggested that smaller Atlantic salmon parr in larger groups can have less dorsal fin damage than their conspecifics by adopting feeding strategies that reduce feed intake and avoid potential injuries caused by feeding competition.
To the best of our knowledge this is the first study to report the classification of active and healed wounds and undamaged fins in any aquaculture species from hyperspectral image analysis or human observers, which makes comparisons from the existing literature challenging. However, the detection of wounds in salmonids for product quality grading on e.g., a fillet processing line using image-based systems is not new. Balaban et al. (2011) imaged 16 fillets from red salmon (Oncorhynchus nerka) and investigated bruising and bloods spots using a camera system but did not report agreement metrics like accuracy or Cohens kappa. Sture et al. (2016) used a 3D camera system to classify winter ulcers and deformities in 105 Atlantic salmon, and while their system detected winter ulcers with an accuracy of 0.82, we retrospectively calculated the Cohen’s kappa at 0.62. There are also multiple examples of computer vision-based classification of both binary behavioural traits and health traits in livestock. For instance, Denholm et al. (2020) classified the presence of bovine tuberculosis with an accuracy of 0.78 – 0.95 using pseudo-images derived from milk infrared spectra by training a deep learning algorithm. Likewise, our values are higher than those reported for detecting digital dermatitis using hoof images in dairy cattle (accuracy = 0.71-0.88, Cohen’s kappa 0.36-0.51) (Cernek et al., 2020). Our findings are also comparable to ongoing work in swine, where drinking, feeding and nursing behaviour were classified from video images with accuracies of 0.98, 0.95 and 0.88 respectively (Yang et al., 2020).
The largest body of comparable work in human biomedical research relies on binary or multiclass classification of wounds. Goyal et al. (2020) classified ischaemia vs non-ischaemia wounds and infected vs non-infected wounds with accuracies of 0.90 and 0.73 using a variety of machine and deep learning methods in the public RGB image diabetes foot ulcer (DFU) dataset. Similarly, Alzubaidi et al. (2022) used transfer learning and convolutional neural networks for binary classification of normal and abnormal ulcers from the DFU dataset and achieved accuracies in the range of 0.77 - 0.88. Rostami et al. (2021) extended classification from binary to multiclass wound categories (surgical, diabetic and venous ulcers) in the DFU dataset and used ensemble deep convolutional neural networks, achieving accuracies in the range 0.88 - 0.92. From the above-mentioned comparisons, it becomes clear that binary classification of wounds from images is highly effective across species and systems and that our results are firmly in alignment with recent developments in human biomedical research.
4.2 Determining the size and severity of active dorsal fin injuries
Determining the severity of injuries is a challenging task for computer vision and human observers alike. Whilst binary or multiclass classification of different kinds of wounds are increasingly prevalent in human biomedical research, research into classifying severity within wound classes where there is an implicit order to classes is very scarce (Anisuzzaman et al., 2022). In general, the challenge lies in finding a suitable gold standard or reference method from which to train and evaluate classifiers, which in many cases relies on trained human observers to score severity. As reviewed by Aeffner et al. (2017), human observers have their own inherent fallibility. This is known as the gold standard paradox and is particularly challenging in digital imaging. For instance, van Netten et al. (2017) found poor validity and reliability of clinicians scoring DFU in foot images. Even the most accurate digital method of measurement will compare poorly to an imperfect gold standard. When human observers are naïve or untrained, this comparison can become even more problematic. In the present study we use the comparison between hyperspectral imaging and human observers versus a comparison between the two human observers to gauge the agreement that can be expected if the human observers were to be cautiously used as a benchmark. Whilst observer experience does not always correlate with improved scoring reliability (Meagher, 2009), it must be explicitly stated that each of the observers were naïve users of the scoring scheme and received just 60 minutes training and joint discussions before undertaking the OWI scoring audit and once again after 50 fish were scored. The FISHWELL scoring scheme is aimed at widespread use and standardisation of OWI scoring by non-expert users, and the results herein are thus well within the operational ranges expected when this scheme is used in practice.
The causes of fin erosion or wounds is a very active field of research and can be linked to numerous effects such as disease, genetics, behaviour and management interventions (See Ellis et al., 2008 for an in depth review). When classifying fin wounds in Atlantic salmon several scoring schemes are available, but one that is receiving increased traction in both research and commercial settings is the FISHWELL scoring scheme (Noble et al., 2018), recently updated by Nilsson et al. (2022). In the FISHWELL scoring scheme, fin size/erosion is classified according to a 0-3 scale (0 = little or no evidence of fin erosion, 3 = very little of the fin remaining). Each size category is then classified as having an active injury or being healed. However, the active injury classification includes a number of mixed traits e.g., fin splitting between the fin rays, thickening of the fin tissue or focal or diffuse haemorrhaging within the fin (see Noble et al., 2018). This is challenging if an observer wishes to elucidate specific traits within the injury classification. By defining the fin haemorrhaging index as the abundance of haemorrhaging per unit surface area of the fin, a positive association was detected with increasing fin erosion. Whilst the agreement between two human observers was 0.42 (Cohen’s kappa), the polychoric correlation between fin haemorrhaging index and manual fin size scores was 0.61 for observer 1 and 0.57 for observer 2. These findings are congruent with a recent study classifying wound severity into three classes in DFU, (venous leg ulcers, pressure ulcers and surgical wounds) using deep neural networks which achieved overall accuracies in the range of 0.69 (Anisuzzaman et al., 2022). Further demonstrating the difficulties in achieving high accuracies of classification of wound severity. However, the use of the fin haemorrhaging index achieves comparable agreement with a human observer as between two human observers as well as comparable accuracies to literature classifying wound severity.
Hoyle et al. (2007) reported a Cohen's kappa inter-observer agreement on scoring fin erosion of rainbow trout (Oncorhynchus mykiss) into six categories by three trained observers as either 0.41 (moderate) or following a 6 month break and further training, as 0.64 (substantial). Interestingly, the trained observers in the Hoyle et al. (2007) study also manually recorded fin haemorrhaging with a Cohen’s kappa agreement of 0.39 and 0.40 respectively (both fair), suggesting that agreements between observers during the manual scoring of haemorrhaging did not improve following additional training. Inter-observer agreement between these three trained observers was higher than in our study, and as mentioned earlier, this may have been because the observers in our study received limited training before welfare auditing the fish. However, there can always be discrepancies between observers when using manual scoring schemes (e.g., Meagher, 2009; Pfeifer et al., 2019) and this is sometimes not improved by training, but generally, to improve the reliability of manual welfare scoring, detailed operational and research-based training should be undertaken (Meagher, 2009; Weirup et al., 2022).
This, in sum, suggests that hyperspectral imaging tools for detecting haemorrhaging in fin injuries can identify fin erosion with a reliability comparable to human observers by targeting bleeding in the fins. This offers the possibility for rapid determination of fin status in Atlantic salmon for an objective and continuous measurement of OWIs.
4.3 Implications beyond classification of active dorsal fin injuries and severity
The present study focused on quantifying haemorrhaging injuries to the dorsal fin as a proof of concept since dorsal fin damage is a common injury in juvenile Atlantic salmon (e.g.,Turnbull et al., 1996) and haemorrhaging to the fins is fairly challenging to audit (e.g. Hoyle et al., 2007). The variation in human scorings for this trait was sufficiently large and encompassing all fin size categories. Importantly, it takes variation to explain variation and in the case of OWIs this cannot be factored into the experimental design since the injuries occur spontaneously during the experiment. In this case the distribution of scores of the active injuries is heavily skewed towards the upper end of the scale with many of the scores being moderate to severe class 2 and class 3. Future investigations should include other fins and bodily injuries encompassed in welfare scoring schemes. The automatic scheme presented here is conceptually simple and can be improved by considering the shape in addition to the size of the fin in order to quantify fin splitting and erosion. The imaging setup can be modified to capture the spatial properties of the fin by keeping the fish stationary while the camera moves. This would allow for the fin to be fixed such that its whole surface area would be visible.
Overall, the relationship between automatic readings and human scores reinforced the compatibility of the spectral method for this task even if the relationship between the two data types was not completely harmonious. If automatic injury assessment is to be adopted in future studies or applications, and translated to the standardized classification categories, appropriate thresholds will need to be determined to do so and the repeatability should be verified. One approach would be to evaluate the distribution of the fin haemorrhaging index per human score category in relation to the underlying distribution of the latter. Thresholds could then be proposed which minimize the overlap of fin haemorrhaging index values in two categories across the entire range (e.g., 0-3). Since any such cutoffs are dependent on the available data, special care should be taken to account for external factors that could influence variability in human scores, including inter-observer reliability and biological status of the fish (e.g., life stage and wound type) which may skew analyses to suit specific conditions. Hyperspectral imaging itself presents many additional opportunities to quantify morphological traits in fish, from lesions to scale loss, snout damage and deformities. These and many additional traits could be potentially quantified with the setup described in this study.
The use of hyperspectral images may have applications that go beyond detection of active fin injuries and classification of their severity. Yudovsky et al. (2011) used hyperspectral images of DFU using blood oximetry to develop an index that was similar to the fin haemorrhaging index in the present study to record foot ulceration in a longitudinal study. They were retrospectively able to predict the risk of ulceration development with a sensitivity and specificity of 0.95 and 0.80 respectively, 58 days before ulceration was detected by the human eye. In the present study non-zero values of the fin haemorrhaging index were detected in fins where human observers could not detect active wounds. This implies that there is scope for hyperspectral imaging to not only be used as a diagnostic and retrospective management tool, but also to infer future management decisions to prevent the development of fin injuries in Atlantic salmon and further impairment of welfare.
In the present study the limiting factor to measurement speed was the concurrent scoring by human observers who managed to score 290 fish over two days, whilst the hyperspectral setup recorded the entire cohort of 1050 salmon in the same amount of time. In the present study measurements were taken post-mortem to comply with ethical animal research licenses. However, successful non-invasive live measurements have been taken on Atlantic salmon under anaesthesia (Heia et al., Personal communication). This opens up the possibility to record large numbers of Atlantic salmon before and after managerial interventions such as delousing, crowding and grading as well as harvest.
5 Conclusion
Automated hyperspectral measurement of haemorrhaging in the dorsal fin by targeting haemoglobin is a highly accurate method of distinguishing between active and healed or uninjured dorsal fins. The total haemoglobin abundance per unit surface area of the fin has some agreement with manual human scoring of operation welfare indicators. The use of rapid automated hyperspectral measurements of haemorrhaging in fish holds promise for a high throughput method of recording OWIs in Atlantic salmon. However, future work should be extended to encompass other body parts, and better comparisons to ground truth measurements are required to help overcome the challenges of using human observer-based scoring schemes.
Data availability statement
The raw data supporting the conclusions of this article will be made available by the authors, without undue reservation.
Ethics statement
The animal study was reviewed and approved by Norwegian Food Safety Authority.
Author contributions
S-KL: Conceptualisation, funding acquisition, methodology, investigation, data curation, visualization, formal analysis, writing - original draft. ED: Formal analysis, writing - original draft. KH: Conceptualisation, funding acquisition, methodology, investigation, software development. CN: Conceptualisation, funding acquisition, methodology, writing - review & editing. RA: Writing - Review & editing. GD: Conceptualisation, funding acquisition, project administration, methodology, investigation, formal analysis, writing - original draft. All authors contributed to the article and approved the submitted version.
Funding
This work was supported by the Research Council of Norway through grant 194050 for Nofima internal research project 12918 PrecisionVision, 13142 Vision2Precision, the Nofima project DigitalAqua 12749 and grant 267650 SmoltFieldGenetics.
Acknowledgments
The authors would like to acknowledge the efforts of the staff at Research Station for Sustainable Aquaculture, Nofima, Sunndalsøra. In particular, Bernhard Eckel, Gøril Larsen and Kjellrun Gannestad for meticulous animal husbandry and animal recording. The authors are grateful to Dr Per Brunsvik and Dr. Grete Bæverfjord for advice on Atlantic salmon and animal ethics.
Conflict of interest
The authors declare that the research was conducted in the absence of any commercial or financial relationships that could be construed as a potential conflict of interest.
Publisher’s note
All claims expressed in this article are solely those of the authors and do not necessarily represent those of their affiliated organizations, or those of the publisher, the editors and the reviewers. Any product that may be evaluated in this article, or claim that may be made by its manufacturer, is not guaranteed or endorsed by the publisher.
References
Aeffner F., Wilson K., Martin N. T., Black J. C., Hendriks C. L. L., Bolon B., et al. (2017). The gold standard paradox in digital image analysis: Manual versus automated scoring as ground truth. Arch. Pathol. Lab. Med. 141 (9), 1267–1275. doi: 10.5858/arpa.2016-0386-RA
Alzubaidi L., Fadhel M. A., Al-Shamma O., Zhang J., Santamaría J., Duan Y. (2022). Robust application of new deep learning tools: an experimental study in medical imaging. Multimedia Tools Appl. 81 (10), 13289–13317. doi: 10.1007/s11042-021-10942-9
Anisuzzaman D. M., Patel Y., Niezgoda J., Gopalakrishnan S., Yu Z. (2022). Wound severity classification using deep neural network. doi: 10.48550/ARXIV.2204.07942
Broadbent A. D. (2004). A critical review of the development of the CIE1931 RGB color-matching functions. Color Res. Appl. 29, 267–272. doi: 10.1002/col.20020
Balaban M. O., Ünal Şengör G. F., Soriano M. G., Ruiz E. G. (2011). Quantification of gaping, bruising, and blood spots in salmon fillets using image analysis. J. Food Sci. 76 (3), E291–E297. doi: 10.1111/j.1750-3841.2011.02060.x
Barreto M. O., Rey Planellas S., Yang Y., Phillips C., Descovich K. (2022). Emerging indicators of fish welfare in aquaculture. Rev. Aquacult. 14 (1), 343–361. doi: 10.1111/raq.12601
Calin M. A., Coman T., Parasca S. V., Bercaru N., Savastru R., Manea D. (2015a). Hyperspectral imaging-based wound analysis using mixture-tuned matched filtering classification method. J. Biomed. Optics 20 (4), 46004. doi: 10.1117/1.JBO.20.4.046004
Calin M. A., Parasca S. V., Savastru R., Manea D. (2015b). Characterization of burns using hyperspectral imaging technique – a preliminary study. Burns 41 (1), 118–124. doi: 10.1016/j.burns.2014.05.002
Cancio L. C., Batchinsky A. I., Mansfield J. R., Panasyuk S., Hetz K., Martini D., et al. (2006). Hyperspectral imaging: A new approach to the diagnosis of hemorrhagic shock. J. Trauma Acute Care Surg. 60 (5), 1087–1095. doi: 10.1097/01.ta.0000217357.10617.3d
Cernek P., Bollig N., Anklam K., Döpfer D. (2020). Hot topic: Detecting digital dermatitis with computer vision. J. Dairy Sci. 103 (10), 9110–9115. doi: 10.3168/jds.2019-17478
Chin J. A., Wang E. C., Kibbe M. R. (2011). Evaluation of hyperspectral technology for assessing the presence and severity of peripheral artery disease. J. Vasc. Surg. 54 (6), 1679–1688. doi: 10.1016/j.jvs.2011.06.022
Cohen J. (1960). A coefficient of agreement for nominal scales. Educ. psychol. Measurement 20 (1), 37–46. doi: 10.1177/001316446002000104
Cox N. R. (1974). Estimation of the correlation between a continuous and a discrete variable. Biometrics 30 (1), 171–178. doi: 10.2307/2529626
Dale L. M., Thewis A., Boudry C., Rotar I., Dardenne P., Baeten V., et al. (2013). Hyperspectral imaging applications in agriculture and agro-food product quality and safety control: A review. Appl. Spectrosc. Rev. 48 (2), 142–159. doi: 10.1080/05704928.2012.705800
Denholm S. J., Brand W., Mitchell A. P., Wells A. T., Krzyzelewski T., Smith S. L., et al. (2020). Predicting bovine tuberculosis status of dairy cows from mid-infrared spectral data of milk using deep learning. J. Dairy Sci. 103 (10), 9355–9367. doi: 10.3168/jds.2020-18328
Ellis T., Oidtmann B., St-Hilaire S., Turnbull J. F., North B. P., MacIntyre C. M., et al. (2008). “Fin erosion in farmed fish,” in Fish welfare. Ed. Branson E. J. (Oxford, UK: Blackwell Publishing Ltd). doi: 10.1002/9780470697610.ch9
ElMasry G., Sun D.-W. (2010). “CHAPTER 1 - principles of hyperspectral imaging technology,” in Hyperspectral imaging for food quality analysis and control. Ed. Sun D.-W. (Cambridge, Massachusetts: Academic Press), 3–43.
Elmoslemany A., Whyte S. K., Revie C. W., Hammell K. L. (2013). Sea Lice monitoring on Atlantic salmon farms in new Brunswick, Canada: comparing audit and farm staff counts. J. Fish. Dis. 36 (3), 241–247. doi: 10.1111/jfd.12051
Føre M., Frank K., Norton T., Svendsen E., Alfredsen J. A., Dempster T., et al. (2018a). Precision fish farming: A new framework to improve production in aquaculture. Biosyst. Eng. 173, 176–193. doi: 10.1016/j.biosystemseng.2017.10.014
Føre M., Svendsen E., Alfredsen J. A., Uglem I., Bloecher N., Sveier H., et al. (2018b). Using acoustic telemetry to monitor the effects of crowding and delousing procedures on farmed Atlantic salmon (Salmo salar). Aquaculture 495, 757–765. doi: 10.1016/j.aquaculture.2018.06.060
Gamer M., Lemon J., Singh I. F. P. (2019). “Irr: Various coefficients of interrater reliability and agreement,” in Version {R package version 0.84.1. Available at: https://CRAN.R-project.org/package=irr.
Gowen A. A., O’Donnell C. P., Cullen P. J., Downey G., Frias J. M. (2007). Hyperspectral imaging – an emerging process analytical tool for food quality and safety control. Trends Food Sci. Technol. 18 (12), 590–598. doi: 10.1016/j.tifs.2007.06.001
Goyal M., Reeves N. D., Rajbhandari S., Ahmad N., Wang C., Yap M. H. (2020). Recognition of ischaemia and infection in diabetic foot ulcers: Dataset and techniques. Comput. Biol. Med. 117, 103616. doi: 10.1016/j.compbiomed.2020.103616
Handeland S. O., Stefansson S. O. (2001). Photoperiod control and influence of body size on off-season parr–smolt transformation and post-smolt growth. Aquaculture 192 (2), 291–307. doi: 10.1016/S0044-8486(00)00457-9
Heuch P. A., Gettinby G., Revie C. W. (2011). Counting sea lice on Atlantic salmon farms — empirical and theoretical observations. Aquaculture 320 (3), 149–153. doi: 10.1016/j.aquaculture.2011.05.002
Hoyle I., Oidtmann B., Ellis T., Turnbull J., North B., Nikolaidis J., et al. (2007). A validated macroscopic key to assess fin damage in farmed rainbow trout (Oncorhynchus mykiss). Aquaculture 270 (1), 142–148. doi: 10.1016/j.aquaculture.2007.03.037
Kay M. (2022) Ggdist: Visualizations of distributions and uncertainty. Available at: https://mjskay.github.io/ggdist/.
Kestin S. C., Van de Vis J. W., Robb D. H. F. (2002). Protocol for assessing brain function in fish and the effectiveness of methods used to stun and kill them. Veterinary Rec. 150 (10), 302–307. doi: 10.1136/vr.150.10.302
Kimiya T., Sivertsen A. H., Heia K. (2013). VIS/NIR spectroscopy for non-destructive freshness assessment of Atlantic salmon (Salmo salar l.) fillets. J. Food Eng. 116 (3), 758–764. doi: 10.1016/j.jfoodeng.2013.01.008
Kristensen E., Dueholm L., Vink D., Andersen J. E., Jakobsen E. B., Illum-Nielsen S., et al. (2006). Within- and across-person uniformity of body condition scoring in Danish Holstein cattle. J. Dairy Sci. 89 (9), 3721–3728. doi: 10.3168/jds.S0022-0302(06)72413-4
Kristiansen T. S., Bleie H., Bæverfjord G., Engh E., Hansen K. A. E., Lybæk S., et al. (2021) Årsrapport 2020. Available at: https://www.forsoksdyrkomiteen.no/wp-content/uploads/2021/06/Arsrapport-2020-ENDELIG.pdf.
Kristiansen T. S., Madaro A., Stien L. H., Bracke M. B. M., Noble C. (2020). “Chapter 6 - theoretical basis and principles for welfare assessment of farmed fish,” in Fish physiology, vol. 38 . Eds. Benfey T. J., Farrell A. P., Brauner C.J. (Cambridge, Massachusetts: Academic Press), 193–236.
Kuhn M. (2020). “Caret: Classification and regression training,” in Version r package version 6.0-86. Available at: https://CRAN.R-project.org/package=caret.
Landis J. R., Koch G. G. (1977). The measurement of observer agreement for categorical data. Biometrics 33 (1), 159–174. doi: 10.2307/2529310
Lu B., Dao P. D., Liu J., He Y., Shang J. (2020). Recent advances of hyperspectral imaging technology and applications in agriculture. Remote Sens. 12 (16), 2659. doi: 10.3390/rs12162659
Lu G., Fei B. (2014). Medical hyperspectral imaging: a review. J. Biomed. Optics 19 (1), 10901. doi: 10.1117/1.JBO.19.1.010901
MacLean A., Metcalfe N. B., Mitchell D. (2000). Alternative competitive strategies in juvenile Atlantic salmon (Salmo salar): evidence from fin damage. Aquaculture 184 (3-4), 291–302. doi: 10.1016/S0044-8486(99)00333-6
Mattilsynet (2021) Bruk av dyr i forsøk 2020. Available at: https://www.mattilsynet.no/dyr_og_dyrehold/dyrevelferd/forsoksdyr/bruk_av_dyr_i_forsok_i_2020.42967/binary/Bruk%20av%20dyr%20i%20fors%C3%B8k%20i%202020.
Meagher R. K. (2009). Observer ratings: Validity and value as a tool for animal welfare research. Appl. Anim. Behav. Sci. 119 (1), 1–14. doi: 10.1016/j.applanim.2009.02.026
Nilsson J., Gismervik K., Nielsen K. V., Iversen M. H., Noble C., Kolarevic J., et al. (2022). Laksvel - standardisert operasjonell velferdsovervåking for laks i matfiskanlegg, (2022 - 14). Rapport Fra Havforskningen. https://hdl.handle.net/11250/2997021.
Noble C., Cañon Jones H. A., Damsgård B., Flood M. J., Midling K.Ø., Roque A., et al. (2012). Injuries and deformities in fish: their potential impacts upon aquacultural production and welfare. Fish. Physiol. Biochem. 38 (1), 61–83. doi: 10.1007/s10695-011-9557-1
Noble C., Gismervik K., Iversen M. H., Kolarevic J., Nilsson J., Stien L. H., et al. (2018) Welfare indicators for farmed Atlantic salmon: tools for assessing welfare. Available at: https://nofima.no/wp-content/uploads/2021/05/FISHWELL-Welfare-indicators-for-farmed-Atlantic-salmon-November-2018.pdf.
Pettersen J. M., Bracke M. B. M., Midtlyng P. J., Folkedal O., Stien L. H., Steffenak H., et al. (2014). Salmon welfare index model 2.0: an extended model for overall welfare assessment of caged Atlantic salmon, based on a review of selected welfare indicators and intended for fish health professionals. Rev. Aquacult. 6 (3), 162–179. doi: 10.1111/raq.12039
Pfeifer M., Eggemann L., Kransmann J., Schmitt A. O., Hessel E. F. (2019). Inter- and intra-observer reliability of animal welfare indicators for the on-farm self-assessment of fattening pigs. Animal 13 (8), 1712–1720. doi: 10.1017/S1751731118003701
R Core Team (2021). “R: A language and environment for statistical computing,” in R foundation for statistical computing. Available at: https://www.R-project.org/.
Rostami B., Anisuzzaman D. M., Wang C., Gopalakrishnan S., Niezgoda J., Yu Z. (2021). Multiclass wound image classification using an ensemble deep CNN-based classifier. Comput. Biol. Med. 134, 104536. doi: 10.1016/j.compbiomed.2021.104536
Schauberger P., Walker A. (2019). “Openxlsx: Read, write and edit xlsx files,” in Version r package version 4.1.4. Available at: https://CRAN.R-project.org/package=openxlsx.
Shiina K., Ueda T., Kubo S. (2018). “Polychoric correlations for ordered categories using the EM algorithm,” In: Quantitative Psychology. IMPS 2017. Springer Proceedings in Mathematics & Statistics. Eds. Wiberg M., Culpepper S., Janssen R., González J., Molenaar D. vol 233. Cham: Springer. doi: 10.1007/978-3-319-77249-3_21
Sivertsen A. H., Heia K., Hindberg K., Godtliebsen F. (2012). Automatic nematode detection in cod fillets (Gadus morhua l.) by hyperspectral imaging. J. Food Eng. 111 (4), 675–681. doi: 10.1016/j.jfoodeng.2012.02.036
Skjelvareid M. H., Heia K., Olsen S. H., Stormo S. K. (2017). Detection of blood in fish muscle by constrained spectral unmixing of hyperspectral images. J. Food Eng. 212, 252–261. doi: 10.1016/j.jfoodeng.2017.05.029
Sommerset I., Walde C. S., Jensen B. B., Wiik-Nielsen J., Bornø G., Silva de Oliveira V. H., et al. (2022) Fiskehelserapporten 2021 (Veterinærinstituttets rapportserie, issue). Available at: https://www.vetinst.no/rapporter-og-publikasjoner/rapporter/2022/fiskehelserapporten-2021.
Stien L. H., Bracke M. B. M., Folkedal O., Nilsson J., Oppedal F., Torgersen T., et al. (2013). Salmon welfare index model (SWIM 1.0): a semantic model for overall welfare assessment of caged Atlantic salmon: review of the selected welfare indicators and model presentation. Rev. Aquacult. 5 (1), 33–57. doi: 10.1111/j.1753-5131.2012.01083.x
Sture Ø., Øye E. R., Skavhaug A., Mathiassen J. R. (2016). A 3D machine vision system for quality grading of Atlantic salmon. Comput. Electron. Agric. 123, 142–148. doi: 10.1016/j.compag.2016.02.020
Sveen L. R., Timmerhaus G., Krasnov A., Takle H., Handeland S., Ytteborg E. (2019). Wound healing in post-smolt Atlantic salmon (Salmo salar l.). Sci. Rep. 9 (1), 3565. doi: 10.1038/s41598-019-39080-x
Tschirren L., Bachmann D., Güler A. C., Blaser O., Rhyner N., Seitz A., et al. (2021). MyFishCheck: A model to assess fish welfare in aquaculture. Animals 11 (1), 145. doi: 10.3390/ani11010145
Turnbull J. F., Richards R. H., Robertson D. A. (1996). Gross, histological and scanning electron microscopic appearance of dorsal fin rot in farmed Atlantic salmon, salmo salar l., parr. J. Fish. Dis. 19 (6), 415–427. doi: 10.1046/j.1365-2761.1996.d01-93.x
van Netten J. J., Clark D., Lazzarini P. A., Janda M., Reed L. F. (2017). The validity and reliability of remote diabetic foot ulcer assessment using mobile phone images. Sci. Rep. 7 (1), 9480. doi: 10.1038/s41598-017-09828-4
Weirup L., Schulz C., Seibel H. (2022). Fish welfare evaluation index (fWEI) based on external morphological damage for rainbow trout (Oncorhynchus mykiss) in flow through systems. Aquaculture 556, 738270. doi: 10.1016/j.aquaculture.2022.738270
Wickham H. (2016). ggplot2: Elegant graphics for data analysis (New York: Springer-Verlag). Available at: https://ggplot2.tidyverse.org.
Wickham H., François R., Müller L. H. K. (2021). “Dplyr: A grammar of data manipulation,” in Version r package version 1.0.7. Available at: https://CRAN.R-project.org/package=dplyr.
Xu J.-L., Riccioli C., Sun D.-W. (2017). Comparison of hyperspectral imaging and computer vision for automatic differentiation of organically and conventionally farmed salmon. J. Food Eng. 196, 170–182. doi: 10.1016/j.jfoodeng.2016.10.021
Yang A., Huang H., Zheng B., Li S., Gan H., Chen C., et al. (2020). An automatic recognition framework for sow daily behaviours based on motion and image analyses. Biosyst. Eng. 192, 56–71. doi: 10.1016/j.biosystemseng.2020.01.016
Keywords: salmon, animal welfare, fin haemorrhaging, hyperspectral imaging, aquaculture
Citation: Lindberg S-K, Durland E, Heia K, Noble C, Alvestad R and Difford GF (2023) Digital scoring of welfare traits in Atlantic salmon (Salmo salar L.) - a proof of concept study quantifying dorsal fin haemorrhaging via hyperspectral imaging. Front. Anim. Sci. 4:1162384. doi: 10.3389/fanim.2023.1162384
Received: 09 February 2023; Accepted: 31 March 2023;
Published: 20 April 2023.
Edited by:
Suresh Neethirajan, Farmworx Research Institute, Farmworx NetherlandsReviewed by:
Hijranv Yavuzcan Yildiz, Ankara University, TürkiyeArthur Francisco Araujo Fernandes, Cobb-Vantress, United States
Ana Roque, Institute of Agrifood Research and Technology (IRTA), Spain
Copyright © 2023 Lindberg, Durland, Heia, Noble, Alvestad and Difford. This is an open-access article distributed under the terms of the Creative Commons Attribution License (CC BY). The use, distribution or reproduction in other forums is permitted, provided the original author(s) and the copyright owner(s) are credited and that the original publication in this journal is cited, in accordance with accepted academic practice. No use, distribution or reproduction is permitted which does not comply with these terms.
*Correspondence: S-K. Lindberg, c3RlaW5rYXRvLmxpbmRiZXJnQHlhaG9vLm5v