 Nichole F. Huntley1,2†Marcela M. de Souza2†Matthew D. Schulte2
 Hamid Beiki2
 Andressa O. de Lima2Abigail E. Jantzi2
 Steven M. Lonergan2
 Elisabeth J. Huff-Lonergan2
 John F. Patience2,3
 James E. Koltes2*
- 1Mazuri Exotic Animal Nutrition, PMI Nutrition International, LLC, Arden Hills, MN, United States
- 2Department of Animal Science, Iowa State University, Ames, IA, United States
- 3Iowa Pork Industry Center, Iowa State University, Ames, IA, United States
Xylose is a primary component of arabinoxylan in swine diets. As arabinoxylan is a significant component of fiber, and fiber is generally rising in practical pig diets globally, the study of arabinoxylan and xylose is of increasing interest. However, the mechanisms by which free xylose may be absorbed and the pathways impacted by xylose have yet to be elucidated in pigs. The objective of this study was to determine the impact of xylose supplementation on gene expression and protein abundance in jejunum, kidney, liver, and muscle tissues which have previously been identified as possible sites of xylose absorption or metabolism. This study aimed to expand the preliminary understanding of dietary xylose metabolism and utilization in pigs. One study, replicated twice with 24 crossbred gilts, was used to assess two dietary treatments: a xylose-free (0%) control and 8% D-xylose. The impact of xylose on growth was monitored by measuring initial and final body weight, serum IGF-1, and liver glycogen concentrations. The rate and efficiency of weight gain were reduced on the xylose diet but not to a level that would occur if xylose was not used at all; the detection of xylose systemically further supports this conclusion. This study confirmed that pigs can utilize dietary xylose. To determine the impact of xylose on tissue metabolism, samples were collected from all four tissues for gene expression analysis by RNA-sequencing, and kidney and liver samples were subjected to proteomic analysis using 2D-DIGE and mass spectrometry. The majority of differentially expressed (DE) genes were identified in the kidney samples (n = 157), with a few identified in the jejunum (n = 16), liver (n = 1), and muscle (n = 20) samples. The DE genes in the kidney were mainly identified as being involved in lipid biosynthesis and fatty acid metabolism. Proteomic results corroborated these findings. Although the inclusion of xylose in a diet at practical levels is shown to impact energy metabolic processes, it has been confirmed that this five-carbon sugar can support levels of growth only slightly below those of glucose, a six-carbon sugar that is more commonly utilized as an energy source in pig diets.
1 Introduction
Since feed represents up to 72% of the total cost of swine production (Cornelison et al., 2018), the digestibility of the diet and utilization of absorbed energy must be maximized. However, the global swine industry is increasingly expected to use diets containing more high-fiber ingredients, such as co-products of manufacturing and other industrial processes. For pigs, higher levels of dietary fiber generally translate into lower digestibility and reduced efficiency of energy utilization (Patience, 2012).
The Codex Alimentarius Committee of the Food and Agriculture Organization of the United Nations (FAO) (2010) defines fiber as “those carbohydrate polymers with ten or more monomeric units which are neither hydrolyzed by the endogenous enzymes nor absorbed in the small intestine.” In many discussions on dietary fiber, xylose is likely to assume considerable prominence. For example, carbohydrate polymers containing xylose include xyloglucans and arabinoxylans, the latter being a major constituent of hemicellulose. Hemicellulose is a significant component of fiber in grains and other ingredients commonly used in pig diets (Bach Knudsen, 2014; Jaworski et al., 2015; Petry and Patience, 2020). Gutierrez et al. (2014) reported that the concentration of xylose could explain 71% of the variation in metabolizable energy content among nine corn co-products that varied in neutral detergent fiber content from 4% to 46%.
Xylanase is an enzyme added to pig diets to enhance the utilization of dietary fiber, specifically hemicellulose, which is otherwise undigested in the stomach and small intestine of pigs (Petry et al., 2020). Xylanase hydrolyzes the β-(1-4) glycosidic bonds of arabinoxylan in hemicellulose, potentially releasing a mixture of xylose, arabinose, and xylooligosaccharides which in turn can be either absorbed or fermented by pigs (Dodd and Cann, 2009). When absorbed by the small intestine, xylose can potentially provide energy for pigs, yet little information is available on xylose metabolism in mammals generally, or in pigs specifically (Huntley and Patience, 2018a). Early studies indicated that pigs have a very limited ability to utilize xylose as an energy source (Wise et al., 1954; Schutte et al., 1991). However, these studies used levels of xylose that constituted 20% of the diet or higher, well above the 1%–5% typically found in most practical diets. More recent studies have indicated that when included in the diet at more practical levels, pigs can metabolize xylose and adapt over time to enhance efficiency. A pathway for metabolism has been proposed, with D-threitol identified as the most common metabolite (Huntley and Patience, 2018b). Therefore, as a pentose (Lim et al., 2015), xylose is believed to be metabolized via the pentose and glucuronate interconversion pathways, entering the pentose phosphate pathway in the liver and kidney (Kim et al., 2012; Feng et al., 2018; Huntley and Patience, 2018b).
While xylose will never supplant glucose as the primary monosaccharide utilized in the pig’s diet, xylose can contribute to the pig’s energy supply to some extent. A better understanding of xylose metabolism will further our ability to maximize its utilization. Therefore, the objective of this experiment was to determine the impact of xylose supplementation on gene expression and protein abundance in jejunum, kidney, liver, and muscle tissues, which have previously been identified as possible sites of xylose absorption or metabolism (Weser and Laster, 1968; Huntley and Patience, 2018a; Huntley and Patience, 2018b). We hypothesized that xylose absorbed from the digestive tract is metabolized by the pig in select organs and is thus able to contribute to its energy supply.
2 Materials and methods
2.1 Ethical statement
Experimental procedures were approved by the Institutional Animal Care and Use Committee at Iowa State University (2-17-8452-S) and adhered to the guidelines for the ethical and humane use of animals for research according to the Guide for the Care and Use of Agricultural Animals in Research and Teaching (FASS, 2010).
2.2 Animals, housing, and experimental design
The experiment was conducted at the Iowa State University Swine Nutrition Farm (Ames, IA) using two replicates of 12 crossbred gilts each to provide a total of 24 animals (12 per dietary treatment; L337 × Camborough, PIC Inc., Hendersonville, TN) with a mean initial body weight (BW) of 28.2 ± 1.1 kg. The study was replicated twice over time to achieve the desired statistical power, with the second replicate commencing immediately following the completion of the first. The data for the two replicates were pooled. Care was taken to ensure both replicates were conducted in the same manner, such as using equalized feed intake, and no important variations were noted between them. Before the commencement of the experiment, pigs were adapted for 4 days to individual housing (1.8 m x 1.9 m), the basal diet (CTL, see section 2.3 below), and the feeding schedule.
The pigs were then randomly allotted to one of two dietary treatments and were transferred to metabolism crates (0.7 m x 1.5 m) for the 22-day experiment. The metabolism crates allowed for a separate collection of feces and urine and were equipped with a plastic slatted floor, a dry feeder, and a nipple waterer. Pigs were weighed on days 0 and 22 to allow the determination of average daily gain (ADG). On the last day of the experiment (day 22), all pigs were euthanized via captive bolt stunning, followed by exsanguination to facilitate the collection of organ samples.
2.3 Diets and feeding
Two dietary treatments were evaluated (Table 1): a semi-purified xylose-free diet (CTL) and the same diet with 8% D-xylose (DuPont Nutrition & Health, Copenhagen, Denmark) added at the expense of corn starch (XYL). The level of xylose inclusion was chosen to be high enough to reveal a negative growth response if the xylose, when compared with glucose from starch, was not utilized by the pig (Huntley and Patience, 2018a). At the same time, we did not want to utilize levels that might overwhelm the metabolic capacity of the pig to utilize free xylose. The compromise was a level of xylose that would be double the highest levels that would normally be observed in practical diets (Huntley and Patience, 2018b).
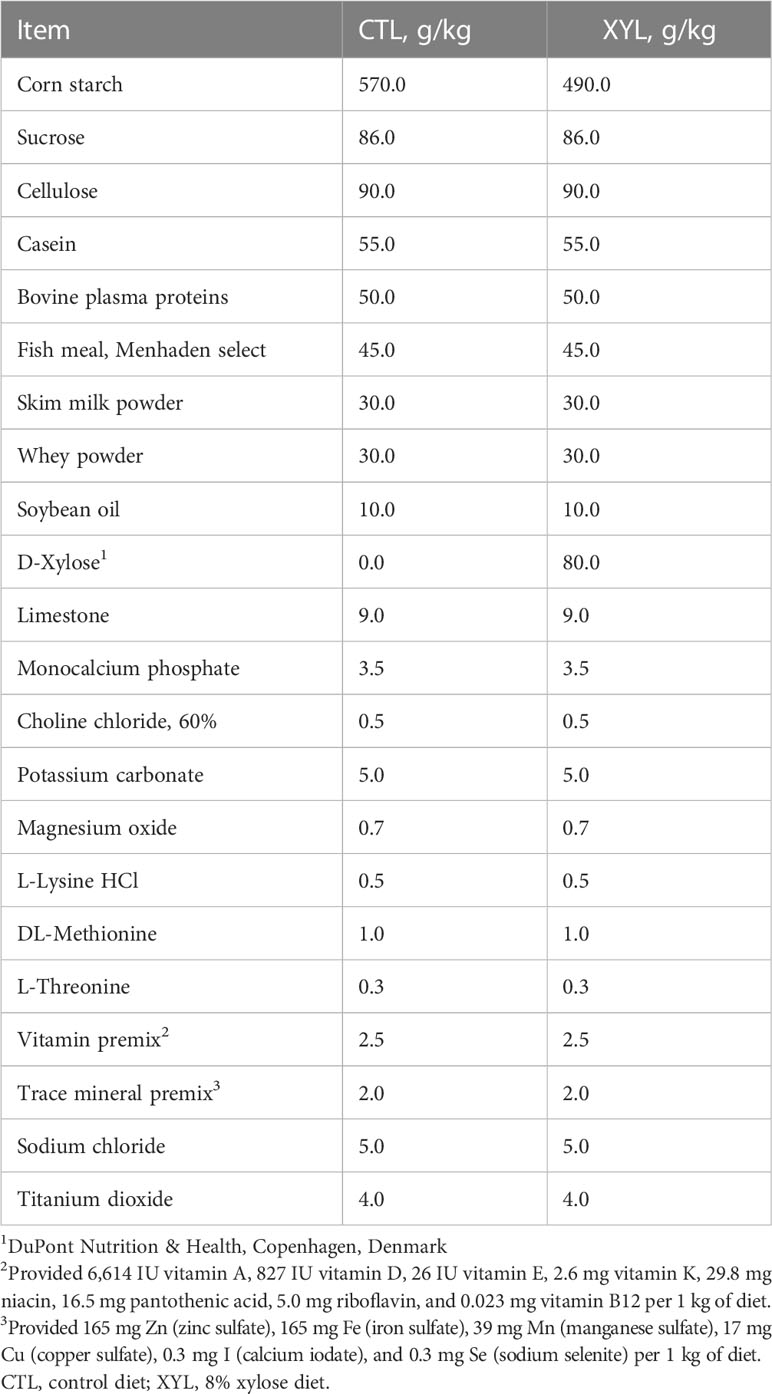
Table 1 Ingredient composition of experimental diets, on an as-fed basis.
All diets were formulated to meet or exceed the nutrient requirements of pigs of this body weight (Table 2; NRC, 2012) and were presented to the pigs in mash form. On day 0, pigs were transitioned to their assigned dietary treatments provided at 4% of the initial BW averaged across all pigs used in the first replicate. The same quantity of feed was provided to pigs in the second replicate. This daily feed allotment was split into two meals provided at 0800 and 1600 h. Any orts remaining after 1 hour were collected, weighed, and recorded to calculate daily feed intake and gain:feed ratio (G:F). Pigs had ad libitum access to water throughout the experiment.
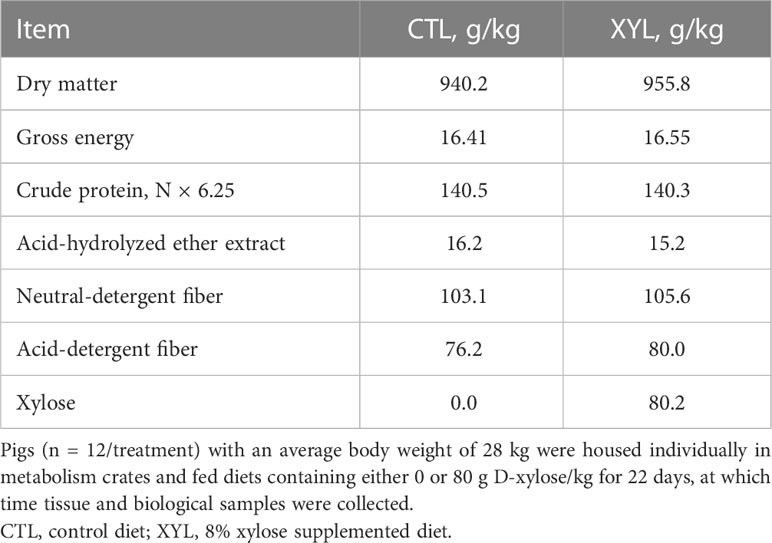
Table 2 Analyzed gross energy and selected nutrient composition of experimental diets, on an as-fed basis.
2.4 Diet nutrient analysis
Feed samples were dried at 60°C to a constant weight, ground to a particle size of 1 mm, and analyzed in duplicate for N (method 990.03; AOAC, 2006); TruMac; LECO Corp., St. Joseph, MI, USA). Standard calibration was performed using EDTA (9.56% N), which was determined to contain 9.55% ± 0.01% N. Crude protein was calculated as N × 6.25. Diet samples were assayed for gross energy using an isoperibolic bomb calorimeter (model 6200; Parr Instrument Co., Moline, IL). Benzoic acid (26.4 MJ/kg; Parr Instrument Co.) was used as the standard for calibration and was determined to contain 26.4 ± 0.01 MJ/kg. Diet samples were analyzed in duplicate for dry matter (method 930.15; AOAC, 2006) and acid hydrolyzed ether extract (method 2003.06; AOAC, 2007), and in triplicate for neutral (Van Soest and Robertson, 1979) and acid detergent fiber components (Goering and Van Soest, 1970). Diet samples were also assayed for D-xylose concentration using a commercially available kit (Megazyme, Wicklow, Ireland).
2.5 Blood and organ sample collection
On day 22, all pigs were euthanized 60 ± 3 minutes after feeding; blood was harvested during exsanguination, allowed to clot, centrifuged at 4°C at 1,500 ×g for 10 minutes to obtain serum samples, further subsampled, and stored at –80°C until further analysis. The abdomen of each carcass was opened by longitudinal incision and the intestines were removed proximal to the stomach to the rectum. A 10 cm section of jejunum was removed 5.0 m from the pyloric sphincter, and mucosal scrapings were collected. Liver tissue was collected by taking a 2 × 2 cm central cross-section from the medial left lobe. The cross-section was then minced into 5-mm3 samples. The left kidney was removed, bisected longitudinally, and 5-mm3 kidney cortex samples were collected from the apex of the superior curve. A 2.5 cm-diameter core sample was taken of the left longissimus dorsi muscle from each pig at the 10th rib and minced into 5-mm3 pieces. Tissue samples were rinsed with ice-cold PBS buffer, immediately placed in a 7.6 × 17.8-cm sterile sample bag (Fisher Science, Hanover Park, IL), snap frozen in liquid nitrogen, and stored at –80°C for later analysis. All 24 pigs—12 per treatment—had each type of tissue harvested in this way at the end of the trial.
2.6 Sample processing and analysis
2.6.1 Serum
Serum insulin-like growth factor-1 (IGF-1) and xylose concentrations were determined using commercially available kits in accordance with the manufacturers’ instructions (Porcine IGF-1 ELISA, ABclonal, Woburn, MA; D-xylose assay kit, Megazyme, Wicklow, Ireland).
2.6.2 Liver glycogen
Liver samples were prepared and analyzed for glycogen concentration using a commercial glycogen assay kit [Glycogen Assay Kit II (Colorimetric), ab169558, Abcam, Cambridge, United Kingdom] in accordance with the manufacturer’s instructions. Glycogen concentration was determined spectrophotometrically at 450 nm.
2.7 Statistical analysis of growth, serum xylose, IGF-1, and liver glycogen levels
Data were analyzed with the pig as the experimental unit, dietary treatment as a fixed effect, and replication as a random variable. The UNIVARIATE procedure of the Statistical Analysis Systems package version 9.4 (SAS Institute, Cary, NC, USA) was used to verify the normality of residuals and homogeneity of variances and to identify statistical outliers (> 3 standard deviations away from the mean), which were removed from the dataset. Only one value was removed from the total dataset, which was one of the serum xylose measurements. Serum IGF-1 data were log-transformed to achieve a normal distribution. The assumption of equal variances was not valid, so the statistical models for serum xylose, serum IGF-1, and liver glycogen data were fitted with separate variances for each of the two treatments. Differences due to dietary treatment were determined using ANOVA, and means were separated using the least square means statement and the PDIFF option. Differences were considered significant at p ≤ 0.05 and a trend at p > 0.05 and ≤ 0.10.
2.8 RNA extraction
Tissues (30–60 mg) were homogenized in 300 µL of Buffer RLT (Qiagen, Germantown, MD, USA) using the Qiagen Tissuelyser II (Germantown, MD, USA). Total RNA was isolated and purified from jejunum mucosa, kidney cortex, and liver tissues using the Qiagen RNeasy Plus Mini Kit (Germantown, MD, USA) in accordance with the manufacturer’s instructions. For the longissimus dorsi muscle samples, the Qiagen RNeasy Fibrous Tissues Mini Kit (Germantown, MD, USA) was utilized for total RNA isolation and purification in accordance with the manufacturer’s instructions. The quality and quantity of RNA were determined using a Nanodrop ND-1000 (Thermo Scientific, Wilmington, DE) and an Agilent 2100 Bioanalyzer (Agilent Technologies Inc., Santa Clara, CA). All RNA samples had 260:280 nm absorbance ratios above 1.8. Mean RNA integrity numbers were 8.3 ± 1.0 for jejunum mucosa samples, 8.0 ± 0.6 for kidney cortex samples, 8.9 ± 0.4 for liver samples, and 8.8 ± 0.3 for longissimus dorsi samples.
2.9 RNA-sequencing
RNA libraries were constructed using 3′ mRNA-seq QuantSeq technology (Lexicogen, Greenland, NH). A total of 48 samples were loaded per lane into two lanes with an equal number of CTL and XYL samples per tissue, per lane (i.e., 24 each). The two experimental replicates of the trial were intentionally grouped with all samples from replicate one in lane one and all samples from replicate two in lane two to allow one statistical variable to account for both lane and replicate. This approach allowed for statistical power to be saved for the differential expression analysis. RNA-sequencing (RNA-seq) was conducted using Illumina HiSeq 3000 chemistry to generate 100-nucleotide single-end reads (Illumina Inc., San Diego, CA.)
2.10 Bioinformatic processing of sequence data
For reproducibility purposes, software settings and a more in-depth description of methodological details are provided in Supplementary File 1.
2.10.1 Sequence quality control
The adapter and low-quality bases were removed using the bbduk.sh program in BBtools software (sourceforge.net/projects/bbmap/) such that after trimming, reads were required to have a minimum length of 20 bases with an average per base quality score (Phred +33) ≥ 20. Sequence quality was assessed with FastQC software version 0.11.3 (Andrews and Babraham Bioinformatics, 2010).
2.10.2 Sequence alignment
The trimmed high-quality reads were aligned against the Sus scrofa pig genome reference (Sscrofa11.1 from Ensembl build 93) assembly using the STAR alignment software version 2.5.4 (Dobin et al., 2013) with thresholds of at least 95% identity and 90% coverage and default settings for all other parameters. The number of reads mapped to each gene (i.e., read counts) was determined using FeatureCounts software version 1.6.0 (Liao et al., 2014) based on the Ensembl Sscrofa11.1.93 gene annotations (Cunningham et al., 2022).
2.10.3 Data filtering
To reduce spurious gene expression results associated with very low sequence levels, genes with less than one read count in 70% of samples were discarded from downstream analyses.
2.11 Statistical analysis of differentially expressed genes
2.11.1 Identification of DE genes
Following quality control, 21 jejunum mucosa, 24 kidney cortex, 23 liver, and 24 longissimus dorsi muscle samples were analyzed to identify differentially expressed (DE) genes. Reads aligned to annotated Ensembl genes were normalized and the DE analyses were performed with the DESeq2 1.30.1 package (Love et al., 2014) with the following model:
where Y is the normalized gene expression, Treatment is the effect of diet (CTL or XYL) for animal k, RIN is the RNA integrity score for animal k, WI is the water intake for animal k, and e is the random residual. The DE genes were identified as those that differed in expression due to treatment (XYL vs. CTRL) using a Wald test within the DESeq2 software. Genes were considered DE at a false discovery rate (FDR) < 0.1 (Benjamini and Hochberg, 1995).
2.11.2 Ontology enrichment analysis of DE genes
Ontology enrichment analysis was conducted with ClueGO v. 2.5.5. software and CluePedia v. 1.5.5 (Bindea et al., 2009) using annotation information from human gene orthologs (> 60% similarity to humans) identified from Biomart (Durinck et al., 2009.) All expressed genes within a tissue were used as the reference set (background) for the ontology enrichment analysis. Significantly enriched (i.e., overrepresented) gene ontology (GO) biological process (BP) terms were determined with a right-sided hypergeometric test at a Benjamini–Hochberg adjusted p< 0.05 (Benjamini and Hochberg, 1995). Redundant ontology terms were grouped based on the kappa score ≥ 0.4 (Bindea et al., 2009).
2.12 Gene co-expression network analysis
The WGCNA R package (Langfelder and Horvath, 2008) was used to identify gene networks (modules) separately for CTL and XYL samples to allow comparison of genes within network modules between the two diets. Network modules were defined as groups of genes with high levels of correlated gene expression, which may indicate coordinated pathway responses (Zhao et al., 2010), for example, in response to a treatment such as xylose consumption. A β coefficient of five with an R2 of 0.9 and a minimum module size of 20 was used to identify signed weighted modules based on the methods described by Langfelder and Horvath (2012). Similar network modules, based on gene expression values for genes within a module, were merged based on their eigengenes similarities using the mergeCloseModules function and tree height cut value of 0.2. All other WGCNA parameters remained at their default settings. Additional details regarding the co-expression analysis are available in Supplementary File 1.
2.12.1 Association of gene networks with xylose
To identify gene network modules impacted by XYL, the following linear model was fitted independently for the CTL or XYL diets:
where eigengene was the ith gene network module, FinalBW was BW at the end of the trial, ADG was the average daily gain, and AvgXylose was the average urinary xylose level (Huntley and Patience, 2018b). Gene network module structures were compared between the CTL and XYL treatment groups using the NetRep R package, based on 10,000 permutation tests (Aibar et al., 2015). This permutation approach was conducted to obtain robust and unbiased statistical estimates to evaluate the level of gene network preservation (i.e., the ability to compare similar modules) to facilitate diet-level comparisons between CTL and XYL gene network modules. A p-value threshold of< 0.05 was considered significant for module preservation (Langfelder et al., 2011).
2.12.2 Ontology enrichment analysis of gene network modules associated with xylose
Genes within network models were evaluated for enrichment of gene ontology terms to identify biological processes and pathways that may be impacted by the XYL dietary treatment using the FGNet R package (Aibar et al., 2015). Statistically significant enrichment (i.e., overrepresentation of genes within an ontology) was declared at Benjamini–Hochberg adjusted FDR ≤ 0.05. REVIGO was used to summarize these results (Supek et al., 2011).
2.13 Proteomics analyses
2.13.1 Proteomics sample preparation and analysis
For kidney and liver samples, the flow-through left from RNA extraction was compiled and saved within the sample after each centrifugation and column filtration step (Qiagen, Germantown, MD, USA). Proteins were precipitated from the tissue extracts by the addition of ice-cold acetone. The samples were then vortexed and incubated at –20°C for 30 minutes Samples were centrifuged for 10 minutes at 4,122 ×g on a Sorvall Legend XFR floor model centrifuge (Thermo Scientific, Waltham, MA) at 4°C. The supernatant was discarded and the pellet was washed with ice-cold ethanol, vortexed, and centrifuged again for 2 minutes at 4,122 ×g at 4°C. Ethanol was decanted, and the samples were air-dried. The dried pellets were resuspended in 100 µl of a urea buffer [8 M urea, 2 M thiourea, 4% CHAPS (wt/vol), 65 mM Dithiothreitol (DTT), 40 mM Tris, pH 8.3] then vortexed vigorously for 1–2 minutes.
Protein concentrations were determined (Bradford, 1976) using premixed reagents (Bio-Rad Laboratories, Hercules, CA). Proteins were diluted with the urea buffer and adjusted to a final protein concentration of 4.5 mg/mL with 0.5 mL of Wang’s tracking dye [3 mM EDTA, 3% (wt/vol), SDS, 30% (vol/vol), glycerol, 0.001% (wt/vol) pyronin Y, and 30 mM Tris-HCl, pH 8.0] and 0.1 mL of 2-mercaptoethanol. Samples were then vortexed, heated for 15 minutes at approximately 50°C, and stored at –80°C. Protein concentration consistency was confirmed using 15% SDS-PAGE gels and Colloidal Coomassie Blue staining (1.7% ammonium sulfate, 30% methanol, 3% phosphoric acid, and 0.1% Coomassie G-250).
2.13.2 Two-dimensional difference in gel electrophoresis
Liver and kidney protein extracts from each dietary treatment group were labeled alternatively with CyDye3 and CyDye5 (Carlson et al., 2017) in accordance with the manufacturer’s directions (GE Healthcare, Piscataway, NJ). A pooled reference sample containing equal amounts of all samples (n = 24 total) was used for identification and picking gels. Two aliquots of the pooled reference sample (100 µg) were labeled with CyDye2 and run on all gels. Samples were stored at –80°C and were prepared for analysis in duplicate. Samples from each tissue were processed and analyzed independently such that only liver samples were analyzed together during 2D gel electrophoresis with other liver samples, and likewise for kidney samples.
Labeled samples were prepared for running on 11-cm pH 3–10 immobilized pH gradient (IPG) strips (GE Healthcare, Piscataway, NJ). The pooled reference sample and 15 µg of protein from each dietary treatment were combined for 45 µg of total protein for each strip (Carlson et al., 2017). Rehydration solution (DeStreak, GE Healthcare, Piscataway, NJ) was prepared as directed by the manufacturer by combining 2% IPG buffer, pH 3–10 (17-6000-87, GE Healthcare, Piscataway, NJ), and 20 mM 1,4-DTT. The rehydration solution was mixed with the prepared proteins. Protein solutions and strips were placed in individual wells of a humidified rehydration chamber.
Strips were rehydrated overnight (for approximately 18 hours) in a dark at room temperature (24°C) before being run in the first dimension on an Ettan IPGphor isoelectric focusing system (GE Healthcare, Piscataway, NJ). Proteins were focused on the strips for 11,500-volt hours and then were stored in tubes at –80°C until equilibration was initiated for the second dimension (Carlson et al., 2017). Two 15-minute washes completed equilibration for the second dimension (separation by molecular weight). The first wash contained equilibration buffer (50 mM Tris-HCl pH 8.8, 6 M urea, 30% glycerol, 2% SDS, and trace amounts of bromophenol blue) and 65 mM DTT. The second wash contained the equilibration buffer and 135 mM iodoacetamide. Strips were then loaded onto 12.5% preparative gels [25.5 × 20.5 cm, 1.5 mm thick, acrylamide:N,N’-bis-methylene acrylamide = 100:1 (wt/wt), 0.1% (wt/vol) SDS, 0.05% (vol/vol) tetramethylene diamine (TEMED), 0.05% (wt/vol) ammonium persulfate (AMPER), 0.5 M Tris-HCl, pH 8.8] and run on an Ettan DALT SIX system (GE Healthcare, Piscataway, NJ). Overlay agarose with trace amounts of bromophenol blue was used to solidify strips in place for second-dimension separation (two strips per gel). Proteins were fractionated and resolved on the gel until the overlay solution dye was run off the bottom of each gel (approximately 2,500-volt hours). A running buffer solution consisting of 25 mM Tris, 192 mM Glycine, 2 mM EDTA, and 0.1% (wt/vol) SDS was used (Carlson et al., 2017). Once the second dimension was completed, gels were imaged using an Ettan DIGE Imager (GE Healthcare, Piscataway, NJ) and analyzed using DeCyder™ 2D software version 6.5 (GE Healthcare, Piscataway, NJ) to normalize protein quantities and identify differences in protein abundance between CTL and XYL treatments. See Supplementary File 2 for a representative 11-cm, pH 3–10 2D-DIGE gel.
DeCyder™ 2D software version 6.5 (GE Healthcare, Piscataway, NJ) was used to analyze all 2D-DIGE gels with two technical replicates for each biological replicate for spot identification. Paired t-tests were used to determine differences in protein spot abundance between the control and treatment groups, with significance set at p ≤ 0.10.
2.13.3 Spot identification
Spots of interest for comparison were initially identified as significantly different for the comparison between CTL and XYL (p< 0.10). The corresponding pooled reference sample was then used for downstream protein spot identification analyses. Picked spots were excised from gels as described (Carlson et al., 2017), sent to the Iowa State University Protein Facility, and digested with trypsin using a Genomic Solutions Investigator ProGest automated digester (Genomic Solutions Inc., Ann Arbor, MI). After digestion, the solution was dried and reconstituted in 25 µL of water containing 0.1% formic acid. Spots were separated through liquid chromatography (Thermo Scientific EASY nLC-1200 coupled to a Thermo Scientific Nanospray FlexIon source) using a pulled glass emitter 75 µm × 20 cm (Agilent capillary, part #16-2644-5), with the tip packed with Agilent SB-C18 Zorbax 5 µm packing material (part #820966-922) and the remaining emitter packed with nano LCMS Solutions UChrom C18 3 µm packing material (part #80002). Samples were analyzed by tandem mass spectrometry (MS/MS) using a Q Exactive TM Hybrid Quadrupole-Orbitrap Mass Spectrometer (Thermo Scientific, Waltham, MA). Thermo Scientific’s Proteome Discoverer Software (Waltham, MA) was used to analyze the raw data to identify matched proteins and peptides against publicly available or user-provided databases. Peptide fragments were compared with a known database program using Mascot (London, United Kingdom) and Sequest HT against a Sus scrofa database (accessed April 2018) to identify proteins.
3 Results
3.1 Growth performance and serum outcomes
Mean body weight prior to the initiation of the experiment was similar between treatments. Similarly, the XYL treatment had no effect on final weight (Table 3; p > 0.10). However, the XYL group had a reduction in both the rate (5%) and efficiency of gain (4%; Table 3; p = 0.05).
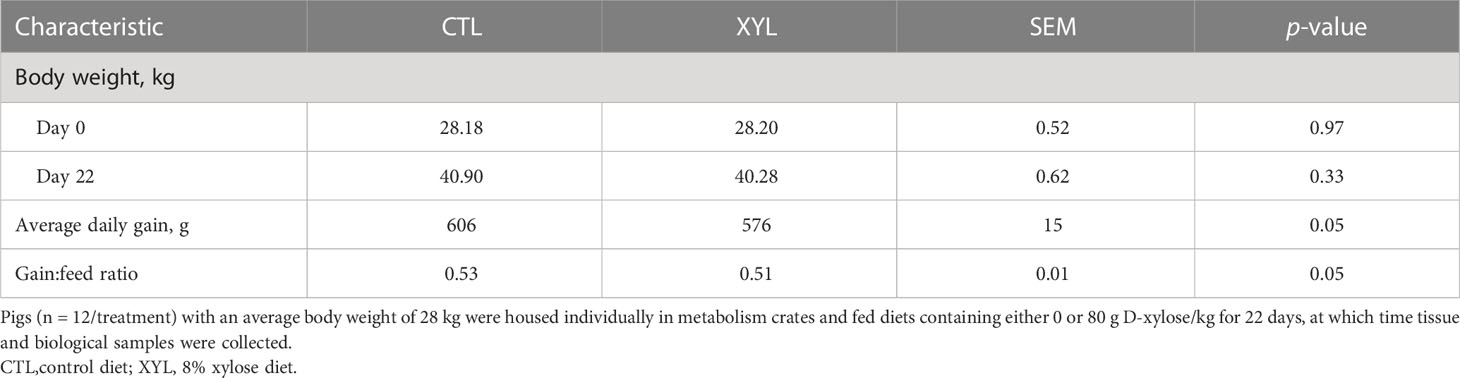
Table 3 Impact of dietary xylose supplementation on growth performance of pigs.
Serum assay confirmed that the control animals received no xylose in their diet (Table 4). This was in contrast to the serum harvested from treatment pigs, which confirmed they received—and absorbed—xylose (0.42 g xylose/kg; Table 4; p< 0.001). Liver glycogen and serum IGF-1 were not impacted by dietary treatments (p > 0.10).
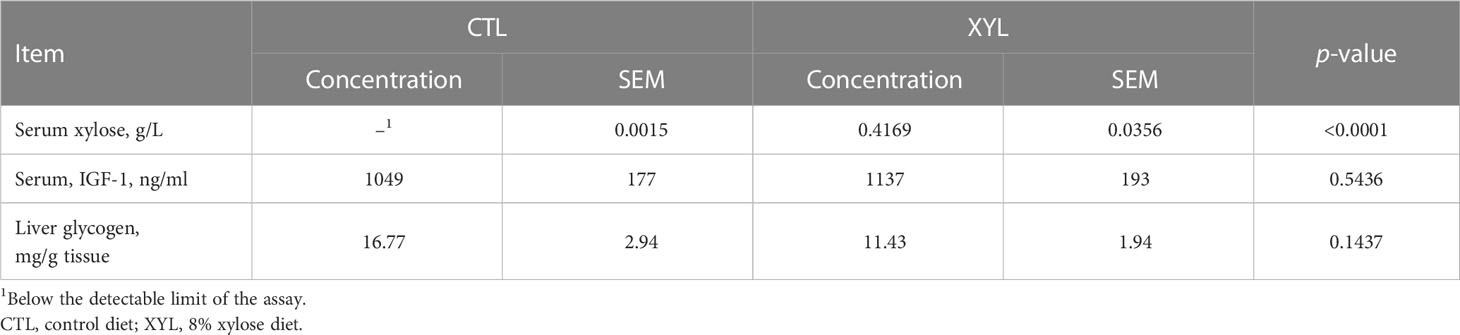
Table 4 Mean serum concentrations of xylose, IGF-2 and liver glycogen concentration.
3.2 RNA-sequencing
3.2.1 Sequencing quality and mapping statistics
An average of six million QuantSeq 3′ reads were produced per sample, with an average of 96.3% mapped and 87.4% uniquely mapped (see Table 5 for a summary and Supplementary File 3, Table S1, for individual sample statistics.)
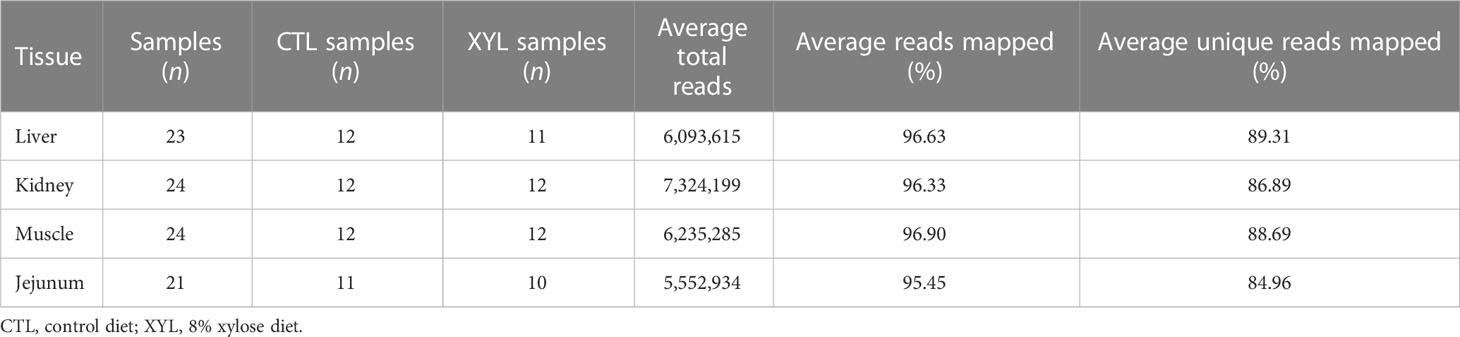
Table 5 Summary of samples and read mapping statistics for each tissue.
3.2.2 Identification of DE genes, enriched pathways, and biological processes
A total of 12,265, 11,063, 10,882, and 11,486 genes in kidney, liver, muscle, and jejunum samples, respectively, were analyzed for differential expression in response to xylose treatment. The majority of DE genes were identified in the kidney (157), with only a few identified in the liver (1), muscle (20), and jejunum (16.) A full summary of all DE genes is provided in Supplementary File 3, Table S2. Only the ergosterol biosynthesis 28 gene homolog (ERG28) was identified in the liver as DE. The DE genes identified in muscle and jejunum tissue are presented in Figures 1A, B as well as Supplementary File 3. In the kidney, 124 of the 157 DE genes were found to be of greater abundance in control samples (Figure 1C).
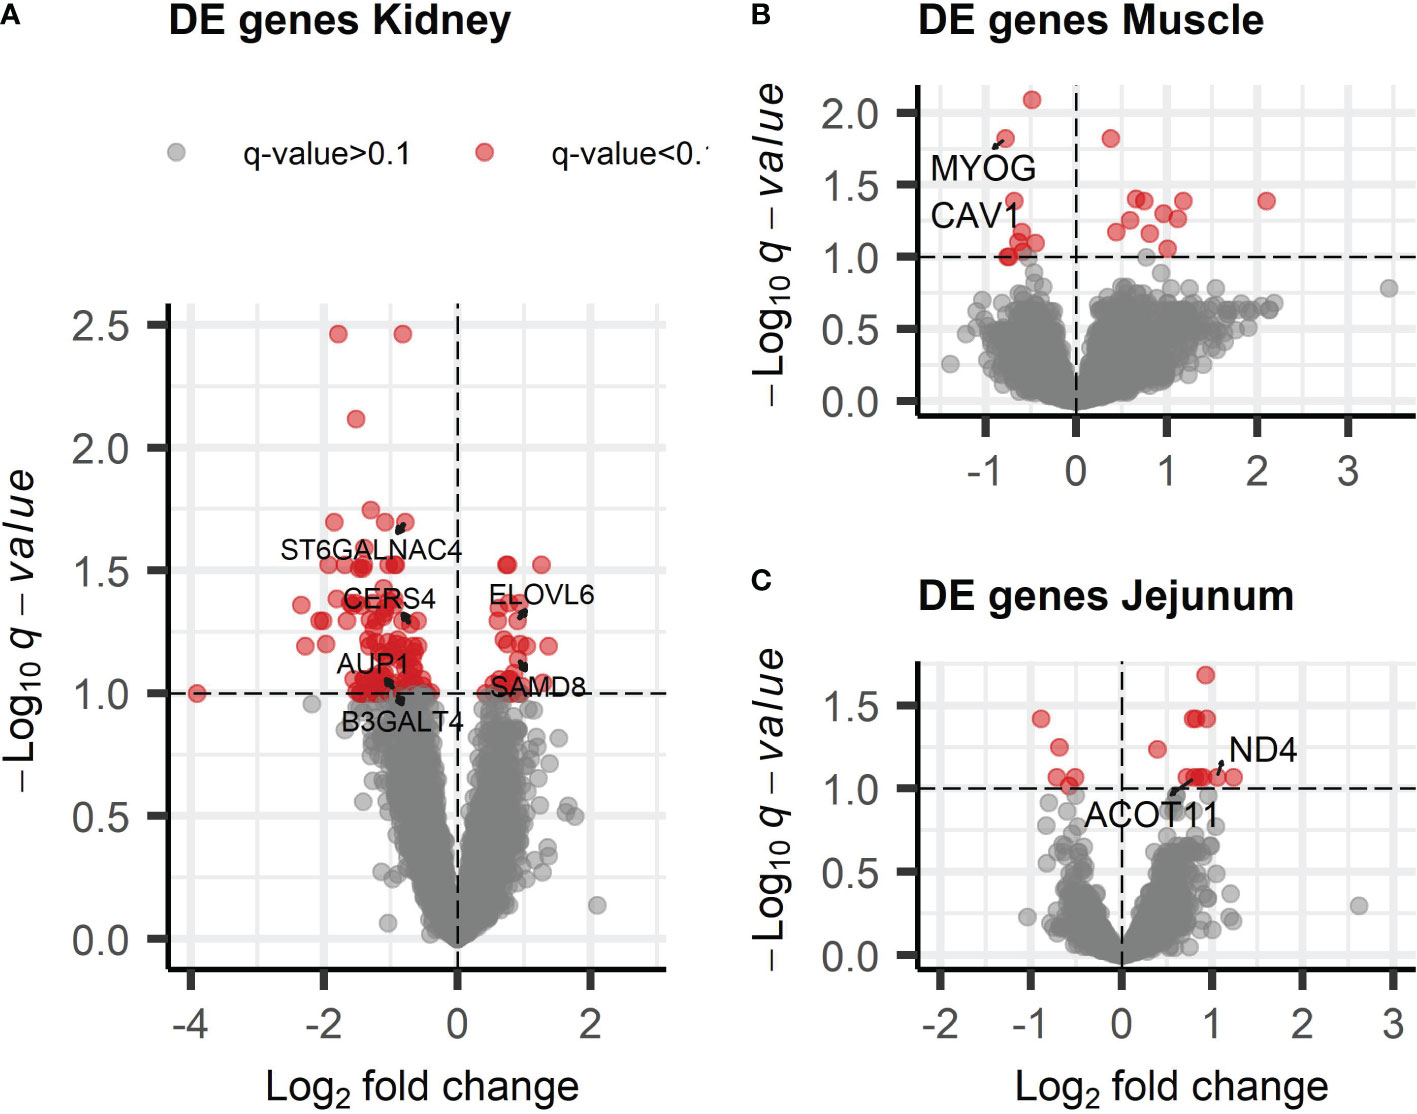
Figure 1 Visualization of the differentially expressed (DE) genes identified in response to dietary xylose supplementation. The DE genes are displayed in terms of both magnitude of change (log2 fold change, x-axis) and significance (–log10 q-value, y-axis) across tissues using a volcano plot. The plot shows significant DE genes (q< 0.10) with log2 fold change > 0.5 (in red) for (A) kidney (157 DE genes), (B) skeletal muscle (20 DE genes) and (C) jejunum (16 DE genes) tissues.
Gene ontology enrichment analysis was conducted only with DE genes in the kidney as it was the only tissue with sufficient gene numbers for an analysis to be effective. A total of 47 enriched GO BP terms were identified from the 129 DE genes in the kidney, which had annotations for human orthologs (FDR< 0.05; Figure 2). The GO BPs were clustered into 17 groups related to lipid metabolism, aminopeptidase and metalloexopeptidase activity, cholesterol efflux, solute:sodium symporter activity, iron ion homeostasis, aerobic respiration, and cytochrome-c oxidase activity. Seven DE genes were clustered with several lipid biosynthesis and metabolism types involving sphingolipids, ceramide, ganglioside, and glycolipids. Among these seven genes, ceramide synthase 4 (CERS4), ceroid-lipofuscinosis, neuronal 6, late infantile, variant (CLN6), beta-1,3-galactosyltransferase 4 (B3GALT4), and ST6 N-acetylgalactosaminide alpha-2,6-sialyltransferase 4 (ST6GALNAC4) were more abundant in the kidney of CTL animals, whereas sterile alpha motif domain containing 8 (SAMD8) and ELOVL fatty acid elongase 6 (ELOVL6) were more abundant in the kidney of XYL animals. Supplementary File 2 provides additional figures displaying statistically enriched GO BP ontology terms and Supplementary File 3 provides a full list of all GO BP terms, statistical values, and genes for all gene expression analyses.
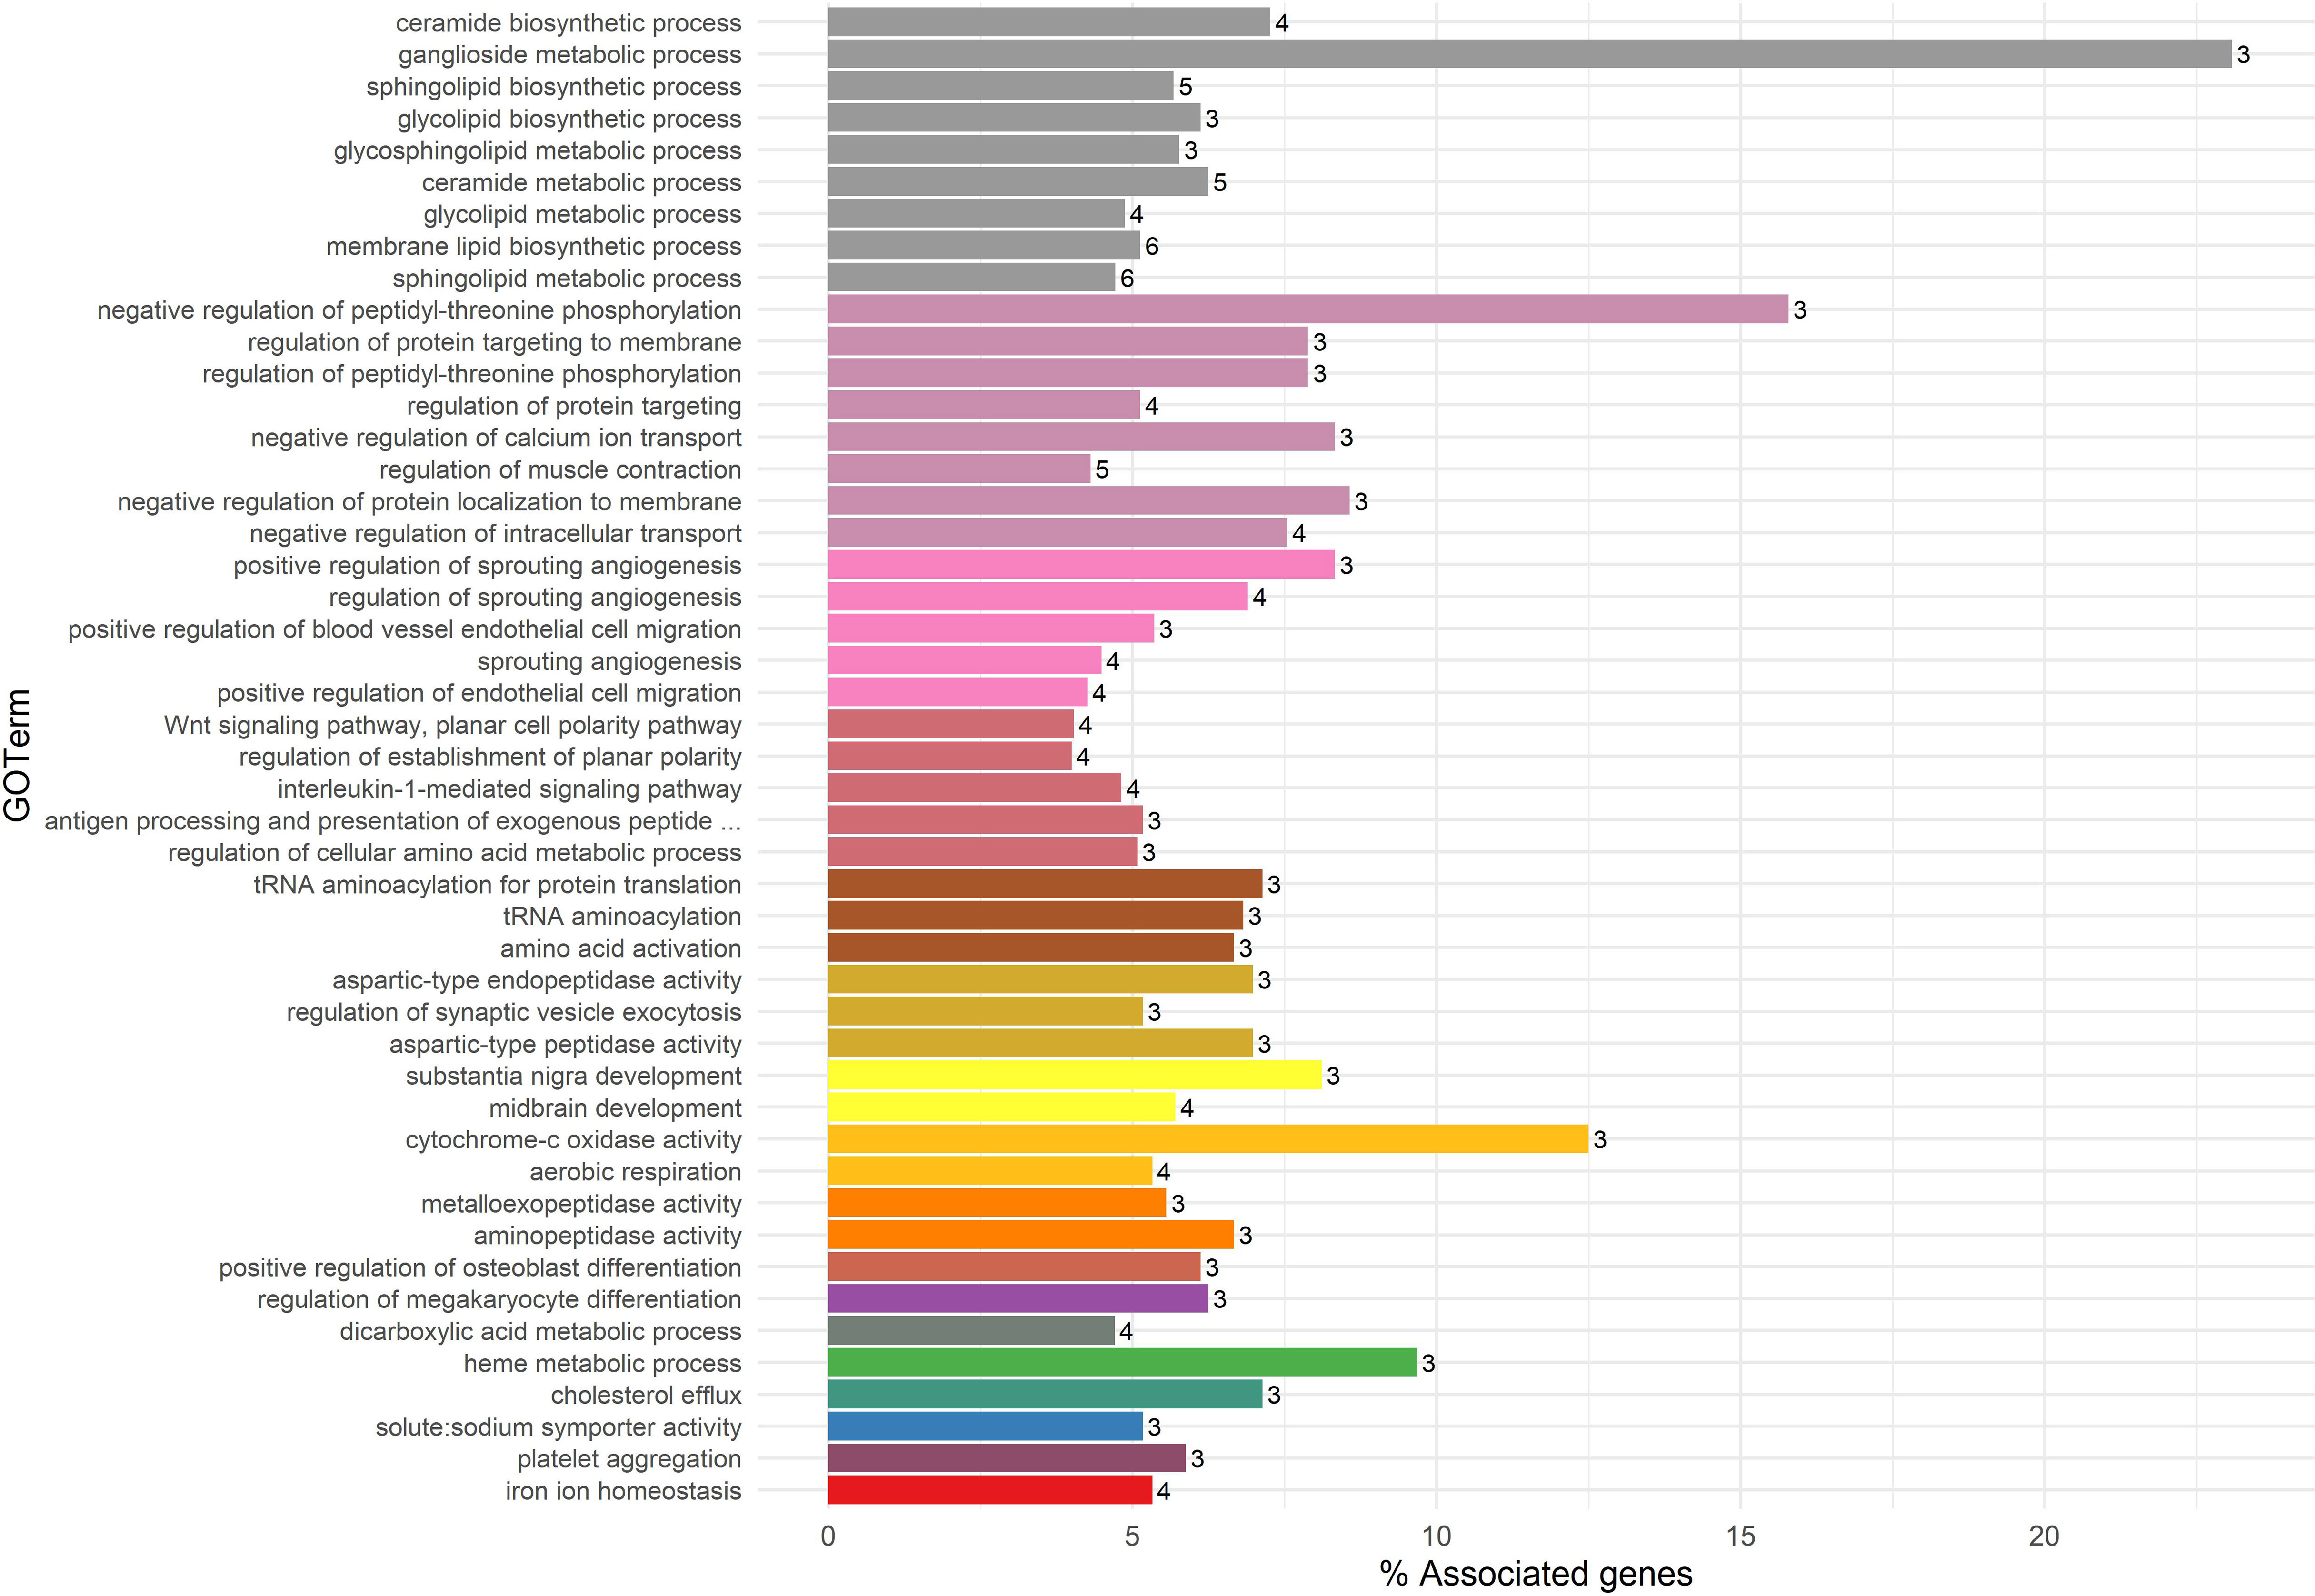
Figure 2 Summary of biological process (BP) and gene ontology (GO) annotation terms enriched from differentially expressed (DE) genes in response to xylose treatment identified in the kidney. The bar plot displays functional enrichment (i.e., overrepresented GO BP terms) from the DE gene list in response to xylose treatment in the kidney, with significance declared at a false discovery rate< 0.05. The size of each bar represents the percentage of DE genes per GO BP term, and the number of DE genes associated with each ontology term is shown as a label. Ontology terms that were closely related based on the similarity of genes/biological functions were grouped by kappa score (kappa score > 0.4). Grouped GOBP terms appear in the same color within the figure. Of note, the BP terms in olive green at the bottom of the plot are all related to various fatty acid or lipid metabolic processes.
3.2.3 Identification of co-expressed gene expression network modules in the kidney associated with xylose
In all, 34 gene network modules were identified in the kidney in the XYL group and 29 network modules were identified in the control treatment. Seven gene network modules in the XYL group (Xylose 04, 13, 18, 22, 21, 31, 32, and 34) were identified as conserved (common) in the control group modules (Control 19, 20, 22, 23, 24, and 29) allowing for a comparison of the changes in correlation among genes within modules (Supplementary File 3, Table S4). Six of the seven modules in the xylose-treated group that were common across treatments were also identified as statistically associated with average xylose (Table 6, Supplementary File 3, Table S4). This may indicate that these genes play specific roles in response to xylose metabolism in the kidney. The list of enriched BP ontology terms for these six network modules are listed in Supplementary File 3, Table S5. Interestingly, these modules were enriched for biological processes such as fatty acid oxidation, endosomal-related transport, carbohydrate transport, and immune cell activation. Potential regulatory genes for these modules (i.e., hub genes) are described in Supplementary File 3, Tables S6 and S7. Among the BPs enriched in the Xylose 04 module were endosomal-related transport and protein localization to the membrane. This network module had three hub genes related to endosomal transport (RHOBTB3, VPS26A, and ARF6), whereas most of the enriched genes (six out of seven) in the protein localization BP group were hub genes (AKAP5, ARF6, ITGB1, MESD, RAP1A, and VAMP7). This module contained DE genes, some of which were identified as hub genes not contained within the enriched BP terms, including: AUP1, DMTN, MYL9, RNF1666, and TMEM87B (Table 6). Among the other network modules with enriched BP terms, the Xylose 13 module was enriched for lipid oxidation, Xylose 18 for carbohydrate transport, and Xylose 32 for immune cell activation.
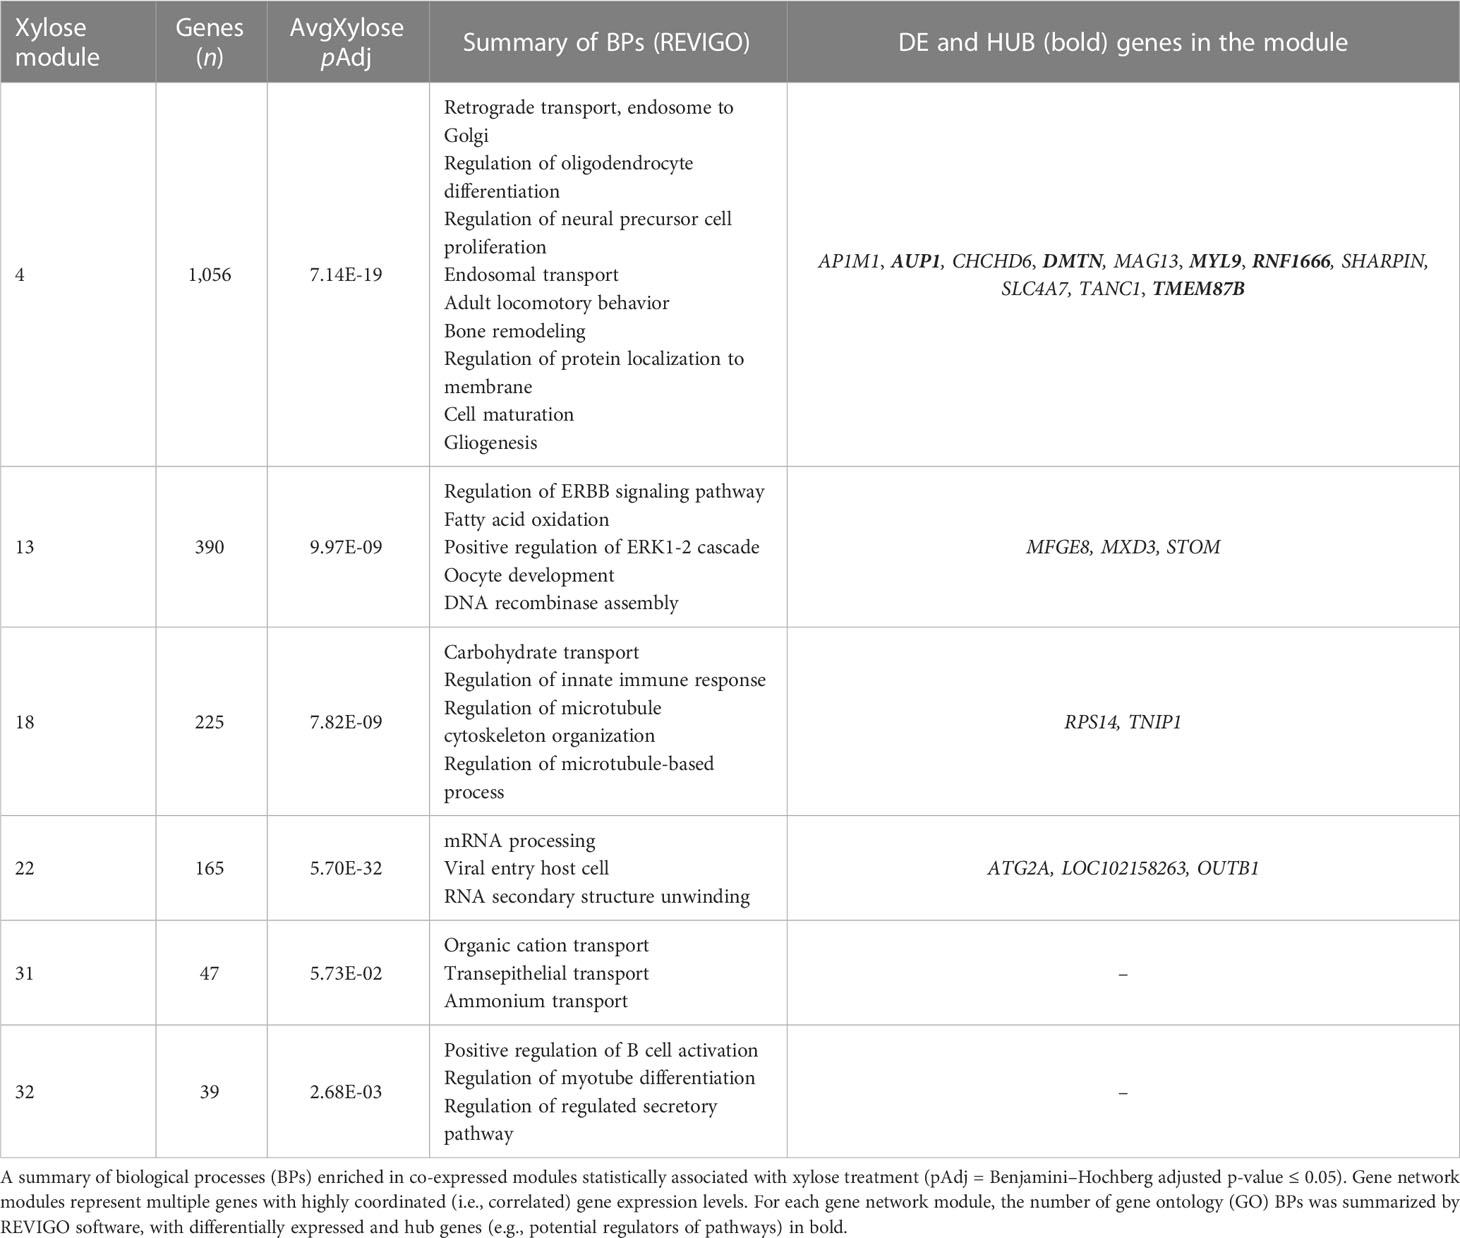
Table 6 Identification of biological processes and pathways for gene network modules associated with dietary xylose supplementation.
3.3 Proteomic differences between xylose-treated and control pigs based on 2D-DIGE analysis
A total of 41 protein spots were found to be significantly different between tissue samples from XYL and CTL pigs (p< 0.05). Of these 41 spots, 25 were from kidney tissue, and the remaining 16 spots were from liver tissue. A complete list of these 41 spots, complete with each uniquely identified protein in each spot, can be viewed in Supplementary File 3, Table S8.
Some of the proteins identified were related to carbohydrate metabolism, the pentose phosphate pathway, glycolysis, and the tricarboxylic acid cycle (TCA cycle)—all processes potentially related to the metabolism of xylose in pigs. Interestingly enough, three of the proteins identified in different spots from kidney tissue matched genes identified in the DE analysis. D-3-phosphoglycerate dehydrogenase (A5GFY8, spot 208) appeared in 94.44% of the samples studied; succinate dehydrogenase (ubiquinone) flavoprotein subunit, mitochondrial (Q0QF01, spot 154) appeared in 44.44% of the samples; and hemoglobin subunit beta (P02067, spot 493) appeared in 16.67% of the samples. These three proteins had a negative average ratio, indicating that they were less abundant in XYL pigs. However, three other potential proteins were also identified in spots 208 and 493, whereas spot 154 matched only one other protein. In contrast to the findings for these three proteins in our DE gene analyses, the genes encoding them were decreased in the CTL group, as indicated by their negative log2 fold change values. Other proteins identified by the proteomic analysis only also had very high occurrences in the samples tested. Four spots were present in all samples (spots 235, 117, 302, and 205), six were present in 94.44% of samples (spots 150, 184, 208, 234, 336, and 492), and three were present in 88.89% of samples (spots 445, 424, and 122). Although some of these abundant spots contained more than one identified protein, the different proteins are known to act in similar biological processes. All of these spots contained proteins related to energy metabolism. Spot 235 was more abundant in the XYL group. It contained protein enolases encoded by the genes enolase 1 (ENO1) and enolase 3 (ENO3), as well as glycine amidinotransferase encoded by the gene glycine amidinotransferase, mitochondrial (GATM). Spot 336 contained glycolytic proteins encoded by the genes aldolase, fructose-bisphosphate B (ALDOB), and glyceraldehyde-3-phosphate dehydrogenase (GAPDH). Spot 424 had proteins encoded by the genes phosphoglycerate mutase 1 (PGAM1) and adenylate kinase 2 (AK2), with both spots more abundant in the CTL sample group. All spots and their respective proteins are further described in Supplementary File 3, Table S8.
4 Discussion
Xylose is a component of the hemicellulose portion of carbohydrates and is present in ingredients that have the potential to be used as a cheaper alternative energy source for pigs. To justify using xylose as an energy source in a swine diet, it is important to consider how increased dietary xylose may impact molecular mechanisms in key tissues, affecting nutrient uptake and growth. Therefore, we analyzed the impact of a xylose-supplemented diet on growth traits, the transcriptome of four different tissues, and the proteome of two tissues believed to be important in xylose metabolism in growing pigs. The rate and efficiency of pig growth were reduced by XYL. Efficiency measured as G:F is most responsive to changes in dietary energy and in this instance was reduced by 3.8%. If xylose was not utilized at all by pigs, as some authors have suggested, then feed conversion would have been expected to be reduced by an average of 11% (Patience, 2012). These data alone suggest that xylose can and does contribute to the pig’s energy supply but with less efficiency than starch (glucose). The observed reduction in growth rate and feed conversion was not surprising; however, it is clear that xylose was utilized by the pigs, albeit with a somewhat lower efficiency than glucose.
In the literature, the impact of xylose on growth performance is variable, but generally, greater levels of xylose supplementation (10% and above) resulted in growth performance depression of increasing magnitude (summarized in Huntley and Patience, 2018a). This supports our hypothesis that many studies utilized dietary xylose levels well above normal intake, such that any conclusions drawn from these data may not be relevant to the pig’s normal dietary circumstances. Critically, xylose was detected in the serum of the treatment (XYL) pigs, confirming that pigs are capable of absorbing xylose as an intact sugar and not just as a product of intestinal metabolism or fermentation.
Only in the kidney were there sufficient numbers of DE genes and proteins to clearly illustrate the impact of dietary xylose on pigs. Overlap in the results obtained by transcriptomic and proteomic studies is in itself remarkable. Few genes or proteins were identified as differentially abundant in the liver, muscle, and jejunum in response to xylose. Given the overlap in the genes and proteins altered by xylose at the pathway level, our results and discussion focus on the kidney due to the greater magnitude and clarity of impact. It is important to note that the genes and proteins identified as differentially abundant in this study have a limited function in the kidney as documented in the literature. Thus, it is possible that these genes and proteins may have other functions beyond those currently documented.
Few changes in gene expression were identified across tissues in response to dietary xylose, except in the kidney. Only small numbers of DE genes were identified in the liver, jejunum, and longissimus dorsi muscle tissue. The proteomic analysis also identified more differences in the kidney. The role of the kidney in xylose metabolism is a particularly noteworthy finding because it has been observed that increased dietary xylose in pigs increased water intake, urine excretion, and the gross energy content of the urine (Huntley and Patience, 2018b). The kidney functions to rid the body of excess metabolites and toxins and, thus, if xylose and its associated metabolites cannot fully be metabolized by pigs, it makes logical sense that more genes would be DE in the kidney in response to xylose treatment. The kidney also functions to maintain electrolyte and acid-base homeostasis and to reabsorb nutrients (Bhargava and Schnellmann, 2017). To support these functions, the kidney requires large amounts of ATP and obtains some of this energy through mitochondrial fatty acid β-oxidation (Bhargava and Schnellmann, 2017). In support of this, several DE genes identified in the kidney were related to lipid and fatty acid metabolism.
The ontology enrichment analysis identified clusters of DE genes in the kidney involved in membrane sphingolipid biosynthesis processes, including glycosphingolipids, gangliosides, and ceramides. Sphingolipids are constituents of cell membranes that act on membrane fluidity (reviewed by Rao and Acharya, 2008). Sphingolipid metabolism is affected by nutrient supply (Choi and Snider, 2015) and may be related to cell membrane signaling and trafficking (reviewed by Ohanian and Ohanian, 2001; Rao and Acharya, 2008). Most of the DE genes clustered in these pathways were lower in abundance in the kidneys of xylose-treated animals. Among these genes, we found B3GALT4 and ST6GALNAC4, which are known to catalyze reactions during gangliosides biosynthesis (Lee et al., 1999; Wang et al., 2020), CERS4, which is related to the metabolism of ceramides (Sassa et al., 2016), and TECR, which acts in the elongation of fatty acids cycle (Wakashima et al., 2014), producing very long-chain fatty acids that are mostly used in sphingolipids biosynthesis (Wakashima et al., 2014). Inversely, ELOVL6 was found to be more abundant in xylose-treated animals, and this gene encodes an enzyme that catalyzes the rate-limiting reaction of the long-chain fatty acids elongation cycle during de novo fatty-acid synthesis (Moon et al., 2001). Changes in the expression of ELOVL6 may result in different lengths of fatty acids (Matsuzaka et al., 2007). Variations in the length of fatty acid chains that make up the membrane may affect permeability, with longer lengths resulting in less permeability (Uchiyama et al., 2016). Therefore, lower expression of B3GALT4, ST6GALNAC4, and CERS4 may result in less usage of fatty acids for the biosynthesis of sphingolipids, while higher expression of ELOVL6 may suggest fatty-acid elongation, which could result in less membrane permeability in pigs receiving dietary xylose treatment.
Gene network analyses were used to identify gene modules representing clusters of genes that correlated and thus likely coordinated gene expression levels impacted by xylose treatment. Correlated changes in gene expression are thought to represent changes in pathways of genes that work together to mediate the biology underlying the observed responses to the dietary treatment. This study identified a specific set of gene modules associated with lipid oxidation and endosome-related trafficking in response to dietary xylose. Functional enrichment of the Xylose 04 module indicated that endosome-related transport in kidney cortex cells was affected by xylose consumption. This pathway is essential for the reabsorption of molecules from the filtrate to the blood in proximal tubules located in the kidney cortex (reviewed by Welling and Weisz, 2010; Eshbach and Weisz, 2017). A candidate regulatory gene (i.e., hub gene) for one of the conserved modules, AUP1 lipid droplet regulating VLDL assembly factor (AUP1) (contained within the Xylose 04 module), functions in lipid metabolism, lipid droplet regulation, and cholesterol homeostasis (Klemm et al., 2011; Jo et al., 2013). Based on the DE genes and gene network modules identified, sphingolipid biosynthesis/metabolism and endosome-related trafficking were downregulated. These results may be linked, as previous studies indicate that endocytosis-related trafficking activity was reduced when ceramide and sphingolipid levels were downregulated in endothelial cells of Drosophila (Pepperl et al., 2013). Considering the gene expression and gene network module results in combination may indicate that changes in gene expression in sphingolipid and fatty acid metabolism are related to the kidney modulating its energy needs to maintain cellular osmolality. Previous studies have indicated that changes in fatty acids such as arachidonic acid are related to angiotensin II, type 2 receptor function, which impacts blood pressure and sodium excretion (Jacobs and Douglas, 1996; Carey et al., 2000).
Proteomic results corroborate the hypothesis that energy metabolism affects kidney phenotype in animals treated with xylose. Several proteins related to glycolysis and gluconeogenesis were more abundant in the control sample group, such as proteins encoded by the genes aldolase, fructose-bisphosphate B (ALDOB); GAPDH (Shestov et al., 2014; Hu et al., 2016); and phosphoglycerate mutase (PGAM1) (Hitosugi et al., 2012). Conversely, proteins related to fatty-acid oxidation, such as medium-chain specific acyl-CoA dehydrogenase (ACADM) (Bruun et al., 2013; Lim et al., 2018), were more abundant in the xylose-treated group. Indeed, fatty-acid oxidation is known to be a major source of energy for the kidney (Bhargava and Schnellmann, 2017). The next steps of energy production also seem to be affected, including, for instance, the tricarboxylic acid cycle (TCA cycle), which uses the acetyl-CoA produced by the breakdown of glucose or lipids, and the mitochondrial electron transport chain, which uses the output of TCA to produce ATPs (reviewed by Martínez-Reyes and Chandel, 2020). Proteins acting in the TCA cycle, such as glutamate dehydrogenase 1 (GLUD1) (Moreadith and Lehninger, 1984) and succinate dehydrogenase (ubiquinone) flavoprotein (SDHA) (Yankovskaya et al., 2003) were also more abundant in the xylose-treated group.
5 Conclusions
In conclusion, our results indicate that pigs can utilize free xylose for growth should it be liberated from arabinoxylan through exogenous dietary xylanase supplementation. This finding expands our understanding of how xylanase supplementation in swine diets may impact xylose absorption, dietary metabolizable energy contribution, and downstream biological processes impacted by xylose not previously considered. Xylose supplementation resulted in the greatest number of genes with expression affected being found in kidney tissue, but also showed a few DE genes in the other tissues analyzed (liver, muscle, and jejunum tissues). The DE genes in the kidney were primarily enriched for ontology terms related to lipid biosynthesis and metabolism, which can potentially cause a shift in energy sources to make up for the less efficiently metabolizable xylose. The proteomic analysis confirmed that the kidney was the most affected tissue and that changes occurred in proteins involved in lipid metabolic processes and energy. Although the inclusion of xylose in a diet impacts the biological processes and function of the animal, it does not appear to drastically affect the pig’s ability to grow efficiently. However, further studies, including longer periods of supplementation, are needed to assess the full impact of dietary xylose on the body system over an extended period of time.
Data availability statement
The datasets used in this study can be found online at the NCBI GEO database. The data can be found at https://www.ncbi.nlm.nih.gov/geo/, under accession number GSE233123.
Ethics statement
The animal study was reviewed and approved by Iowa State University IACUC.
Author contributions
NH designed and performed the experiment, processed and analyzed samples, and helped draft the manuscript. MS performed the gene expression analyses, interpreted results, wrote the initial manuscripts, and updated manuscript drafts. Note: NH and MS contributed equally to this work. HB carried out the RNA-seq data processing bioinformatics. AL conducted the gene expression analysis. SL and EH-L supervised the protein preparation and analysis. JP was the principal investigator and supervised all aspects of the study. JK oversaw the bioinformatics and RNA-seq statistical analyses, provided feedback regarding statistical analyses, helped draft the initial manuscript, and coordinated manuscript completion. All authors contributed to the article and approved the submitted version.
Funding
This research was funded by Elanco Animal Health, Greenfield, IN, USA, and the Iowa Pork Producers Association, Clive, IA, USA. Funders had no role in the design, analysis, or writing of this article.
Acknowledgments
We are deeply grateful to Stacie Matchan for her excellent assistance with the conduct of this experiment. The research reported in this study is partially supported by the HPC@ISU equipment at Iowa State University, some of which was purchased through funding provided by NSF under MRI grants, numbers 1726447 and MRI2018594.
Conflict of interest
Author NH was employed by the company PMI Nutrition International, LLC.
The remaining authors declare that the research was conducted in the absence of any commercial or financial relationships that could be construed as a potential conflict of interest.
Publisher’s note
All claims expressed in this article are solely those of the authors and do not necessarily represent those of their affiliated organizations, or those of the publisher, the editors and the reviewers. Any product that may be evaluated in this article, or claim that may be made by its manufacturer, is not guaranteed or endorsed by the publisher.
Supplementary material
The Supplementary Material for this article can be found online at: https://www.frontiersin.org/articles/10.3389/fanim.2023.1179773/full#supplementary-material
Abbreviations
2D-DIGE, two-dimensional difference gel electrophoresis; ACADM, medium-chain specific acyl-CoA dehydrogenase; ACOT11, acyl-CoA thioesterase 11; ADG, average daily gain; AK2, adenylate kinase 2; ALDOB, aldolase, fructose-bisphosphate B; AvgXylose, average urinary xylose concentration; B3GALT4, beta-1,3-galactosyltransferase 4; BP, biological process; BW, body weight; CERS4, ceramide synthase 4; CLN6, ceroid-lipofuscinosis, neuronal 6, late infantile, variant; CTL, control diet; DE, differentially expressed (genes); DTT, dithiothreitol; ELOVL6, ELOVL fatty acid elongase 6; ENO1, enolase 1; ENO3, enolase 3; ERG28, ergosterol biosynthesis 28 gene homolog; FBP1, fructose-bisphosphatase 1; FDR, false discovery rate; F:G, feed-to-gain ratio; GAPDH, glyceraldehyde-3-phosphate dehydrogenase; GATM, glycine amidinotransferase, mitochondrial; GLUD1, glutamate dehydrogenase 1; GO, gene ontology; IGF-1, insulin-like growth factor-1; IPG, immobilized pH gradient; MYOG, myogenin; N, Nitrogen; ND4, NADH:ubiquinone oxidoreductase core subunit 4; PAGE, polyacrylamide gel electrophoresis; PGAM1, phosphoglycerate mutase 1; RIN, RNA integrity score; SAMD8, sterile alpha motif domain containing 8; SDHA, succinate dehydrogenase complex flavoprotein subunit A; ST6GALNAC4, ST6 N-acetylgalactosaminide alpha-2,6-sialyltransferase 4; TCA, tricarboxylic acid cycle; WI, water intake; XYL, diet including 8% D-xylose.
References
Aibar S., Fontanillo C., Droste C., De Las Rivas J. (2015). Functional gene networks: R/Bioc package to generate and analyse gene networks derived from functional enrichment and clustering. Bioinformatics 31, 1686–1688. doi: 10.1093/bioinformatics/btu864
Andrews S., Babraham Bioinformatics (2010) FastQC: a quality control tool for high throughput sequence data. manual. Available at: http://www.bioinformatics.babraham.ac.uk/projects/.
AOAC (2006). Official methods of analysis of AOAC international. 18th ed. Eds. Horwitz W., Gaithersburg G.L. M. D. (Association of Official Analytical Chemists International). Available at: https://www.scienceopen.com/document?vid=aa8a7d3b-e9b6-4215-a6b6-4556ff2f30cc.
Bach Knudsen K. E. (2014). Fiber and nonstarch polysaccharide content and variation in common crops used in broiler diets. Poult. Sci. 93 (9), 2380–2393. doi: 10.3382/ps.2014-03902
Benjamini Y., Hochberg Y. (1995). Controlling the false discovery rate: a practical and powerful approach to multiple testing. J. R. Stat. Soc Ser. B 57, 298–300. doi: 10.1111/j.2517-6161.1995.tb02031.x
Bhargava P., Schnellmann R. G. (2017). Mitochondrial energetics in the kidney. Nat. Rev. Nephrol. 13, 629–646. doi: 10.1038/nrneph.2017.107
Bindea G., Mlecnik B., Hackl H., Charoentong P., Tosolini M., Kirilovsky A., et al. (2009). ClueGO: a cytoscape plug-in to decipher functionally grouped gene ontology and pathway annotation networks. Bioinformatics 25, 191–1093. doi: 10.1093/bioinformatics/btp101
Bradford M. M. (1976). A rapid and sensitive method for the quantitation of microgram quantities of protein utilizing the principle of protein-dye binding. Anal. Biochem. 72, 248–254. doi: 10.1016/0003-2697(76)90527-3
Bruun G. H., Doktor T. K., Andresen B. S. (2013). A synonymous polymorphic variation in ACADM exon 11 affects splicing efficiency and may affect fatty acid oxidation. Mol. Genet. Metab. 110, 122–128. doi: 10.1016/j.ymgme.2013.06.005
Carey R. M., Wang Z. Q., Siragy H. M. (2000). Role of the angiotensin type 2 receptor in the regulation of blood pressure and renal function. Hypertension 24, 155–163. doi: 10.1161/01.hyp.35.1.155
Carlson K. B., Prusa K. J., Fedler C. A., Steadham E. M., Huff-Lonergan E., Lonergan S. M. (2017). Proteomic features linked to tenderness of aged pork loins. J. Anim. Sci. 95, 2533–2546. doi: 10.2527/jas2016.1122
Choi S., Snider A. J. (2015). Sphingolipids in high fat diet and obesity-related diseases. Mediators Inflamm. 22, 96–116. doi: 10.1155/2015/520618
Codex Alimentarius Committee of the Food and Agriculture Organization of the United Nations (FAO) (2010) Guidelines on nutrition labelling CAC/GL 2-1985 as last amended 2010. Available at: http://www.fao.org/fao-who-codexalimentarius/thematic-areas/nutrition-labelling/en/ (Accessed April 4, 2021).
Cornelison A. S., Karriker L. A., Williams N. H., Haberl B. J., Stalder K. J., Schulz L. L., et al. (2018). Impact of health challenges on pig growth performance, carcass characteristics, and net returns under commercial conditions. Transl. Anim. Sci. 2, 50–61. doi: 10.1093/tas/txx005
Cunningham F., Allen J. E., Allen J., Alvarez-Jarreta J., Amode M. R., Armean I. A., et al. (2022). Ensembl 2022. Nucleic Acids Res. 50, D988–D995. doi: 10.1093/nar/gkab1049
Dobin A., Davis C. A., Schlesinger F., Drenkow J., Zaleski C., Jha S., et al. (2013). STAR: ultrafast universal RNA-seq aligner. Bioinformatics 29, 15–21. doi: 10.1093/bioinformatics/bts635
Dodd D., Cann I. K. O. (2009). Enzymatic deconstruction of xylan for biofuel production. GCB Bioenergy 1, 2–17. doi: 10.1111/j.1757-1707.2009.01004.x
Durinck S., Spellman P. T., Birney E., Huber W. (2009). Mapping identifiers for the integration of genomic datasets with the R/Bioconductor package biomaRt. Nat. Protoc. 4, 1184–1191. doi: 10.1038/nprot.2009.97
Eshbach M. L., Weisz O. A. (2017). Receptor-mediated endocytosis in the proximal tubule. Annu. Rev. Physiol. 79, 425–448. doi: 10.1146/annurev-physiol-022516-034234
FASS (2010). Guide for the care and use of agricultural animals in research and teaching, 3rd edition (Champaign, IL, USA: Federation for Animal Science Societies).
Feng Q., Liu Z. L., Weber S. A., Li S. (2018). Signature pathway expression of xylose utilization in the genetically engineered industrial yeast saccharomyces cerevisiae. PloS One 13, e0195633. doi: 10.1371/journal.pone.0195633
Goering H. K., Van Soest P. J. (1970). Forage fiber analyses (Apparatus, reagent, procedures and some applications): agriculture handbook.
Gutierrez N. A., Serão N. V. L., Kerr B. J., Zijlstra R. T., Patience J. F. (2014). Relationships among dietary fiber components and the digestibility of energy, dietary fiber, and amino acids and energy content of nine corn coproducts fed to growing pigs. J. Anim. Sci. 92, 4505–4517. doi: 10.2527/jas.2013-7265
Hitosugi T., Zhou L., Elf S., Fan J., Kang H. B., Seo J. H., et al. (2012). Phosphoglycerate mutase 1 coordinates glycolysis and biosynthesis to promote tumor growth. Cancer Cell 22, 585–600. doi: 10.1016/j.ccr.2012.09.020
Hu H., Juvekar A., Lyssiotis C. A., Lien E. C., Albeck J. G., Oh D., et al. (2016). Phosphoinositide 3-kinase regulates glycolysis through mobilization of aldolase from the actin cytoskeleton. Cell 164, 433–446. doi: 10.1016/j.cell.2015.12.042
Huntley N. F., Patience J. F. (2018a). Xylose: absorption, fermentation, and post-absorptive metabolism in the pig. J. Anim. Sci. Biotechnol 9, 4. doi: 10.1186/s40104-017-0226-9
Huntley N. F., Patience J. F. (2018b). Xylose metabolism in the pig. PloS One 13, e0205913. doi: 10.1371/journal.pone.0205913
Jacobs L. S., Douglas J. G. (1996). Angiotensin II type 2 receptor subtype mediates phospholipase A2- dependent signaling in rabbit proximal tubular epithelial cells. Hypertension 28, 663–668. doi: 10.1161/01.HYP.28.4.663
Jaworski N. W., Lærke H. N., Bach Knudsen K. E., Stein H. H. (2015). Carbohydrate composition and in vitro digestibility of dry matter and nonstarch polysaccharides in corn, sorghum, and wheat and coproducts from these grains. J. Anim. Sci. 93, 1103–1113. doi: 10.2527/jas.2014-8147
Jo Y., Hartman I. Z., DeBose-Boyd R. A. (2013). Ancient ubiquitous protein-1 mediates sterol-induced ubiquitination of 3-hydroxy-3-methylglutaryl CoA reductase in lipid droplet–associated endoplasmic reticulum membranes. Mol.Biol. Cell. 24, 3. doi: 10.1091/mbc.e12-07-0564
Kim D. M., Choi S. H., Ko B. S., Jeong G. Y., Jang H. B., Han J. G., et al. (2012). Reduction of PDC1 expression in s. cerevisiae with xylose isomerase on xylose medium. Bioprocess Biosyst. Eng. 35, 183–189. doi: 10.1007/s00449-011-0638-4
Klemm E. J., Spooner E., Ploegh H. L. (2011). Dual role of ancient ubiquitous protein 1 (AUP1) in lipid droplet accumulation and endoplasmic reticulum (ER) protein quality control. J. Biol. Chem. 286, 37602–37614. doi: 10.1074/jbc.M111.284794
Langfelder P., Horvath S. (2008). WGCNA: an r package for weighted correlation network analysis. BMC Bioinf. 9, 559. doi: 10.1186/1471-2105-9-559
Langfelder P., Horvath S. (2012). Fast r functions for robust correlations and hierarchical clustering. J. Stat. Softw 46, i11. doi: 10.18637/jss.v046.i11
Langfelder P., Luo R., Oldham M. C., Horvath S. (2011). Is my network module preserved and reproducible? PloS Comput. Biol. 7, e1001057. doi: 10.1371/journal.pcbi.1001057
Lee Y. C., Kaufmann M., Kitazume-Kawaguchi S., Kono M., Takashima S., Kurosawa N., et al. (1999). Molecular cloning and functional expression of two members of mouse NeuAcα2,3Galβ1,3GalNac GalNacα2,6-sialyltransferase family, ST6GalNAc III and iv. J. Biol. Chem. 274 (17), 11958–11967. doi: 10.1074/jbc.274.17.11958
Liao Y., Smyth G. K., Shi W. (2014). FeatureCounts: an efficient general purpose program for assigning sequence reads to genomic features. Bioinformatics 30, 923–930. doi: 10.1093/bioinformatics/btt656
Lim E., Lim J. Y., Shin J. H., Seok P. R., Jung S., Yoo S. H., et al. (2015). D-xylose suppresses adipogenesis and regulates lipid metabolism genes in high-fat diet-induced obese mice. Nutr. Res. 35, 626–636. doi: 10.1016/j.nutres.2015.05.012
Lim S. C., Tajika M., Shimura M., Carey K. T., Stroud D. A., Murayama K., et al. (2018). Loss of the mitochondrial fatty acid β-oxidation protein medium-chain acyl-coenzyme a dehydrogenase disrupts oxidative phosphorylation protein complex stability and function. Sci. Rep. 8, 153. doi: 10.1038/s41598-017-18530-4
Love M. I., Huber W., Anders S. (2014). Moderated estimation of fold change and dispersion for RNA-seq data with DESeq2. Genome Biol. 15, 550. doi: 10.1186/s13059-014-0550-8
Martínez-Reyes I., Chandel N. S. (2020). Mitochondrial TCA cycle metabolites control physiology and disease. Nat. .Commun. 11, 102. doi: 10.1038/s41467-019-13668-3
Matsuzaka T., Shimano H., Yahagi N., Kato T., Atsumi A., Yamamoto T., et al. (2007). Crucial role of a long-chain fatty acid elongase, Elovl6, in obesity-induced insulin resistance. Nat. Med. 13, 1193–1202. doi: 10.1038/nm1662
Moon Y. A., Shah N. A., Mohapatra S., Warrington J. A., Horton J. D. (2001). Identification of a mammalian long chain fatty acyl elongase regulated by sterol regulatory element-binding proteins. J. Biol. Chem. 276 (48), 45358–45366. doi: 10.1074/jbc.M108413200
Moreadith R. W., Lehninger A. L. (1984). The pathways of glutamate and glutamine oxidation by tumor cell mitochondria. role of mitochondrial NAD(P)+-dependent malic enzyme. J. Biol. Chem. 259, 6215–6221. doi: 10.1016/S0021-9258(20)82128-0
NRC (2012). National research council. 2012. nutrient requirements of swine: eleventh revised edition (Washington, DC: The National Academies Press). doi: 10.17226/13298
Ohanian J., Ohanian V. (2001). Sphingolipids in mammalian cell signalling. Cell. Mol. Life Sci. 58, 2053–2068. doi: 10.1007/PL00000836
Patience J. F. (2012). “The influence of dietary energy on feed efficiency in grow-finish swine,” in Feed efficiency in swine. Ed. P. J. F.(Wageningen, The Netherlands: Wageningen Academic Publishers, Wageningen), 101–129. doi: 10.3920/978-90-8686-756-1_5
Pepperl J., Reim G., Lüthi U., Kaech A., Hausmann G., Basler K. (2013). Sphingolipid depletion impairs endocytic traffic and inhibits wingless signaling. Mech. Dev. 130 (9–10), 493–505. doi: 10.1016/j.mod.2013.04.001
Petry A. L., Huntley N. F., Bedford M. R., Patience J. F. (2020). Xylanase increased the energetic contribution of fiber and improved the oxidative status, gut barrier integrity, and growth performance of growing pigs fed insoluble corn-based fiber. J. Anim. Sci. 98. doi: 10.1093/jas/skaa233
Petry A. L., Patience J. ,. F. (2020). Xylanase supplementation in corn-based swine diets: a review with emphasis on potential mechanisms of action. J. Anim. Sci. 98. doi: 10.1093/jas/skaa318
Rao R. P., Acharya J. K. (2008). Sphingolipids and membrane biology as determined from genetic models. Prostaglandins Other Lipid Mediat. 85, 1–16. doi: 10.1016/j.prostaglandins.2007.10.002
Sassa T., Hirayama T., Kihara A. (2016). Enzyme activities of the ceramide synthases CERS2-6 are regulated by phosphorylation in the c-terminal region. J. Biol. Chem. 291 (14), 7477–7487. doi: 10.1074/jbc.M115.695858
Schutte J., De Jong J., Polziehn R., Verstegen M. (1991). Nutritional implications of d-xylose in pigs. Br. J. Nutr. 66, 83–93. doi: 10.1079/BJN19910012
Shestov A. A., Liu X., Ser Z., Cluntun A. A., Hung Y. P., Huang L., et al. (2014). Quantitative determinants of aerobic glycolysis identify flux through the enzyme GAPDH as a limiting step. Elife 3, e03342. doi: 10.7554/eLife.03342
Supek F., Bošnjak M., Škunca N., Šmuc T. (2011). Revigo summarizes and visualizes long lists of gene ontology terms. PloS One 6, e21800. doi: 10.1371/journal.pone.0021800
Uchiyama M., Oguri M., Mojumdar E. H., Gooris G. S., Bouwstra J. A. (2016). Free fatty acids chain length distribution affects the permeability of skin lipid model membranes. Biochim. Biophys. Acta - Biomembr. 1858 (9), 2050–2059. doi: 10.1016/j.bbamem.2016.06.001
Van Soest P. J., Robertson J. B. (1979). Systems of analysis for evaluating fibrous feeds. in work. stand. anal. methodol. feed. Eds. Pigden W., Balch C., Graham M. (Ottawa, Canada: The International Development Research Center), 49–60.
Wakashima T., Abe K., Kihara A. (2014). Dual functions of the trans-2-enoyl-CoA reductase TER in the sphingosine 1-phosphate metabolic pathway and in fatty acid elongation. J. Biol. Chem. 289 (36), 24736–24748. doi: 10.1074/jbc.M114.571869
Wang Y., Maeda Y., Liu Y. S., Takada Y., Ninomiya A., Hirata T., et al. (2020). Cross-talks of glycosylphosphatidylinositol biosynthesis with glycosphingolipid biosynthesis and ER-associated degradation. Nat. Commun. 11, 860. doi: 10.1038/s41467-020-14678-2
Welling P. A., Weisz O. A. (2010). Sorting it out in endosomes: an emerging concept in renal epithelial cell transport regulation. Physiology. 25 (5), 280–292. doi: 10.1152/physiol.00022.2010
Weser E., Laster L. (1968). Metabolism of d-xylose and d-xylonic acid in vivo and in vitro by the guinea pig. Biochem. Med. 2, 53–69. doi: 10.1016/0006-2944(68)90007-0
Wise M. B., Barrick E. R., Wise G. H., Osborne J. C. (1954). Effects of substituting xylose for glucose in a purified diet for pigs. J. Anim. Sci. 3, 365–374. doi: 10.2527/jas1954.132365x
Yankovskaya V., Horsefield R., Törnroth S., Luna-Chavez C., Miyoshi H., Léger C., et al. (2003). Architecture of succinate dehydrogenase and reactive oxygen species generation. Science 299 (5607), 700–704. doi: 10.1126/science.1079605
Keywords: gene expression, kidney, xylose, fiber, pigs
Citation: Huntley NF, de Souza MM, Schulte MD, Beiki H, de Lima AO, Jantzi AE, Lonergan SM, Huff-Lonergan EJ, Patience JF and Koltes JE (2023) Dietary intake of xylose impacts the transcriptome and proteome of tissues involved in xylose metabolism in swine. Front. Anim. Sci. 4:1179773. doi: 10.3389/fanim.2023.1179773
Received: 04 March 2023; Accepted: 29 May 2023;
Published: 28 June 2023.
Edited by:
Susumu Muroya, Institute of Livestock and Grassland Science (NARO), JapanReviewed by:
Gloria Solano-Aguilar, United States Department of Agriculture, United StatesAlessio Di Luca, University of Teramo, Italy
Copyright © 2023 Huntley, de Souza, Schulte, Beiki, de Lima, Jantzi, Lonergan, Huff-Lonergan, Patience and Koltes. This is an open-access article distributed under the terms of the Creative Commons Attribution License (CC BY). The use, distribution or reproduction in other forums is permitted, provided the original author(s) and the copyright owner(s) are credited and that the original publication in this journal is cited, in accordance with accepted academic practice. No use, distribution or reproduction is permitted which does not comply with these terms.
*Correspondence: James E. Koltes, amVrb2x0ZXNAaWFzdGF0ZS5lZHU=
†These authors have contributed equally to this work