 Luuk S. M. Vissers
 Coen P. A. van Wagenberg
 Willy H. M. Baltussen
- Department Chain & Market, Wageningen Economic Research, Wageningen, Netherlands
The production of food from animals poses societal concern about the welfare of these animals in Western countries and increasingly also in economically developing countries. Animals and people may experience disutility from animal suffering, which can be seen as an external cost that is not (fully) included in the cost of production. Thus, consumers will consume too much of the good from an aggregate utilitarian perspective. A potential way to solve this issue is by including these external costs in the production costs. The aim of this paper was to provide a method that can be used to estimate the external costs of animal welfare (AW) of animals kept at farm level. The external costs were calculated by means of a cost function. This cost function shows the relationship between the AW score and costs of AW measures at farm level. The AW scores were calculated from principle scores of the Welfare Quality® Protocol. The method was applied to three case studies, namely dairy cattle production in Germany, pig production in the Netherlands, and broiler production in the Netherlands. The results indicate that the external costs of AW of dairy cattle systems ranged from 0.02 to 0.10 euro/kg milk, those of pig production systems from 1.00 to 1.36 euro/kg live weight and those of broiler production systems from 3.67 to 4.52 euro/kg live weight. The empirical application showed that the method was effective in estimating external animal costs. The insights obtained from the application of our method can support decision making in the development and adoption of more AW friendly production systems.
1 Introduction
In past decades, there has been increasing societal concern about the welfare of farmed animals, particularly in Western countries such as in Europe. According to the latest Eurobarometer (2016) on animal welfare (AW), around 94% of European citizens find it important to protect the welfare of farmed animals, and 82% believe that welfare of farmed animals should be better protected than it is now. To address such societal concerns about AW, public and private initiatives have been introduced in the European Union. In 1998, the European Commission (EC) implemented Council Directive 98/58/EC, which sets welfare standards for all farmed animals. There are specific Council Directives that cover individual animal categories such as calves (2008/119/EC), pigs (2008/120/EC), laying hens (1999/74/EC) and chickens kept for meat production (2007/43/EC). In various European countries, AW labelling schemes have been introduced by the private sector, such as Better Life in Netherlands, Initative Tierwohl in Germany and RSPCA assured in the United Kingdom. These initiatives show that AW is an important topic in Western societies. Studies show that citizens are also becoming increasingly aware and sensitive to AW issues in economically developing countries such as China (Lu et al., 2013; Parlasca et al., 2023).
When the level of AW drops below a certain standard, the keeping of animals for food production creates a negative externality: animal suffering (Lusk and Norwood, 2011). Animals and people may experience disutility from animal suffering, which can be seen as an external cost. As these external costs are not fully included in the cost of production, consumers will consume too much of the good from an aggregate utilitarian perspective (Lusk and Norwood, 2011). A potential way to solve this issue is by including these external costs in the production costs. In recent years, various methods have been developed to calculate the external costs of food products, such as those by True Cost Initiative (2022) and Galgani et al. (2021). These methods consider environmental and social aspects such as child labor and excessive working hours, but do not include AW. To the best of our knowledge, a method is currently lacking that can be used to estimate the external costs of AW of animals kept at farm level. Our paper aims to provide such a method that can be applied to animal production systems (conventional as well as more extensive systems) in all livestock sectors. We applied our developed method to three case studies, dairy cattle production in Germany, pig production in the Netherlands, and broiler production in the Netherlands.
2 Materials and equipment
In our method to calculate the external costs of AW at farm or production system level, two datasets are needed: 1) AW score, and 2) costs of AW measures.
2.1 AW score dataset
The first dataset contains data about the level of AW score of farms with different levels of AW and is based on the welfare principle scores of the Welfare Quality® Protocol (WQ protocol) as a measuring standard. Lacking a ‘gold standard’, the WQ protocol is considered as the most extensive protocol to assess AW (Van Eerdenburg et al., 2021). Here, we provide a short summary description of the WQ Protocol. For a full description, we refer to the Welfare Quality® Protocol (2009). The WQ protocol is developed for key production animals, namely cattle, pigs, broilers and laying hens. For some animals, only the producing period is considered in the protocol (e.g. dairy), whereas for other animals also the rearing period, transport and slaughter of the animal is considered (e.g. broilers). The WQ protocol uses predominantly animal-based measures, which are measures taken on animals themselves. Examples include measures on the presence and severity of lesions or death rates. It uses resource-based measures when animal-based measures are not applicable or not reliable enough for a welfare criterion. Resource-based measures are measures on the physical environment and resources available to the animal such as space allowance and housing facilities. Animal-based measures are preferred over resource-based measures because the link between specific resource-based measures and an animal’s welfare status is not always clearly understood (Blokhuis, 2008). The drawback of animal-based measures is that they require flock visits that are time consuming, costly and not routinely applied in commercial practice (De Jong et al., 2022). The values obtained for different measures as measured on a farm are used to assign the farm to a specific welfare category. In the WQ Protocol, four welfare categories are distinguished:
● Not classified: the welfare of animals is low and considered unacceptable.
● Acceptable: the welfare of animals is above or meets minimal requirements.
● Enhanced: the welfare of animals is good.
● Excellent: the welfare of the animals is of the highest level.
A farm is assigned to a qualitative welfare category based on quantitative scores on four welfare principles, namely good feeding, good housing, good health, and appropriate behavior (Table 1), according to formulas described in Welfare Quality® Protocol (2009). Each welfare principle score is expressed on a 0 to 100 scale, where 100 corresponds to the best situation one can find in a farm. In the Welfare Quality® Protocol (2009), thresholds are set on welfare principle scores for a farm to be assigned to a certain welfare category. For instance, the welfare category ‘excellent’ is achieved when the farm scores at least 55 on each of the four welfare principles and at least 80 on two or more of them (Welfare Quality® Protocol, 2009). The value of each welfare principle is calculated based on the value of two to four underlying welfare criteria, which each are calculated based on the values of one or more underlying quantitative animal-based welfare measures, in total 30, according to formulas described in Welfare Quality® Protocol (2009).
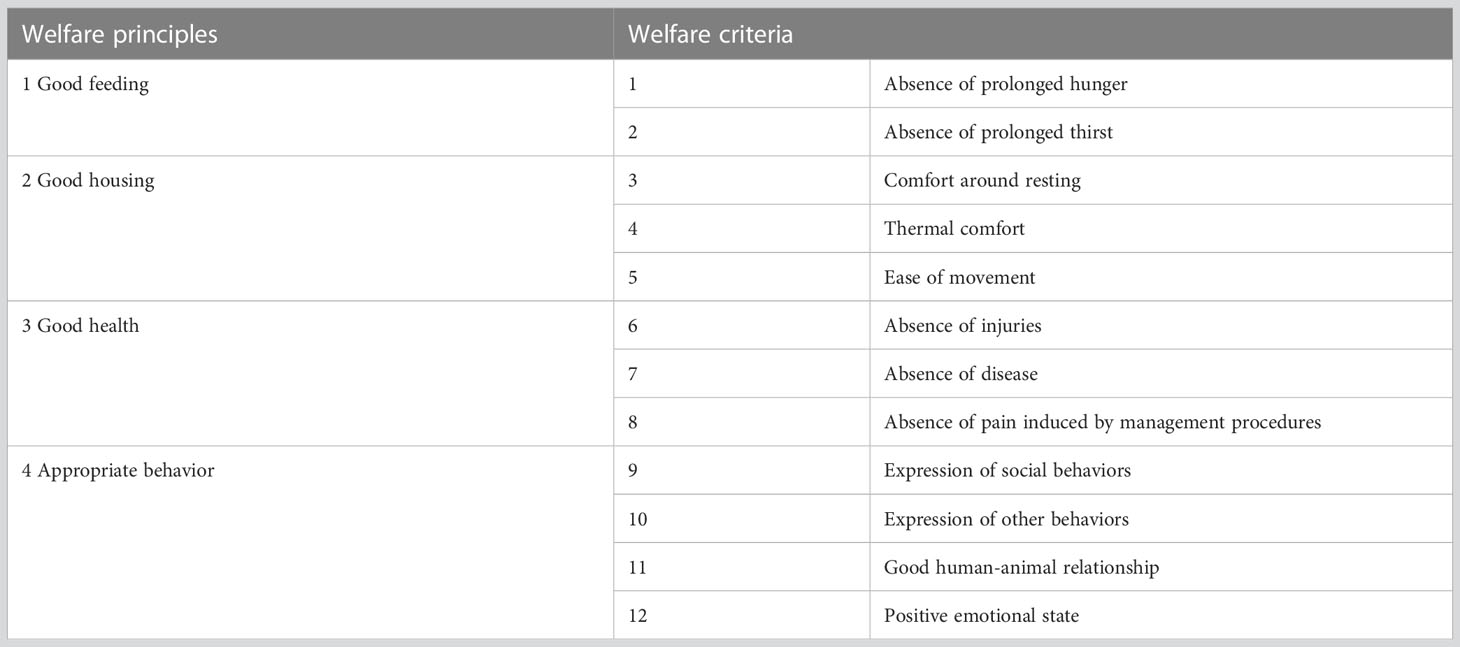
Table 1 Welfare principles and criteria in the WQ protocol.
2.2 Costs of AW measures data
The second dataset contains data about the farm level costs of AW measures applied in production at different levels of AW and the potential economic benefits of improved AW. To calculate the external costs arising from environmental impacts, the damage costs and abatement costs approach are the most commonly adopted ones (Antheaume, 2004; Sundqvist et al., 2004; De Bruyn et al., 2018). Damage costs are the direct costs associated with the damage and abatement costs are the costs associated with controlling or mitigating the damage (Sundqvist et al., 2004). In the context of AW, damage costs are the costs needed to compensate the party that is affected by the damage, in our case animals. Abatement costs are costs of measures needed to prevent that the damage occurs. We applied abatement costs and not damage costs, because it is not possible to determine the financial level that an animal deems as sufficient compensation. Prevention of re-occurrence of AW problems is possible by improving farm management or the environment of the animals to a level where AW issues are minimized (Bessei, 2006; Von Keyserlingk et al., 2009). The abatement costs reflect the increase in costs at farm level needed to satisfy with this level. In others words, the abatement costs are the costs associated with a set of measures required to achieve this level of AW. Therefore, the second dataset contains data about the farm level costs of AW measures. A higher level of AW might also result in benefits through reduced costs due to improved productivity and animal health. Such benefits should be included in the dataset as negative costs of AW measures. The benefits of an AW measure are very likely to be lower than the costs, because otherwise all animal farmers would have implemented the AW measure already. When data on costs and benefits of AW measures is not available, the production costs of farms with different levels of AW can be used as a proxy. In this last case, the differences in production costs between a farm with a lower and higher level of AW should be corrected for differences in costs resulting from other differences between the farms, for example in costs of environmental measures. In this case, both costs and benefits of AW measures are included in the data. This dataset can be built using different resources, for example production costs retrieved from farm financial records, data gathered for statistical purposes (for example, data from the Farm Accountancy Data Network in the EU), and literature that calculated average production costs of specific production systems (e.g., conventional or organic).
3 Method
Our method consists of the following 7 steps, which we discuss below:
1. Collect AW score data and costs of AW measures data
2. Set compensation thresholds’ value
3. Calculate corrected welfare principle scores
4. Calculate AW score on farm level
5. Set excellence AW threshold value
6. Generate cost function
7. Calculate external costs for AW
3.1 Step 1: Collect AW score data and costs of AW measures data
In step 1, data is gathered about 1) the AW score on the welfare principles of the WQ Protocol and 2) the costs of AW measures on farms of a particular animal species and at least two different production systems with different levels of AW scores (e.g., conventional and organic). The welfare principle scores are used in our method rather than the welfare categories of the WQ protocol, because welfare principle scores are on an interval scale and welfare categories only on an ordinal scale. Our method requires scores on an interval scale to estimate quantitative differences in AW score between farms with different levels of AW. AW data can be gathered by visiting farms and assessing the animals on the farm using the WQ Protocol. AW score data should be collected for each of the four welfare principles. We define as the score on welfare principle (1 = good feeding, 2 = good housing, 3 = good health, 4 = appropriate behavior) of a farm n (n = 1, …, N) with production system x (x = 1,., X). Actual costs of AW measures can be gathered on these farms as well based on accounting data. We define CAWMn,x as the costs of AW measures of farm n with production system x. Potential benefits of these AW measures through lower costs, defined as BAWMn,x, can also be gathered on these farms for example by analyzing the difference between the situation before and after implementation of an AW measure. The costs of AW measures of farm n with production system x, defined as Cn,x, can then be calculated as:
Alternatively, secondary data can be obtained from studies that applied WQ Protocol on farms of interest and/or provided their costs and benefits of AW measures, or production costs. Note that both costs and benefits of AW measures are included using production costs corrected for other differences between farms. Thus, Cn,x is directly estimated.
All principle scores are required in our method. Some studies that applied the WQ Protocol did not consider all four welfare principles. For instance, Gocsik et al. (2016) did not consider good feeding because they did not expect large differences between the broiler production systems in the Netherlands since all farmers are required to give access to feed and water constantly due to regulation, irrespective of the system type (Dutch Ministry of Agriculture Nature and Food Quality, 2022). If data is lacking for one or more principles, expert estimation should be used to estimate the welfare measures underlying these principles, for example, based on resource-based measures (e.g. number of drinking nipples per meter) or animal-based measures of comparable systems.
3.2 Step 2: Set compensation thresholds’ value
In step 2, thresholds are set with minimum requirements for when compensation between the welfare principles is allowed, similarly to the WQ Protocol. According to the WQ Protocol, higher scores on certain welfare principles can compensate lower scores on other welfare principles if the scores on the welfare principles are above certain thresholds. For example, scores on all four welfare principles need to be at least 55 for a farm to be assigned the welfare category ‘excellent’, and then only if the scores on at least two principles are 80 or higher (Welfare Quality® Protocol, 2009). However, no compensation is possible if the score on at least one welfare principle is below a certain threshold. For example, a score of 56 for good health cannot compensate a score of 54 for good housing to achieve the welfare category ‘excellent’.
In our method a minimum score threshold is set for a minimum score of each welfare principle. If the score on two or more welfare principle scores are below this threshold , no compensation is possible. Note, that we allow for one welfare principle score to be below this threshold . If compensation is allowed, we maximize the compensation between the principles in our method by setting a maximum compensation threshold for the maximum difference in points between welfare principles. If the difference in points between two welfare principle scores is more than points, the highest score is reduced to the lowest score plus points.
We suggest to use a minimum score threshold value of = 20 points, which is in accordance with the welfare category ‘acceptable’, and a maximum compensation threshold value of = 35 points, based on the difference between the thresholds of the welfare categories ‘acceptable’ (20 points) and ‘enhanced’ (55 points).
3.3 Step 3: Calculate corrected welfare principle scores
In step 3, corrected welfare principle scores are calculated based on the welfare principle scores collected in step 1 and the compensation thresholds and set in step 2 (equation 2 – 5). First, the four welfare principle scores for each farm n in each production system x are ranked from low to high with welfare principle j having the lowest score and m the highest (equation 2). If the welfare principle score of the second lowest welfare principle k is less than , then the corrected welfare principle score of all four welfare principles is equal to the lowest welfare principle score of welfare principle j (equation 3). Hence, no compensation between welfare principle scores is possible. If is at least , some compensation between welfare principles is allowed. If the difference between a welfare principle score and the lowest welfare principle score is larger than , the corrected welfare principle score is equal to the lowest welfare principle score plus points (equation 4). If this difference is smaller than , the corrected welfare principle score is equal to the original welfare principle score (equation 5).
3.4 Step 4: Calculate AW score on farm level
In step 4, the AW score on a farm n with production system x is calculated as the sum of corrected welfare principle scores on welfare principle i (equation 6):
3.5 Step 5: Set excellence AW threshold value
In step 5, an excellence AW threshold is set that reflects the level of AW at which the animals only suffer minimal welfare infringements. The value of is such that it is assumed that the external AW costs of a farm are zero when it has an AW score equal to or higher than (Figure 1). In the WQ Protocol, each welfare principle score can be between 0 and 100 points, where 100 points corresponds to the best situation one can find in a farm. As the WQ protocol includes four principles, the excellence AW threshold can have a maximum value of 400.
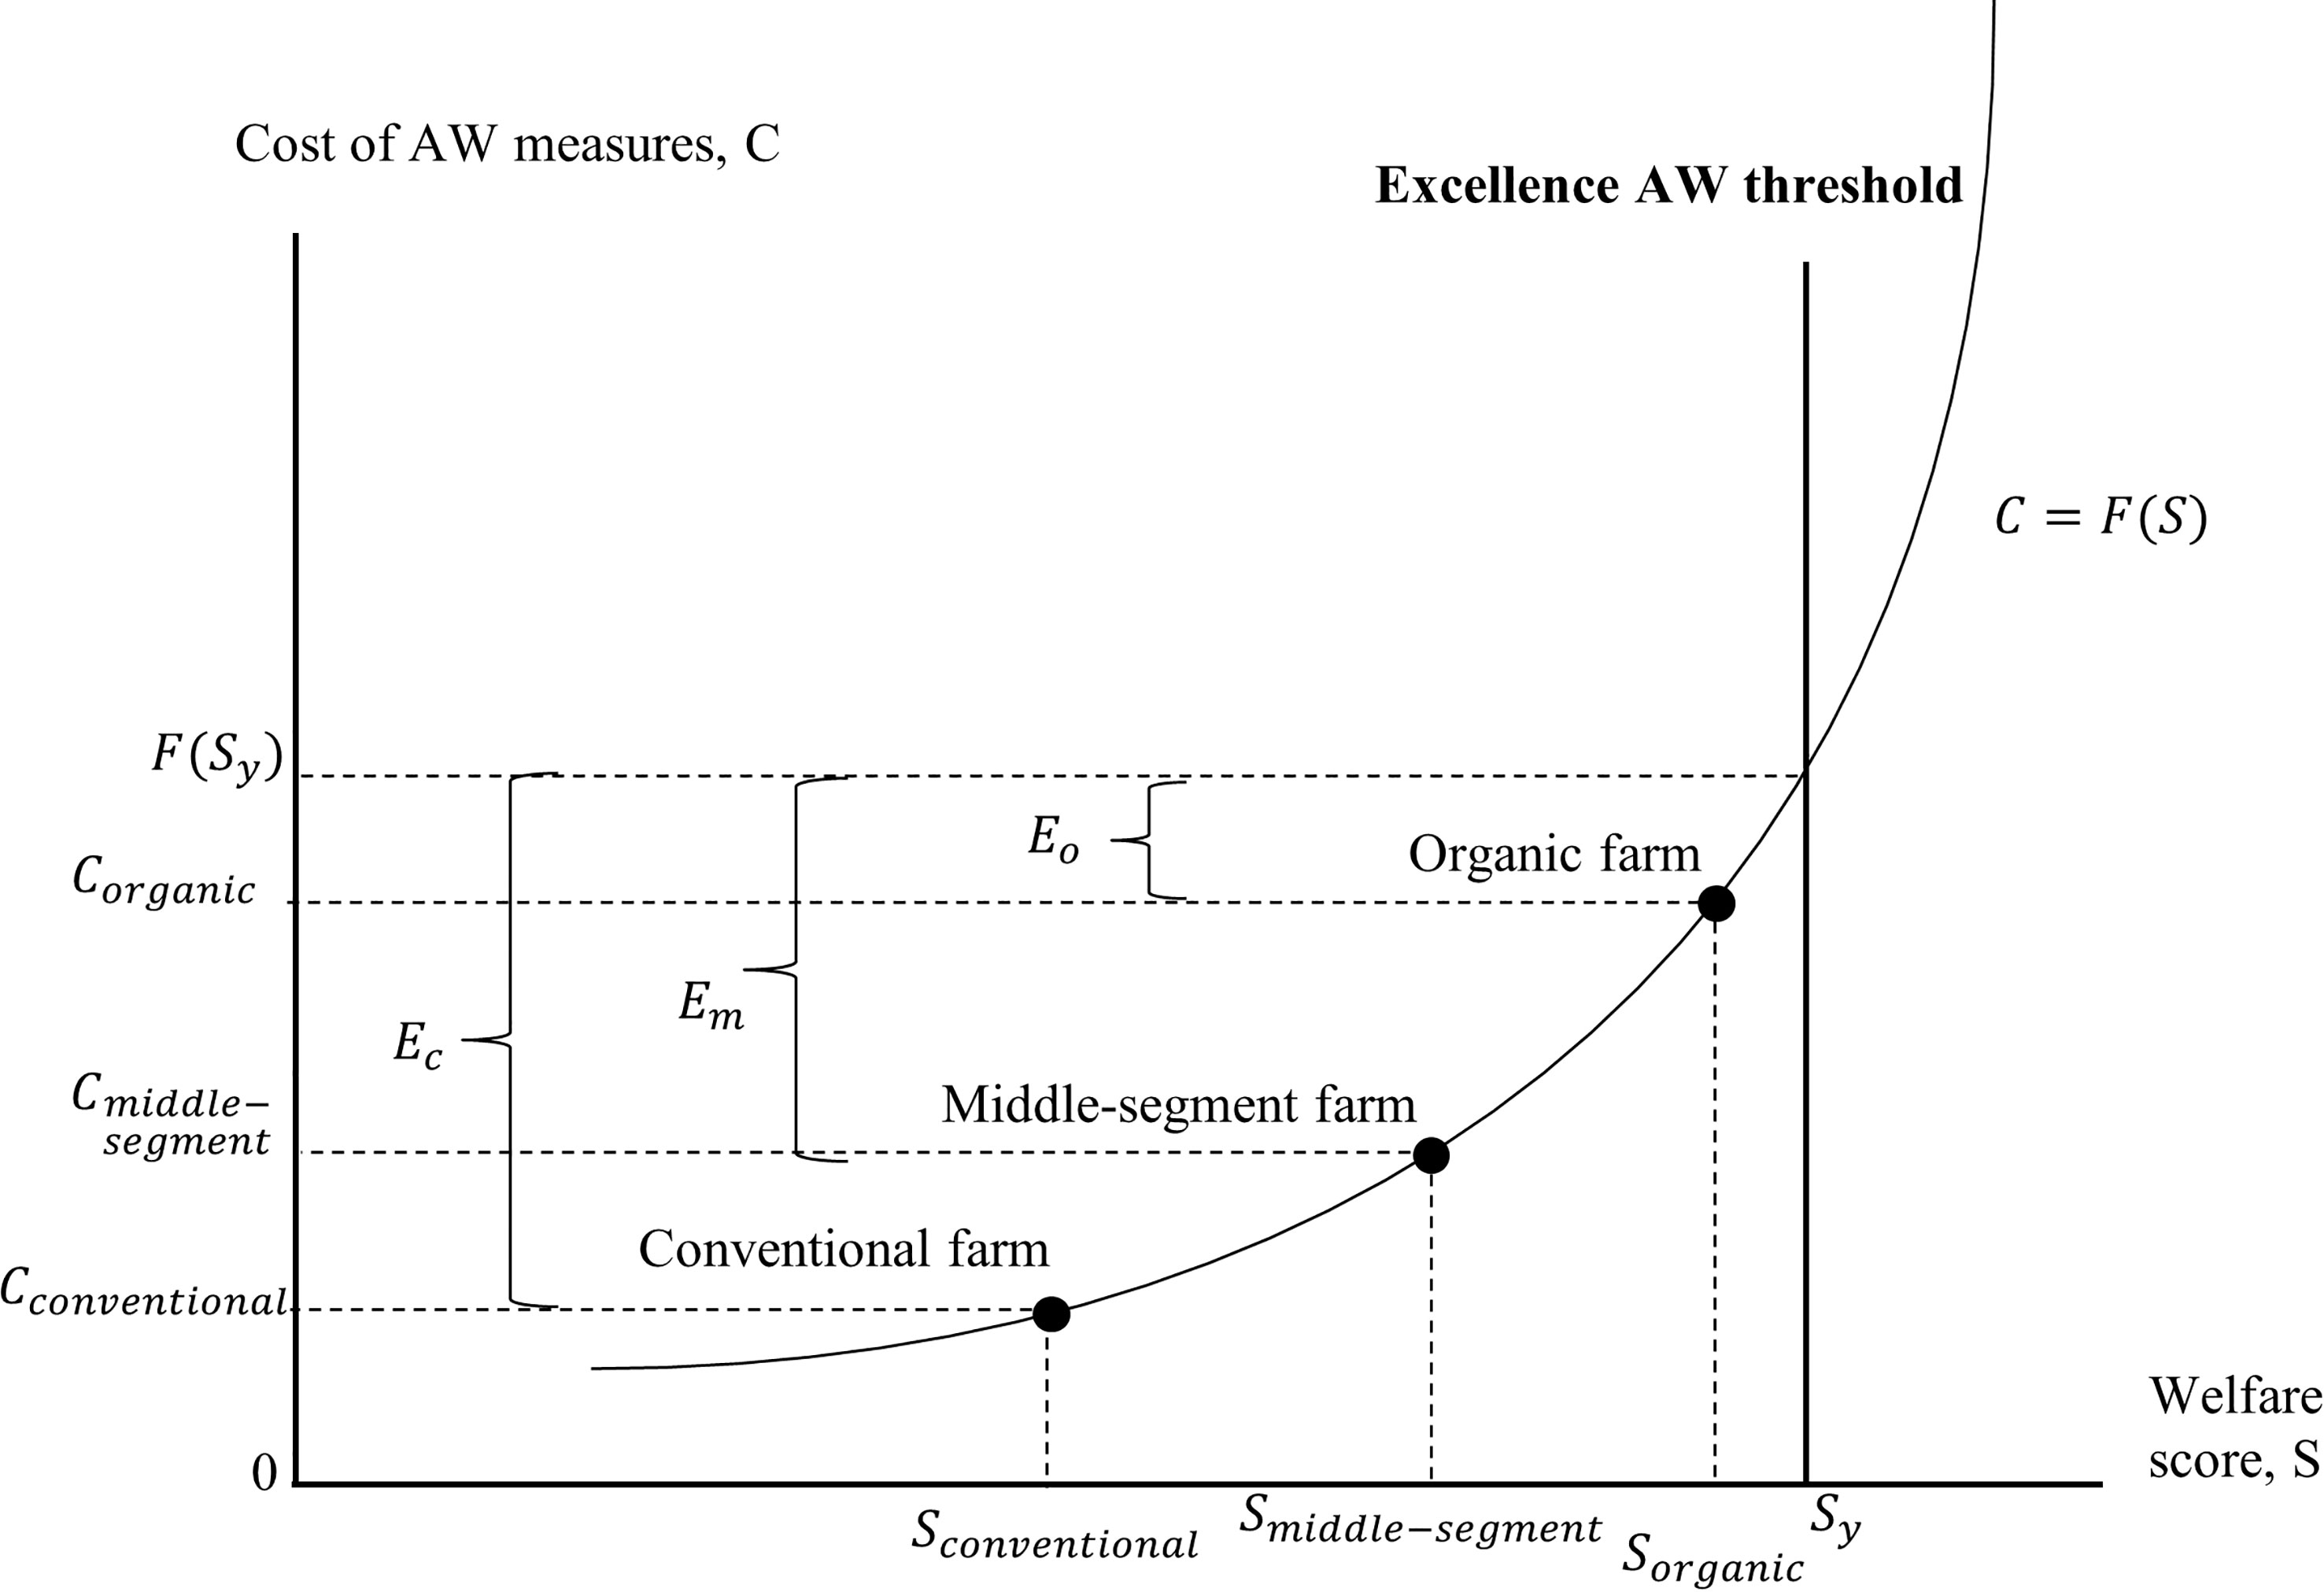
Figure 1 Illustration of the cost-function for AW and the external costs for a conventional, middle-segment and organic farm.
We argue that the excellence AW threshold should not only be based on what can be theoretically achieved, but also what can realistically be achieved in practice. Therefore, we suggest an excellence AW threshold of =270 points. This is the minimal value of the sum of the welfare principle scores for a farm to be in the welfare category ‘excellent’ in the WQ Protocol (two times 80 and two times 55).
3.6 Step 6: Generate cost function
In step 6, a cost function is generated that provides the relationship between the AW score and the costs of AW measures based on the AW scores (step 4) and costs of AW measures Cn,x (step 1) of all farms and X production systems (see equation 7).
The costs of AW measures of an excellent farm with an AW score on or beyond the excellence AW threshold (step 5) might be known, if such a farm exists. However, if such a farm does not exist, the costs of AW measures at the excellence AW threshold must be estimated by extrapolating C from the available data to the expected costs of AW measures of a hypothetical farm with AW score using regular statistical extrapolation techniques. Various tools can be applied to generate the cost function, for instance with the trendline option in Microsoft Excel (Microsoft Corporation, 2018).
Figure 1 shows the general shape of the cost function, which is expected to be convex with a positive slope. This is based on Gocsik et al. (2016) and Vissers et al. (2019), who found a positive relationship between AW improvements and costs of AW measures and that the improvement in AW from a conventional farm to a middle-segment farm is relatively cost-efficient, whereas that from a middle-segment farm to an organic farm is relatively cost-inefficient.
3.7 Step 7: Calculate external costs for AW
In step 7, the external costs of farm in production system (in euro/kg live weight, milk or eggs) are calculated as the difference between the estimated costs of AW measures at AW score and the actual costs of AW measures at AW score (equation 8). If farm has an AW score that exceeds the excellence AW threshold , the external costs are zero (equation 9). Figure 1 shows the external costs , and of a conventional, middle-segment and an organic farm, respectively.
3.8 Calculate external costs of AW for a production system
By following the seven steps of the method, the external costs AW of a farm are calculated. The same seven steps (and equations) can be applied to calculate the external costs of a production system, such as conventional or organic. For a production system, the cost function is based on average welfare principle scores and average costs of AW measures Cx of farms in that production system. The average AW score and costs of AW measures of a production system x are calculated as the unweighted average of the AW scores (equation 10) and costs of AW measures (equation 11) of the N farms in that production system. This is in line with Gocsik et al. (2016), who applied the unweighted average to calculate the average AW score and costs per production system.
If assessing production systems, secondary data about costs of AW measures can be gathered that reflects the average of farms in that production system. This can help to save on costs for data collection.
4 Results
4.1 Results case studies
We applied our developed method to three case studies with different production systems, namely the conventional and organic dairy cattle production system in Germany, the conventional, 1-star Better Life, and organic pig production system in the Netherlands, and the conventional, 1-star Better Life, 2-star Better Life and organic broiler production system in the Netherlands. Better Life is a Dutch AW scheme that uses a star rating to determine the AW level of the systems. Organic livestock production systems qualify for 3 stars (Dutch Society for the Protection of Animals, 2021). In Germany, all organic standards that are advertised with their logo on meat products of this type are assigned to level 4 of the Haltungsform (2023), which is an AW label of Initative Tierwohl that classifies different forms of animal husbandry.
4.1.1 Step 1: Collect AW data using the WQ Protocol and costs of AW measures data
In all three case studies, welfare principle scores and production costs were retrieved from secondary data because it was too time consuming and costly to gather primary data on farms with the WQ protocol. Since data about the costs of AW measures was lacking for these systems, we used the data on the production costs of these systems as a proxy. Compared to the conventional system, the 1-star and 2-star Better Life systems include only more stringent measures on AW, other requirements are similar (Dutch Society for the Protection of Animals, 2021). Therefore, comparing the production costs of these systems can be used as a proxy for comparing the costs of AW measures in these systems. The organic system includes not only more stringent measures on AW, but also on environmental externalities such as soil pollution as laid down in Regulation (EU) 2018/848 (European Commission, 2018). Therefore, the additional cost of organic compared to conventional production does not only include the costs of AW measures but also those of measures for environmental externalities. Therefore, these production costs need to be corrected. The additional costs of measures for environmental externalities in the organic system are mainly related to feed. As laid down in Regulation (EU) 834/2007, feed for organic livestock must be composed of certified organic agricultural products (European Commission, 2018). This requirement results in a higher feed price compared to the price of conventional feed. In the Dutch broiler and pig sector, most conventional and organic farmers purchase compound feed (Agrimatie, 2023). Therefore, these requirements only result in higher feed costs. To estimate the marginal costs of AW improvements, the production costs of the organic broiler and pig production systems were corrected by using the price of non-organic feed and the feed conversion rate of these livestock species (see Appendix). In the German dairy farming sector, most farmers cultivate most feed themselves (mostly roughage). Therefore, organic requirements on feed production not only affect the costs of purchased feed but also labor costs for cultivating own feed. Ippenberger and Hoffman (2022) calculated the additional costs for complying with requirements of level 4 of the Haltungsform for German dairy cattle farming, which were 0.06 to 0.09 euro/kg milk. The average of this range (0.075 euro/kg milk) was used as a proxy for the cost of AW measures in the organic dairy cattle system in Germany, resulting in estimated production costs of 0.545 euro/kg milk. Because we used the production costs, both costs and benefits of AW measures are included in these costs.
Only average welfare principle scores and average production costs were found (Table 2). For dairy cattle, the welfare principle scores were retrieved from Wagner et al. (2021) and the production costs from Büro für Agrarsoziologie und Landwirtschaft (2019). For pigs, welfare principle scores were calculated based on AW data retrieved from Hoogstra (2018). Because Hoogstra (2018) did not consider the welfare principle ‘good feeding’, expert elicitation was used to estimate the score of this welfare principle. According to Dutch legislation, farm animals need to have permanent access to feed and water (Dutch Ministry of Agriculture Nature and Food Quality, 2022). Furthermore, an expert in pig welfare in the Netherlands estimated that prolonged hunger or thirst does not occur in Dutch pig husbandry, unless there is a technical malfunction in the feeding or drinking system (personal communication H.M. Vermeer, 13 June 2022). Therefore, it was assumed that the welfare category ‘enhanced’ was achieved and a score of 55 was assigned to this principle. Production costs data were retrieved from Hoogstra (2018).
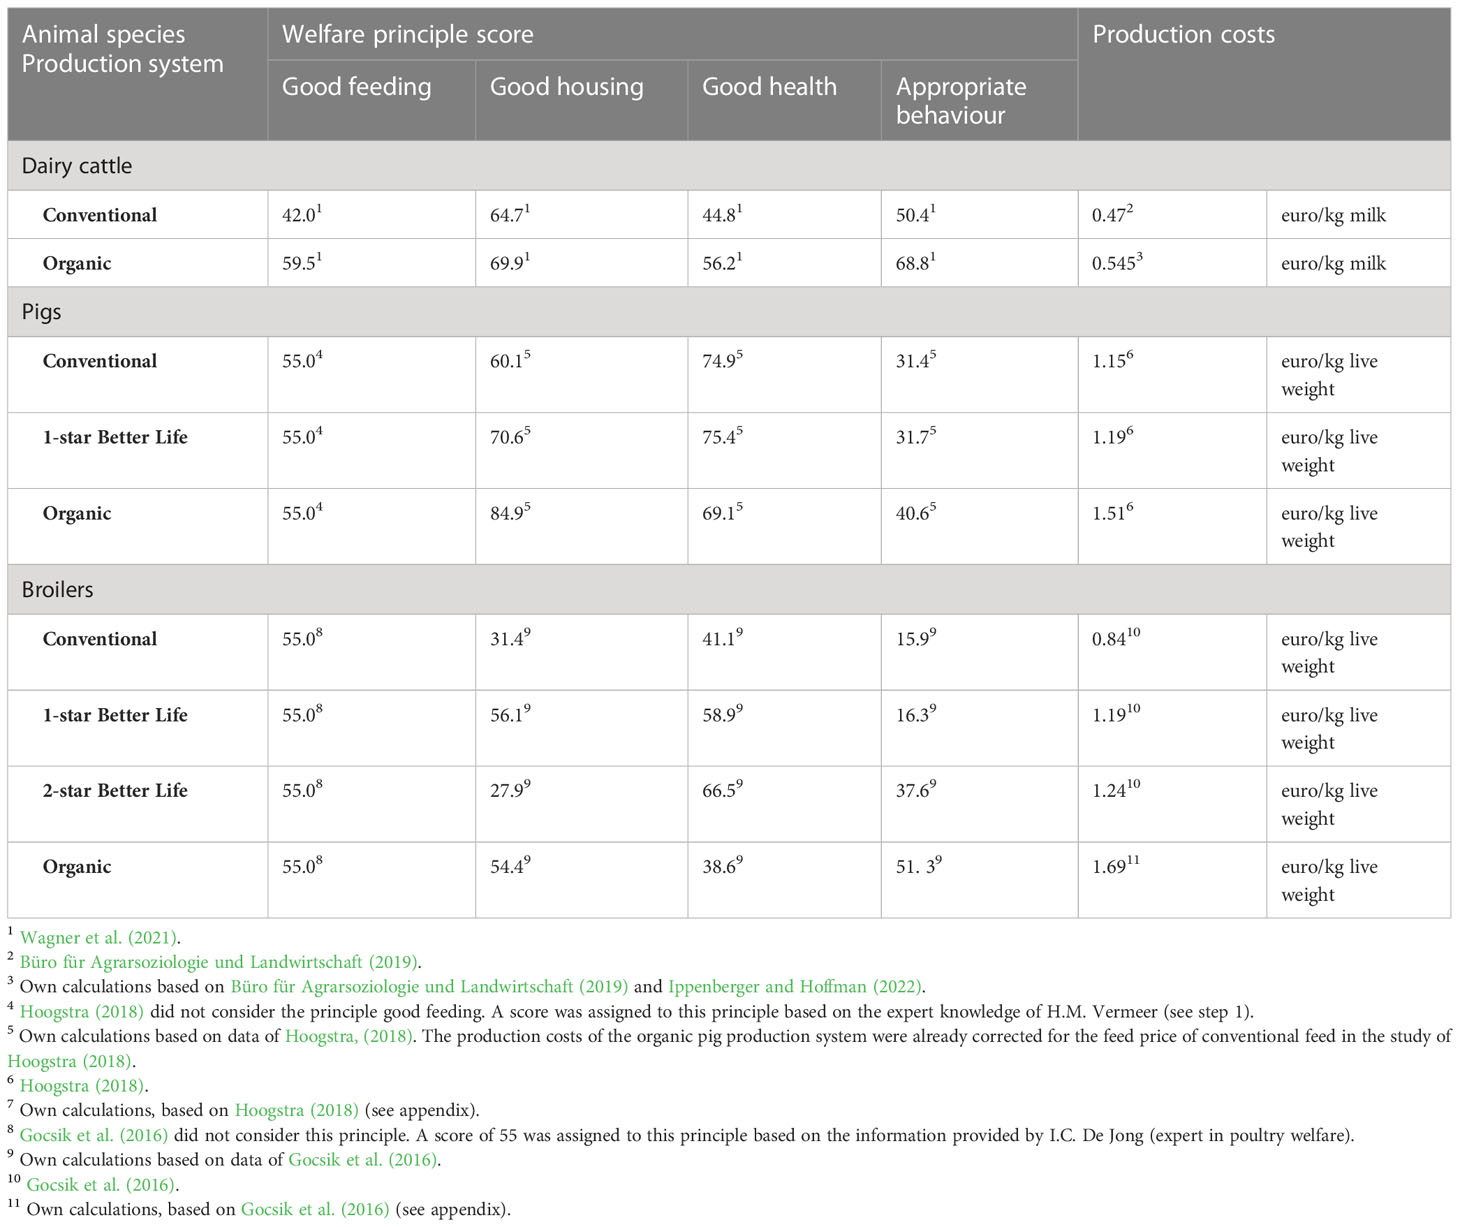
Table 2 Overview of welfare principle scores and production costs of the German conventional and organic dairy cattle farming system, the Dutch conventional, 1-star Better Life, and organic pig production system, and the Dutch conventional, 1-star Better Life, 2-star Better Life, and organic broiler production system.
For broilers, welfare principle scores were calculated based on AW data retrieved from Gocsik et al. (2016)1. Gocsik et al. (2016) did not consider the welfare principle ‘good feeding’. Broilers usually have permanent access to feed and water in the Netherlands (personal communication I.C. De Jong, 16 June 2022). Therefore, it is expected that prolonged hunger and thirst do not occur in Dutch broiler farming. It was assumed that the welfare category ‘enhanced’ was achieved and a score of 55 was assigned to this principle. Production costs data were retrieved from Gocsik et al. (2016).
4.1.2 Step 2: Set compensation thresholds’ values
We applied the suggested minimum score threshold value of = 20 points and a maximum compensation threshold of = 35 points in our case studies.
4.1.3 Step 3: Calculate corrected scores for each welfare principle
4.1.3.1 Dairy cattle
Table 2 shows that for both systems all welfare principle scores were higher than 20 and the difference between the lowest and highest welfare principle score was less than 35. Therefore, the corrected welfare principle scores have the same value as the welfare principle scores.
4.1.3.2 Pigs
For each of the three systems, the lowest welfare principle score was higher than 20 but the difference between the lowest and highest welfare principle score was more than 35 points (Table 2). Therefore, the highest welfare principle scores need to be corrected. For instance, the welfare principle score for good health in the conventional pig production system was corrected to = 31.4 + 35 = 66.4 and in the 1-star Better Life system to = 31.7 + 35 = 66.7. Table 3 provides an overview of the corrected welfare principle scores.
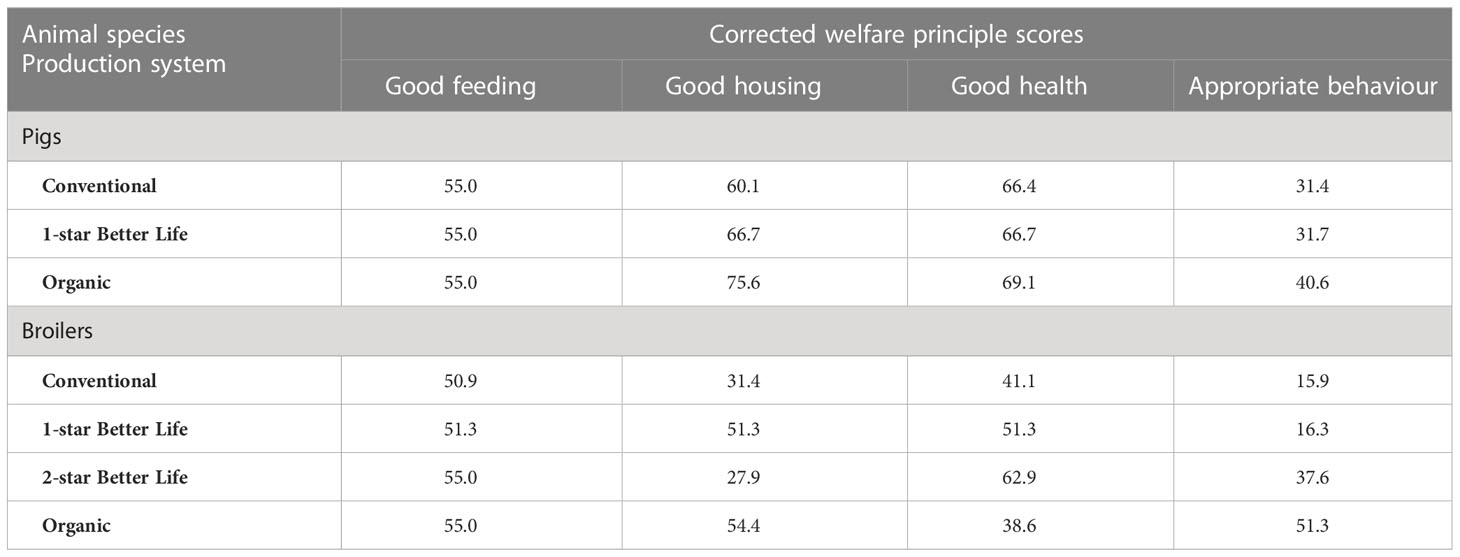
Table 3 Overview of corrected welfare principle scores of the Dutch conventional, 1-star Better Life, and organic pig production system and the Dutch conventional, 1-star Better Life, 2-star Better Life, and organic broiler production system.
4.1.3.3 Broilers
Table 2 shows that in the conventional and 1-star Better Life system, only one of the welfare principle scores was lower than 20, i.e. that for appropriate behavior (15.9). Therefore, no correction is needed based on the minimum compensation threshold. However, the difference between the lowest and highest welfare principle score was more than 35 for some welfare principles (e.g., between good housing and appropriate behaviour in 1-star Better Life system). Therefore, the highest welfare principle scores were corrected, for example the welfare principle score for good housing in the 1-star Better Life broilers production system = 16.3 + 35 = 51.3. Table 3 provides the corrected welfare principle scores of all systems.
4.1.4 Step 4: Calculate AW score on farm level
For all case studies, the corrected welfare principle scores were summed to obtain the welfare scores of the systems (Table 4). For example, the welfare score of the German dairy conventional system Sc was calculated as = 42.0 + 64.7 + 44.8 + 50.4 = 201.9.
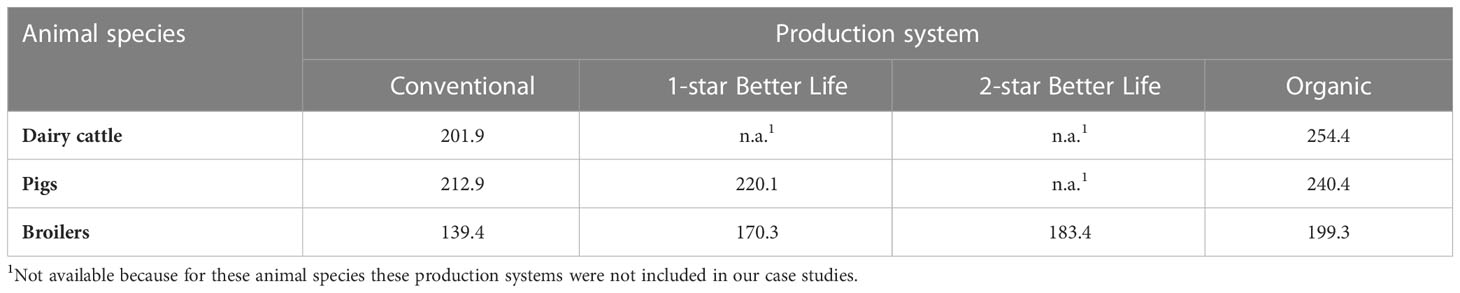
Table 4 Overview of animal welfare scores of the German conventional and organic dairy cattle farming system, the Dutch conventional, 1-star Better Life, and organic pig production system, and the Dutch conventional, 1-star Better Life, 2-star Better Life, and organic broiler production system.
4.1.5 Step 5: Set excellence AW threshold value
We follow the suggestion in the method section and set the excellence AW threshold at 270 points.
4.1.6 Step 6: Generate cost function
4.1.6.1 Dairy cattle
The cost function for the German dairy cattle production systems is shown in Figure 2. This function was estimated with the trendline option in Microsoft Excel (Microsoft Corporation, 2018). The cost function is linear as only two systems, the conventional and organic system, are considered in this example.
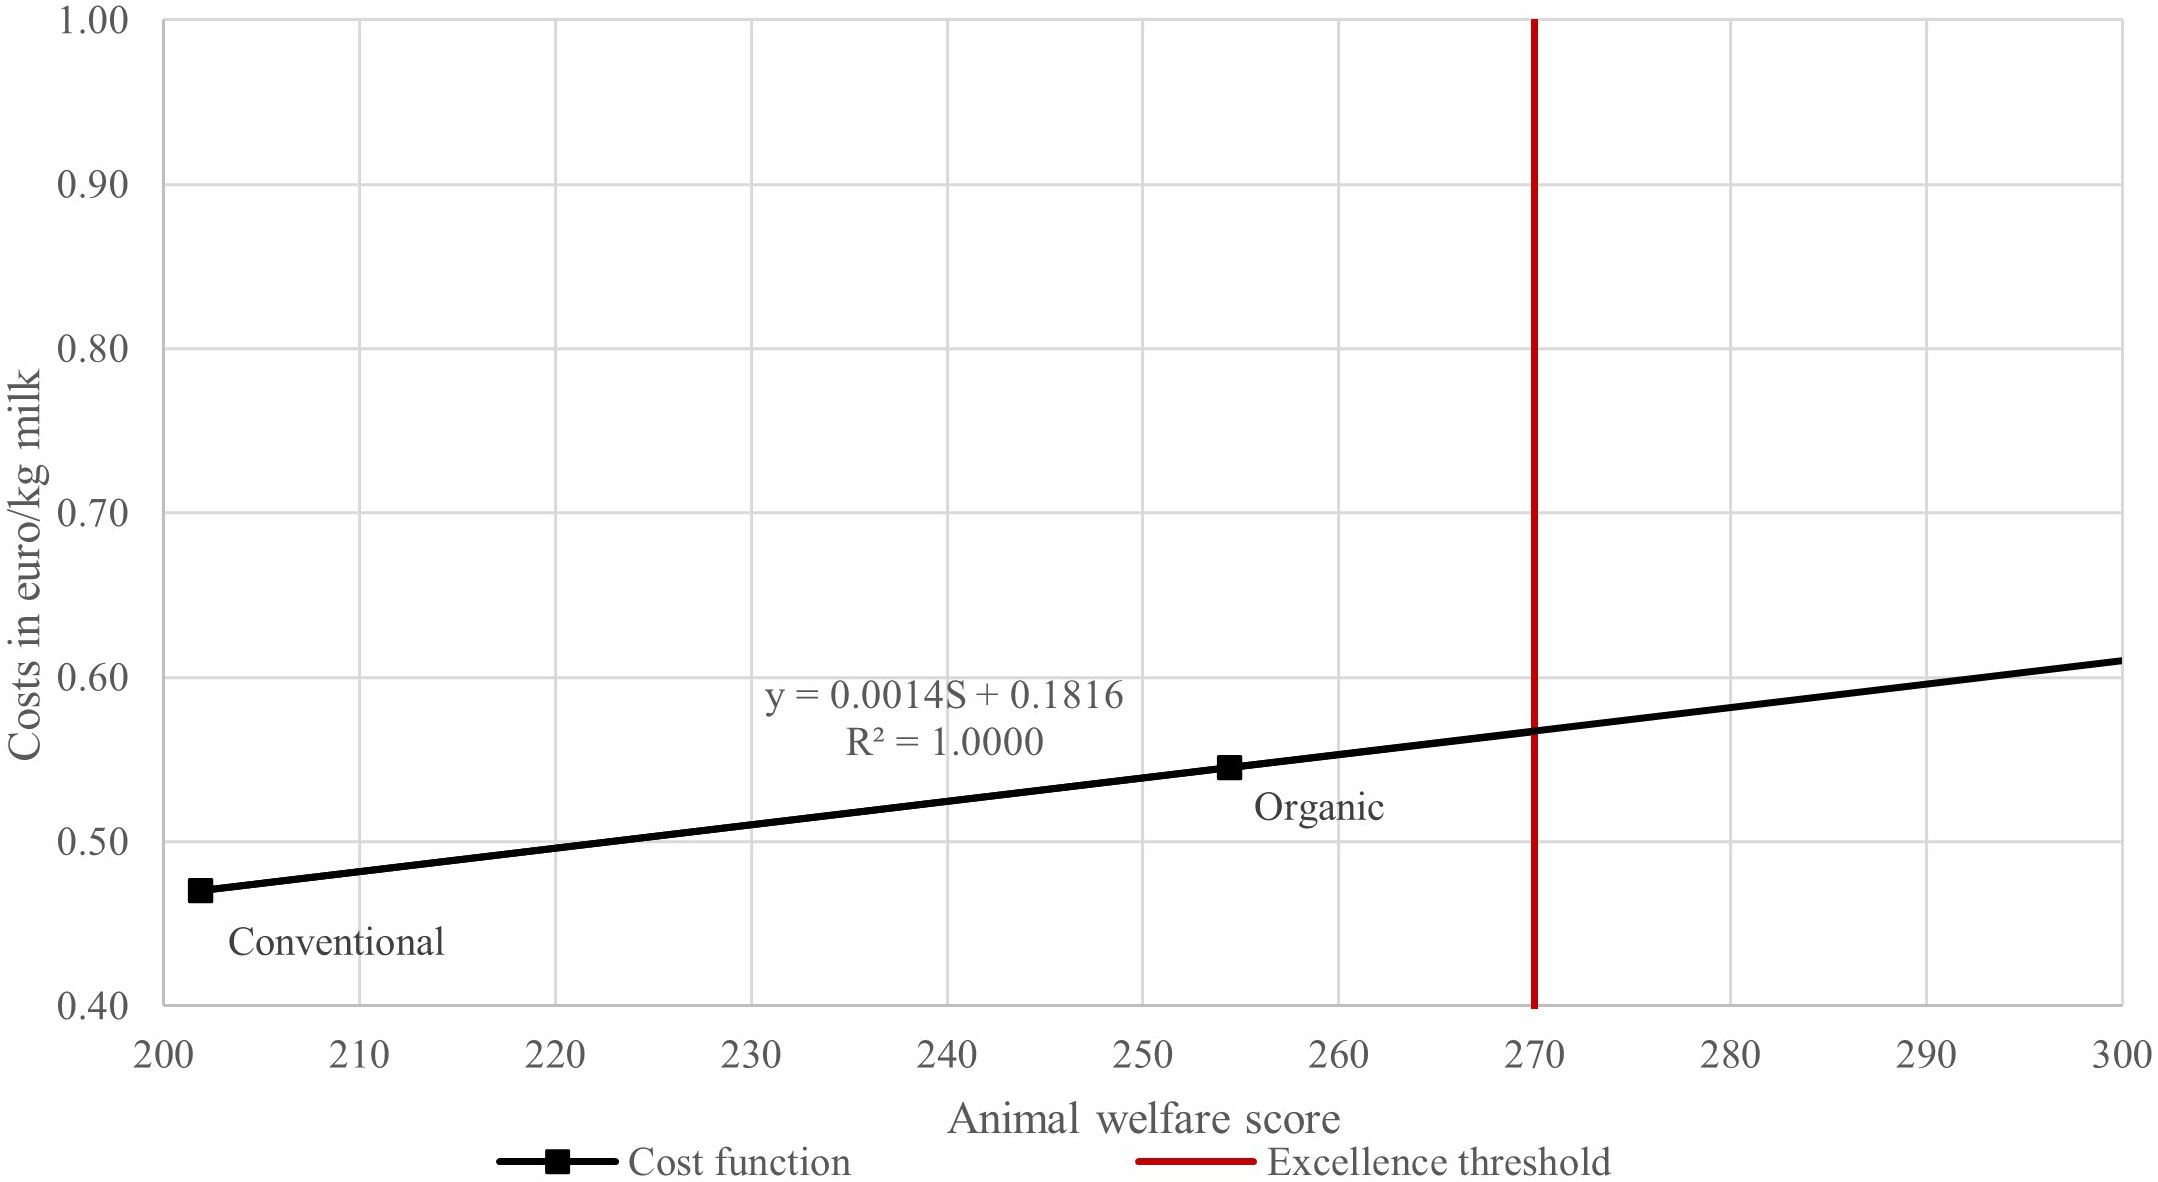
Figure 2 Cost function for the German dairy cattle production systems.
4.1.6.2 Pigs
The cost function for the Dutch pig production systems was estimated with the trendline option in Microsoft Excel (Microsoft Corporation, 2018). This function was defined as a polynomial function (order 2), as this function had the highest R2 (see Figure 3).
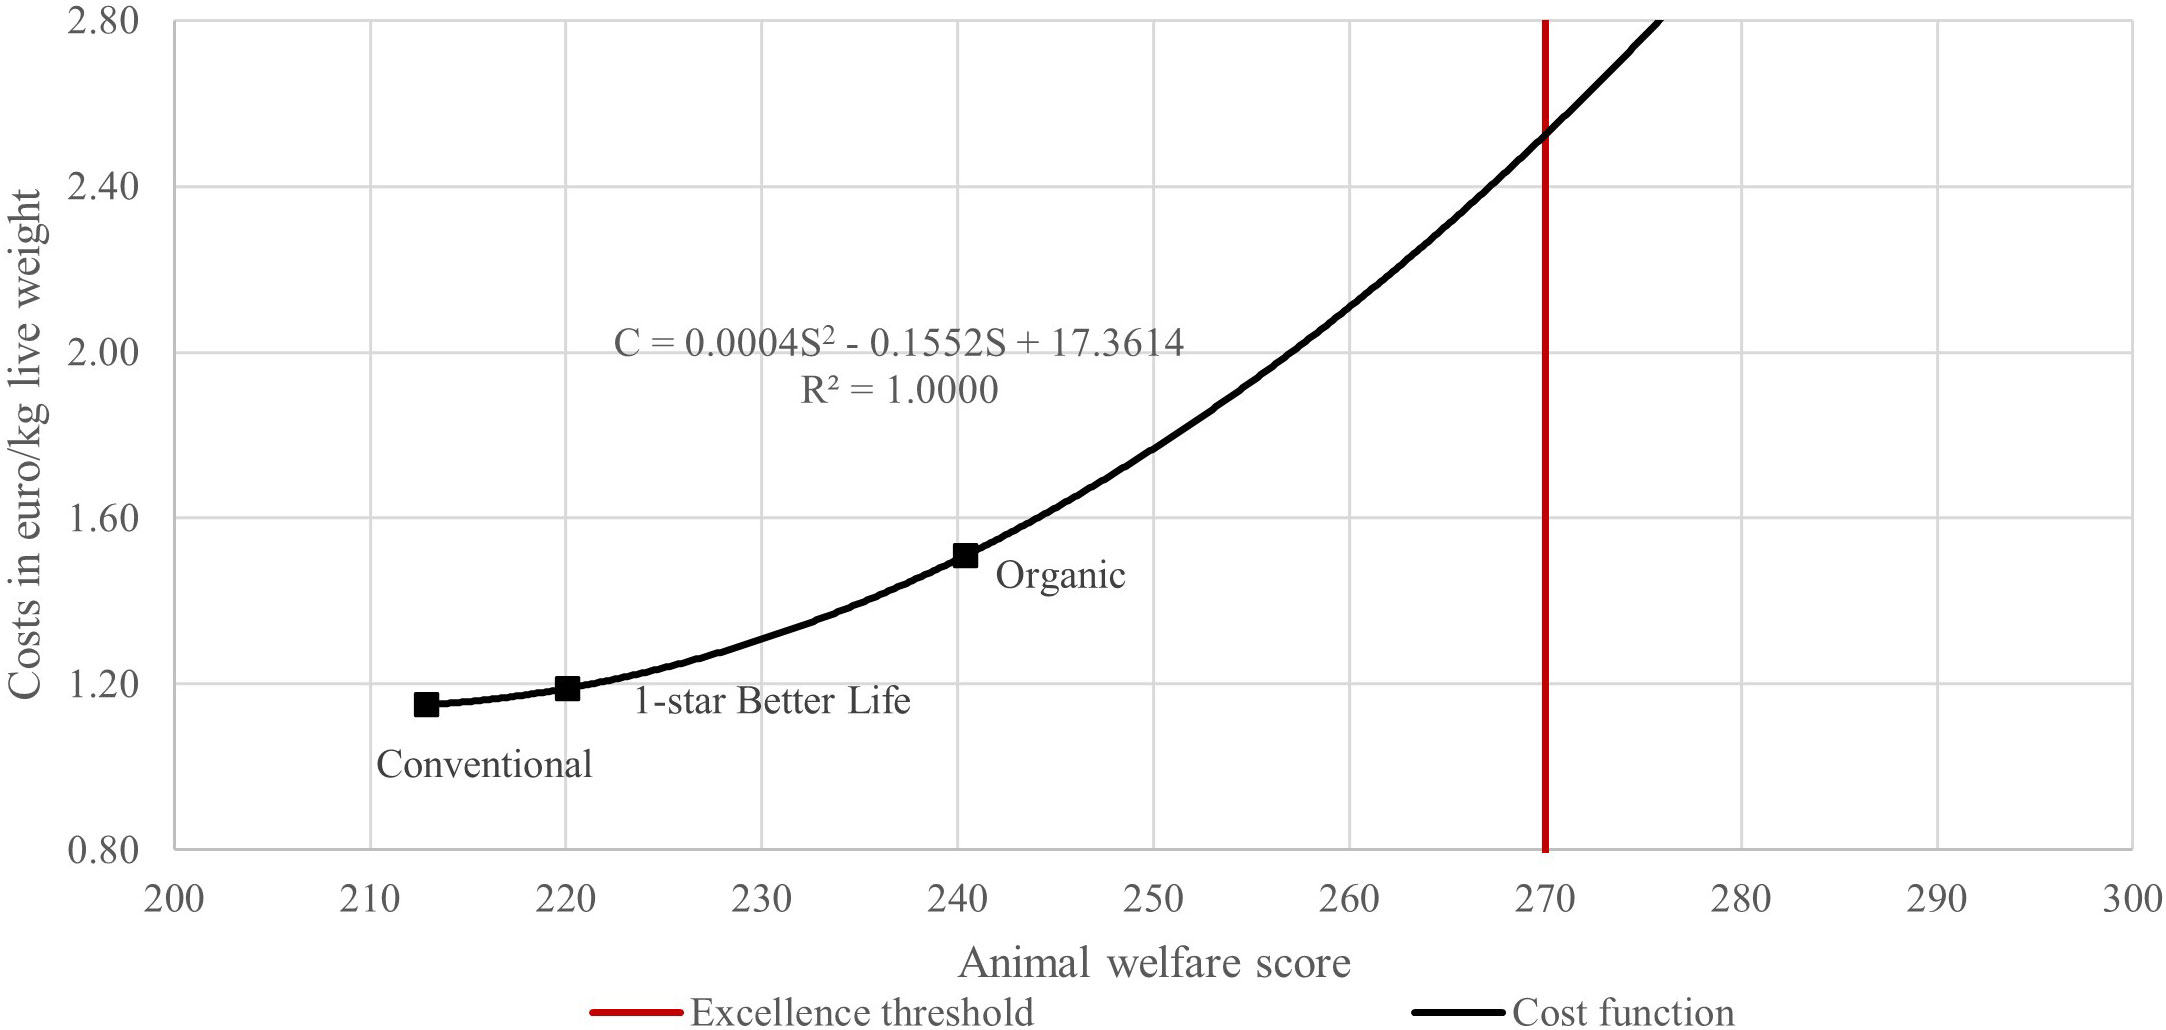
Figure 3 Cost function for the Dutch pig production systems.
4.1.6.3 Broilers
Figure 4 shows the cost function for the Dutch broiler production systems, which was estimated with the trendline option in Microsoft Excel (Microsoft Corporation, 2018). The cost function was defined as a polynomial function (order 2) as this function had the highest R2.
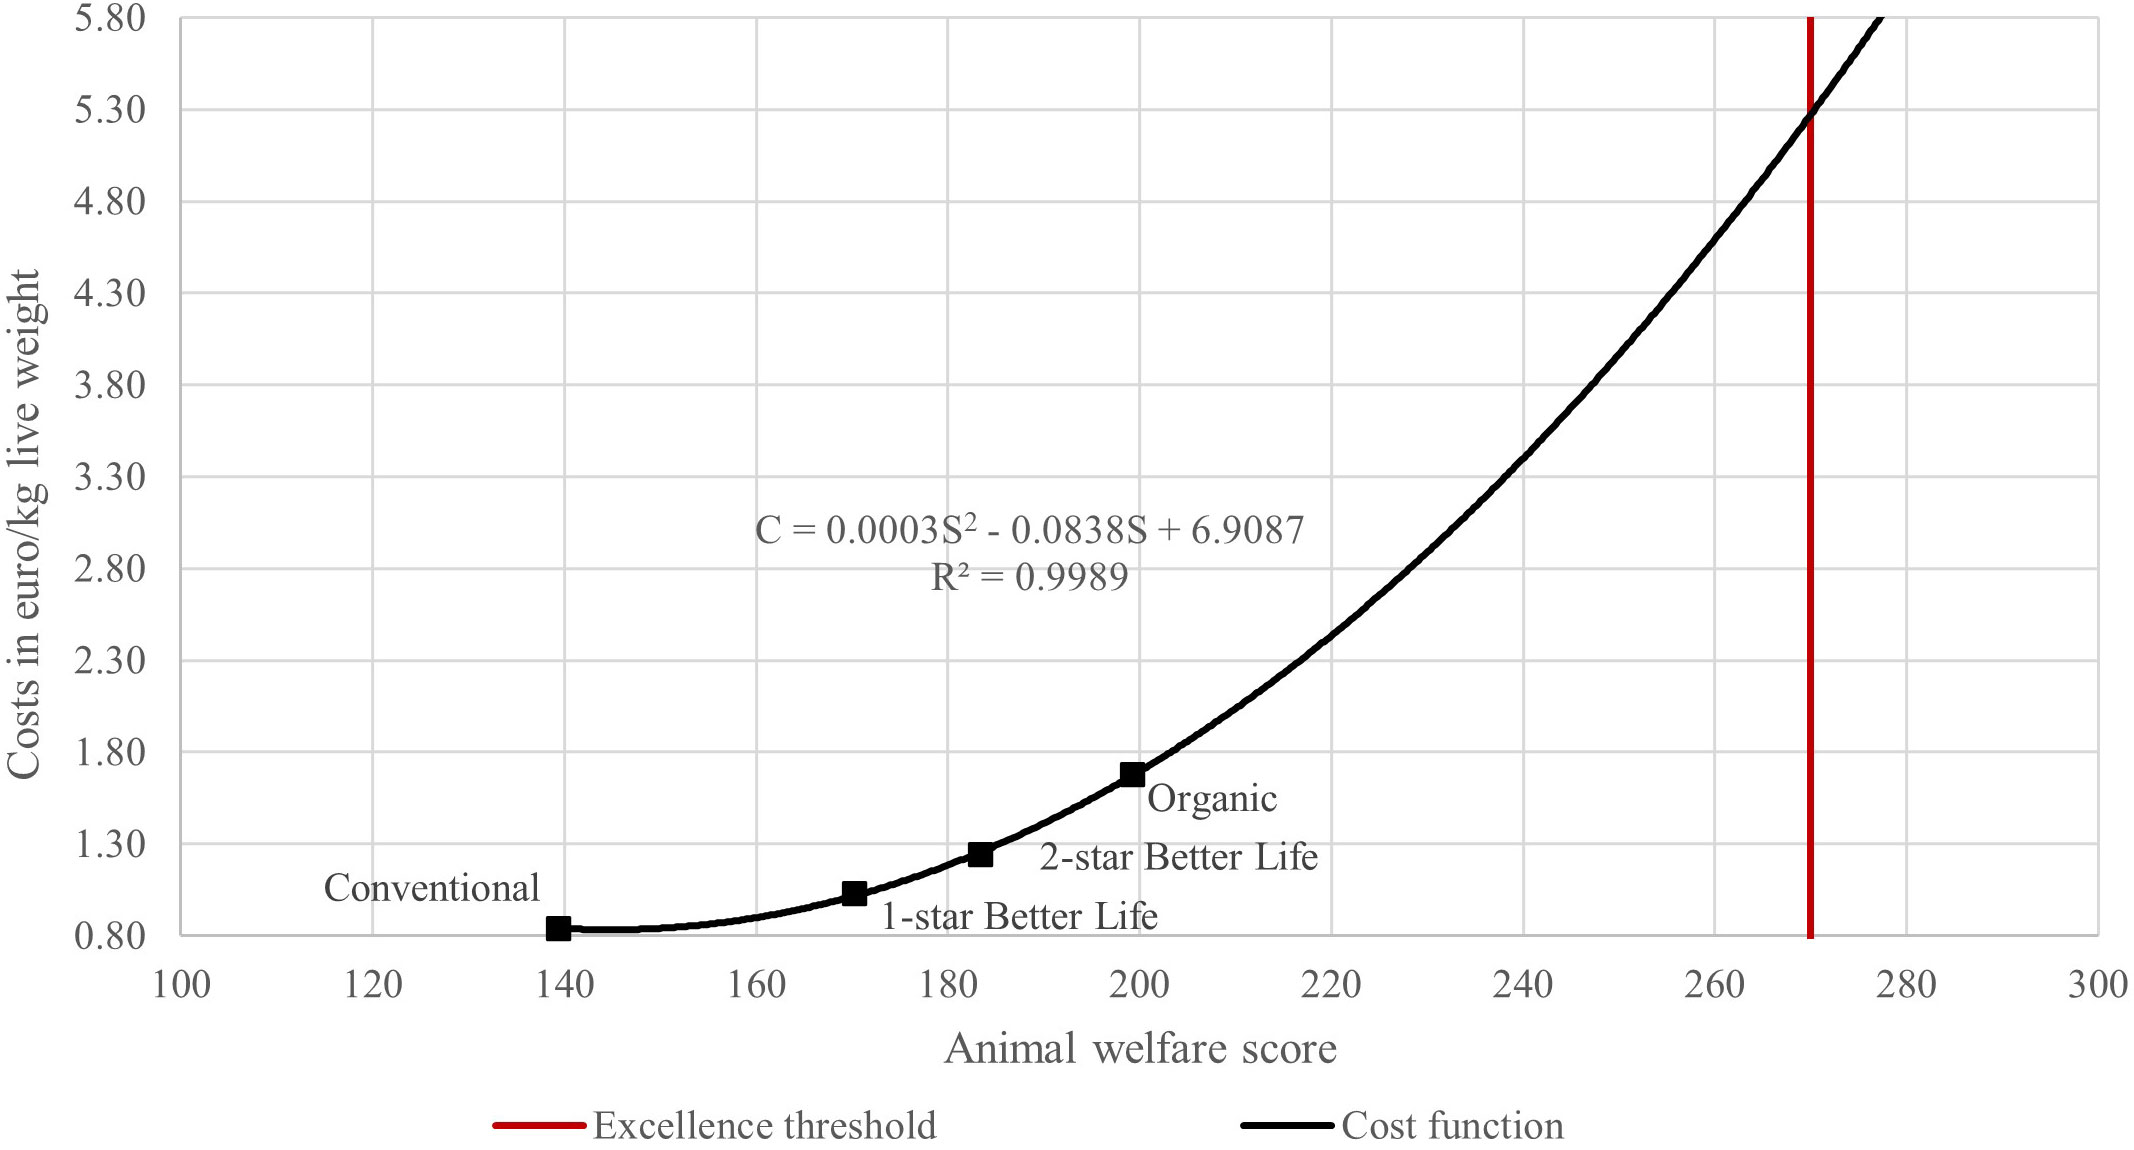
Figure 4 Cost function for the Dutch broiler production systems.
4.1.7 Step 7: Calculate external costs of AW
Table 5 provides the estimated external AW costs of the production systems under consideration. For example, the estimated external costs of AW for the conventional dairy cattle farming system are (0.0014*270 + 0.1816)-0.47 = 0.10 euro/kg milk and for the Dutch conventional pig production system (0.0004*2702-0.1552*270 + 17.3614)-1.15 = 1.36 euro/kg live weight. The external AW costs of the broiler production systems were about three times higher than those of the pig production systems. This was caused by the relatively large difference between the excellence threshold of 270 and the AW score of the organic production system for broilers (199.3) compared to the other two species (pigs 240.4, dairy cattle 254.4) in combination with broilers having the most convexly shaped cost function.
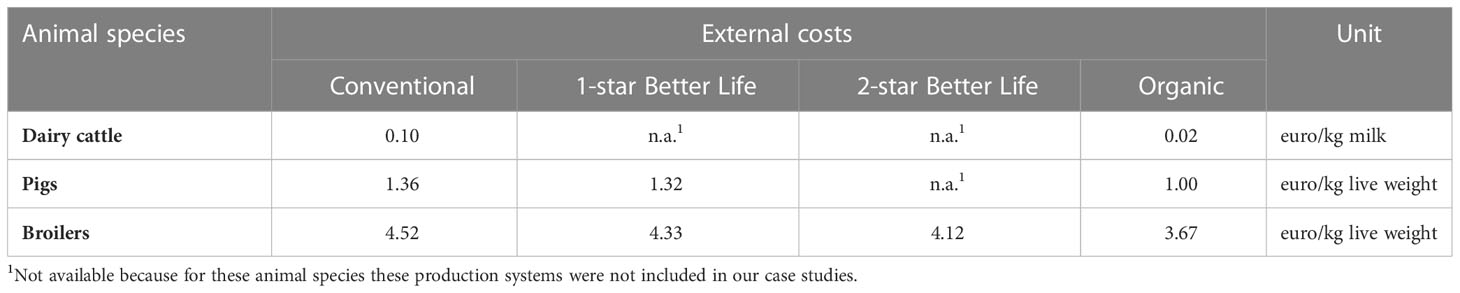
Table 5 Estimated external AW costs of the German conventional and organic dairy cattle farming system, the Dutch conventional, 1-star Better Life, and organic pig production system, and the Dutch conventional, 1-star Better Life, 2-star Better Life, and organic broiler production system.
4.2 Sensitivity analysis
4.2.1 Excellence AW threshold
A higher/lower excellence AW threshold increased/decreased the external costs, the amount by which differed between animal species depending on the shape of the cost function (Table 6). For all production systems within an animal species, a higher excellence AW threshold increased the external AW costs with the same absolute amount. At an excellence AW threshold of 300, the external AW costs of the dairy cattle production systems were 0.04 euro per kg milk higher than at an excellence AW threshold of 270. For pigs and broilers, this was 1.69 and 2.43 euro per kg live weight, respectively. At an excellence AW threshold of 240, the external costs of the organic dairy cattle system and organic pig production system were 0 as the AW score of these systems exceeded the excellence AW threshold. For all other systems, changing the excellence AW threshold did not affect the difference between external costs of a production system within an animal species. For instance, the difference in external costs between the conventional and organic broiler production system remained 0.85 eurocents/kg live weight, regardless of the excellence AW threshold.
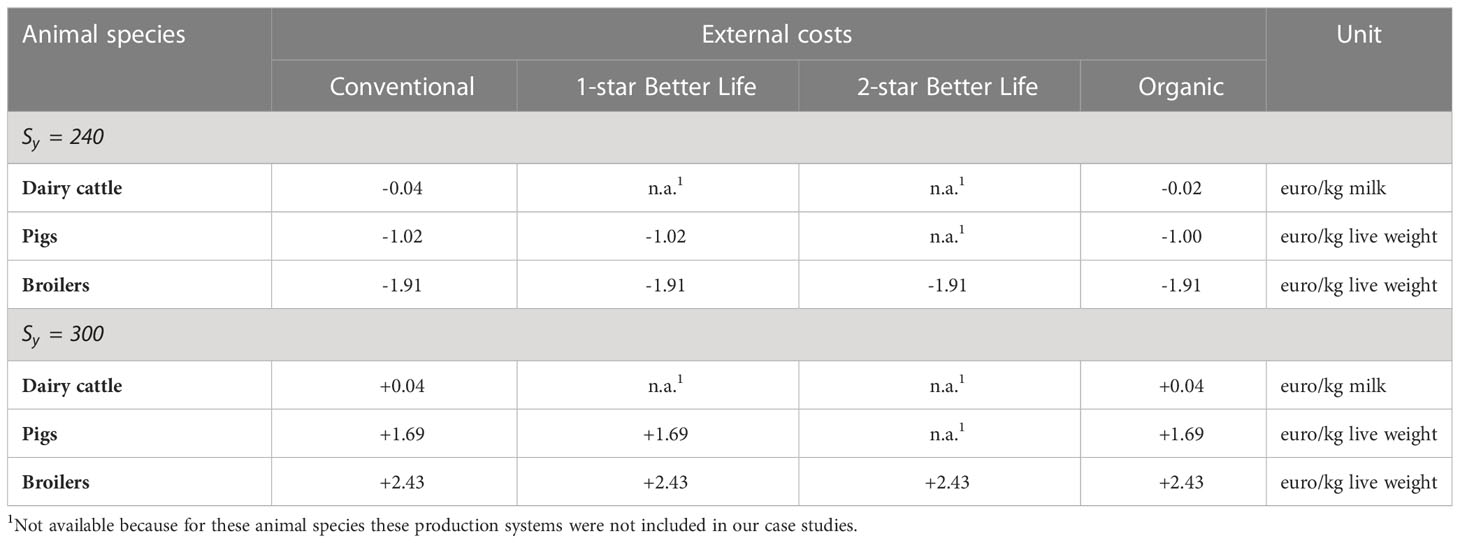
Table 6 Estimated external AW costs at an excellence AW threshold of 240 and 300; change compared to baseline in Table 5.
4.2.2 Compensation thresholds
Table 7 shows the estimated external AW costs if the minimum score threshold value was increased to 25 and 35. Decreasing the minimum score thresholds’ value (e.g. to 15) did not affect the external costs of the production systems for all three species, because all principle scores were higher than this value. Increasing the minimum score thresholds’ value to 25 or 35 did not affect the external costs of the dairy cattle production system, as all principle scores were higher than 35. The external costs of the pig production systems were also not affected by these changes as only one principle score was lower than 35 in the conventional and 1-star Better Life system and all principle scores of the organic pig production system were higher than 35. Increasing the minimum thresholds’ value to 25 resulted in a decrease of the external costs of the broiler production systems by 0.69 euro/kg live weight compared in the baseline. The external costs of the broiler production system decreased by 0.94 euro/kg live weight when increasing the minimum threshold’s value to 35. These findings can be explained by the fact that a higher minimum score threshold value resulted in a lower AW score of the conventional system, while the AW scores of 2-star Better Life system and the organic system were unaffected. This resulted in a less convexly shaped cost function.
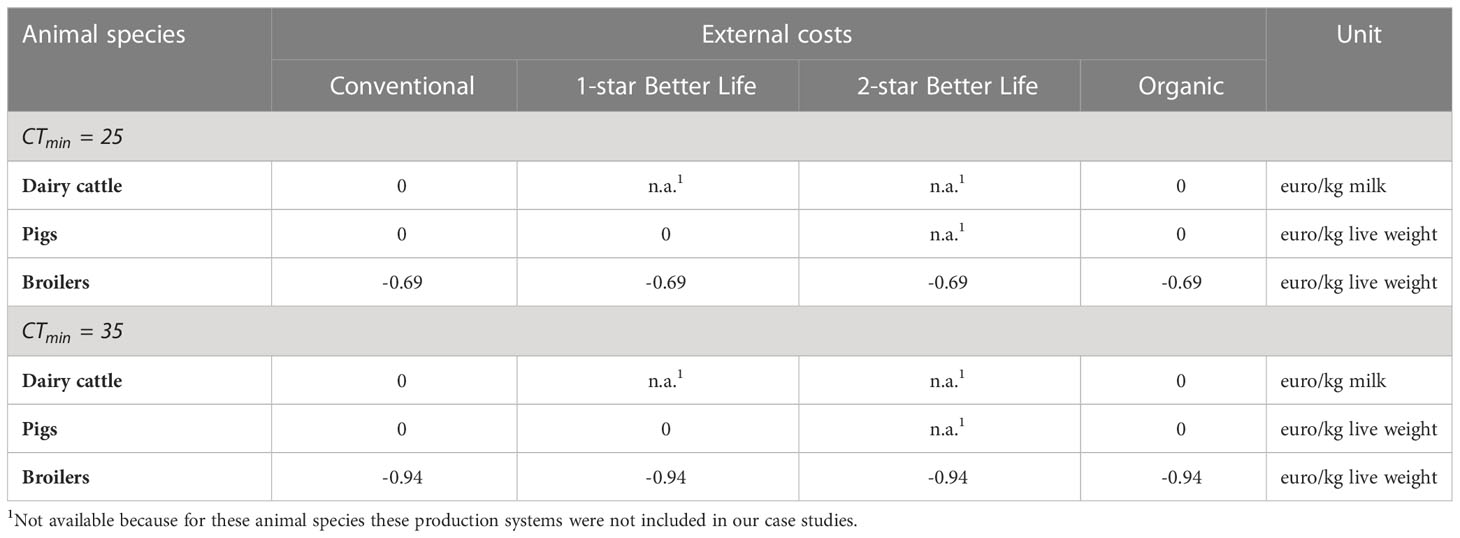
Table 7 Estimated external AW costs at a minimum score threshold of 25 and 35; change compared to baseline in Table 5.
Table 8 shows the estimated external AW costs if the maximum compensation threshold was decreased to 25 and increased to 45. Changing the maximum compensation threshold value affected the external costs of the pig and broiler production system, but not of the dairy cattle system. For broilers, the difference in external costs with the baseline ranged from -2.19 to +3.40 euro/kg live weight. For pigs, the difference in external costs with the baseline ranged from -0.46 to -0.19. Changing the maximum compensation threshold value only affected the absolute value of the external costs but not the differences between the systems within an animal species. Hence, the relative position of the systems was unaffected.
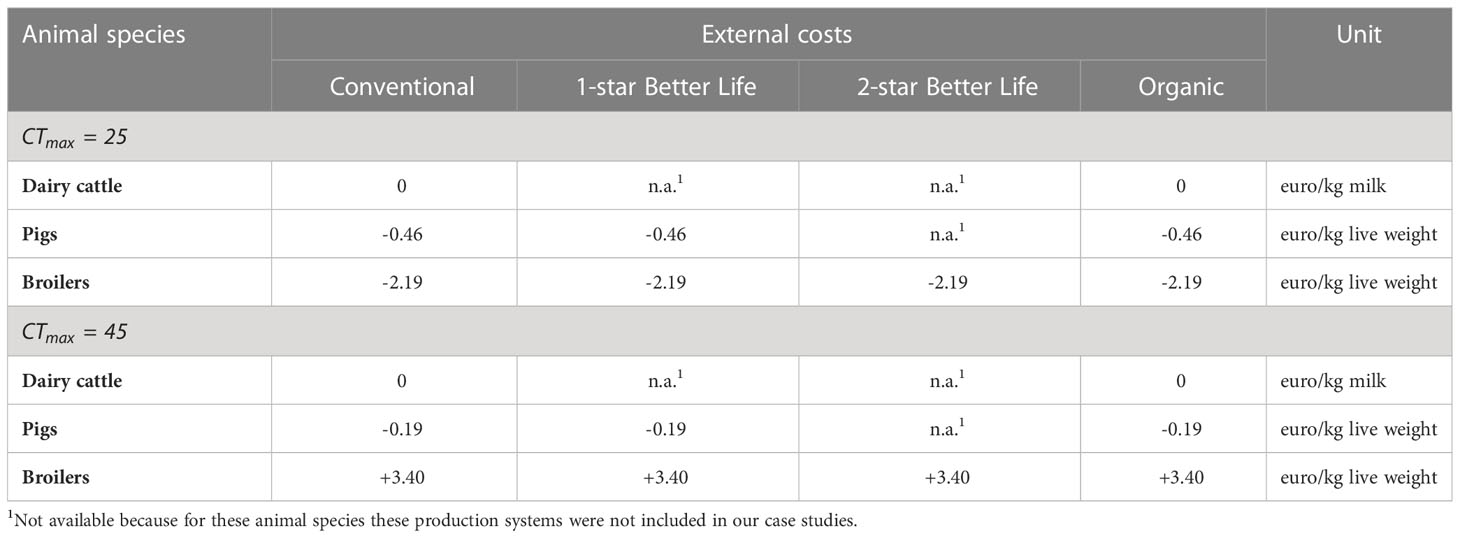
Table 8 Estimated external AW costs at a maximum compensation threshold of 25 and 45; change compared to baseline in Table 5.
5 Discussion
In this study, a method was developed to calculate the external costs of AW for farm animals. In our method, the corrected principle scores were aggregated for the overall assessment of AW at the farm level. Different aggregation methods can be used for this assessment, such as a weighted sum of scores or an aggregation based on expert’s opinion. Each method has its own advantages and limitations (Botreau et al., 2007). In our method, the sum of scores was applied as it allows calculation of an absolute score for any farm. These absolute scores were required in our method to compare farms or production systems. The main shortcoming of the sum of scores method is that it allows full compensation between welfare aspects, which may result in overshadowing serious welfare problems (Botreau et al., 2007). Perny (1998) suggested to specify minimal requirements to limit compensation. We followed this suggestion by assuming that no compensation between principle scores is possible if welfare is below a threshold, while limited compensation is possible if welfare is above this threshold (see section 3.2). It is debatable which values should be used for these thresholds. The sensitivity analysis indicated that changing the thresholds’ value only affected the absolute value of the external costs, but not the difference between the external costs of production systems within an animal species. The sensitivity analysis also showed a low variability in the external costs for dairy cattle and a high variability for broilers. A high variability affects the robustness of the results when comparing the external costs of AW among animal species or when comparing these costs with the costs of other externalities (such as global warming). Studies that apply our method should therefore perform a sensitivity analysis to test the influence of the thresholds’ value on the robustness of the results, particularly when comparing the external costs among animal species or between externalities.
Our method relies on an estimated cost function which is based on the costs and benefits of implemented AW measures. However, in practice it might be difficult to disentangle costs and benefits of AW measures from the total farm costs. Although various studies analyzed the effect of AW measures on the health and performance of farm animals, most of them did not analyze the economic effects. For instance, Dozier et al. (2005) found that a broiler stocking density beyond 30 kg/m2 resulted in a decline in final body weight and an increase in the incidence of food-pad lesions and skin scratches. A limited number of studies provided information about the economic effects of AW measures. For example, Verspecht et al. (2011) analyzed the economic costs and benefits of lower stocking densities in broiler production. Gocsik et al. (2014) analyzed the effect of more AW friendly broiler production systems on the prevalence of endemic diseases and the corresponding effect on health care costs, defined as the sum of health care expenditures and foregone benefits due to lower animal health. The authors did not consider the cost and benefits of individual AW measures. Application of the results of such studies to the case study at hand might not be straightforward due to differences in production systems. More insight is needed on how to disentangle the costs and benefits related to implemented AW measures from total farm costs. We also provided a proxy method with the production costs corrected for other differences between farms. The case studies showed that this proxy method was relatively easy to apply. Although our case studies’ outcomes seem reasonable, it is not clear how accurate they are. Further studies are needed to assess the accuracy of the proxy method.
To calculate the external costs of AW, a reference point was required where AW infringements are minimized, i.e. the excellence AW threshold. In our study, we based this reference point on the welfare category ‘excellence’ of the WQ Protocol. The empirical application shows that the difference between the system with the highest AW score and the excellence threshold was relatively large for broilers (70.7 welfare points) compared to pigs and dairy (29.6 and 15.6 welfare points, respectively). This finding indicates that the production systems of broilers are far from optimal (compared to cattle and pigs) based on the WQ protocol. This difference resulted in a higher degree of uncertainty associated with the estimate of the external costs of AW for broilers (-2.19 to + 3.40 euro/kg live weight) compared to dairy cattle and pig production.
Our method to estimate external costs of AW is in principle applicable to all animal species. However, the applicability of our method is currently restricted by limitations of the WQ protocol. First, the WQ protocol has as yet been developed only for key production animals. Therefore, our method is currently also restricted to these animals. Future research could develop methods to assess the level of AW for other species, including non-terrestrial animals. Second, not all stages of the supply chain in which live animals are present, such as transport and slaughter, are fully considered in the WQ protocol. It would be interesting to analyze if and how our method can be extended to include AW in other parts of the supply chain. Third, the number of studies that applied the WQ protocol is limited, which can be explained by the fact that the collection of data with the WQ protocol tends to be time consuming and costly. Furthermore, appropriate and recognized training in the practical application of the WQ protocol is essential to ensure uniform scoring. Various studies have developed simplified methods of the WQ protocol, thereby making animal-based welfare assessment more practicable. Future research could apply these methods to alternative systems to obtain AW scores for these systems.
The application of our method provides insight in the external costs of AW at farm level. In the Farm to Fork strategy it is stated that, in order to achieve a sustainable EU food system, consumers need access to food that holds high standards on AW. Therefore, the EC intends to align AW legislation with general sustainability goals, for instance on climate and biodiversity (European Parliament, 2021). Furthermore, the EC considers options for AW labelling to contribute to a sustainable food consumption (Gavinelli). The insights obtained from the application of our method can provide valuable insights to support policy making about such labels. First, it provides insight in the costs associated with AW improvements and the corresponding AW benefits. These results can be compared to consumers’ willingness-to-pay more for more AW friendly products to assess the economic feasibility of more extensive livestock production systems. Second, our method can be used to calculate the price premium that farmers require to maintain their income when adopting more AW friendly production practices. Third, our method can be integrated in true cost accounting methods to calculate the external costs of food products. True cost accounting is seen as a potential way to enhance the sustainability of food systems (Hendriks et al., 2021).
In this study, we developed a method to estimate the external costs of AW at farm level. The method uses AW score data from the WQ protocol and production costs data. It provides rules to calculate farm level AW scores using compensation thresholds allowing for some compensation between welfare principles and an excellence AW threshold that reflects the level of AW at which the animals only suffer minimal welfare infringements. With a cost function, the external AW costs at farm level can be calculated. Application to production systems of dairy cattle in Germany, pigs and broilers in the Netherlands showed that the method was effective in estimating external AW costs. Future research should focus on developing methods that can be applied to assess the level of AW of other production animals, including non-terrestrial animals.
Data availability statement
The original contributions presented in the study are included in the article. Further inquiries can be directed to the corresponding author.
Author contributions
All authors contributed to conception and design of the study. LV collected the data. LV performed the statistical analysis. LV and CW wrote the first draft of the manuscript. LV and CW wrote draft sections of the manuscript. All authors contributed to the article and approved the submitted version.
Funding
This project is financially supported by the Dutch top sector Agriculture & Food (grant number AF18051) and the top sector Horticulture & Propagation Materials (grant number TU18104). Within the top sector Agriculture & Food, private industry, knowledge institutes, and the government are working together on innovations for safe and healthy food for 9 billion people in a resilient world. Within the top sector Horticulture & Propagation Materials, the business community, knowledge institutions, and the government work together on the sustainable production of healthy and safe food, and the development of a healthy, green living environment.
Conflict of interest
The authors declare that the research was conducted in the absence of any commercial or financial relationships that could be construed as a potential conflict of interest.
Publisher’s note
All claims expressed in this article are solely those of the authors and do not necessarily represent those of their affiliated organizations, or those of the publisher, the editors and the reviewers. Any product that may be evaluated in this article, or claim that may be made by its manufacturer, is not guaranteed or endorsed by the publisher.
Footnotes
- ^ In the study of Gocsik et al. (2016), the terms ‘Volwaard’ and ‘Extensive Outdoor’ are used for two middle-segment systems. These systems have been integrated in the Better Life labelling scheme, in which ‘Volwaard’ received 1 star and ‘Extensive Outdoor’ 2 stars of the Better Life label. These names have therefore been applied in this study.
References
Agrimatie (2023). “Supply balance.” wageningen economic research. Available at: https://www.agrimatie.nl/VoorzieningsBalansen.aspx (Accessed February 15, 2023).
Antheaume N. (2004). “Valuing external costs – from theory to practice: implications for full cost environmental accounting.” Eur. Accounting Rev. 13 (3), 443–464. doi: 10.1080/0963818042000216802
Bessei W. (2006). Welfare of broilers: a review. World’s Poultry Sci. J. 62 (3), 455–466. doi: 10.1017/S0043933906001085
Blokhuis H. J. (2008). International cooperation in animal welfare: the welfare quality® project. Acta Veterinaria Scandinavica 50 (1), S10. doi: 10.1186/1751-0147-50-S1-S10
Botreau R., Bonde M., Butterworth A., Perny P., Bracke M. B. M., Capdeville J., et al. (2007). Aggregation of measures to produce an overall assessment of animal welfare. part 1: a review of existing methods. Animal 1 (8), 1179–1187. doi: 10.1017/S1751731107000535
Büro für Agrarsoziologie und Landwirtschaft (2019). What is the cost of producing milk? (Gleichen: büro für agrarsoziologie und landwirtschaft). Available at: https://mcusercontent.com/91ae04a80d4a90ffd66b56980/files/1f5efd40-e44b-01e5-8cd2-899a592717a1/2021_Cost_study_EN.04.pdf.
De Bruyn S., Bijleveld M., De Graaff L., Schep E., Schroten A., Vergeer R., et al. (2018). Environmental prices handbook. (Delft: CE delft). Available at: https://cedelft.eu/wp-content/uploads/sites/2/2021/04/CE_Delft_7N54_Environmental_Prices_Handbook_EU28_version_Def_VS2020.pdf.
De Jong I. C., Bos B., Van Harn J., Mostert P., Te Beest D. (2022). Differences and variation in welfare performance of broiler flocks in three production systems. Poultry Sci. 101 (7), 101933. doi: 10.1016/j.psj.2022.101933
Dozier W. A., Thaxton J. P., Branton S. L., Morgan G. W., Miles D. M., Roush W. B., et al. (2005). Stocking density effects on growth performance and processing yields of heavy broilers. Poultry Sci. 84 (8), 1332–1338. doi: 10.1093/ps/84.8.1332
Dutch Ministry of Agriculture Nature and Food Quality (2022). Dutch Animals act (The Hague: Dutch Ministry of Agriculture Nature and Food Quality). Available at: https://wetten.overheid.nl/BWBR0030250/2022-12-22.
Dutch Society for the Protection of Animals (2021). The better life label. Available at: https://beterleven.dierenbescherming.nl/english/ (Accessed March 12, 2023).
Eurobarometer (2016). Attitudes of europeans towards animal welfare (Brussels: European Commission). Available at: https://ec.europa.eu/commfrontoffice/publicopinion/index.cfm/ResultDoc/download/DocumentKy/71348.
European Commission (2018). Regulation (EU) 2018/848 of the European parliament and of the council of 30 may 2018 on organic production and labelling of organic products and repealing council regulation (EC) no 834/2007 (Brussels: European Commission). Available at: https://eur-lex.europa.eu/eli/reg/2018/848/oj.
European Parliament (2021). European Parliament resolution of 20 October 2021 on a farm to fork strategy for a fair, healthy and environmentally-friendly food syste/2260(INI)) (Brussels: European Parliament). Available at: https://www.europarl.europa.eu/doceo/document/TA-9-2021-0425_EN.html.
Galgani P., Woltjer G., De Adelhart Toorop R., De Groot Ruiz A. (2021). Valuation framework for true price assessment of agrifood products (Amsterdam: True Price). Available at: https://trueprice.org/valuation-framework-for-true-price-assessment-of-agrifood-products/.
Gavinelli A. Animal welfare within the farm to fork strategy. Available at: https://food.ec.europa.eu/system/files/2020-06/aw_platform_20200615_pres-02.pdf (Accessed 27 Feburary, 2023).
Gocsik É., Brooshooft S. D., De Jong I. C., Saatkamp H. W. (2016). Cost-efficiency of animal welfare in broiler production systems: a pilot study using the welfare quality® assessment protocol. Agric. Syst. 146, 55–69. doi: 10.1016/j.agsy.2016.04.001
Gocsik É., Kortes H. E., Oude Lansink A. G. J. M., Saatkamp H. W. (2014). Effects of different broiler production systems on health care costs in the Netherlands. Poultry Sci. 93 (6), 1301–1317. doi: 10.3382/ps.2013-03614
Haltungsform (2023) Die Siegel in der haltungsform. Available at: https://www.haltungsform.de/im-ueberblick/ (Accessed March 22, 2023).
Hendriks S., De Groot Ruiz A., Acosta M. H., Baumers H., Galgani P., Mason-D’Croz D., et al. (2021) The true cost and true price of food. Available at: https://sc-fss2021.org/wp-content/uploads/2021/06/UNFSS_true_cost_of_food.pdf.
Hoogstra A. (2018) Cost-efficiency analysis of animal welfare improvements in Dutch growing-finishing pigs. Available at: https://edepot.wur.nl/475483.
Ippenberger B., Hoffman G. (2022). Tierwohl in der milchviehhaltung: zusätzlicher kostenaufwand trifft kleinere (bayerische anbinde-) betriebe am härtesten (München: Institut für Betriebswirtschaft und Agrarstruktur). Available at: https://www.lfl.bayern.de/mam/cms07/iba/dateien/tierwohlkosten_in_der_milchproduktion.pdf.
Lu J., Bayne K., Wang J. (2013). Current status of animal welfare and animal rights in China. Alternatives to Lab. Anim. 41, 351–357. doi: 10.1177/026119291304100505
Lusk J. L., Norwood F. B. (2011). Animal welfare economics. Appl. Economic Perspect. Policy 33 (4), 463–483. doi: 10.1093/aepp/ppr036
Microsoft Corporation (2018) (Redmonton: Microsoft corporation). Available at: https://www.microsoft.com/en-us/microsoft-365/excel.
Parlasca M., Knößlsdorfer I., Alemayehu G., Doyle R. (2023). How and why animal welfare concerns evolve in developing countries. Anim. Front. 13 (1), 26–33. doi: 10.1093/af/vfac082
Perny P. (1998). Multicriteria filtering methods based onconcordance and non-discordance principles. Ann. Operations Res. 80, 137–165. doi: 10.1023/A:1018907729570
Sundqvist T., Söderholm P., Stirling A. (2004). Electric power generation: valuation of environmental costs. Encyclopedia Energy, 229–243. doi: 10.1016/B0-12-176480-X/00543-X
True Cost Initiative (2022) Practical true cost accounting guidelines for the food and farming sector on impact measurement, valuation and reporting. Available at: https://tca2f.org/wp-content/uploads/2022/03/TCA_Agrifood_Handbook.pdf.
Van Eerdenburg F. J. C. M., Di Giacinto A. M., Hulsen J., Snel B., Stegeman J. A. (2021). A new, practical animal welfare assessment for dairy farmers. Animals 11 (3), 881. doi: 10.3390/ani11030881
Verspecht A., Vanhonacker F., Verbeke W., Zoons J., Van Huylenbroeck G. (2011). Economic impact of decreasing stocking densities in broiler production in Belgium. Poultry Sci. 90 (8), 1844–1851. doi: 10.3382/ps.2010-01277
Vissers L. S. M., De Jong I. C., van Horne P. L. M., Saatkamp H. W. (2019). Global prospects of the cost-efficiency of broiler welfare in middle-segment production systems. Animals 9 (7), 473. doi: 10.3390/ani9070473
Von Keyserlingk M. A. G., Rushen J., De Passillé A. M., Weary D. M. (2009). Invited review: the welfare of dairy cattle–key concepts and the role of science. J. Dairy Sci. 92 (9), 4101–4111. doi: 10.3168/jds.2009-2326
Wagner K., Brinkmann J., Bergschmidt A., Renziehausen C., March S. (2021). The effects of farming systems (organic vs. conventional) on dairy cow welfare, based on the welfare quality® protocol. Animal 15 (8), 100301. doi: 10.1016/j.animal.2021.100301
Welfare Quality® Protocol (2009). Welfare quality® assessment protocol for poultry (broilers, laying hens) (Lelystad: Welfare Quality® Consortium). Available at: https://edepot.wur.nl/233471.
Appendix
Corrected production costs of organic pig and broiler production systems
Pigs
The production costs of the organic pig production system were already corrected for the feed price of conventional feed in the study of Hoogstra (2018).
Broilers
The production costs of the organic broiler production were 2.01 euro/kg live weight (Gocsik et al., 2016). These costs were corrected using the feed price of the 1-star Better Life system. The feed price of the 1-star Better Life and organic system were 29.5 euro/100 kg and 41.9 euro/100 kg, respectively (Gocsik et al., 2016). The feed conversion ratio of the 1-star Better Life and organic system were 2.01 and 2.60. The corrected production of the organic broiler production system were calculated as follows:
Keywords: animal welfare, externalities, external costs, livestock farming, economic performance
Citation: Vissers LSM, van Wagenberg CPA and Baltussen WHM (2023) A method for calculating the external costs of farm animal welfare based on the Welfare Quality® Protocol. Front. Anim. Sci. 4:1195221. doi: 10.3389/fanim.2023.1195221
Received: 28 March 2023; Accepted: 26 April 2023;
Published: 15 May 2023.
Edited by:
Janice Swanson, Michigan State University, United statesReviewed by:
Andrew Butterworth, University of Bristol, United KingdomAndrea Bragaglio, Council for Agricultural and Economics Research (CREA), Italy
Copyright © 2023 Vissers, van Wagenberg and Baltussen. This is an open-access article distributed under the terms of the Creative Commons Attribution License (CC BY). The use, distribution or reproduction in other forums is permitted, provided the original author(s) and the copyright owner(s) are credited and that the original publication in this journal is cited, in accordance with accepted academic practice. No use, distribution or reproduction is permitted which does not comply with these terms.
*Correspondence: Luuk S. M. Vissers, bHV1ay52aXNzZXJzQHd1ci5ubA==