 Mulugeta Walelegne1
 Fentahun Meheret2
 Melkamu B. Derseh3Mesfin Dejene1
 Yonas T. Asmare3
 Kodukula V. S. V. Prasad3
 Chris S. Jones3
 Robert M. Dixon4
 Alan J. Duncan3,5*
- 1Ethiopian Institute of Agricultural Research, Holetta Agricultural Research Center, Holetta, Ethiopia
- 2Bahir Dar University, College of Agriculture and Environmental Sciences, Bahir Dar, Ethiopia
- 3Feed and Forage Development Programme, International Livestock Research Institute (ILRI), Addis Ababa, Ethiopia
- 4Queensland Alliance for Agriculture and Food Innovation (QAAFI), University of Queensland, St Lucia, QLD, Australia
- 5Global Academy of Agriculture and Food Systems, University of Edinburgh, Edinburgh, United Kingdom
Introduction: Measurement of the nutritive value of feedstuffs with near infrared reflectance spectroscopy (NIRS) laboratory benchtop spectrometers is well-established. The aim of this study was to examine the reliability and accuracy of a handheld low-cost Tellspec NIRS spectrometer for measurement of the nutritive value of oilseed meals.
Methods: Samples (n=142) comprising byproduct meals from processing linseed, noug seed, cotton seed, groundnut, rapeseed, soybeans, and sunflower seeds were collected from farms, oil factories, wholesalers, and retail shops in central Ethiopia. Samples were scanned ‘as received’ (UGr) and also following drying and grinding (Gr), and were scanned once, twice, and ten times in a 2x3 factorial experimental design. Laboratory analyses of total nitrogen (TN), neutral detergent fiber (NDF), acid detergent fiber (ADF), acid detergent lignin (ADL), and in vitro organic matter digestibility (IVOMD) provided reference measurements. Calibration models were developed using a subset of 2/3 of the spectra and validated using the remaining 1/3 of sample spectra.
Results: The sample form and the number of scans, and their interactions, all significantly affected the accuracy of the calibration models (P<0.001). The most accurate calibrations were with Gr samples scanned 10 times, where the coefficient of determination of both calibration and validation sets (R2cal and R2val) were ≥ 0.90 for most attributes. The respective standard errors of prediction (SEP) (g/kg DM) for Gr, and ‘as received’, samples respectively that were scanned ten times were: TN (3.2 and 4.7), IVOMD (11.7 and 20.1), NDF (26.9 and 43.8), ADF (25.3 and 44.6), and ADL (6.8 and 10.7). Also, the SEP for each attribute was reduced (P<0.05) by drying and grinding the sample before scanning. The ratios of the standard deviation of the calibration samples to the SEP (RPD) g/kg DM were 2.68, 2.30, 3.17, 3.05, and 4.06 for TN, IVOMD, NDF, ADF, and ADL, respectively, for Gr samples scanned ten times. Nevertheless, the SEP of samples scanned ‘as received’ would often be acceptable for routine analyses in the field and market-place under east African circumstances.
Conclusion: In conclusion, NIRS calibrations for a portable handheld Tellspec NIRS spectrometer could be developed to measure important nutritional attributes of oilseed cake samples as feeds.
Introduction
Knowledge of the nutritive quality of the animal feeds available is one of the most important considerations in livestock production where feed costs often account for the majority (e.g. 75-80%; Lundberg et al., 2004) of the cost of animal production. Also, as discussed in many recommendations of nutritional requirements of livestock (NRC, 2001) the use of feedstuffs with appropriate chemical compositions is essential to optimize livestock production and minimize feeding costs (Tedeschi et al., 2010). However, information about the composition of feed resources, particularly in the context of developing countries, is often lacking due to logistical constraints, high costs, and scarcity of analytical services. Animal feeding trials and conventional laboratory analysis (“wet chemistry”) are the two most common methods used for estimation of feed quality. Feeding trials are a labor-intensive and costly method to routinely evaluate the nutritive value of feed resources routinely (Rukundo et al., 2021). Wet chemistry for determining the chemical composition of feeds is also expensive, time-consuming, laborious, and requires the use of potentially unsafe chemical reagents and high-cost instrumentation (Wittkop et al., 2012). In contrast, near infrared reflectance spectroscopy (NIRS) conducted with high quality laboratory benchtop spectrometers can provide rapid and accurate information of feedstuffs with minimal sample preparation, and measurement of many organic constituents from a single spectral measurement (Smith and Flinn, 1991; Wittkop et al., 2012). Moreover, NIRS is a low cost, rapid, high-precision, and high-throughput technique that can predict the concentrations of organic constituents by combining laboratory and spectral data (Ramirez et al., 2015; Wu et al., 2015). NIRS also has the advantage that samples can often be analyzed in their natural form (Font et al., 2006).
In the past, most NIRS spectrometers were high cost and suitable only for well-equipped and well-controlled environments, requiring samples to be sent to a central lab for analysis. However, in recent years there has been extensive development of robust, handheld NIR spectrometers. These instruments offer major advantages in size, weight, robustness, spectral range, simplicity in use and cost (Cabassi et al., 2015) and have the potential to take the lab to the sample (with on-farm and market-place applications) (Perez Marin et al., 2009; O’Brien et al., 2012).
Handheld instruments working in reflectance mode would increase options for ease of sub-sampling and for rapid, low-cost analysis (Prado et al., 2011; Dela Roza-Delgado et al., 2014). However, the development and testing of handheld NIRS instruments is needed for specific products and sound chemometric methodology and validation is required (Perez-Marin et al., 2010; Garrido-Varo et al., 2016). Many recent research reports have examined the use of handheld spectrometers for measurements of the compositions of agricultural and food products such as grains (Williams, 2001; Chadalavada et al., 2022), seafoods (Brambilla et al., 2020) agro-fruits (Perez Marin et al., 2009; Pierna et al., 2010), meat (Perez-Marin et al., 2010; Prado et al., 2011) and both forage and concentrate feeds for livestock, and have often reported satisfactory measurements of composition. For example, Prasad et al. (2019) evaluated the performance of the Tellspec Enterprise NIRS device and reported often very acceptable coefficients of determination of validation data sets (R2val) for TN (0.87), NDF (0.89), ADF (0.96), and ADL (0.58) in roughage feeds. Similarly, Modrono et al. (2017) predicted the TN content of compound livestock feeds using the Phazir-1624 and Micro NIRS 1700 portable instruments and obtained acceptable R2val values of 0.89 and 0.87, respectively.
The Tellspec Enterprise handheld NIRS spectrometer offers many potential benefits, but apart from the study of Prasad et al. (2019) cited above there is a lack of information to understand its limitations and the accuracy and reliability of chemometric models in the light of its narrower spectral range than most benchtop NIRS spectrometers. Additionally, in the context of East Africa, no information is available on the efficacy of this Tellspec NIRS spectrometer to measure the chemical composition of high-protein feed samples such as oilseed meals. The objective of the present study was to develop and test the use of the Tellspec Enterprise handheld NIRS spectrometer to measure some important nutritional attributes of the wide range of byproduct cakes and meals from processing oilseeds that are produced in Ethiopia. This included examining the effects of drying and grinding of the samples and the number of measurements of the spectra (i.e. scans) of each sample on the development and reliability of calibration models.
Materials and methods
Study areas
The study was conducted in the Holeta, Adaberga, Sululta, Bishoftu and Adama districts of the Oromia Regional State of Ethiopia (Figure 1). The study areas were selected based on the potential availability of different feed markets and farms. All the study areas are characterized by a cool, sub-tropical climate with bimodal rainfall of 1200 – 1700 mm per year. The study areas are a mixed crop-livestock farming systems with the cultivation of a range of cereal and legume crops and livestock species including dairy and beef cattle, small ruminants and backyard poultry. Livestock are fed on home-grown feed resources and agro-industrial byproducts including oil seed meals.
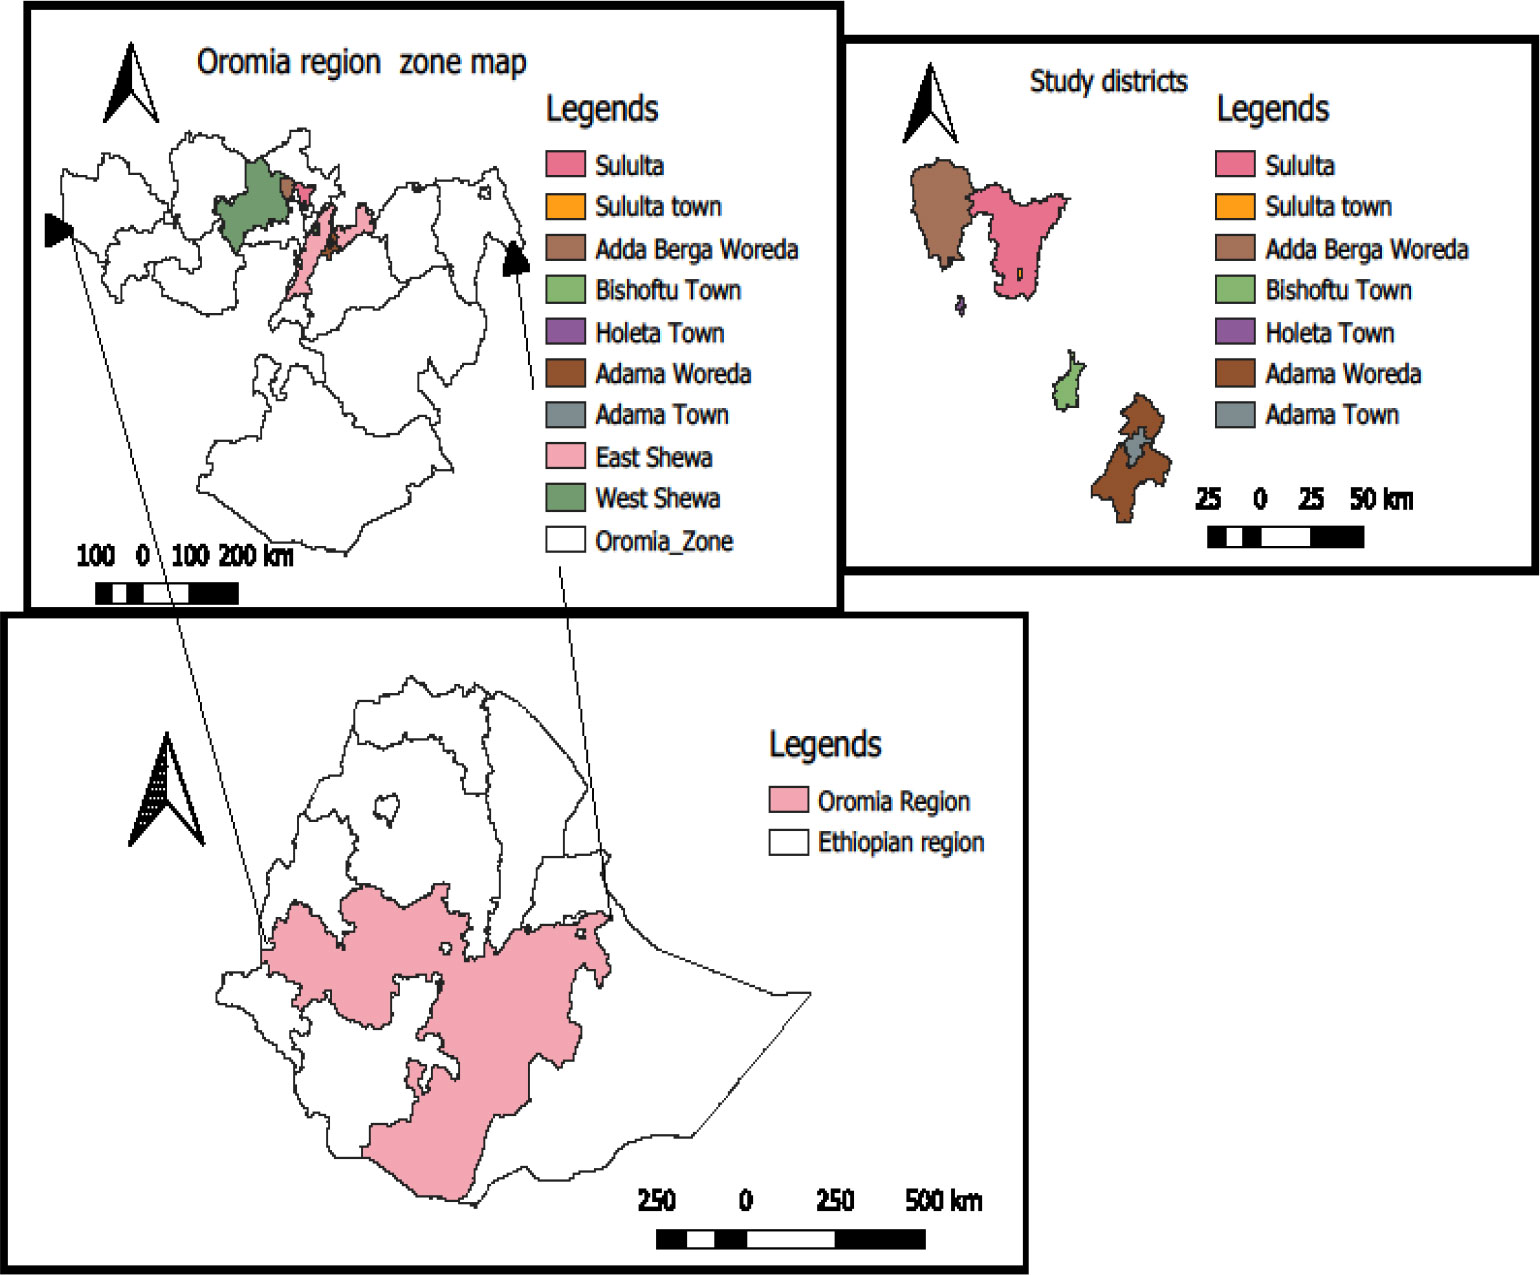
Figure 1 Map of the study areas.
Sample collection, experimental design and treatments
The oilseed cake (n = 142) samples were collected from selected farms, oil factories, wholesalers, and retail shops, and comprised meals from linseed (also known as flaxseed, n=53), noug seed (n=22), cotton seed cake (n=56), groundnut (n= 7), soybean (n=2), sunflower (n=1), and rape seed (n=1). The total number of samples were determined according to Williams (2001), who recommended a minimum of 20 to 30 samples for initial calibration with larger numbers of samples improving the robustness of NIRS prediction equations.
The experiment involved collecting spectra data from intact ‘as received’ (Unground, UGr) and dried and ground samples (Gr), with several scan frequencies (one, two and ten scans per sample; 1s, 2s and 10s) and in triplicate. Thus, there were six treatments comprising UGr-1s, UGr-2s, UGr-10s, Gr-1s, Gr-2s and Gr-10s, and these were analysed as a 2x3 factorial completely randomized design with three replicates.
Sample preparation and collection of spectral data
The samples were transported to the animal nutrition laboratory in the International Livestock Research Institute (ILRI), Addis Ababa. The NIRS spectra of each oilseed cake sample was measured in both ‘intact’ (UGr, i.e. ‘as received’) and Gr samples. The UGr samples were scanned before the samples were dried (forced air oven for 48 hours at 60°C), ground (1 mm screen, Wiley mill), and then scanned again. Both intact and Gr samples were packaged into transparent plastic bags (20 cm width and 30 cm length with 20 µm thickness) for scanning, and subsamples were stored for subsequent reference analyses (Figure 2). The spectra of each Ugr and Gr sample was measured with one, two or ten scans (1s, 2s and 10s) in three replicates. Samples were scanned using a Tellspec Enterprise model handheld NIR spectrometer (Tellspec Enterprise). This NIR spectrometer is a smartphone NIR spectrometer weighing 140 g which measures from 900–1700 nm, with a spectral interval of approx. 3 nm (Crocombe, 2018; Rukundo et al., 2021). Data is collected using a smartphone. The data collection and management software tool designed by Tellspec Enterprise (DC&M2) was downloaded from the Google Play-store and installed on a smartphone with a Bluetooth connection to the instrument for spectra collection. The function of the instrument was checked daily using a standard white reference samples supplied by the manufacturer.
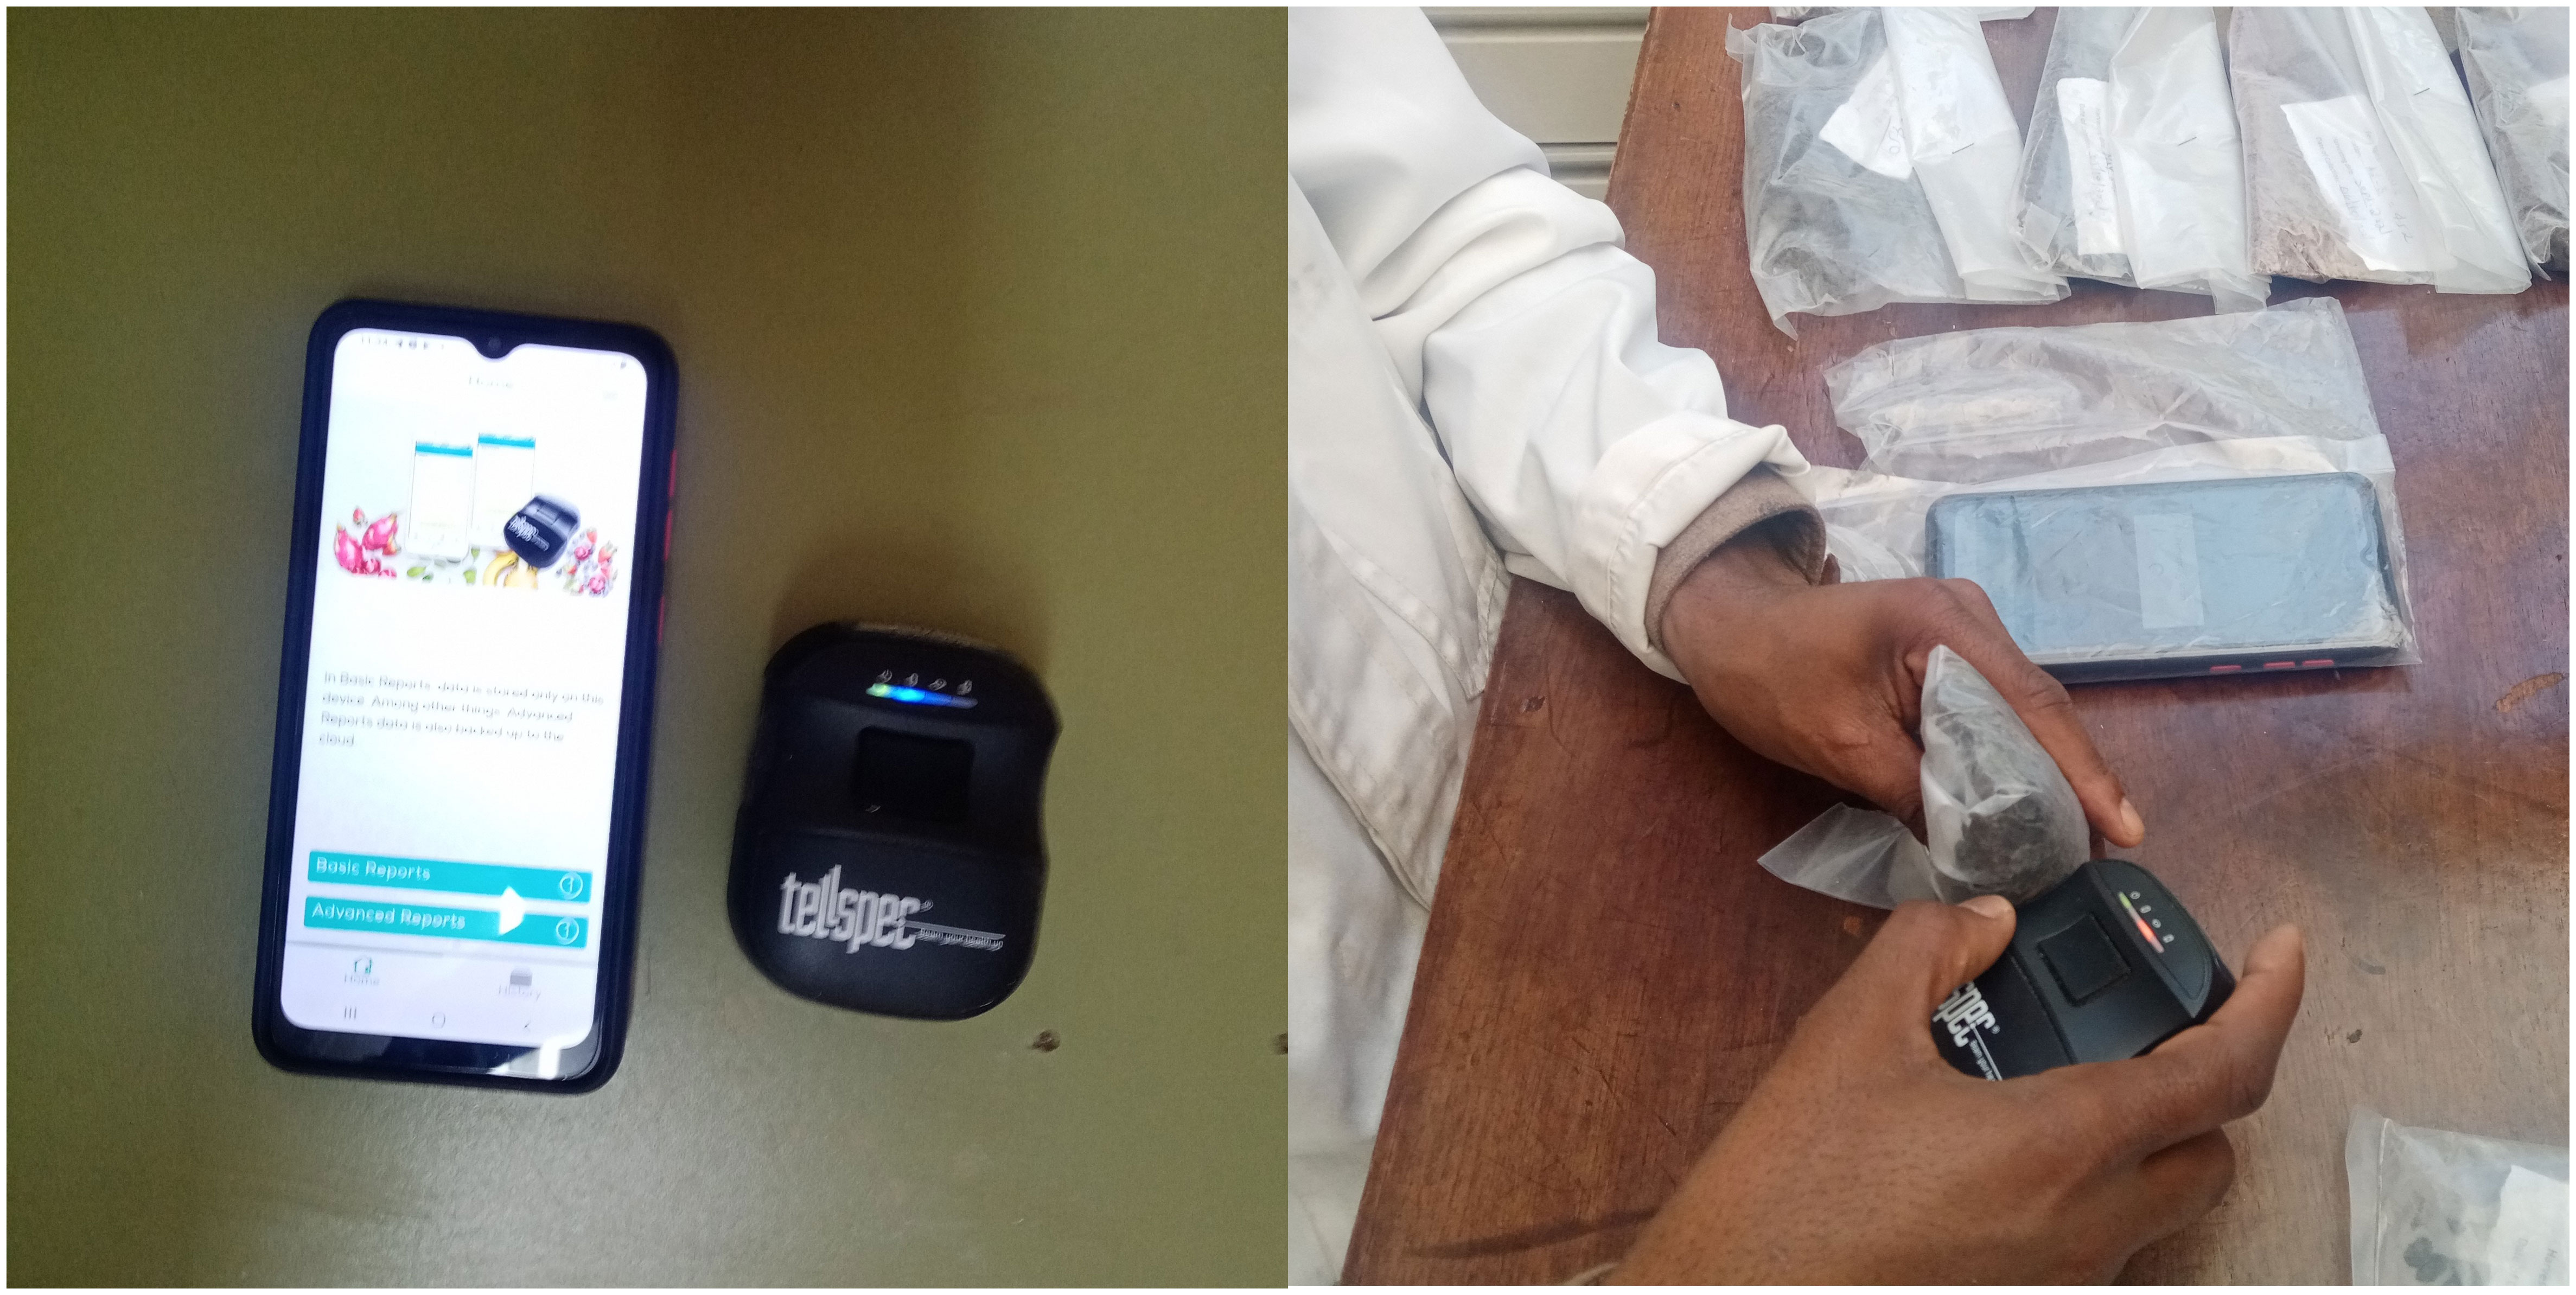
Figure 2 Tellspec handheld NIR spectrometer (left) and demonstration of how each sample was scanned (right).
Analysis of reference samples
Wet chemistry analyses for each feed attribute in each of the samples was conducted to provide their reference values. Total nitrogen (TN) concentration was determined by the Kjeldahl method with the crude protein (CP) content calculated as N x 6.25 (AOAC, 1995). Neutral detergent fiber (NDF), acid detergent fiber (ADF) and acid detergent lignin (ADL) fractions were analyzed according to Van Soest and Robertson (1985). In vitro organic matter digestibility (IVOMD) was determined as described by Tilley and Terry (1963).
Spectra data management, calibration and validation
The spectra of the feed samples were exported to the WinISI 3.0 software for chemometric analyses. The spectral data was randomly divided into calibration (n= 95, 2/3) and validation (n=47, 1/3) sets to develop calibration models and then to test their performance (Westad and Marini, 2015; Despal et al., 2020). Calibration equations were developed using modified partial least squares (MPLS) regression after scatter correction using standard normal variate (SNV) and detrend. The mathematical treatment applied was (1, 6, 4, 1), where the first number indicates the order of derivative (the first derivative of log 1/R), and the gap in nm over which the derivative is calculated, the number of data points used in a first smoothing, and the number of nm over which the second smoothing was applied. The chemometrics were calculated with WinISI version 3.0 software, and the calibration and validation statistics included the standard error of calibration (SEC), R2cal,SEP, R2val, and the ratio of the SD of the population to the SEP (RPD).
Statistical analysis
The calibration and prediction models were developed by using WINISI 3.0 software. The data obtained from the calibration model and validation SEP were subjected to General Linear Model (GLM) using Statistical Analysis System (SAS, version, 9.0) (SAS, 2002). The Duncan multiple range test was employed for the separation of treatment means after checking for homogeneity of variance.
The model used for calibration and validation statistics mean separation was:
Where, Yij = Response variable,
μ = overall mean,
Fi = the jth effect of feed form,
Nj = the ith effect of the number of scans,
Fi*Nj = interaction of the ith feed form and the jth the number of scans,
Eij= error.
Results
Composition of oilseed cake samples
The mean, standard deviation (SD) minimum (Min.) and maximum (Max.) values for each feed attribute of the various oilseed cake samples measured by wet chemistry are presented in Table 1. The TN averaged 49 g/kg and ranged from 24 g/kg DM in cotton seed cake to 88 g/kg in a groundnut cake sample. The IVOMD averaged 657 g/kg DM and ranged from 529 g/kg DM in noug seed cake to 815 g/kg DM in a groundnut cake. The NDF, ADF, and ADL contents also had a wide range among the oilseed cake samples. Finally, the mean lignin content of the oil meals was 100 g/kg DM and ranged from 18 g/kg DM in peanut cake to 156 g/kg DM in noug cake.
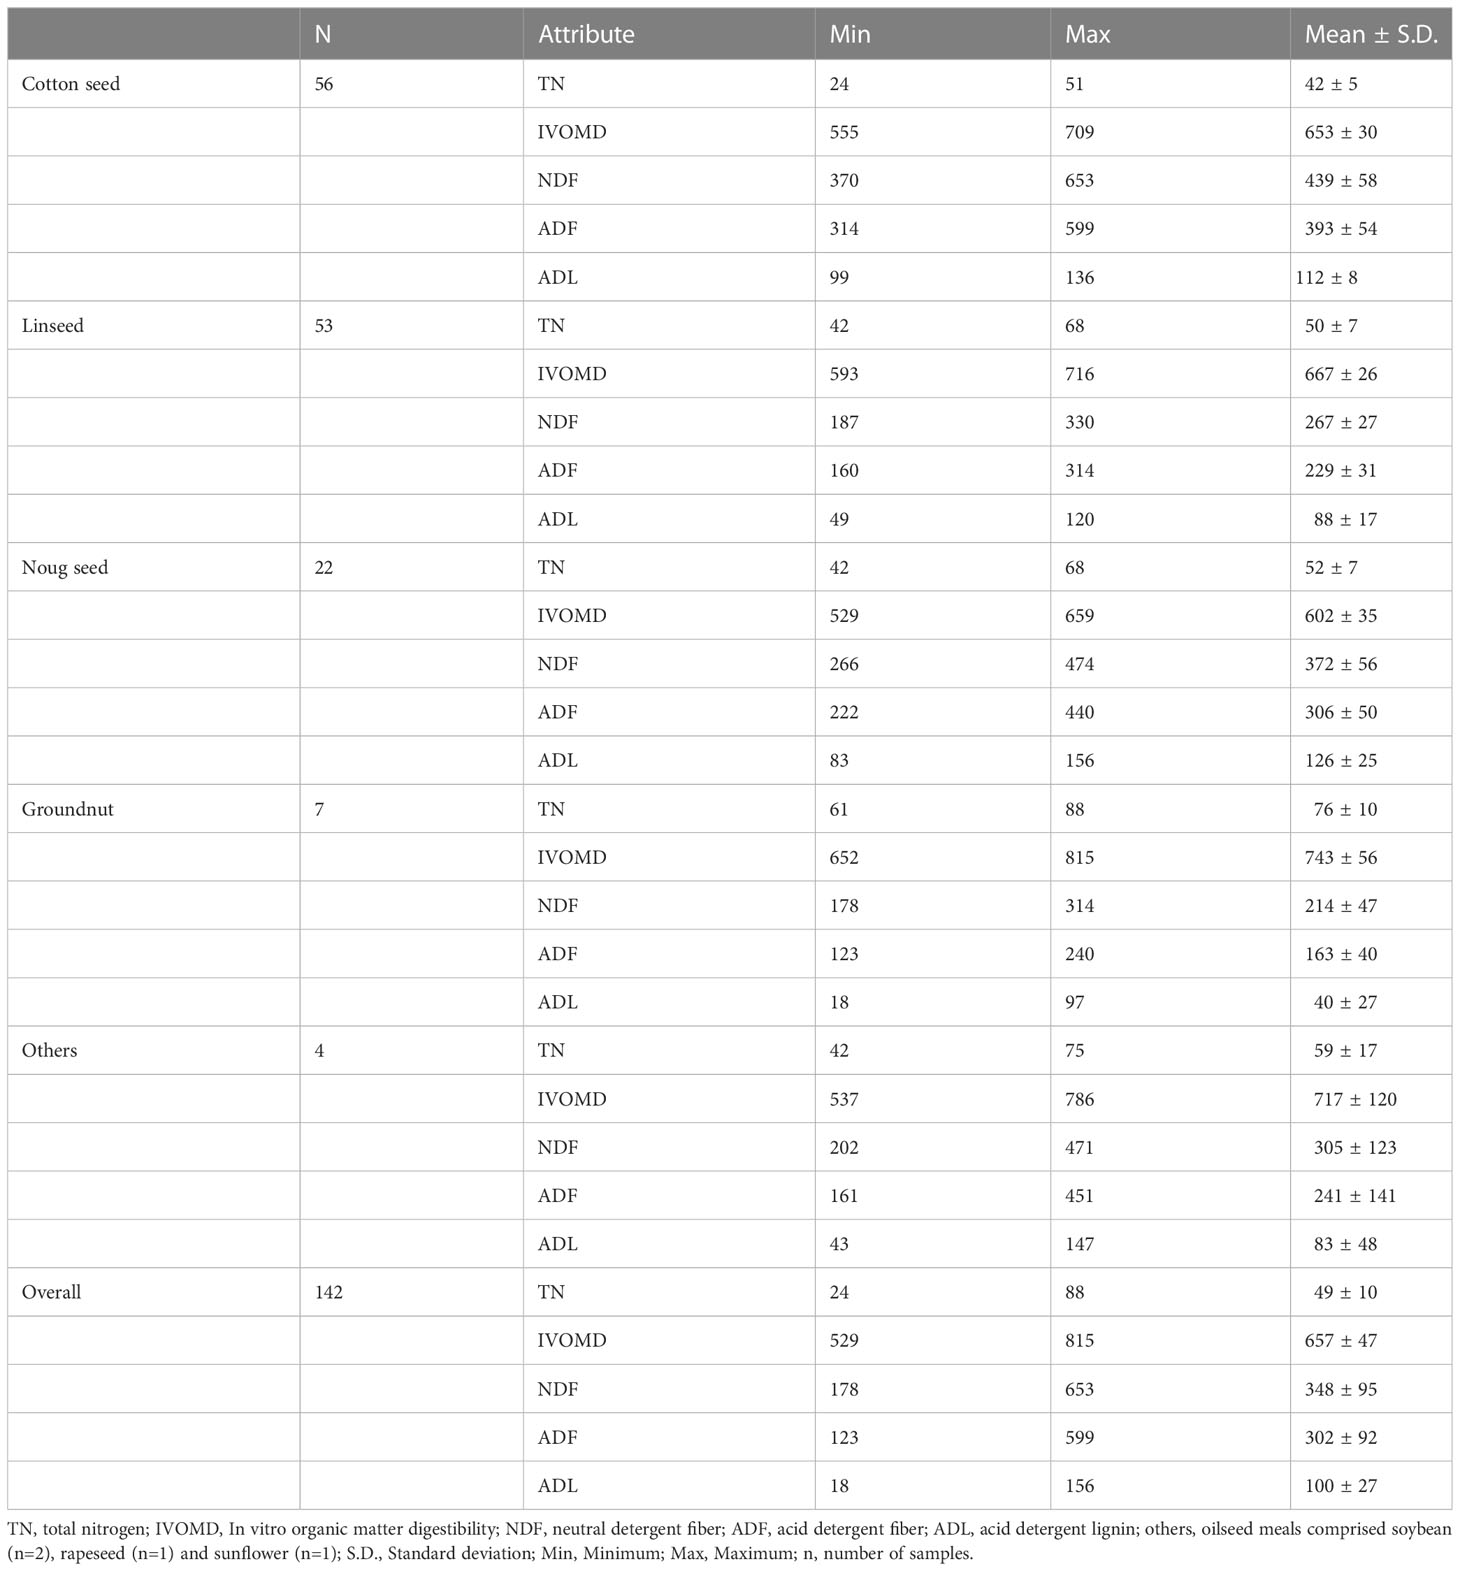
Table 1 Chemical composition (g/kg DM) of the oilseed cake samples.
Calibration and accuracy of prediction of total nitrogen and in-vitro organic matter digestibility of oilseed meals
Chemometric analysis of the spectra and the b-coefficients after scatter correction, detrend and first derivative math treatment indicated that a number of spectral regions in the measured range (915 - 1647 nm contributed to the modified partial least squares calibration equations (Figure 3). Generally, the most important spectral regions contributing to the calibrations were 1000-1100 and 1400-1600 nm, but there were some differences among the feed attributes. The calibration for TN concentration depended primarily on the regions between 940 – 1080 and 1420-1590 nm. However, calibrations for IVOMD content depended primarily on the regions 1020 – 1090 and 1430-1560 nm, and for NDF content 1040-1080 and 1480-1590 nm. Hence the 920-1000 nm region was important for TN but not for IVOMD or NDF. The most important spectral regions to predict ADF and ADL tended to be similar to those for NDF.
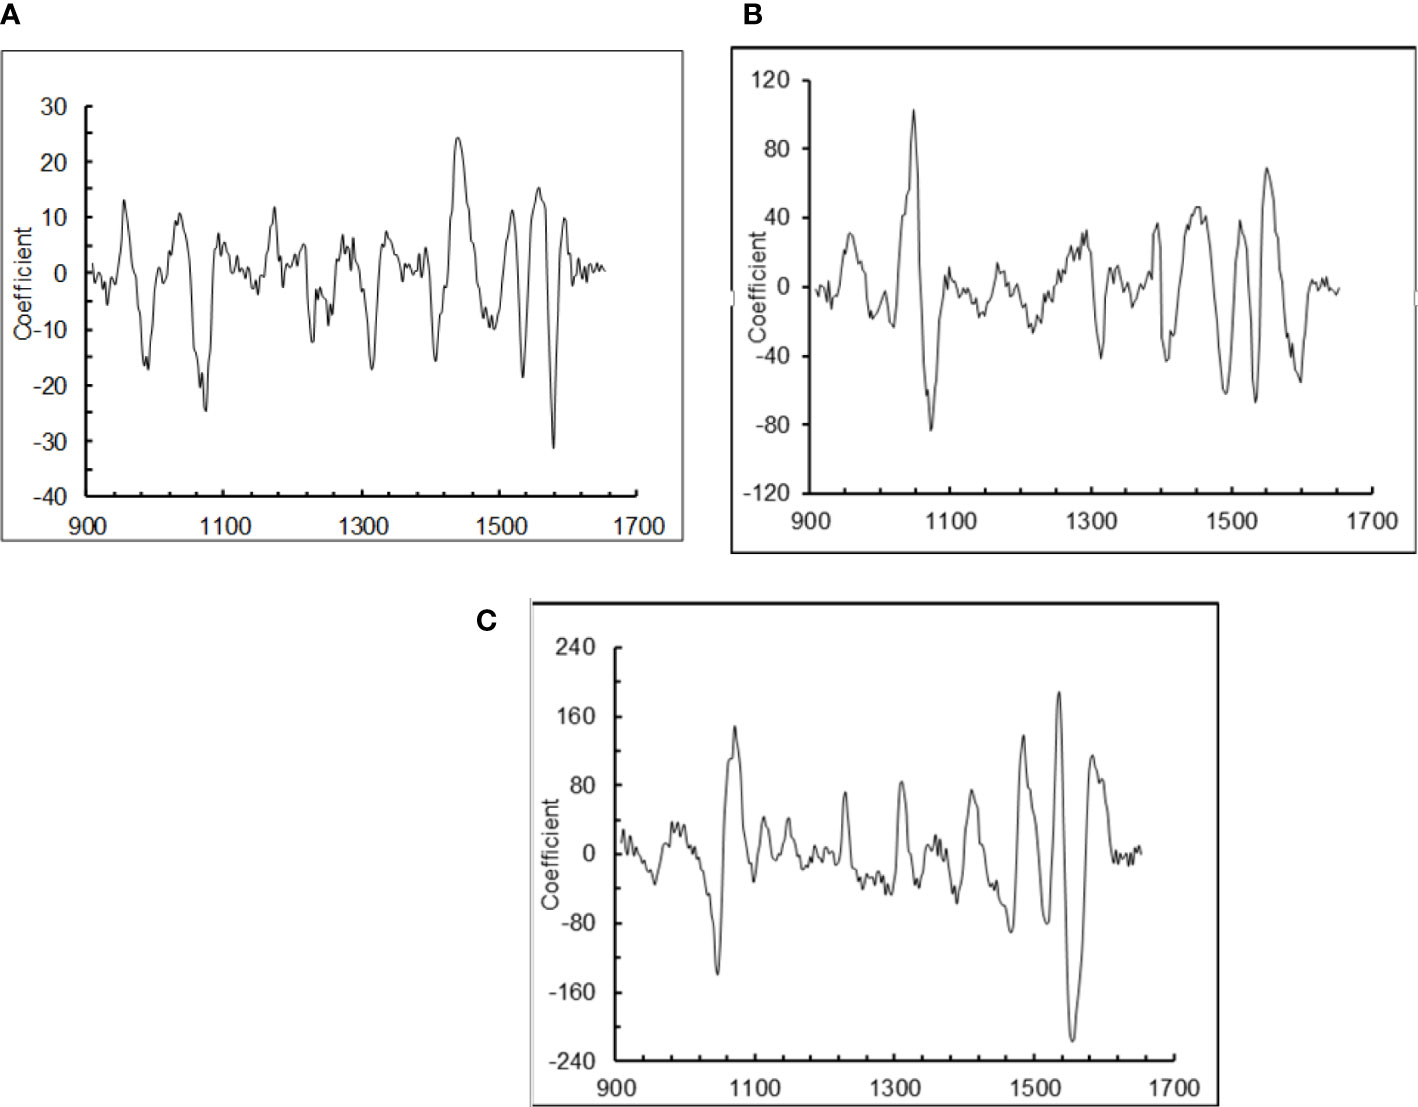
Figure 3 B-coefficients for the pl1 factors in modified partial least squares (MPLS) calibration models following standard normal variate and detrend and first derivative maths transformation of the spectra of oilseed meals that were dried and ground, and scanned 10 times, for prediction of: (A) total N concentration (TN), (B) in vitro organic matter digestibility (IVOMD), and (C) neutral detergent fiber content (NDF) of the oilseed meals. The calibration models used 9, 8 and 8 factors, respectively.
The calibration and prediction equation statistics for the constituents TN and IVOMD of oilseed meals are shown in Table 2. Both the number of scans (i.e. 1, 2 and 10) and grinding of the samples, and their interactions affected the accuracy of the TN and IVOMD calibrations (p<0.001). However, the number of scans had a much greater effect than the sample form. For TN increasing the number of scans of each sample from 1 to 10 decreased the SEP by 51% (from 6.5 to 3.2 g/kg DM) in Gr samples, but surprisingly had little effect on the SEP in UGr material. However, with measurement of IVOMD there was a different pattern where SEP was reduced by 28% due to increasing the number of scans in both Gr and UGr samples; also the SEP was consistently lower in unground samples. The highest R2 for calibration and validation for N and IVOMD were obtained for Gr samples scanned ten times (calibration 0.95 and 0.89, validation 0.91 and 0.81, respectively). The relationships between the reference and predicted values for Gr samples scanned 10x are shown in Figure 4.
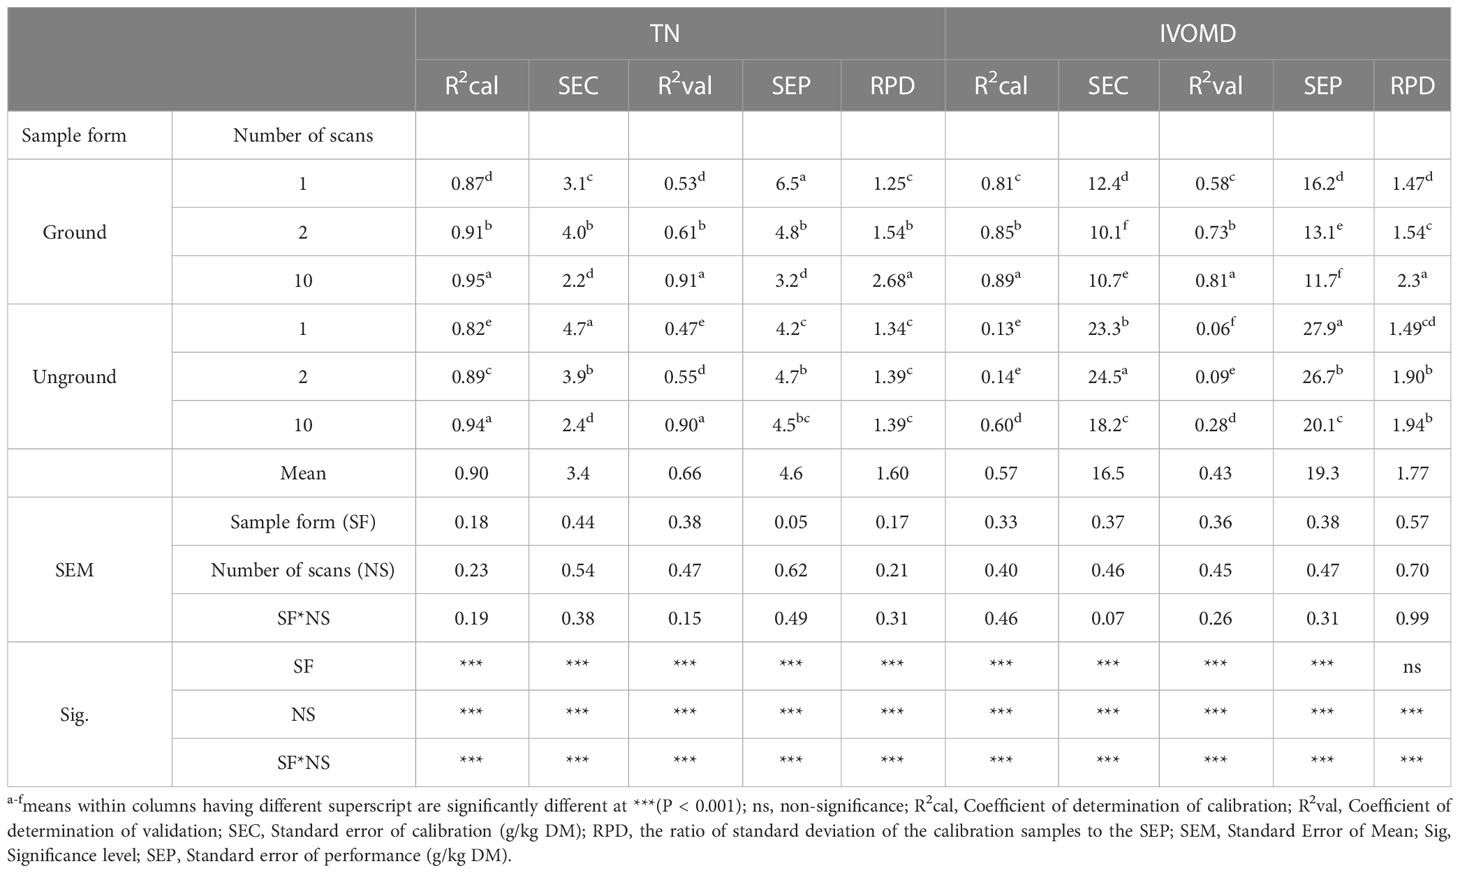
Table 2 Effects of scanning and sample form on the accuracy of predicting of total nitrogen (TN) and in-vitro organic matter digestibility (IVOMD) content of oilseed meals using a Tellspec handheld NIRS.
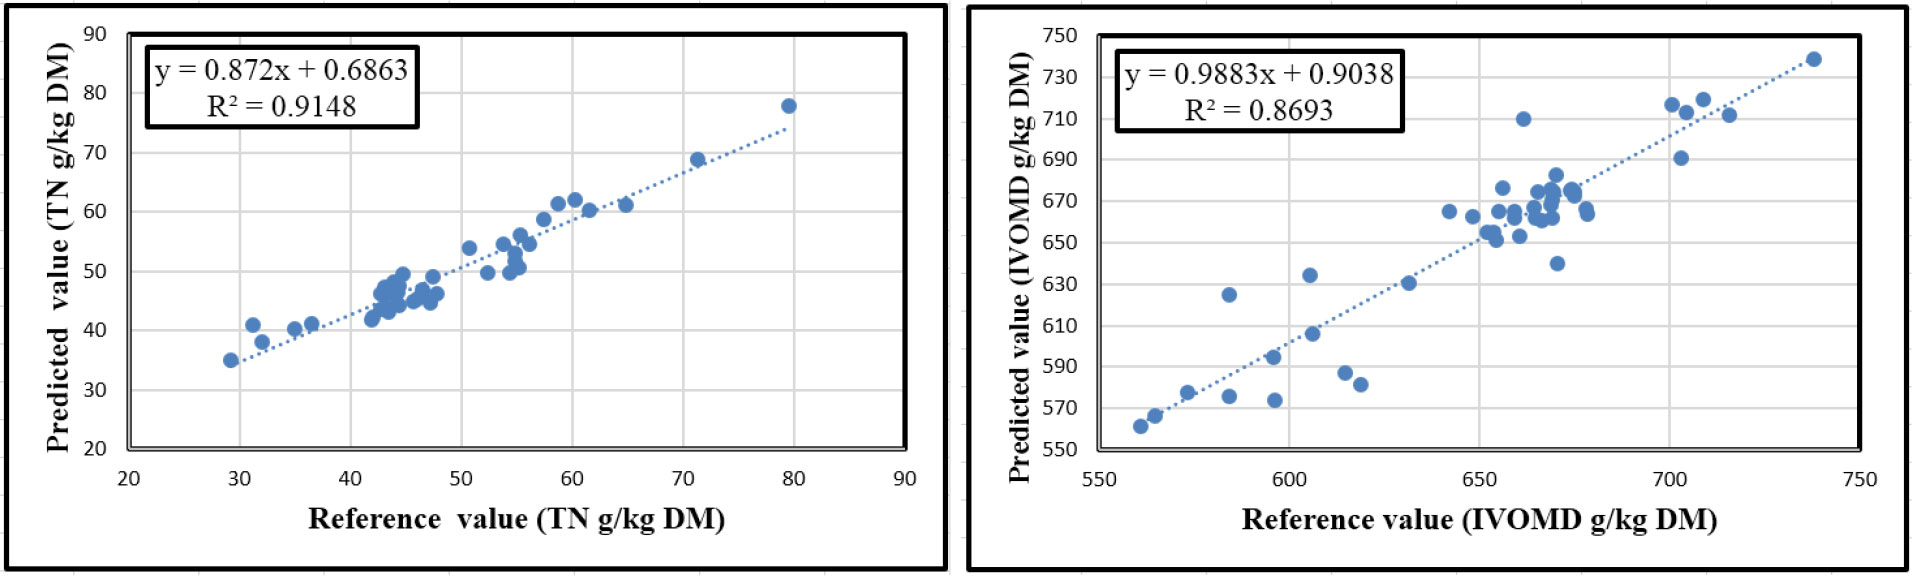
Figure 4 The relationships between laboratory determined and NIRS predicted values for TN (right) and IVOMD (left) values of Gr oilseed cake samples scanned ten times.
Calibration and accuracy of prediction of neutral detergent fiber, acid detergent fiber, and acid detergent lignin concentration of oilseed meals
The fiber composition of oilseed cake samples as NDF, ADF, and ADL were accurately predicted (Table 3). The statistics of R2cal, SEC, R2val, and SEP were significantly affected by the interaction between the numbers of scans and grinding of samples (P<0.001). The highest R2cal for NDF and ADL were found for Gr (0.98 and 0.93, respectively) and UGr samples scanned ten times (0.97 and 0.93, respectively), whereas the maximum (0.92 and 0.94) R2val for these parameters were obtained for Gr samples scanned ten times, respectively. Similarly, the best R2cal and R2val for ADF were observed for Gr samples scanned ten times (0.96 and 0.90), respectively. For NDF and ADF increasing the number of scans of each sample from 1 to 10 reduced the SEP in Gr samples by 50% (from 53.8 to 26.9 g/kg DM) and 52% (from 53.1 to 25.3 g/kg DM), respectively, but not in UGr samples. However, when ADL was measured, the SEP was lowered by 67% (from 20.4 to 6.8 g/kg DM) due to increasing the number of scans in Gr samples, but there was little effect in UGr samples (23% reduction from 13.8 to 10.7). The relationships between the reference and predicted values for Gr samples scanned 10x are shown in Figure 5.
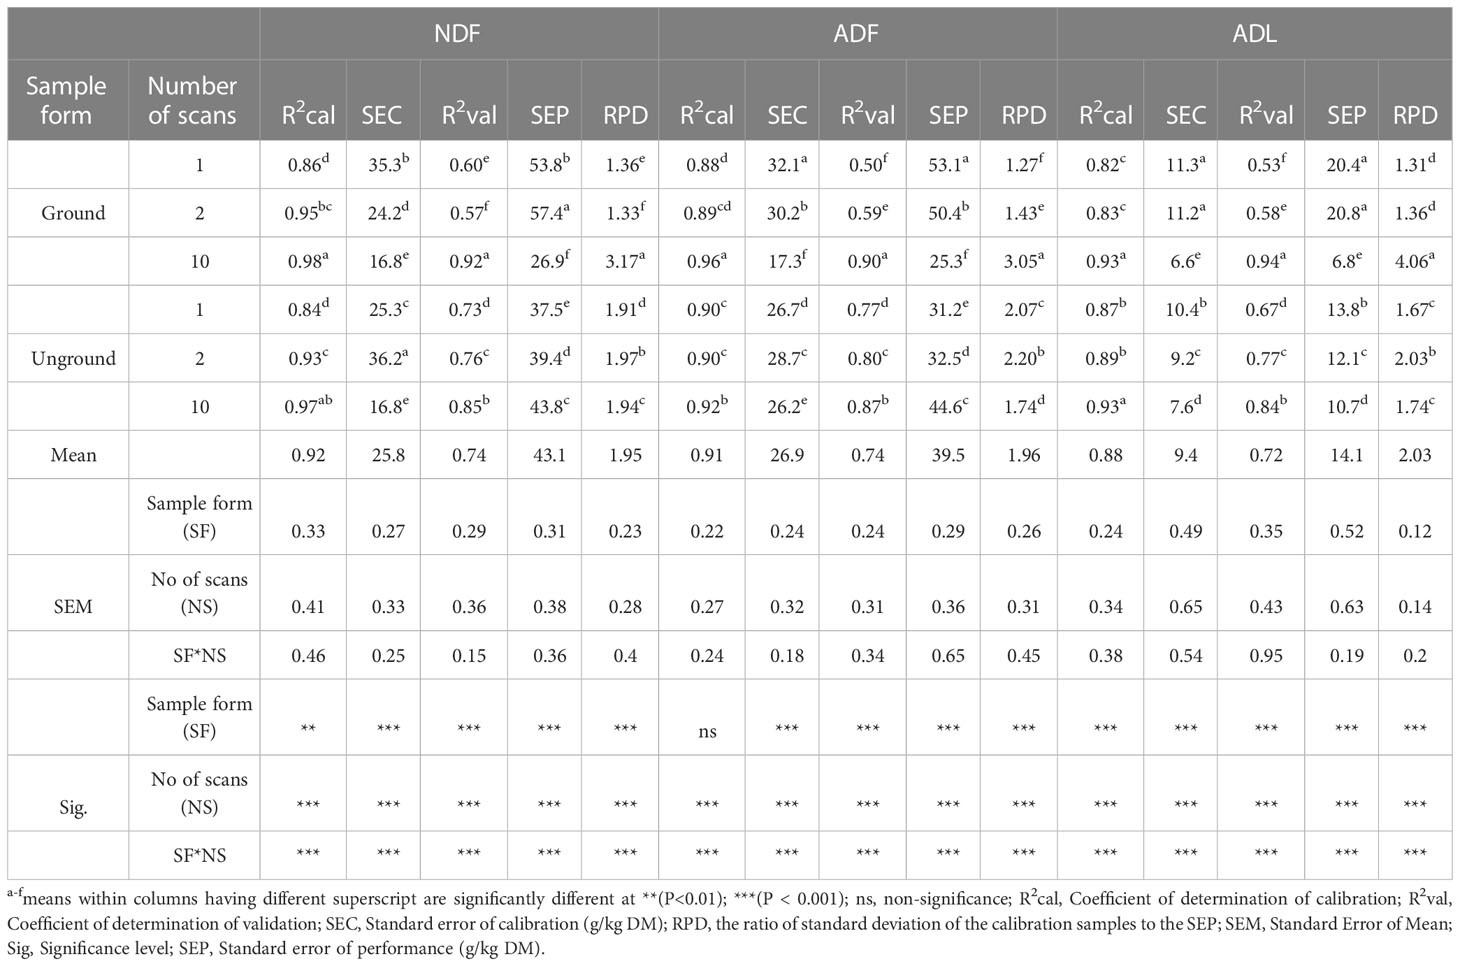
Table 3 Effect of the number of scans, sample form and their interaction on the accuracy of predicting neutral detergent fiber (NDF), acid detergent fiber (ADF), and acid detergent lignin (ADL) content of oilseed meals using a Tellspec handheld NIRS.
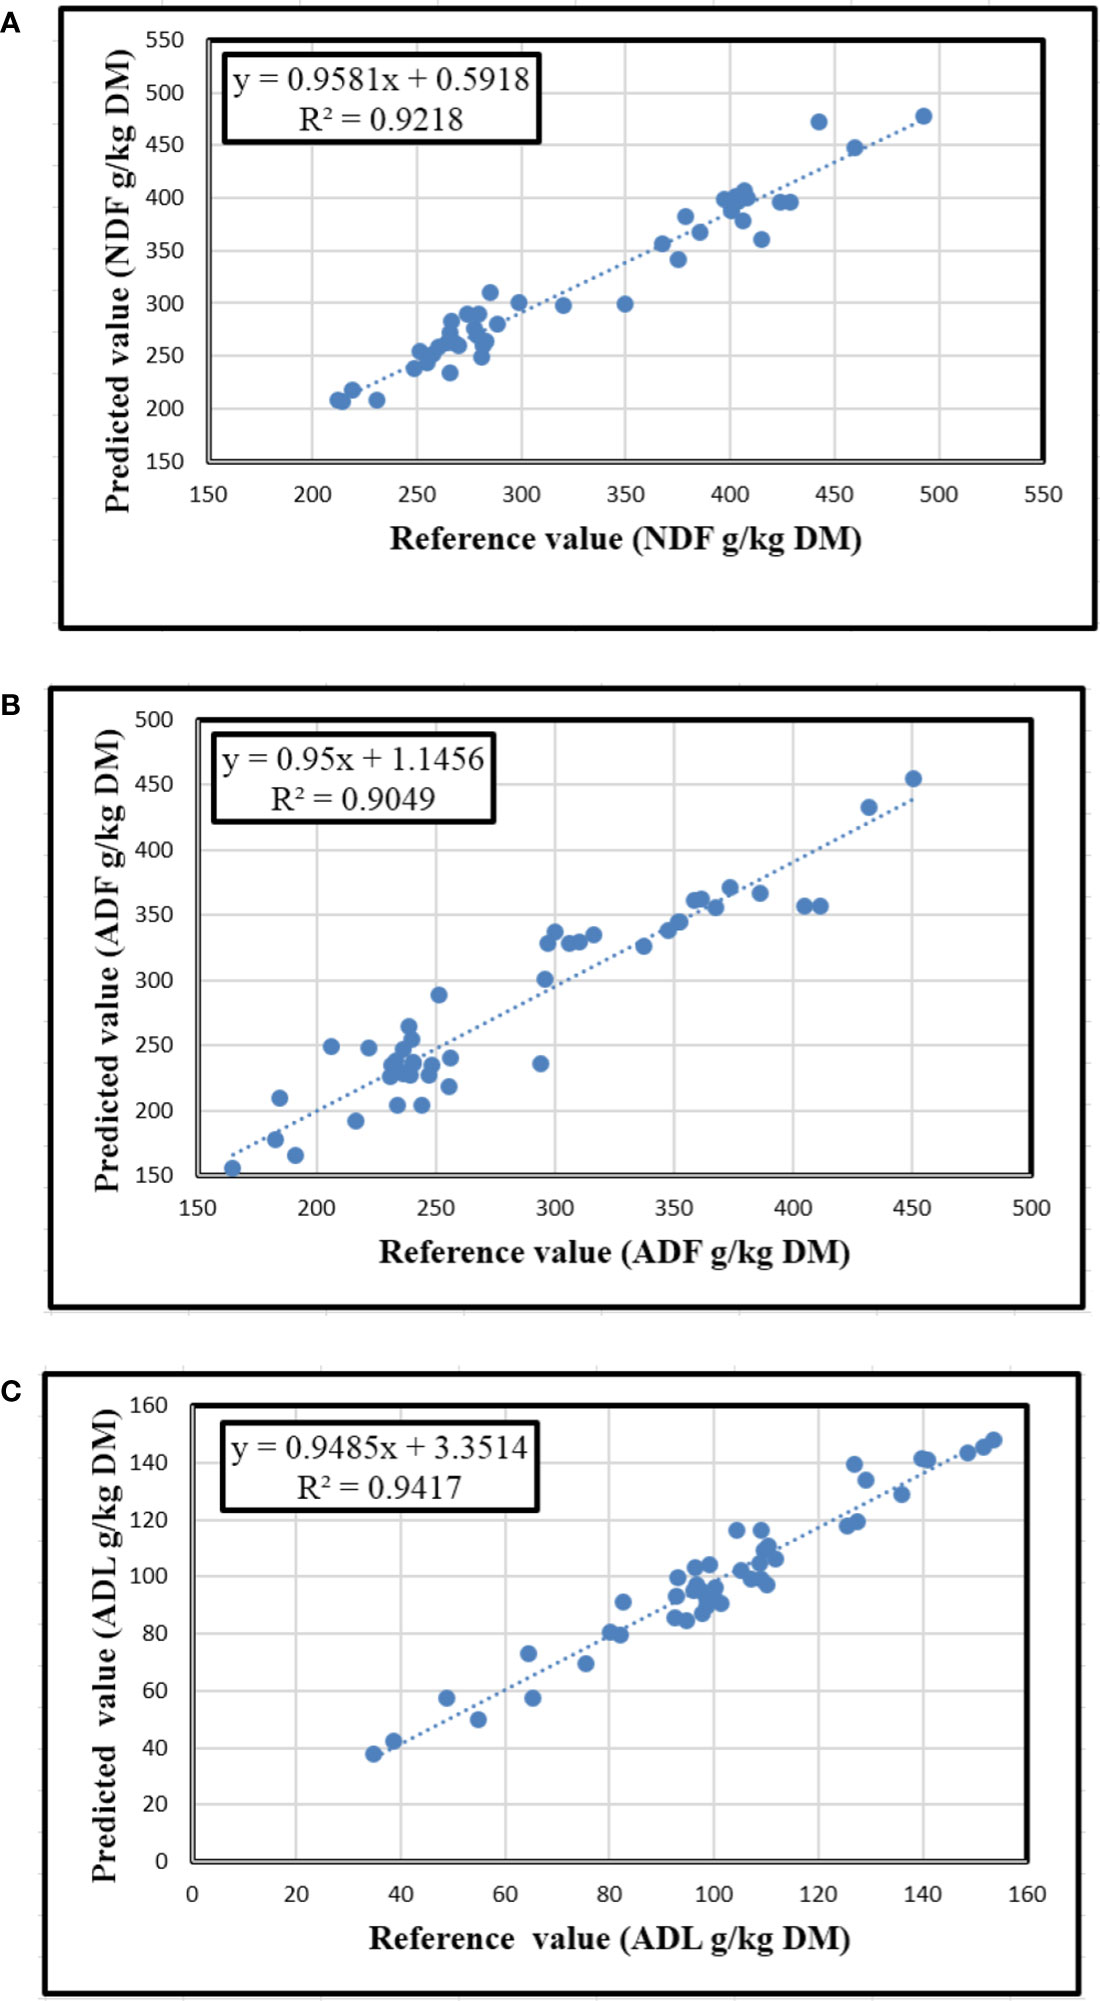
Figure 5 The relationships between laboratory determined and NIRS predicted values for NDF (A), ADF (B), and ADL (C) contents of Gr oilseed cake samples scanned ten times.
Discussion
Chemical composition of reference samples
The high variation in the chemical composition of the oilseed meals analyzed is a positive factor for calibration when predicting the composition of different types of feeds (Naes et al., 2002; Arzani et al., 2012). The overall mean of the total nitrogen (TN) content in the current study were in accordance with other studies e.g. the findings of Adugna (2008), who found TN content of oilseed meals ranging from 46.7 to 58.3 g/kg DM, and Fekede et al. (2015), who reported an average TN content of 45.7 to 57.2 g/kg DM g/kg DM for oilseed meals in the central highlands of Ethiopia. Likewise, the observed mean IVOMD was comparable with those reported by the above authors. However, in the current study, the mean ADF content was higher than reported by Fekede et al. (2015). The observed variations in the chemical composition of oilseed cake samples might be associated with the type of the oilseed cake, the method, and efficiency of extracting oil from the seeds, and environmental conditions for crop growth (Adugna, 2008; Fekede et al., 2015). This large variability in chemical composition of reference samples was considered suitable to develop NIRS calibrations (Dardenne et al., 2000).
Calibration and validation statistics
There is extensive evidence in the literature that NIR spectroscopy is suitable for evaluating the TN content of various types of animal feeds (Andueza et al., 2011; Chen et al., 2015; Rushing et al., 2016). The observed R2 values for prediction of TN in the present study were consistent with findings from Rukundo et al. (2021), who reported R2cal (0.96) and R2val (0.90) on mixed feeds using Foss and ASD Quality NIRS instruments, respectively. However, the R2cal value was higher than the reports of Aufrere et al. (1996); Modrono et al. (2017), and Wiedemair et al. (2019) who reported using Foss 6500 (0.92), Phazir (0.91), and Phazir (0.57) spectrophotometers for compound feeds, respectively, and lower than the study of Perez-Marin et al. (2004) who found 0.98 and 0.97 on ground and unground compound feeds, respectively, using Foss 6500 instrument. In the present study, the standard error of calibration (SEC) and standard error of prediction (SEP) for TN were lower than in previous studies reported by Aufrere et al. (1996); Swart et al. (2012), and Modrono et al. (2017). Also the results of the current study showed that as the number of scans increased from one to ten, the SEC decreased by 29% (from 3.1 to 2.2 g/kg DM) and 49% (from 4.7 to 2.4 g/kg DM) on D&Gr and UGr samples, respectively. Likewise, the SEP decreases by 51% (from 6.5 at one scan to 3.2 g/kg DM at ten scans) on Gr samples.
Apart from the TN content, the quality trait most frequently measured by NIR spectroscopy in forage crops is digestibility. The IVOMD calibration model had a greater R2cal (0.89) than those found previously by Rukundo et al. (2021) on mixed feeds and forage with a Foss XDS (0.82), Foss 6500 (0.80), and Tellspec (0.83) NIRS instruments and by Xiccato et al. (2003) who found (0.84) using a Foss 6500 with compound feeds. However, the R2cal and R2val values for the IVOMD model were lower than the values reported by Prasad et al. (2019) on roughage feeds using a Phazir (0.96) and Tellspec (0.91). This could be related to the narrow range of values found in the samples analysed for this parameter, in contrast to that of TN, NDF, ADF and ADL. The SEC value for IVOMD in the present study was in line with the report of Prasad et al. (2019) (26.3 g/kg DM) using a Tellspec handheld NIRS instrument on roughage feeds but lower than the report of Dereje et al. (2010) on natural pasture hay (41.2 g/kg DM) using a Foss 5000, and higher than the findings of Andueza et al. (2001) on alfalfa hay (20.5 g/kg DM) using a Foss 6500, and Prasad et al. (2019) on roughage feeds (20.8 g/kg DM) using a Phazir instrument. Similarly, the SEP for IVOMD prediction was lower than the study carried out by Rukundo et al. (2021) using Tellspec (34.5), Foss XDS (40.0), Foss 6500 (41.7), and ASD Quality (40.8) instruments. The present study indicated that when the number of scans increased from one to ten, the SEC decreased 14% (from 12.4 to 10.7 g/kg DM) and 22% (from 23.3 to 18.2 g/kg DM) on ground and unground samples, respectively. The SEP IVOMD prediction decreased as well by 29% (from 27.9 to 20.1) on UGr samples, and by 28% (from 16.2 to 17 g/kg DM) on Gr samples when the scanning frequency increased from one scan to ten scans.
Many studies showed that NDF and ADF concentrations could be well predicted by NIRS in forage (Chen et al., 2015; Rushing et al., 2016). In this study, the performance of the models for NDF and ADF were successful and the precision of the models was consistent with previous studies (Prasad et al., 2019; Mazabel et al., 2020). The R2cal value for the NDF equation in the current study was higher than those from the study reported by Aufrere et al. (1996); Modrono et al. (2017), and Swart et al. (2012) in compound feed and total mixed ration using Foss 6500 (0.92), Phazir (0.91), and FT-NIR (0.94), respectively. This finding shows that 98% and 97% of the observed variation in NDF concentration in both UGr and Gr oilseed cake samples, respectively, was explained by NIRS scans when samples were scanned ten times. Similarly, the accuracy of the Tellspec handheld NIRS to predict the NDF content of ground oilseed cake samples scanned in locally available plastic bags was excellent and the observed R2val (92%) fitted the regression line, or 92% of the variation observed on dependent variables was explained by independent variables. The SEC for the NDF equation was in accordance with the study conducted by Prasad et al. (2019). Likewise, the R2val value for the NDF prediction was in agreement with the report of Mazabel et al. (2020) and Andueza et al. (2001) on Brachiaria grass (0.92) and alfalfa hay (0.92), respectively. Similarly to other parameters, the SEC and SEP for NDF decreases by 52 and 50% as the scanning frequency increase from one to ten, respectively. Although the precision of the NDF (0.92) and ADF (0.90) models was also lower when compared to ADL (0.94), they were still sufficient to differentiate between high and low NDF and ADF content in oilseed meals.
The findings in the present study revealed that a ‘robust’ calibration was developed for the prediction of ADF content in oilseed cake samples, with higher R2cal (0.96) and R2val (0.90) and lower SEC (32.1 g/kg DM) and SEP (53.1 g/kg DM) values when compared with the results reported by other authors. The precision of the calibration model pertaining to the R2cal value obtained in this study was consistent with Aufrere et al. (1996) on compound feed using Foss 6500 (0.95), Swart et al. (2012) on the total mixed ration using an InfrAlyzer 500 (0.95), and Prasad et al. (2019) on roughage feeds using Tellspec (0.96), but higher than Xiccato et al. (2003) on compound feed using an InfraAlyzer 500 (0.84) instrument. Lyons and Stuth (1992) stated that an R2 value of above 0.90 is considered good for agricultural products. Similarly, the R2val value obtained in this study was in accord with the report of Acosta et al. (2020) on grass (0.87) using a Nano NIRS instrument. It was higher than the study of Rukundo et al. (2021) who reported (0.63) R2val for mixed feed and forage using a Tellspec, and lower than Prasad et al. (2019), who obtained 0.97 and 0.96, respectively, using Phazir and Tellspec instruments on roughage feeds. The SEC and SEP for ADF reduced by 46 and 52%, respectively, when the scanning frequency increases from one to ten on Gr samples.
Among the fiber components, lignin is the one most commonly measured by NIR spectroscopy. Lignin calibrations have been reported mostly for grasses and legume species commonly used to produce hay and pasture in subtropical regions (Roberts et al., 2004). The R2cal (0.93) and R2val (0.94) for ADL was higher than the study reported by Goi et al. (2020) on ground (R2cal = 0.76) and intact (R2cal = 0.78) kibbles using a SCiO instrument, and Despal et al. (2020) on roughage feeds (R2val = 0.77) by FT-NIR, and Rukundo et al. (2021) on mixed feeds (R2val = 0.62). The R2 of validation for ADL in the current study might be an indication of the high performance of the Tellspec instrument to predict the ADL content of unknown samples, and 94% of the observed data fitted the model. The SEC for ADL was comparable with the study conducted by Despal et al. (2020) on roughage feeds (10.9 g/kg DM) by using a FT-NIR instrument and higher than the study of Goi et al. (2020) who reported 0.30 and 0.29 on ground and intact kibble samples, respectively, using a SCiO NIR spectrometer device. The current result indicates that Tellspec has the potential to measure the ADL concentration of both Gr and UGr oilseed cake samples. The observed SEP value for ADL was higher than Despal et al. (2020) findings for roughage feeds (10.7 g/kg DM) using FT-NIR, but lower than Rukundo et al. (2021) results for mixed feeds (13.58) using the Tellspec instrument.
For most of the variables the ratio of standard deviation to the SEP (RPD) g/kg DM found was higher than 3 for NDF (RPD = 3.17), ADF (RPD = 3.05), and ADL (4.06), while RPD were less than 3 for TN (RPD =2.68) and IVOMD (RPD = 2.30). The RPD values represent the ability of the NIRS model to predict the nutrient content of animal feeds (Williams and Sobering, 1993). An RPD value of more than 2 was categorized as a relevant prediction of NIRS (Baillères et al., 2002). In this study, the developed oilseed meals prediction equation was relevant in predicting the oilseed cake samples composition because the RPD value found for TN, IVOMD, NDF, ADF, and ADL were higher than 2 for Gr samples scanned ten times. However, Lobos et al. (2013) gave a higher category (RPD>2.5) as a valid measurement ability of a NIRS model to predict the constituent of a particular feed. In this case, the IVOMD database produced needs to be improved. The low RPD found in the prediction of IVOMD might be related to the interaction between laboratory measurements and the collected spectra of a particular feed. According to Williams (2004) there are five categories of prediction accuracy based on RPD values, i.e., 1) the RPD<1.5 indicated an unusable; 2) the 1.5<RPD<2.0 categorized as the ability of the prediction to distinguish between high and low values; 3) the 2.0<RPD<2.5 produced an “approximate” quantitative prediction; 4) the 2.5<RPD<3.0 reflected a “good” quantitative prediction; and 5) the RPD >3.0 indicated an “excellent” quantitative prediction.
The discrepancy in R2cal, R2val, SEC, SEP, and RPD for TN, IVOMD, NDF, ADF, and ADL might be associated with instrumental differences, feed samples, feed forms, number of scans, scanning material, environmental conditions of crop growth, and the interaction between feed forms and number of scans. Generally, the current results indicate that increasing the number of scans leads to higher R-square values and lower standard errors of calibration (SEC) and standard errors of prediction (SEP). By scanning multiple times the various traits measured could be predicted with reasonable precision, implying that the composition predicted by NIRS agreed closely with that of chemical analysis for the studied quality components.
Conclusion
The results of this study indicate that there is strong potential to use Tellspec handheld NIRS devices to predict the chemical composition of UGr and Gr oilseed cake samples. The accuracy of the prediction was improved by increasing the number of scans per sample and drying and grinding prior to scanning. Therefore it would be important to consider using mobile grinders that can be used in situ prior to spectra collection with a Tellspec NIRS device. Further work to refine the calibration equations taking into account environmental and sample handling factors that affect the spectra data would be important.
Data availability statement
The raw data supporting the conclusions of this article will be made available by the authors, without undue reservation.
Author contributions
MW did the experimental design work, conducted the experiment, conducted NIRS scans, did the laboratory analysis, analyzed the data, wrote, and revised the manuscript. YA and KP supported laboratory analysis, data analysis, and revised the manuscript. AD and MB supported in project conception. FM, MBD, MD, CJ, RD and AD provided support in developing and revising the manuscript. All authors contributed to the article and approved the submitted version.
Funding
This work was funded in whole or part by the United States Agency for International Development (USAID) Bureau for Food Security under Agreement # AID-OAA-L-15-00003 as part of Feed the Future Innovation Lab for Livestock Systems. Funding was also provided by the Bill & Melinda Gates Foundation through the Equip - Strengthening Smallholder Livestock Systems for the Future (grant number OPP11755487) project. Any opinions, findings, conclusions, or recommendations expressed here are those of the authors alone.
Acknowledgments
The authors would like to thank staff of local Officers of Agriculture in the sample collection sites for their support and facilitation. The assistance obtained from ILRI nutrition laboratory, EIAR Livestock Directorate, and Feeds and Nutrition Program is highly appreciated. For the purpose of open access, the author has applied a CC-BY public copyright license to any Author Accepted Manuscript version arising from this submission.
Conflict of interest
The authors declare that the research was conducted in the absence of any commercial or financial relationships that could be construed as a potential conflict of interest.
Publisher’s note
All claims expressed in this article are solely those of the authors and do not necessarily represent those of their affiliated organizations, or those of the publisher, the editors and the reviewers. Any product that may be evaluated in this article, or claim that may be made by its manufacturer, is not guaranteed or endorsed by the publisher.
References
Acosta J. J., Castillo M. S., Hodge G. R. (2020). Comparison of benchtop and handheld near-infrared spectroscopy devices to determine forage nutritive value. Crop Sci. 60, 3410–3422. doi: 10.1002/csc2.20264
Adugna T. (2008). Feed resources and feeding management: a manual for feedlot operators and development workers (Addis Ababa, Ethiopia: Ethiopia Sanitary and Phyto-sanitary Standards and Livestock and Meat Marketing Program (SPS-LMM).
Andueza D., Muñoz F., Garrido A. (2001). The prediction of the nutritive value of Mediterranean alfalfa forage by NIRS (Zaragoza, Spain: Mediterranean seminar), 199–203.
Andueza D., Picard F., Jestin M., Andrieu J., Baumont R. (2011). NIRS prediction of the feed value of temperate forages: efficacy of four calibration strategies. Animal 5, 1002–1013. doi: 10.1017/S1751731110002697
AOAC: Association of Official Analytical Chemists (1995). The official methods of analysis. association of official analytical chemist. 16th (Washington D.C., USA: Sci. Educ.), 69–88.
Arzani H., Sour A., Motamedi J. (2012). Potential of near-infrared reflectance spectroscopy (NIRS) to predict nutrient composition of Bromus tomentellus. J. Rangel. Sci. 2, 635–642.
Aufrere J., Graviou D., Demarquilly C., Perez J. M., Andrieu (1996). Near infrared reflectance spectroscopy to predict energy value of compound feeds for swine and ruminants. Anim. Feed Sci. Technol. 62, 77–90. doi: 10.1016/S0377-8401(96)00995-9
Baillères H., Davrieux F., Ham-Pichavant F. (2002). Near infrared analysis as a tool for rapid screening of some major wood characteristics in a eucalyptus breeding program. Ann. For. Sci. 59 (5-6), 479–490. doi: 10.1051/forest:2002032
Brambilla M., Buccheri M., Grassi M., Stellari A., Pazzaglia M., Romano E., et al. (2020). The influence of the presence of borax and NaCl on water absorption pattern during sturgeon caviar (Acipenser transmontanus) storage. Sensors 20 (24), 7174. doi: 10.3390/s20247174
Cabassi G., Cavalli D., Fuccella R., Gallina P. M. (2015). Evaluation of four NIR spectrometers in the analysis of cattle slurry. Biosyst. Eng. 133, 1–13. doi: 10.1016/j.biosystemseng.2015.02.011
Chadalavada K., Anbazhagan K., Ndour A., Choudhary S., Palmer W., Flynn J. R., et al. (2022). NIR instruments and prediction methods for rapid access to grain protein content in multiple cereals. Sensors 22 (10), 3710. doi: 10.3390/s22103710
Chen J., Zhu R., Xu R., Zhang W., Shen Y., Zhang Y. (2015). Evaluation of Leymus chinensis quality using near-infrared reflectance spectroscopy with three different statistical analyses. Peer J. 3, 1416. doi: 10.7717/peerj.1416
Crocombe R. A. (2018). Portable spectroscopy. Appl. Spectrosc. 72, 1701–1751. doi: 10.1177/0003702818809719
Dardenne P., Sinnaeve G., Baeten V. (2000). Multivariate calibration and chemometrics for near infrared spectroscopy. J. Near Infrared Spectrosc. 8, 229–237. doi: 10.1255/jnirs.283
Dela Roza-Delgado B., Soldado A., de Faria Oliveira A. F. G., Martinez-Fernandez A., Argamenteria A. (2014). Assessing the value of a portable near infrared spectroscopy sensor for predicting pork meat quality traits of “Asturcelta autochthonous swine breed”. Food Anal. Methods 7, 151–156. doi: 10.1007/s12161-013-9611-y
Dereje F., Siyoum B, Aemiro K, Tadesse D, Getu K, Getnet A. (2010). Near infrared reflectance spectroscopy (NIRS) for determination of chemical entities of natural pasture from Ethiopia. Agric. Biol. J. N. Am. 1 (5), 919–922. doi: 10.5251/abjna.2010.1.5.919.922
Despal D., Sari L. A., Chandra R., Zahera R., Permana I. G., Abdullah L. (2020). Prediction accuracy improvement of Indonesian dairy cattle fiber feed compositions using near-infrared reflectance spectroscopy local database. Trop. Anim. Sci. 43, 263–269. doi: 10.5398/tasj.2020.43.3.2635
Fekede F., Getu K., Getnet A. (2015). Nutritional qualities of agro-industrial by-products and local supplementary feeds for dairy cattle feeding. Ethiop. J. Agric. Sci. 26, 13–26.
Font R., del Rio-Celestino M., de Haro-Bailon A. (2006). The use of near-infrared spectroscopy (NIRS) in the study of seed quality components in plant breeding programs. Ind. Crops Prod. 24, 307–313. doi: 10.1016/j.indcrop.2006.06.012
Garrido-Varo A., Vega S., Maroto-Molina F., de la Haba M. J., Pérez-Marín D. (2016). On-site quality control of processed land animal proteins using a portable micro-electro-mechanical-systems near infrared spectrometer. J. Near Infrared Spectrosc. 24, 47–58. doi: 10.1255/jnirs.1192
Goi A., Simoni M., Righi F., Visentin G., De Marchi M. (2020). Application of a handheld near-infrared spectrometer to predict gelatinized starch, fiber fractions, and mineral content of ground and intact extruded dry dog food. Animals 10, 1660. doi: 10.3390/ani10091660
Lobos I., Gou P., Hube S., Saldaña R., Alfaro M. (2013). Evaluation of potential NIRS to predict pastures nutritive value. J. Soil Sci. Plant Nutr. 13 (2), 463–468. doi: 10.4067/S0718-95162013005000036
Lundberg K., Hoffman P., Bauman L., Berzaghi P. (2004). Prediction of forage energy content by near infrared reflectance spectroscopy and summative equations. Prof. Anim. Sci. 20, 262–269. doi: 10.15232/S1080-7446(15)31309-7
Lyons R. K., Stuth J. W. (1992). Faecal NIRS equations for predicting diet quality of free ranging cattle. J. Range Manage. 45, 238–244. doi: 10.2307/4002970
Mazabel J., Worthington M., Castiblanco V., Peters M., Arango J. (2020). Using near infrared reflectance spectroscopy for estimating nutritional quality of Brachiaria humidicola in breeding selections. Agrosystems Geosci. Environ. 3, 20070. doi: 10.1002/agg2.20070
Modrono S., Soldado A., Martínez-Fernández A., de la Roza-Delgado B. (2017) Handheld NIRS sensors for routine compound feed quality control: real time analysis and field monitoring (Accessed 15 June 2022).
Naes T., Isaksson T., Fearn, Davies T. (2002). A user-friendly guide to multivariate calibration and classification (Chichester, UK: NIR Publications).
NRC (National Research Council) (2001). Nutrient requirements of domestic animals, no. 4. nutrient requirements of beef cattle 6th rev. ed (Washington D.C., USA: National Academy Press).
O’Brien N. A., Hulse C. A., Friedrich D. M., Van Milligen F. J., von Gunten M. K., Pfeifer F., et al. (2012). “Miniature near-infrared (NIR) spectrometer engine for handheld 531 applications,” in Next-generation spectroscopic technologies, international society for optics and photonics, 8374
Perez Marin D., Fearn T., Guerrero J. E., Garrido-Varo A. (2009). A methodology based on NIR-microscopy for the detection of animal protein by-products. Talanta 80, 48–53. doi: 10.1016/j.talanta.2009.06.026
Perez-Marin D. C., Garrido-Varo A., Guerrero-Ginel J. E., Gomez-Cabrera A. (2004). Near-infrared reflectance spectroscopy (NIRS) for the mandatory labelling of compound feedingstuffs: chemical composition and open-declaration. Anim. Feed Sci. Technol. 116, 333–349. doi: 10.1016/j.anifeedsci.2004.05.002
Perez-Marin D., Paz P., Guerrero J. E., Garrido-Varo A., Sanchez M. T. (2010). Miniature handheld NIR sensor for the on-site non-destructive assessment of post-harvest quality and refrigerated storage behavior in plums. J. Food Engineering. 99, 294–302. doi: 10.1016/j.jfoodeng.2010.03.002
Pierna J. A. F., Vermeulen P., Lecler B., Baeten V., Dardenne P. (2010). Calibration transfer from dispersive instruments to handheld spectrometers. J. Appl. Spectrosc. 64, 644–648. doi: 10.1366/000370210791414353
Prado N., Fernandez-Ibanez V., Gonzalez P., Soldado A. (2011). On-site NIR spectroscopy to control the shelf life of pork meat. Food Anal. Methods 4, 582–589. doi: 10.1007/s12161-011-9208-2
Prasad K. V. S. V., Asmare Y., Melesse A., Kosmowski F., Varijakshapanicker P., Blummel M. (2019). Mobile and hand-held near infrared spectrometers in feed evaluation―Solutions to challenges? International Conference on Animal Nutrition (INCAN 2019), Kolkata, India, 17-19 December 2019, Animal Nutrition Society of India
Ramirez J. A., Posada J. M., Handa I. T., Hoch G., Vohland M., Messier C., et al. (2015). Near-infrared spectroscopy (NIRS) predicts non-structural carbohydrate concentrations in different tissue types of a broad range of tree species. Methods Ecol. Evol. 6, 1018–1025. doi: 10.1111/2041-210X.12391
Roberts C. A., Stuth J., Flinn P. C. (2004). “Analysis of forages and feedstuffs,” in Near infrared spectroscopy in agriculture, vol. 44 . Eds. Roberts C. A., Workman J., Reeves J. B. (Madison, Wisconsin, USA: American Society of Agronomy), 231–269.
Rukundo I. R., Danao M. G. C., MacDonald J. C., Wehling R. L., Weller C. L. (2021). Performance of two handheld NIR spectrometers to quantify crude protein of composite animal forage and feedstuff. AIMS Agric. Food. 6, 463–478. doi: 10.3934/agrfood.2021027
Rushing J. B., Saha U. K., Lemus R., Sonon L., Baldwin B. S. (2016). Analysis of some important forage quality attributes of southeastern wildrye (Elymus glabriflorus) using near-infrared reflectance spectroscopy. Am. J. Analytical Chem. 7, 642. doi: 10.4236/ajac.2016.79060
Smith K. F., Flinn P. C. (1991). Monitoring the performance of a broad-based calibration for measuring the nutritive value of two independent populations of pasture using near infrared reflectance (NIR) spectroscopy. Aust. J. Exp. Agric. 31, 205–210. doi: 10.1071/EA9910205
Swart E., Brand T. S., Engelbrecht J. (2012). The use of near-infrared spectroscopy (NIRS) to predict the chemical composition of feed samples used in ostrich total mixed rations. S. Afr. J. Anim. Sci. 42, 550–554. doi: 10.4314/sajas.v42i5.22
Tedeschi L. O., Cannas A., Fox D. G. (2010). A nutrition mathematical model to account for dietary supply and requirements of energy and other nutrients for domesticated small ruminants-the development and evaluation of the small ruminant nutrition system. Small Ruminant Res. 89, 174–184. doi: 10.1016/j.smallrumres.2009.12.041
Tilley J. M. A., Terry R. A. (1963). A two-stage technique for the in vitro digestion of forage crops. J. Br. Grassland Soc 18, 108–112. doi: 10.1111/j.1365-2494.1963.tb00335.x
Van Soest P. J., Robertson J. B. (1985). Analysis of forages and fibrous feeds. Lab. Manual Anim. Sci. 613. Cornell University, New York, USA.
Westad F., Marini F. (2015). Validation of chemometric models – a tutorial. Analytica Chim. Acta 893, 14–24. doi: 10.1016/j.aca.2015.06.056
Wiedemair V., Mair D., Held C., Huck C. W. (2019). Investigations into the use of handheld near-infrared spectrometer and novel semi-automated data analysis for the determination of protein content in different cultivars of Panicum miliaceum L. Talanta. 205, 120115.
Williams P. C. (2001). “Implementation of near-infrared technology,” in Near-infrared technology in the agricultural and food industries: (2nd ed). Eds. Williams P. C., Norris K. H. (American Association of Cereal Chemists), 145–167.
Williams P. (2004). “Near-infrared technology, getting the best out of light,” in A short course in the practical implementation of near-infrared spectroscopy for the user (Winnipeg, Manitoba, Canada: PDK Grain: Nanaimo, BC).
Williams P. C., Sobering D. C. (1993). Comparison of commercial near infrared transmittance and reflectance instruments for analysis of whole grains and seeds. J. Near Infrared Spectrosc. 1 (1), 25–32. doi: 10.1255/jnirs.3
Wittkop B., Snowdon R. J., Friedt W. (2012). New NIRS calibrations for fiber fractions reveal broad genetic variation in Brassica napus seed quality. J. Agric. Food Chem. 60, 2248–2256. doi: 10.1021/jf204936f
Wu L., Li M., Huang J., Zhang H., Zou W., Hu S., et al. (2015). A near infrared spectroscopic assay for stalk soluble sugars, bagasse enzymatic saccharification and wall polymers in sweet sorghum. Bio Resource Technol. 177, 118–124. doi: 10.1016/j.biortech.2014.11.073
Xiccato G., Trocino A., de Boever J. L., Maertens L., Carabano R., Pascual J. J., et al. (2003). Prediction of the composition, nutritive value and ingredient composition of European compound feed for rabbits by near infrared reflectance spectroscopy (NIRS). Anim. Feed Sci. Technol. 104, 153–168. doi: 10.1016/S0377-8401(02)00294-8
Keywords: near infrared (NIR) spectroscopy, oilseed, Ethiopia, handheld NIRS instrument, nutritive value
Citation: Walelegne M, Meheret F, Derseh MB, Dejene M, Asmare YT, Prasad KVSV, Jones CS, Dixon RM and Duncan AJ (2023) Near-infrared reflectance spectroscopy using a portable instrument to measure the nutritive value of oilseed meals as livestock feed. Front. Anim. Sci. 4:1203449. doi: 10.3389/fanim.2023.1203449
Received: 10 April 2023; Accepted: 13 June 2023;
Published: 07 July 2023.
Edited by:
Susan Kay Duckett, Clemson University, United StatesReviewed by:
Elio Romano, Centro di ricerca per l’Ingegneria e le Trasformazioni agroalimentari (CREA-IT), ItalyEnrique Pavan, Instituto Nacional de Tecnología Agropecuaria, Argentina
Copyright © 2023 Walelegne, Meheret, Derseh, Dejene, Asmare, Prasad, Jones, Dixon and Duncan. This is an open-access article distributed under the terms of the Creative Commons Attribution License (CC BY). The use, distribution or reproduction in other forums is permitted, provided the original author(s) and the copyright owner(s) are credited and that the original publication in this journal is cited, in accordance with accepted academic practice. No use, distribution or reproduction is permitted which does not comply with these terms.
*Correspondence: Alan J. Duncan, QS5EdW5jYW5AY2dpYXIub3Jn