 Jorge Hidalgo1†
 Zaira M. Estrada-Reyes2,3*†
 Ibukun M. Ogunade4
 Andres A. Pech-Cervantes5
 Thomas Terrill6
 Modoluwamu D. Idowu4Godstime Taiwo4
- 1Department of Animal and Dairy Science, University of Georgia, Athens, GA, United States
- 2Department of Animal Science, North Carolina Agricultural and Technical State University, Greensboro, NC, United States
- 3Department of Animal Sciences, University of Florida, Gainesville, FL, United States
- 4Division of Animal and Nutritional Science, West Virginia University, Morgantown, WV, United States
- 5Department of Agriculture, Food and Resource Sciences, University of Maryland Eastern Shore, Princess Anne, MD, United States
- 6College of Agricultural, Family Sciences, and Technology, Fort Valley State University, Fort Valley, GA, United States
In this study, we estimated genetic parameters for parasite resistance traits and the distribution of runs of homozygosity islands in Florida Cracker sheep. The dataset contained 365 animals with phenotypic records at 38 days post-infection for fecal egg count (FEC), packed cell volume (PCV), FAMACHA score (FAM), and body condition score (BCS). The pedigree file contained 695 animals born between 2016 and 2020 and included 279 individuals with genotypes. Genetic parameters were estimated using a multi-trait model with a Bayesian implementation via Gibbs sampling in the GIBBS3F90 program. Heritability was 0.33 ± 0.09 for FEC, 0.31 ± 0.10 for FAM, 0.22 ± 0.09 for PCV, and 0.19 ± 0.07 for BCS. The genetic correlation between FEC and FAM was 0.51 ± 0.21; the remaining genetic correlations had large posterior standard deviations and yielded 95% posterior intervals including zero or with values out of the parameter space because of our small dataset. Analysis of the distribution of runs of homozygosity islands revealed 113 hot spots with annotated genes related to immune response and parasite resistance traits. Our results suggest that the genetic selection for FAMACHA score can be effective in improving parasite resistance because of its ease of recording, high heritability, and favorable genetic correlation with FEC. Additionally, runs of homozygosity islands related to parasite resistance could harbor important candidate genes for controlling this trait in Florida Cracker sheep.
1 Introduction
Gastrointestinal parasites are a significant threat to sheep farming in the Southern United States; particularly, infection with Haemonchus contortus, which has detrimental effects on production, meat quality, and body condition scores in lambs (Zhong et al., 2016). One of the most sustainable strategies for controlling these infections is selecting for parasite-resistant animals. This method involves breeding individuals with a superior ability to regulate gastrointestinal parasites. Consequently, improved animal survival, health, and productive performance are expected due to cumulative and permanent genetic changes added to the new generations in the population. Additionally, resistant sheep secrete fewer H. contortus eggs in the feces, reducing pasture contamination (Woolaston and Baker, 1996).
Common phenotypes utilized for selecting parasite-resistant individuals include FAMACHA score (FAM), fecal egg count (FEC), packed cell volume (PCV), and productive traits (body weight, ADG, etc.) (Kaplan et al., 2004; Ngere et al., 2017; Ngere et al., 2018; Werne et al., 2023). Previous research on sheep populations suggests that the favored response to selection for parasite resistance originates from directional selection (Estrada-Reyes et al., 2019b), which creates an accumulation of runs of homozygosity (ROH) at specific loci (Chen et al., 2018; Islam et al., 2019). The ROH are contiguous segments of homozygous genotypes. These genotypes form part of identical by descent haplotypes transmitted by the parents to their offspring. The ROH are used to estimate inbreeding levels (Sams and Boyko, 2019) and are indicators of selection signatures (Kim et al., 2013; Metzger et al., 2015; Purfield et al., 2017). For this reason, ROH are commonly used to identify potential genomic regions under selection and candidate genes controlling economically important traits in livestock (Islam et al., 2019; He et al., 2020).
Florida Cracker sheep is a wool breed that evolved under natural selection and has good potential for meat production. The main features of this breed are its exceptional ability to control gastrointestinal parasites (Zajac et al., 1988; Amarante et al., 1999a; Amarante et al., 1999b; Estrada-Reyes et al., 2019a) and its adaptation to hot and humid conditions. This breed descends from Spanish sheep introduced to Florida in 1565 during the Spanish missions and the foundation of St. Augustine city (https://floridacrackersheep.com/history.html). Unfortunately, this breed is an endangered species under critical status (https://livestockconservancy.org/heritage-breeds/heritage-breeds-list/florida-cracker-sheep/). Hence, conservation and breeding programs are crucial to preserve this unique genetic resource. To rescue this breed, a combined breeding and conservation program is needed. This requires information about genetic parameters and inbreeding metrics; therefore, our objectives were 1) to estimate the heritability and genetic correlations for traits used to select for parasite resistance and 2) to study the distribution of ROH islands related to parasite resistance across the genome in the Florida Cracker sheep population.
2 Materials and methods
2.1 Animal population and phenotype collection
The research protocol was approved by the University of Florida Institutional Animal Care and Use Committee (Approval number 201810108). The phenotypes used in this study were recorded on lambs between 3 and 5 months old during the summer from 2018 to 2020 at the largest commercial Florida Cracker sheep farm (Fairmeadow sheep farm) in Ocala, Florida. This farm uses a strict breeding program that avoids mating between related individuals. Before phenotype collection, experimental lambs were dewormed with levamisole (18 mg per kg of body weight). Then, ten days post-deworming, fecal samples were collected to verify FEC reduction. After this, lambs returned to the commercial farm and were naturally infected with H. contortus. The FEC assays were performed following the methodology described by Zajac and Conboy (2012). Briefly, fecal samples were collected from the rectum of each lamb and transported to the laboratory for analysis. Samples were processed using a saturated saline solution (NaCl). Quantification of eggs per gram of feces was performed by microscopic visualization using a McMaster chamber (Gordon and Whitlock, 1939).
Phenotypic records for FEC, packed cell volume (PCV), FAM, and body condition score (BCS, 1-5) were measured 38 days post-infection with H. contortus. The FEC assessment was performed as described above. The FAMACHA score was evaluated using the FAMACHA card (Van Wyk and Bath, 2002). The BCS was performed using a 1 5 scoring system and by palpation and visualization of the lumbar region according to the methodology described by Russel et al. (1969). The PCV was assessed using the microhematocrit method. PCV values from 27 45% were considered normal (Dargie and Allonby, 1975). The dataset contained 365 animals with phenotypic records at 38 days post-infection (natural Haemonchus contortus infection) for FEC, PCV, FAM, and BCS. The pedigree file comprised 695 animals born between 2016 and 2020, the progeny of 33 sires and 145 dams. The normality of data was assessed using the Shapiro-Wilk test. Then, the R “car” library was used to perform the Box-Cox transformation and to estimate the power parameter λ. Then, logarithmic transformation for FEC, which was not normally distributed, was carried out as follows: (log (FEC+1)).
2.2 Genotyping
Out of the 365 animals with phenotypic records, only 300 individuals with extreme phenotypes were selected for genotyping. Blood was collected from the jugular vein of each sheep using vacutainer tubes with anticoagulant EDTA to extract DNA using DNeasy Blood and Tissue Kit (Qiagen, Valencia, CA) according to the manufacturer’s instructions and stored at 20°C. The DNA yield was calculated using the NanoDrop‐1000 at 260 nm (NanoDrop‐1000, Thermo Scientific). The DNA purity was evaluated using a ratio of 260/280 nm. Lambs were genotyped with the GGP Ovine 50K single nucleotide polymorphisms (SNPs) chip (GeneSeek, Inc., Lincoln, NE).
The initial SNP data included 45,205 SNPs and were utilized for quality control. Linkage Disequilibrium (LD) pruning was performed using the default options in the SNP and Variation Suite (SVS, Golden Helix, Inc., Bozeman, MT, USA), for this procedure, a sliding window of 50 SNPs with a 5 SNP increment, and a cutoff of R2 = 0.5 was utilized. Additional quality control was performed using the PREGSF90 software (Misztal et al., 2014) to remove duplicated genotypes, monomorphic markers, animals, and markers with call rate< 90%, markers with minor allele frequency< 0.05, markers with departure from the Hardy–Weinberg equilibrium (difference between expected and observed frequency of heterozygous) > 0.15, and animals with parent–progeny Mendelian conflicts. Additionally, non-mapped markers or markers mapped on sexual chromosomes were removed. After quality control, 38,429 SNP remained for 279 genotyped animals.
2.3 Genetic parameters estimation
Variance components, heritabilities, and genetic correlations for the FEC, PCV, FAM, and BCS were estimated using a multi-trait model with a Bayesian inference via the Gibbs sampling algorithm as implemented in the GIBBS3F90 program (Misztal et al., 2014). A single Gibbs chain with a total length of 300,000 iterations was generated. After discarding the initial 30,000 samples as burn-in, 1 in every ten samples was stored to compute means and standard deviations of the posterior distributions. The means were used as estimates of the genetic parameters, and their posterior standard deviations measured their estimation errors.
The multi-trait model was defined as follows:
where are the traits as defined previously; is the vector of phenotypic records; is a vector of systematic effects: year (3 levels; 2018, 2019 and 2020), age group (3, 4 and 5 months old classes), and sex (2 levels; male and female); is the vector of additive direct genetic effects; , and are incidence matrices relating the elements of to elements of and , respectively; is the vector of random residual effects. All random effects were assumed to be multivariate, normally distributed with null expectations and the following covariance structure:
is a 4 4 covariance matrix among traits for additive direct genetic effects, is the Kronecker product, is a 4 4 residual error covariance matrix among traits, and H is a matrix that accounts for pedigree and genomic relationships among animals, and its inverse (), which is needed to construct the mixed model equations, was obtained as in Aguilar et al. (2010).
where, is the inverse of the pedigree relationship matrix, is the inverse of the pedigree relationship matrix among genotyped animals and, is the inverse of the genomic relationship matrix. The construction of the matrix was based on VanRaden’s (2008) first method. Matrix was blended with 5% of the block of the pedigree relationship matrix corresponding to genotyped animals () to avoid singularity problems. The rescaling of to match involved diagonals and off-diagonals as described in Chen et al. (2011).
Uniform prior distributions were assumed for ; where constant. Scaled inverted Wishart prior distributions with scale matrix and degrees of freedom parameter , were assigned to covariance matrices for and to represent vague prior knowledge about these parameters, which presumably have little effect on results:
, and ; is equal to the dimension of . , and are defined as above.
Heritability (h2) for each trait was computed using the following equation:
where , and are the additive and residual variances, respectively.
Genetic correlations ( ) were calculated as:
where is the additive genetic covariance between the two traits, and and are the additive direct genetic variances for trait 1 and trait 2, respectively. Similarly, phenotypic correlations were computed.
2.4 Runs of homozygosity and inbreeding coefficient estimation
Runs of homozygosity and the inbreeding coefficient were estimated in 279 individuals and computed using the Golden Helix SNP and Variation Suite (SVS) 8.7.0 software (Golden Helix, Inc., Bozeman, MT, USA; www.goldenhelix.com). The following criteria were used to define the ROH: (1) one missing SNP and up to one possible heterozygous genotype were allowed in the ROH, (2) the minimum number of SNP that constituted a ROH was set to 30, (3) the minimum SNP density per ROH was set to one SNP every 100 Kb, and (4) the maximum gap between consecutive homozygous SNP was 250 Kb. The computed ROH were then classified into bins based on length:< 0.5 Mb, 0.5 – 2 Mb, > 2 – 5 Mb, > 5 – 10 Mb, > 10 – 20 Mb, and > 20 Mb.
The inbreeding coefficient was computed using the following formula:
where FHOM is the probability of being homozygous by descent, O is the number of observed homozygotes for the individual over all markers, L is the number of genotyped autosomal markers, and E is the number of homozygous expected by chance. This inbreeding coefficient is equivalent to Wright’s within-subpopulation fixation index (Wright, 1922). Estimation of E was performed based on the following formula:
where TAj is the number of non-missing genotypes for marker j, and pj and qj are the allele frequencies p and q for marker j.
2.5 Incidence of common ROH and ROH island identification
The detection of genomic regions with high homozygosity was based on the number of times each SNP appeared in the ROH divided by the number of animals included in the analysis. These values were then plotted against the position of the SNP along the chromosome. ROH islands were analyzed using Golden Helix SVS, defined as clusters of ROH that were > 1000 Kb with a minimum of 30 SNPs and found in more than 20 samples.
Genomic coordinates of the ROH islands were utilized to identify the genes contained in these regions using the Ovis aries v4 in the Genome Data Viewer genome browser (https://www.ncbi.nlm.nih.gov/genome/?term=ovis+aries). The Quantitative Trait Locus (QTL) Database (https://www.animalgenome.org/cgi-bin/QTLdb/OA/index) was used to identify QTL regions that overlapped the ROH islands. The genes within each ROH island were further analyzed with the Panther Classification System (Mi et al., 2013) to identify gene ontology (GO) terms and significantly enriched genes with a False Discovery Rate< 0.05 using a ruminant model (Bos taurus) as reference. The Cytoscape v3.7.1 software was used for gene network graphics (Shannon et al., 2003).
3 Results
3.1 Heritability estimates and genetic correlations
Descriptive statistics for all the phenotypes evaluated in this study are presented in Table 1. The mean for FEC was 1,427 (± 2,811) eggs per gram of feces and the mean for FAMACHA score was 2.75 (± 0.81). For PCV, the mean was 26.21(±6.73), and for BCS, the mean was 2.5 (±0.36). Table 2 presents the genetic and residual variances and heritability estimates for FEC, FAM, PCV, and BCS. Heritability estimates (± posterior standard deviation) were 0.33 ± 0.09 for FEC, 0.31 ± 0.10 for FAM, 0.22 ± 0.09 for PCV, and 0.19 ± 0.07 for BCS. The genetic correlations between the evaluated traits are presented in Table 3. The estimates for genetic correlations (± posterior standard deviation) among parasite resistance traits were 0.51 ± 0.21 (FEC-FAM), -0.74 ± 0.22 (FEC-PCV), and -0.18 ± 0.31 (PCV-FAM). Genetic correlations among parasite resistance traits and BCS were 0.32 ± 0.35 (FEC-BCS), -0.22 ± 0.31 (PCV-BCS), and -0.17 ± 0.28 (FAM-BCS); however, due to our small dataset, the posteriors standard deviations were high, yielding 95% central posterior intervals (Table 3) containing zero or with values out of the parameter space.
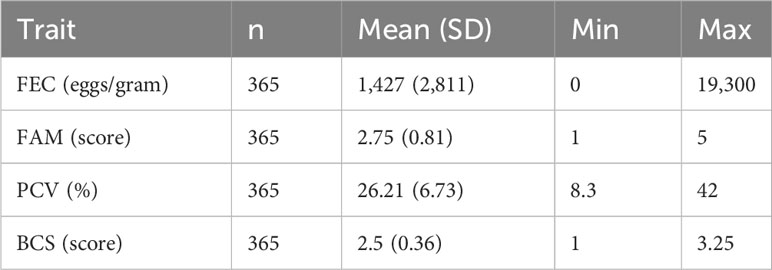
Table 1 Descriptive statistics for fecal egg count (FEC), FAMACHA score (FAM), packed cell volume (PCV), and body condition score (BCS) in Florida Cracker sheep at 38 days post-infection naturally infected with H. contortus.
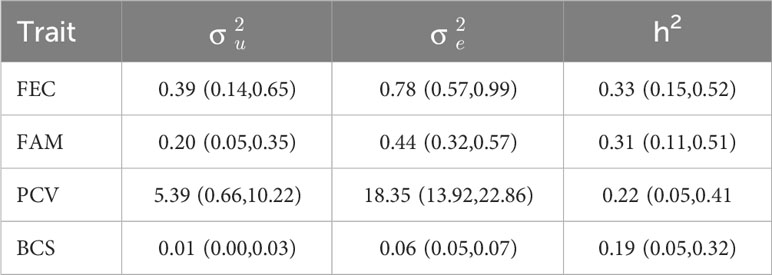
Table 2 Genetic (σ ) and residual (σ) variances, and heritability (h2) estimates for fecal egg count (FEC), FAMACHA score (FAM), packed cell volume (PCV), and body condition score (BCS) with 95% central posterior interval (in parentheses) in Florida Cracker sheep at 38 days post-infection naturally infected with H. contortus.
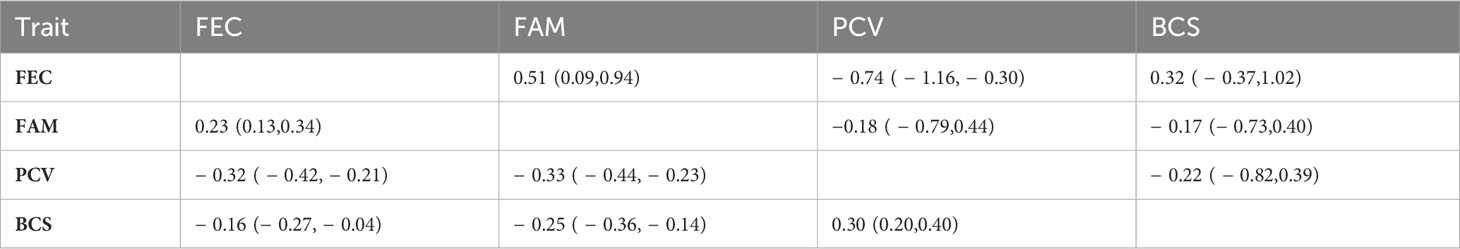
Table 3 Genetic (above the diagonal) and phenotypic (below the diagonal) correlations among fecal egg count (FEC), FAMACHA score (FAM), packed cell volume (PCV), and body condition score (BCS) with 95% central posterior interval (in parentheses) in Florida Cracker sheep at 38 days post-infection naturally infected with H. contortus.
3.2 Runs of homozygosity and inbreeding coefficient
A total of 4,561 ROH ranging from 0.083 to 25.5 Mb were identified in the present study (Figure 1; Supplementary File 1). The average length of ROH was 3.33 Mb. The analysis of the distribution of ROH according to size (length) showed that the majority of the ROH were in the > 2 – 5 Mb category (47. 24%), followed by the 0.5 – 2 Mb category (26.17%). The longest ROH (> 20 Mb) only included 0.17% of the total ROH. The average inbreeding coefficient was 0.02 ± 0.07.
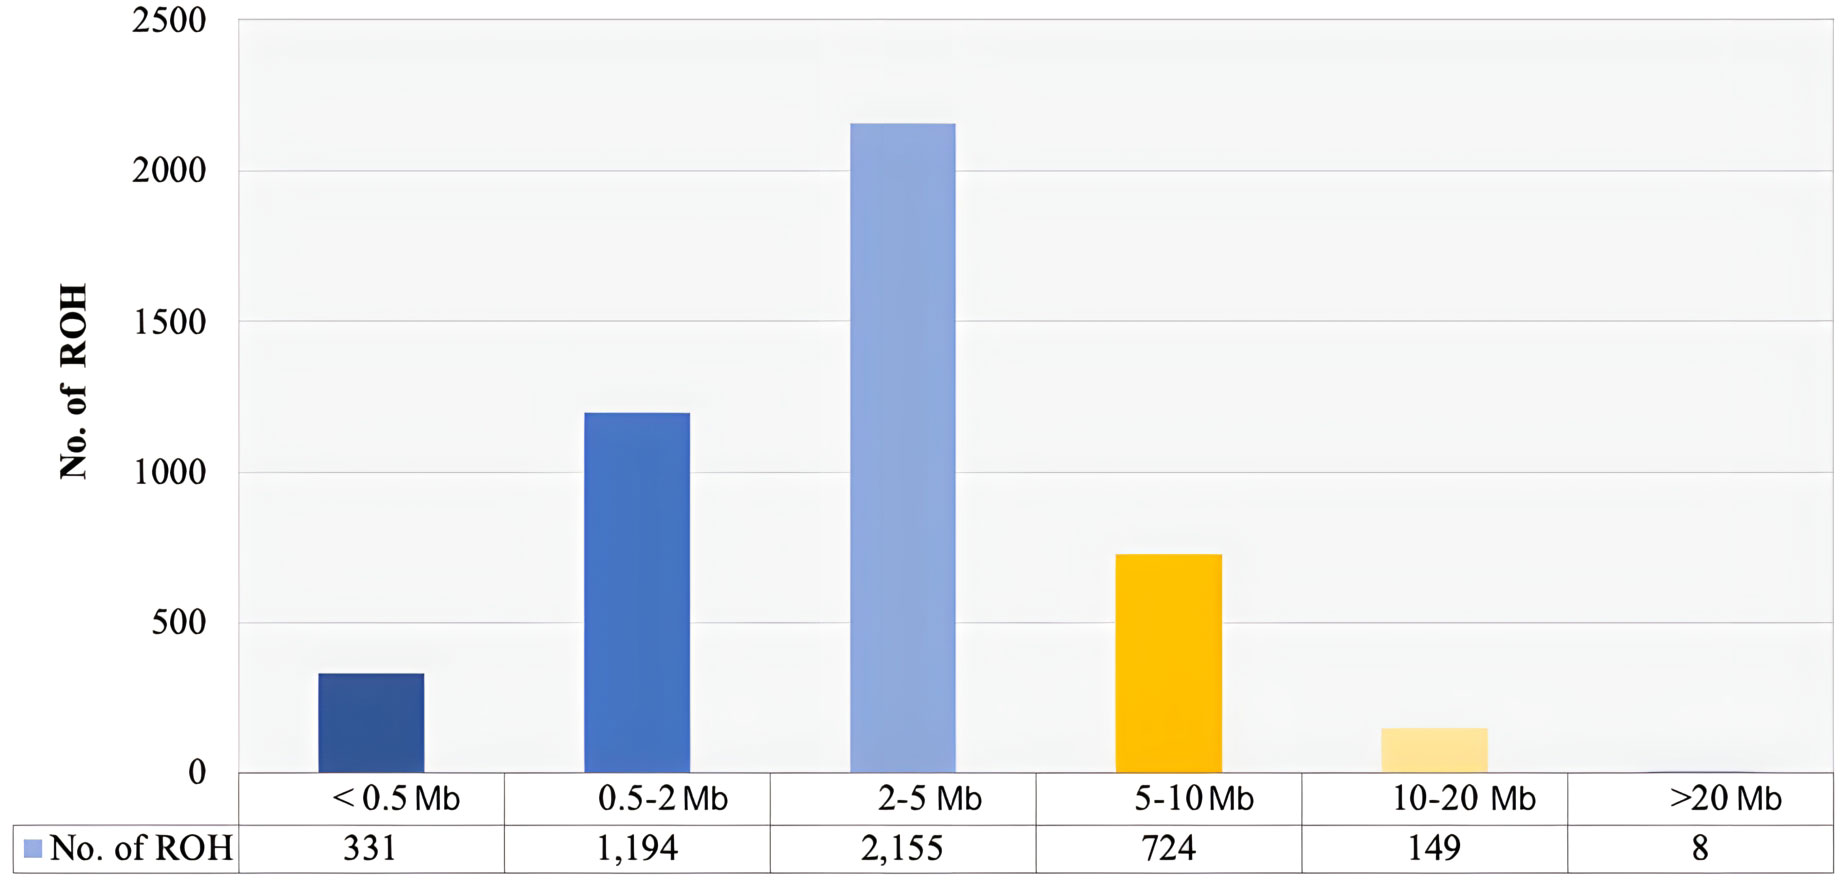
Figure 1 Distribution of the number of runs of homozygosity (ROH) of different lengths (Mb) in Florida Cracker sheep.
3.3 Incidence of common ROH and ROH islands
The incidence of common ROH per SNP is presented in Figure 2 and Supplementary File 2. A higher incidence of ROH was observed in OAR5, OAR6, OAR12, OAR15, OAR19, and OAR21. The highest incidence of common runs per SNP was observed in OAR15, with over 120 incidences. The total number of ROH islands distributed across autosomal chromosomes was 113 (Figure 3). Detailed distribution of the ROH islands across the 26 ovine chromosomes is presented in Supplementary File 3. The number of islands ranged from a minimum of 1 cluster per chromosome (OAR16 and OAR23) to 9 clusters per chromosome (OAR2).
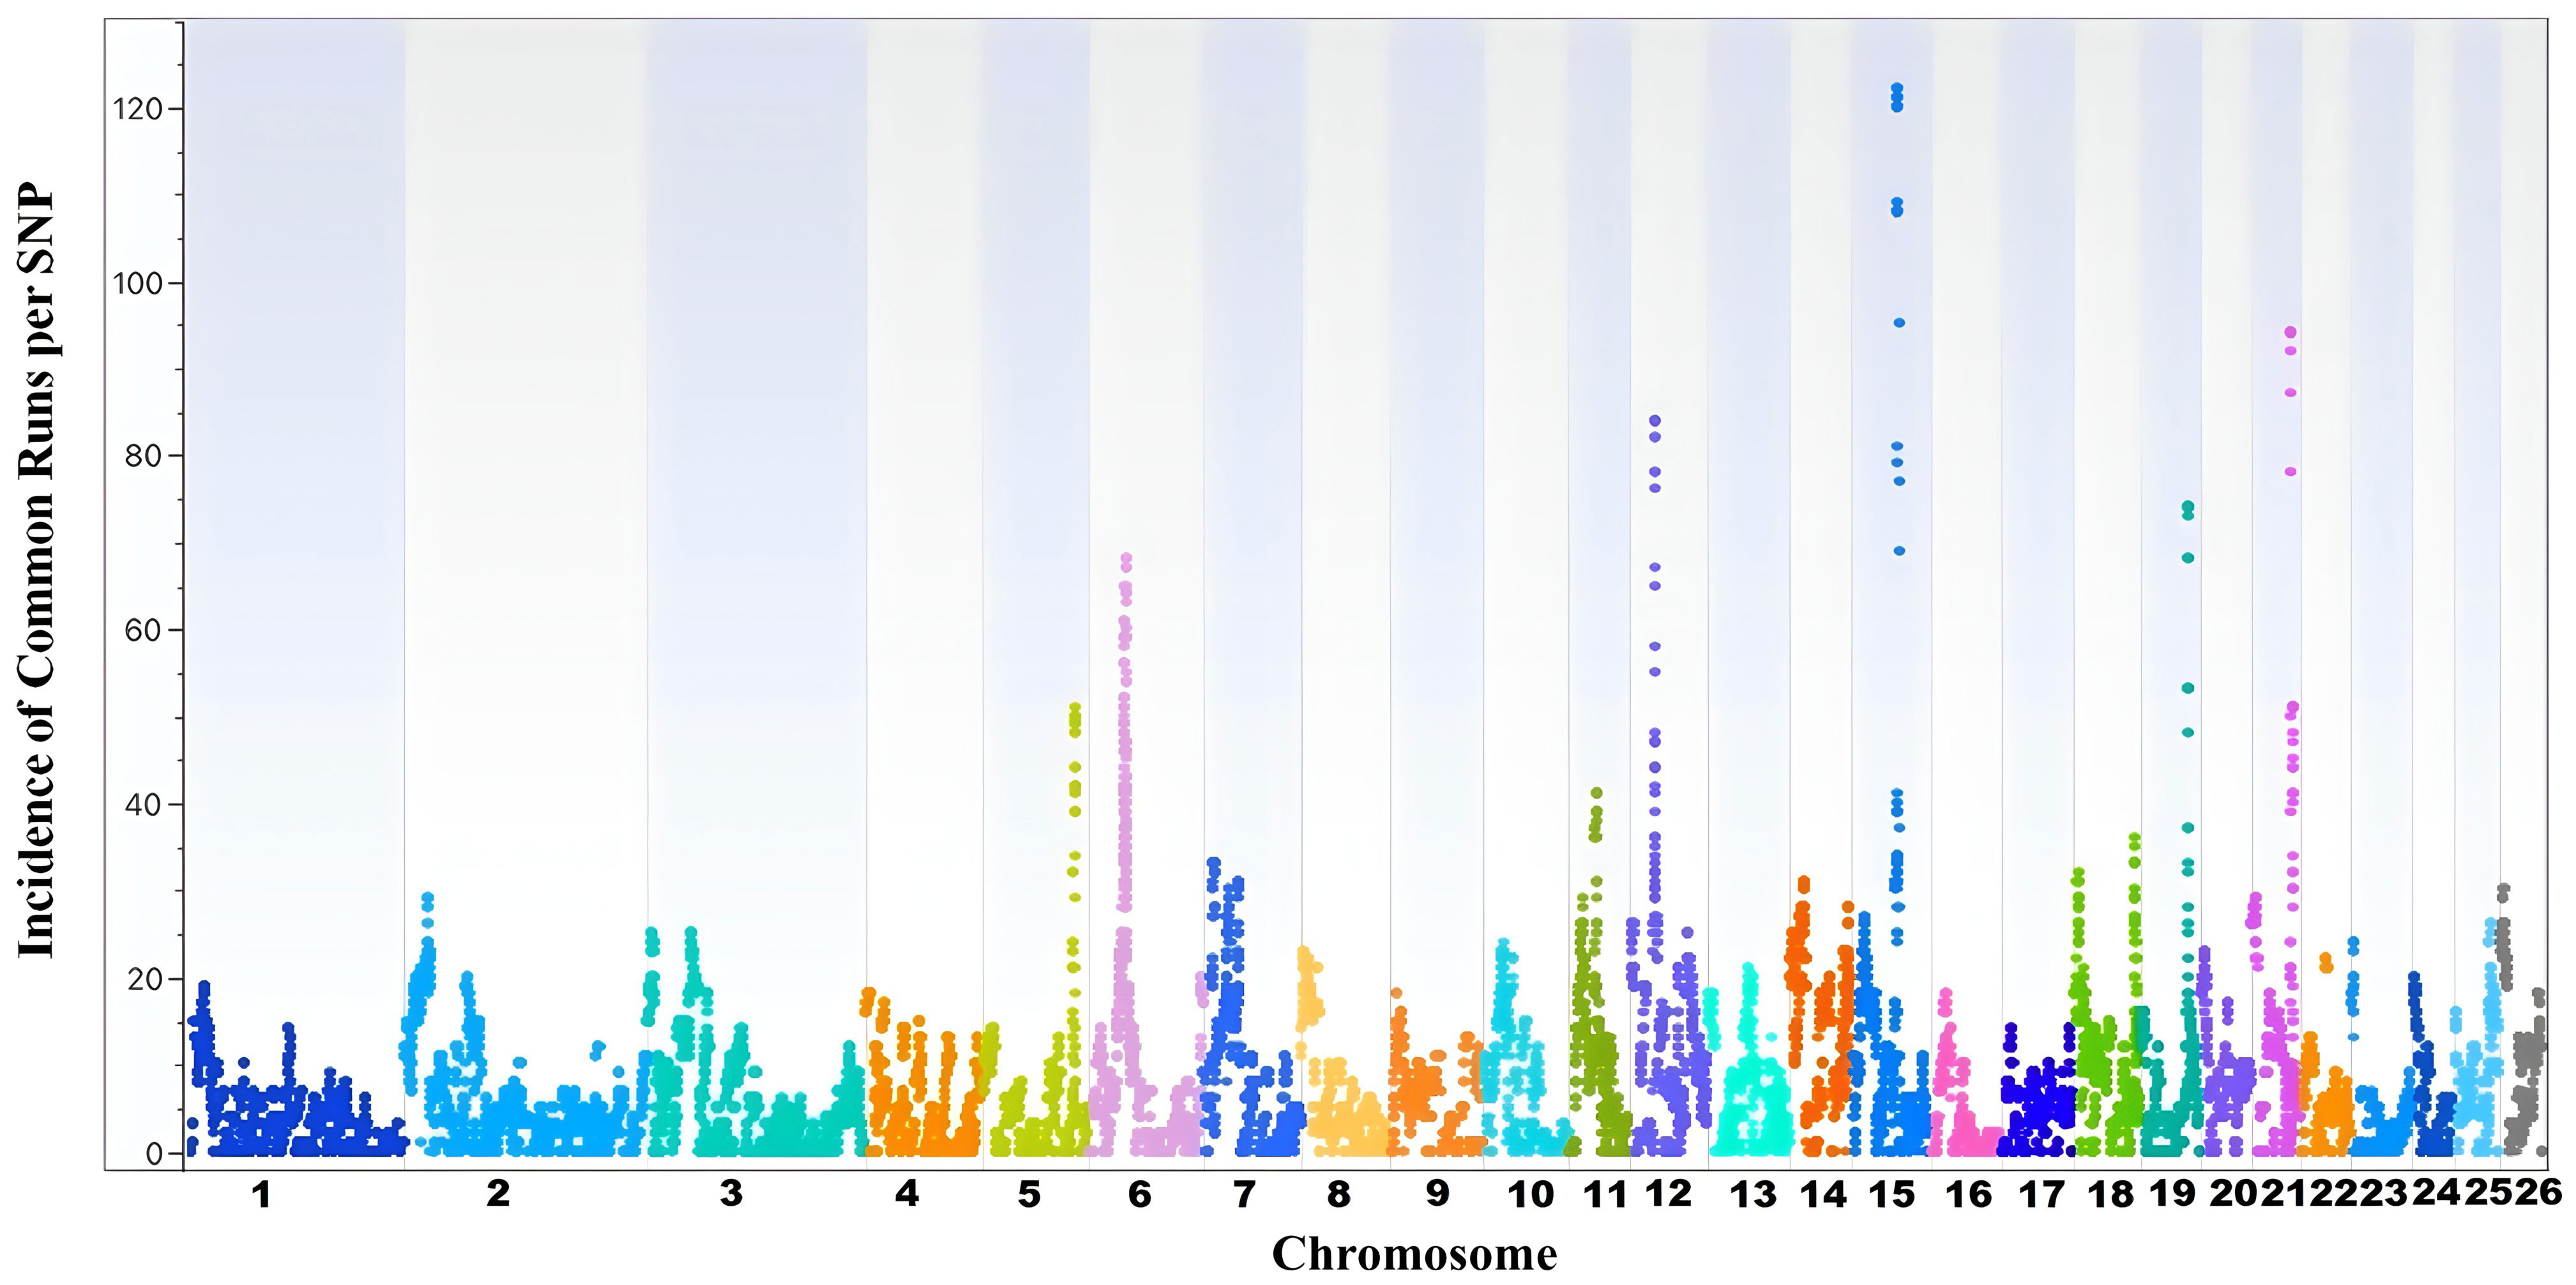
Figure 2 Incidence of common Runs of Homozygosity (ROH) per single nucleotide polymorphism (SNP) in Florida Cracker sheep.
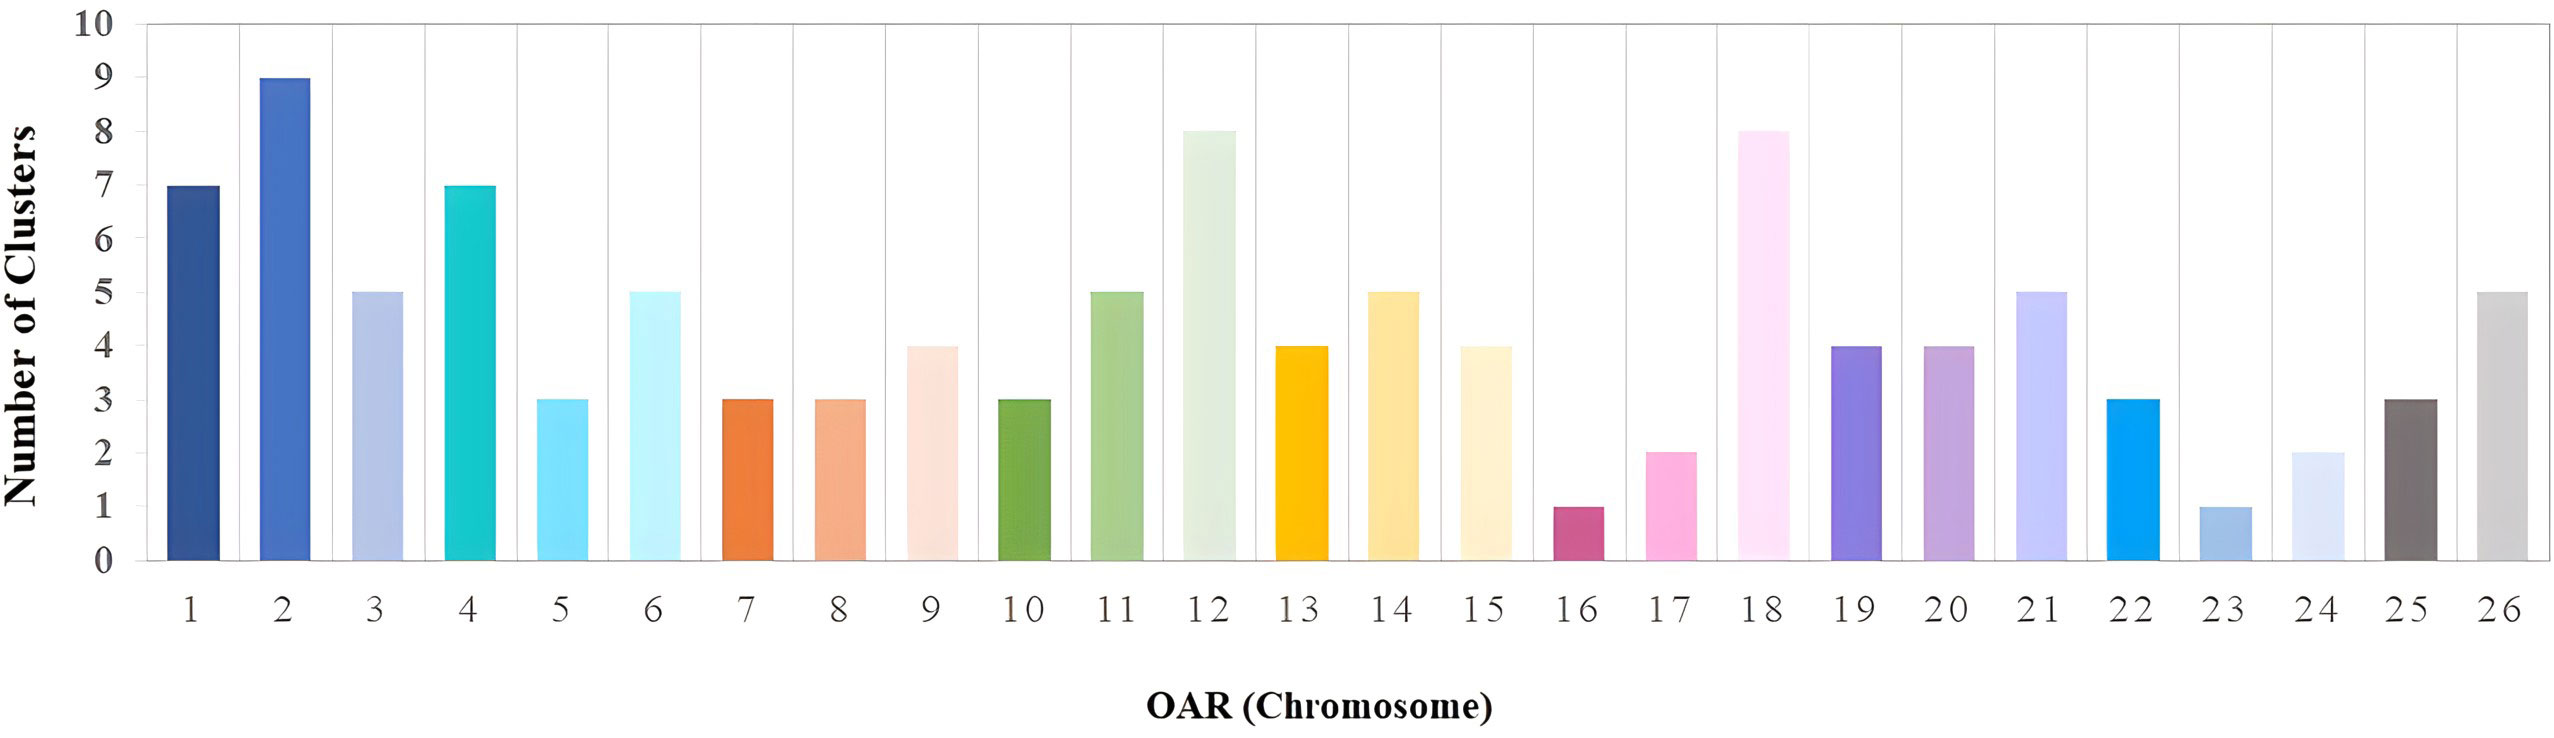
Figure 3 Distribution of ROH islands per chromosome in Florida Cracker sheep.
3.4 Annotation of ROH islands
Gene annotation provided insight into the biological functions related to the ROH islands observed in Florida Cracker sheep. The genes identified in the ROH islands are presented in Supplementary File 4. The ROH islands in OAR1, 2, 11, 18, 19, and 20 included candidate genes for parasite resistance in Florida Cracker sheep and other sheep breeds in the US (IL12RB2, NFIL3, TRPM3, TNF, NOS2, CCR3, OVAR-DRA, and IL16) (Estrada-Reyes et al., 2018; Estrada-Reyes et al., 2019a; Estrada-Reyes et al., 2019b; Estrada-Reyes et al., 2021). The ROH islands overlapped parasite resistance and health QTLs previously reported in the Sheep QTL database (Supplementary File 4). The overlapped QTL included traits such as blood IgA level (OAR1, 4, 10, 12, 13, 15, 20, and 22), Haemonchus contortus FEC (OAR2, 3, 4, 10, 11, 12, 16, 20, 21 and 22), worm count (OAR2, 18, 22 and 26), strongyle FEC (OAR6, 7, 8, 9, 10, 14, 15, 17, 21, 22 and 26), Trichostrongylus adult and larva count (OAR2, 8 and 11), Trichostrongylus colubriformis FEC (OAR3, 11, 12 and 22), Nematodirus FEC (OAR14), hematocrit (OAR18, 22 and 26), and change in eosinophil number (OAR21). Most of the annotated genes in ROH islands were related to immune response processes (OAR2, 7, 8, 11, 12, 19, and 20) such as T-lymphocyte activation and proliferation, lymphocyte and leucocyte migration, granulocyte chemotaxis, activation of the innate immune response, immune cell extravasation, inflammatory response, chemokine, and cytokine signaling and production, and regulation of humoral immune response (Figure 4). The ROH islands identified in OAR7 included > 100 T-cell receptor genes, and OAR20 contained several (>14) major histocompatibility class I (MCH-I) and class II (MHC-II) genes (i.e., OVAR-DRB1, OVAR-DRB2, OVAR-DQB1, BOLA, etc.), and complement activation genes (C2, C4, C4A, CFB, BAG6, BTN1A1, NCR3, and BTNL2).
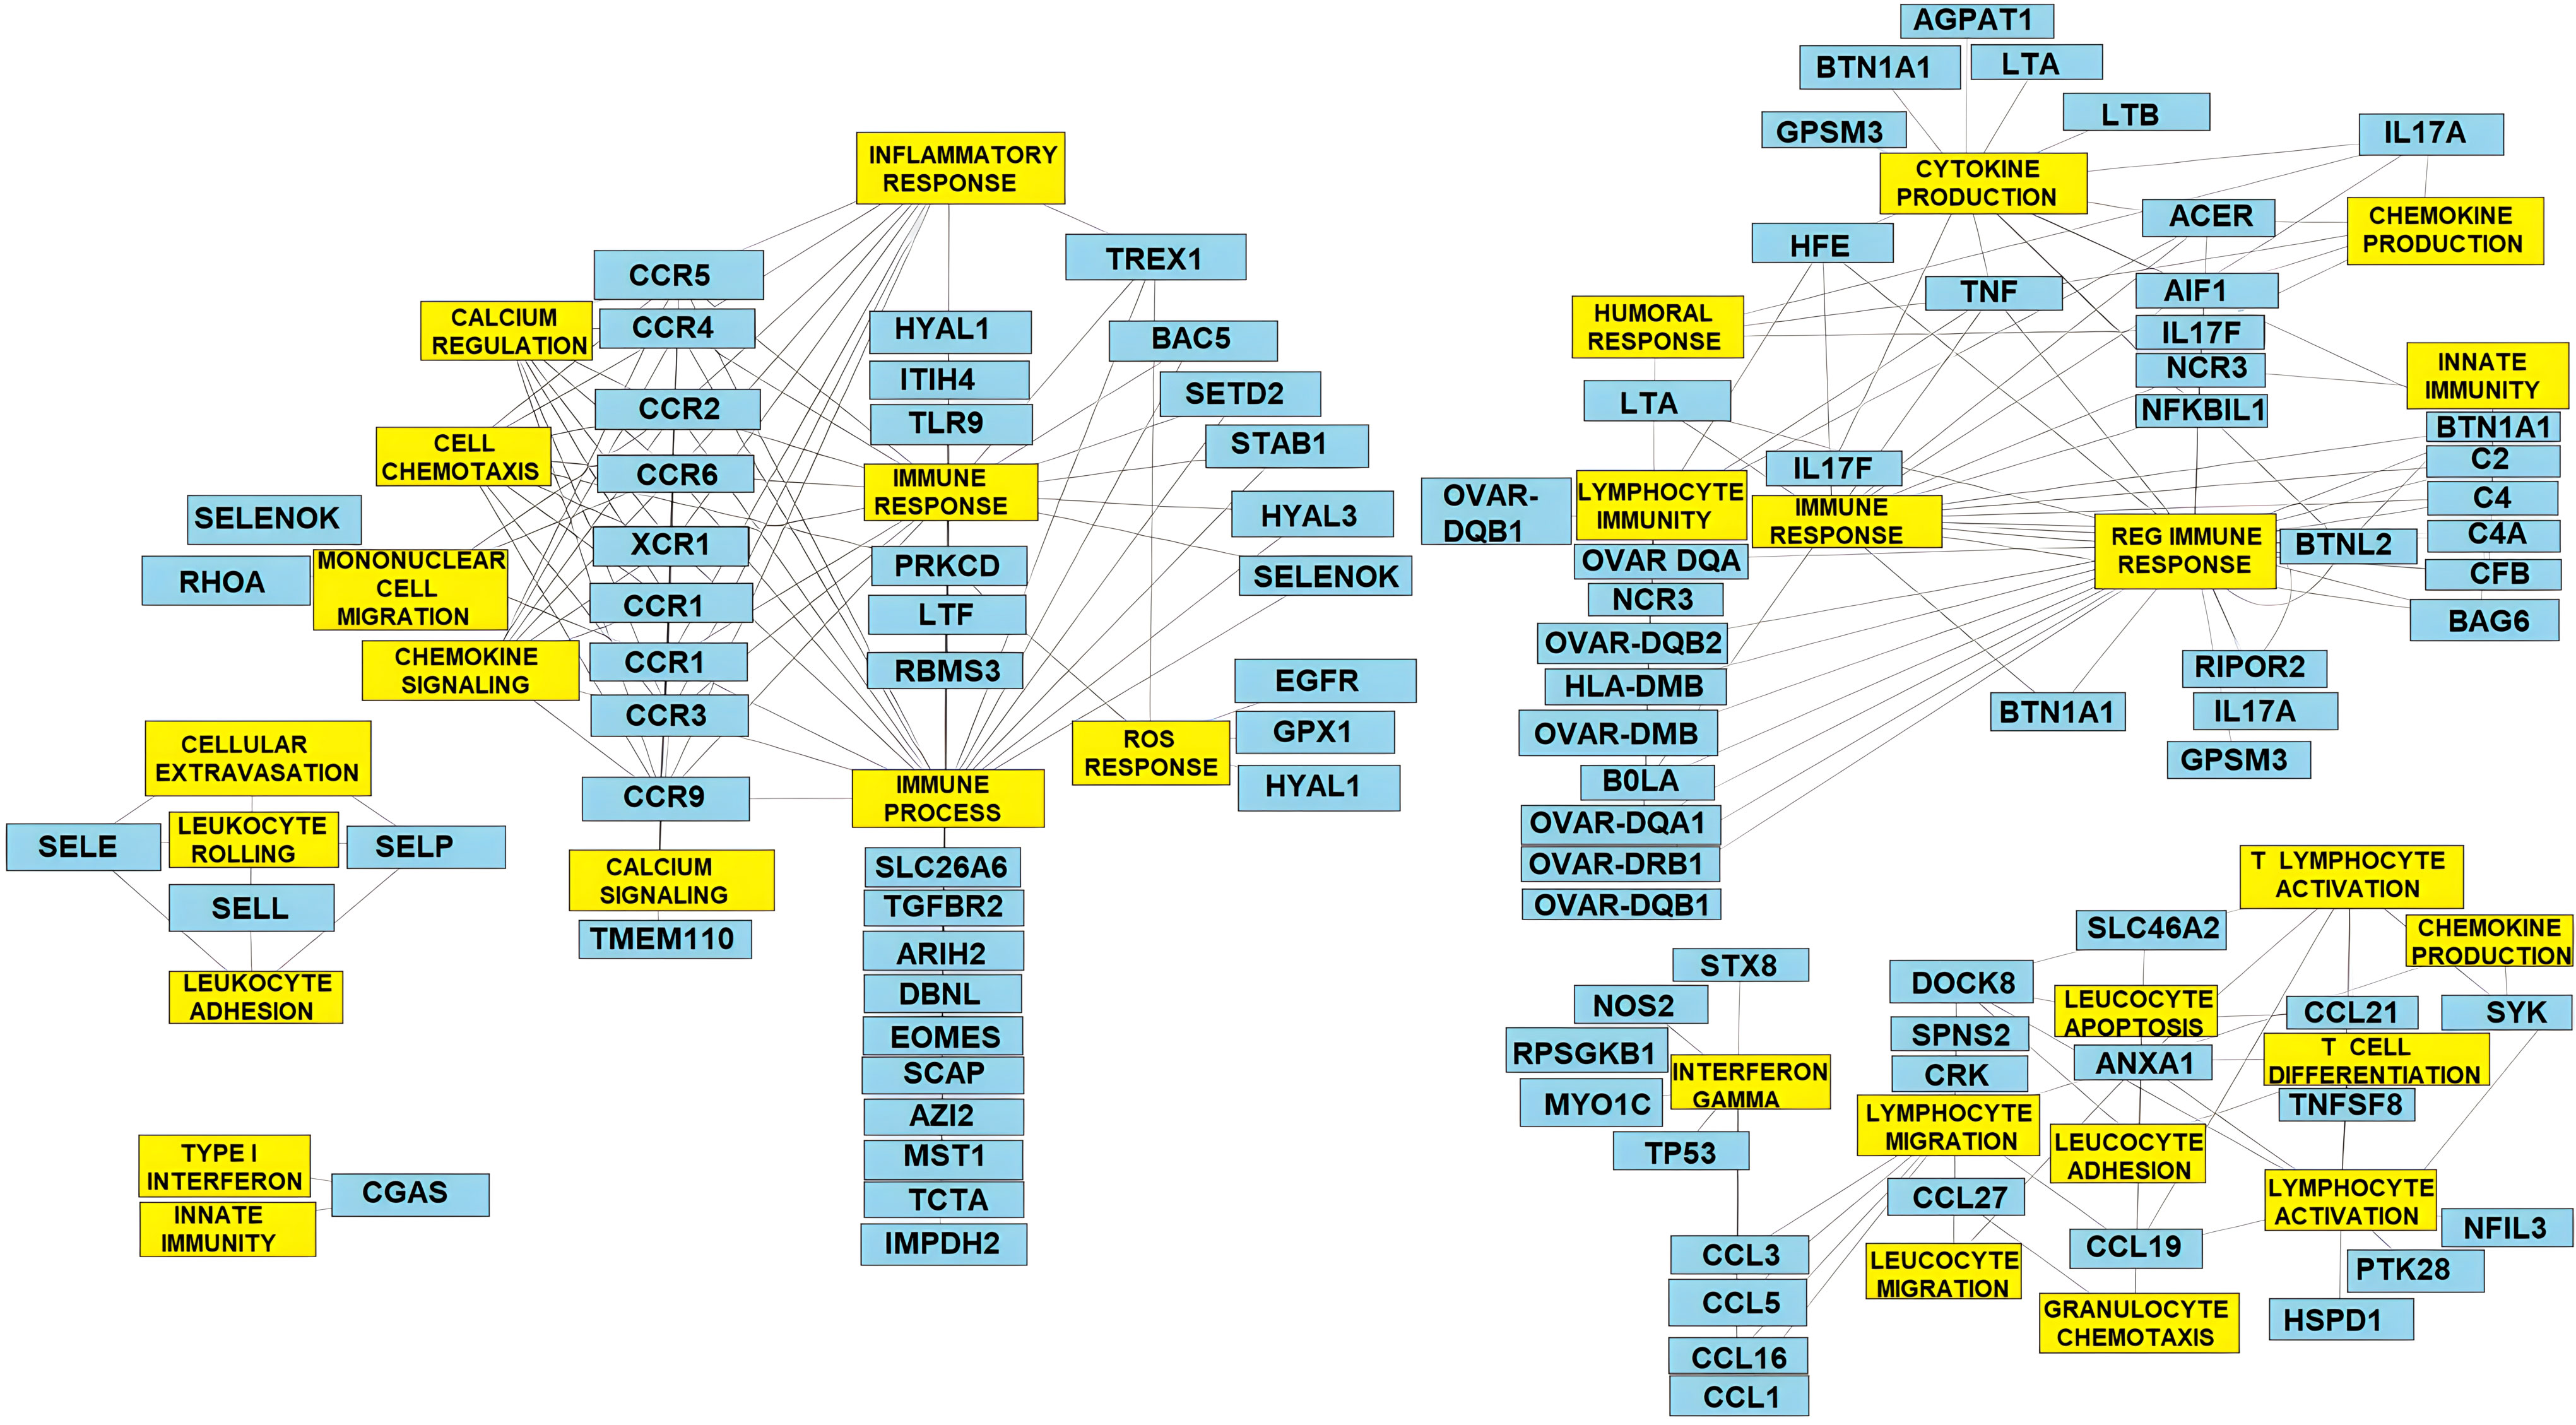
Figure 4 Gene network for enriched ROH islands controlling important immune response mechanisms in Florida Cracker sheep.
The PANTHER gene pathway analysis showed significantly enriched genes associated with the following biological processes: transcription factor binding (OAR1 and 3), kinase activity (OAR1), immune response processes (OAR2, 8, 11, 12, 19 and 20), homeostasis (OAR2), regulation of organelle organization (OAR2), DNA catabolism (OAR5), apoptosis (OAR5), cAMP signaling (OAR5), regulation of renin and endocrine system (OAR7), thrombin signaling (OAR7), regulation of cytosolic calcium and calcium-mediated signaling (OAR7 and OAR19), eye photoreceptor cell development (OAR7), hydro-lyase activity (OAR 9), linoleic acid metabolism and lipoxygenase activity (OAR11), sensory perception of smell (OAR 11 and 14), protein localization and modification (OAR12 and OAR26), regulation of nitrogen compound metabolism (OAR14 and 26), DNA damage signaling (OAR15 and 19), and nucleosome and chromosome organization (OAR20).
4 Discussion
Florida Cracker sheep have been naturally and artificially selected for resistance to gastrointestinal parasites (Estrada-Reyes et al., 2019a; Estrada-Reyes et al., 2021). This study estimated the genetic parameters for FEC, FAM, PCV, and BCS in Florida Cracker sheep naturally infected with H. contortus and the distribution of runs of homozygosity islands related to parasite resistance. The range and means for FAM and BCS recorded in our study were similar to those reported in other sheep populations, such as Merinos from South Africa (Dlamini et al., 2019; Snyman and Fisher, 2019). It is essential to highlight that Dlamini et al. (2019) studied a Merino population under selection for resistance to Haemonchus contortus since 2011; however, in this selected population, the mean FEC was higher (3,281 across several samplings) than in the Florida Cracker population (1,427). The h2 estimates for FEC and PCV (0.33 and 0.22, respectively) were of moderate magnitude; therefore, genetic progress could be feasible by selection for these traits in Florida Cracker sheep. However, the small population evaluated in this study might influence the accuracy of the genetic parameter estimates. Further monitoring of h2 estimates for parasite resistance is required for implementing breeding and conservation programs in this breed. Notter et al. (2018) reported heritability values of 0.19 and 0.24 for FEC in Katahdin lambs at weaning and post-weaning. Similar results were observed by Ngere et al. (2018) in Katahdin lambs, who reported heritability values for FEC ranging from 0.18 to 0.26 for weaning and from 0.23 to 0.46 for post-weaning. In this study, we evaluated Florida Cracker lambs during the post-weaning period, and our results are similar to the estimates reported by Ngere et al. (2018).
For the FAMACHA score, the heritability estimate (0.31) was higher when compared to reported values in Merino lambs [0.24; Riley and Van Wyk (2009)] and Dorper sheep [0.19; Ngere et al. (2017)]. However, lower h2 values for FEC (0.10), PCV (0.13), FAM (0.30), and BCS (0.17) have been observed in Santa Ines sheep, a Brazilian breed raised under hot and humid conditions (Rodrigues et al., 2021).
All the posterior standard deviations for the genetic correlations were high due to our study’s small number of records, highlighting the need for collecting more information. The 95% central posterior interval for all the correlations but the FEC-FAM correlation included zero or values out of the parameter space; thus, we could not make any conclusion about these estimates. The correlation FEC-FAM was 0.51 and the 95% central posterior interval (0.09,0.94). This correlation suggests that improvement in parasite resistance could be achieved in this population by selection based on FAM, a trait with additional advantages due to its high heritability and ease of recording; however, the ample 95% central posterior interval also remarks the need for more information to confirm this. Previous studies have reported higher estimates for the genetic correlations between FEC and FAMACHA scores ranging from 0.85 to 0.89 (Morris et al., 2004; Riley and Van Wyk, 2009; Mpetile et al., 2015) in sheep.
The FEC is considered the standard phenotype utilized for selection for parasite resistance (Woolastont and Piper, 1996; Morris et al., 1997; Woolastont and Windon, 2001). However, sheep producers do not commonly use FEC due to the associated costs. FAMACHA score has been successfully utilized as an alternative selection trait when H. contortus is the predominant gastrointestinal nematode (Kaplan et al., 2004) in sheep operations. This method only requires using a FAMACHA card to assess the level of anemia. Our results suggest that genetic selection for FAMACHA can be effective in improving FEC. Runs of homozygosity were used in this study to investigate potential genomic regions under selection. We also observed a low average inbreeding coefficient ( 0.02 ± 0.07). This negative estimate indicates that in this population there is, on average, more heterozygosity than expected, although the value does not differ significantly from zero. This inbreeding level is slightly lower than values reported for Sarda (0.04) and Sardinian Ancestral black (0.06) sheep from Italy by Cesarani et al. (2019). Similar estimates for average inbreeding were reported in Boer (0.01) and Nubian (0.01) goats (Hidalgo-Moreno et al., 2020). It is possible that the inbreeding coefficient reported in this manuscript could be a result of the breeding program utilized at the studied commercial farm. Analysis of ROH and subsequent PANTHER gene pathway analysis provided insight into the biological implications related to conserved regions found in the genome of the Florida Cracker sheep population. 113 ROH islands were distributed across the 26 ovine chromosomes in this breed. Most of these ROH islands were related to immune response processes such as T-lymphocyte activation and proliferation, lymphocyte and leucocyte migration, granulocyte chemotaxis, activation of innate immune response, immune cell extravasation, inflammatory response, chemokine, and cytokine signaling and production, and regulation of humoral immune response. Several of these mechanisms have been previously highlighted in Florida Cracker sheep infected naturally with H. contortus (Estrada-Reyes et al., 2019a; Estrada-Reyes et al., 2021). Previous studies with Florida Cracker sheep have focused on the identification of potential DNA variants (SNPs and CNVs) associated with parasite resistance (Estrada-Reyes et al., 2018; Estrada-Reyes et al., 2019a; Estrada-Reyes et al., 2021; Estrada-Reyes et al., 2022). The ROH islands identified in this manuscript overlapped these variants and other QTLs associated with FEC, adult worm count, IgA level, changes in eosinophil count and hematocrit, and included previously reported candidate genes with significant SNPs associated with FEC, red blood cell count, hemoglobin level, neutrophil count and PCV such as TRPM3, IL16 and TNF genes in this sheep breed (Estrada-Reyes et al., 2019a; Estrada-Reyes et al., 2021). Other important candidate genes included in these ROH islands were NOS2, CCR3, OVAR-DRA, and IL12RB2, which have been associated with parasite resistance in St. Croix and Katahdin sheep (Estrada-Reyes et al., 2018; Estrada-Reyes et al., 2019b; Estrada-Reyes et al., 2019c). Thus, it is possible that immunity-related genes within ROH islands and previously identified candidate genes, including TRPM3, IL16, TNF, IL12RB2, NOS2, and CCR3, may have a crucial role in controlling H. contortus and gastrointestinal parasites in this heritage breed.
The TRPM3 gene encodes a protein that forms a transient receptor potential channel. The transient receptor potential channels are calcium-permeable cation channels that allow Ca2+ influx and induce cell depolarization (Thiel et al., 2017). The exact role of the TRPM3 gene during H. contortus infections is still unknown, but this gene may play an essential role in controlling Ca2+ influx in immune cells during response processes against gastrointestinal parasites, including H. contortus. The IL16 gene regulates CD4+T lymphocyte production, chemotaxis, and macrophage polarization (Cruikshank et al., 2000; Huang et al., 2019). This was first proposed as a chemoattractant factor for T lymphocytes (Center and Cruikshank, 1982). The TNF is a cytokine that triggers inflammatory mechanisms, and it is commonly secreted by macrophages and neutrophils (Tamassia et al., 2019). Production of TNF by activated neutrophils (Zimmermann et al., 2015) and macrophages can mediate parasite resistance by inducing nitric oxide production during parasitic infections (Silva et al., 1995; Elmahallawy et al., 2021). In previous studies with Florida Cracker sheep, SNPs within TNF were associated with neutrophil count (Estrada-Reyes et al., 2019a). The IL12RB2 and NOS2 genes participate in signaling T helper 1 response (Thierfelder et al., 1996; Giordano et al., 2011). The CCR3 is present in eosinophils and is responsible for binding CCL11 or eotaxin, a specific eosinophil chemokine (Erin et al., 2002). This chemokine was also included in the ROH islands (OAR11) from our study. Further studies are required to investigate the role of these genes in Florida Cracker sheep production.
5 Conclusion
Parasite resistance traits (FEC, FAM, and PCV) are moderately heritable and suitable for selection in Florida Cracker sheep. The favorable genetic correlation between FAMACHA score and FEC suggest that genetic improvement for parasite resistance in this breed could be achieved by using FAMACHA score because of its ease of recording and reduced costs. Selection for parasite resistance results in the accumulation of ROH associated with this trait in Florida Cracker sheep. The ROH could contain important candidate genes for parasite resistance in this sheep breed. Further studies are required to validate our results.
Data availability statement
The original contributions presented in the study are included in the article/Supplementary Files, further inquiries can be directed to the corresponding author/s.
Ethics statement
The animal study was approved by University of Florida Institutional Animal Care and Use Committee (Approval number 201810108). The study was conducted in accordance with the local legislation and institutional requirements.
Author contributions
ZE-R designed the experiment. ZE-R, JH, IO, AP-C, TT, MI and GT assisted with data collection. JH and ZE-R conducted the data analysis. JH, ZE-R, IO, AP-C, TT, MI and GT drafted the manuscript. JH and ZE-R reviewed the final manuscript together. All authors contributed to the article and approved the submitted version.
Funding
The author(s) declare financial support was received for the research, authorship, and/or publication of this article. Neogene Corporation partially supported funding support. This study received partial funding from Neogen Corporation - GeneSeek Operations. The funder was not involved in the study design, collection, analysis, interpretation of data, the writing of this article or the decision to submit it for publication.
Acknowledgments
We acknowledge Carol Postley (Fairmeadow Farm), Dr. Owen Rae, and the students at the College of Veterinary Medicine at the University of Florida for their participation in phenotypic data collection. We gratefully acknowledge the valuable comments of Dr. Ignacy Misztal from the University of Georgia and the anonymous reviewers.
Conflict of interest
The authors declare that the research was conducted in the absence of any commercial or financial relationships that could be construed as a potential conflict of interest.
Publisher’s note
All claims expressed in this article are solely those of the authors and do not necessarily represent those of their affiliated organizations, or those of the publisher, the editors and the reviewers. Any product that may be evaluated in this article, or claim that may be made by its manufacturer, is not guaranteed or endorsed by the publisher.
Supplementary material
The Supplementary Material for this article can be found online at: https://www.frontiersin.org/articles/10.3389/fanim.2023.1249470/full#supplementary-material
References
Aguilar I., Misztal I., Johnson D. L., Legarra A., Tsuruta S., Lawlor T. J. (2010). Hot topic: A unified approach to utilize phenotypic, full pedigree, and genomic information for genetic evaluation of Holstein final score. J. Dairy Sci. 93, 743–752. doi: 10.3168/jds.2009-2730
Amarante A. F., Craig T. M., Ramsey W. S., Davis S. K., Bazer F. W. (1999b). Nematode burdens and cellular responses in the abomasal mucosa and blood of Florida Native, Rambouillet and crossbreed lambs. Vet. Parasitol. 80, 311–324. doi: 10.1016/S0304-4017(98)00229-5
Amarante A. F., Craig T. M., Ramsey W. S., El-Sayed N. M., Desouki A. Y., Bazer F. W. (1999a). Comparison of naturally acquired parasite burdens among Florida Native, Rambouillet, and crossbreed ewes. Vet. Parasitol. 85, 61–69. doi: 10.1016/S0304-4017(99)00103-X
Center D. M., Cruikshank W. (1982). Modulation of lymphocyte migration by human lymphokines. I. Identification and characterization of chemoattractant activity for lymphocytes from mitogen-stimulated mononuclear cells. J. Imm. 128, 2563–2568. doi: 10.4049/jimmunol.128.6.2563
Cesarani A., Sechi T., Gaspa G., Usai M. G., Sorbolini S., Macciotta N. P. P., et al. (2019). Investigation of genetic diversity and selection signatures between Sarda and Sardinian Ancestral black, two related sheep breeds with evident morphological differences. S. Rum. Res. 177, 68–75. doi: 10.1016/j.smallrumres.2019.06.014
Chen C. Y., Misztal I., Aguilar I., Legarra A., Muir W. M. (2011). Effect of different genomic relationship matrices on accuracy and scale. J. Anim. Sci. 98, 2673–2679. doi: 10.2527/jas.2010-3555
Chen Z., Zhang M., Lv F., Ren X., Li W., Liu M., et al. (2018). Contrasting patterns of genomic diversity reveal accelerated genetic drift but reduced directional selection on X-chromosome in wild and domestic sheep species. Gen. Bio. Evo. 10, 1282–1297. doi: 10.1093/gbe/evy085
Dargie J. D., Allonby E. W. (1975). Pathophysiology of single and challenge infections of Haemonchus contortus in Merino sheep: Studies on red cell kinetics and the "self-cure" phenomenon. Int. J. Parast. 5 (2), 147–157. doi: 10.1016/0020-7519(75)90021-1
Dlamini N. M., Visser C., Snyman M. A., Soma P., MuChadeyi F. C. (2019). Genomic evaluation of resistance to Haemonchus contortus in a South African Dohne Merino flock. S. Rum. Res. 175, 117–125. doi: 10.1016/j.smallrumres.2019.04.020
Elmahallawy E. K., Alkhaldi A. A., Saleh A. A. (2021). Host immune response against leishmaniasis and parasite persistence strategies: A review and assessment of recent research. Biomed. Pharm. 139, 111671. doi: 10.1016/j.biopha.2021.111671
Erin E. M., Williams T. J., Barnes P. J., Hansel T. T. (2002). Eotaxin receptor (CCR3) antagonism in asthma and allergic disease. Inflammation Allergy Drug Targets. 1, 201–214. doi: 10.2174/1568010023344715
Estrada-Reyes Z. M., Ogunade I. M., Pech-Cervantes A. A., Terrill T. H. (2022). Copy number variant-based genome wide association study reveals immune-related genes associated with parasite resistance in a heritage sheep breed from the United States. Parasite Immunol. 44 (11), e12943. doi: 10.1111/pim.12943
Estrada-Reyes Z. M., Rae D. O., Mateescu R. G. (2021). Genome-wide scan reveals important additive and non-additive genetic effects associated with resistance to Haemonchus contortus in Florida Native sheep. Int. J. Parasitol. 51, 535–543. doi: 10.1016/j.ijpara.2020.11.003
Estrada-Reyes Z. M., Rae O., Postley C., Jiménez Medrano M. B., Leal Gutiérrez J. D., Mateescu R. G. (2019a). Association study reveals Th17, Treg, and Th2 loci related to resistance to Haemonchus contortus in Florida Native sheep. J. Anim. Sci. 97, 4428–4444. doi: 10.1093/jas/skz299
Estrada-Reyes Z. M., Tsukahara Y., Amadeu R. R., Goetsch A. L., Gipson T. A., Sahlu T., et al. (2019b). Signatures of selection for resistance to Haemonchus contortus in sheep and goats. BMC Genom. 20, 1–14. doi: 10.1186/s12864-019-6150-y
Estrada-Reyes Z. M., Tsukahara Y., Goetsch A. L., Gipson T. A., Sahlu T., Puchala R., et al. (2019c). Association analysis of immune response loci related to Haemonchus contortus exposure in sheep and goats using a targeted approach. Lives. Sci. 228, 109–119. doi: 10.1016/j.livsci.2019.08.005
Estrada-Reyes Z. M., Tsukahara Y., Goetsch A. L., Gipson T. A., Sahlu T., Puchala R., et al. (2018). Effect of Ovar-DRA and Ovar-DRB1 genotype in small ruminants with haemonchosis. Parasitol. Immunol. 40, e12534. doi: 10.1111/pim.12534
Giordano D., Li C., Suthar M. S., Draves K. E., Ma D. Y., Gale J. M., et al. (2011). Nitric oxide controls an inflammatory-like Ly6ChiPDCA1+ DC subset that regulates Th1 immune responses. J. Leukoc. Biol. 89, 443–455. doi: 10.1189/jlb.0610329
Gordon H. M., Whitlock H. V. (1939). A new technique for counting nematode eggs in sheep faeces. J. Council Sci. Indust. Res. 12, 50–52.
He S., Di J., Han B., Chen L., Liu M., Li W. (2020). Genome-wide scan for runs of homozygosity identifies candidate genes related to economically important traits in Chinese Merino. Animals 10, 524. doi: 10.3390/ani9080518
Hidalgo-Moreno J. A., Núñez-Domínguez R., García-Muñiz J. G., Ramírez-Valverde R., Larios-Sarabia N., Ben Zaabza H. (2020). Genetic diversity and population structure of Boer and Nubian goats in Mexico. S. Rum. Res. 187, 106093. doi: 10.1016/j.smallrumres.2020.106093
Huang Y., Du K. L., Guo P. Y., Zhao R. M., Wang B., Zhao X. L., et al. (2019). IL-16 regulates macrophage polarization as a target gene of mir-145-3p. Mol. Imm. 107, 1–9. doi: 10.1016/j.molimm.2018.12.027
Islam R., Li Y., Liu X., Berihulay H., Abied A., Gebreselassie G., et al. (2019). Genome-wide runs of homozygosity, effective population size, and detection of positive selection signatures in six Chinese goat breeds. Genes 10, 938. doi: 10.3390/genes10110938
Kaplan R. M., Burke J. M., Terrill T. H., Miller J. E., Getz W. R., Mobini S., et al. (2004). Validation of the FAMACHA© eye color chart for detecting clinical anemia in sheep and goats on farms in the southern United States. Vet. Paras. 123 (1-2), 105–120. doi: 10.1016/j.vetpar.2004.06.005
Kim E. S., Cole J. B., Huson H., Wiggans G. R., Van Tassell C. P., Crooker B. A., et al. (2013). Effect of artificial selection on runs of homozygosity in U.S. Holstein cattle. PloS One 8, e80813. doi: 10.1371/journal.pone.0080813
Metzger J., Karwath M., Tonda R., Beltran S., Agueda L., Gut M., et al. (2015). Runs of homozygosity reveal signatures of positive selection for reproduction traits in breed and non-breed horses. BMC Genom. 16, 764. doi: 10.1186/s12864-015-1977-3
Mi H., Muruganujan A., Casagrande J. T., Thomas P. D. (2013). Large-scale gene function analysis with the PANTHER classification system. Nat. Protoc. 8 (8), 1551–1566. doi: 10.1038/nprot.2013.092
Morris C. A., Bisset A., Vlassoff A., West C. J., Wheeler M. (2004). Genetic parameters for Nematodirus spp. egg counts in Romney lambs in New Zealand. Anim. Sci. 79, 33–39. doi: 10.1017/S1357729800054503
Mpetile Z., Cloete S. W. P., Kruger A. C. M., Dzama K. (2015). Environmental and genetic factors affecting faecal worm egg counts in Merinos divergently selected for reproduction. S. Afr. J. Anim. Sci. 45, 510–520. doi: 10.4314/sajas.v45i5.8
Ngere L., Burke J. M., Herring A. D., Sanders J. O., Craig T. M., Van Wyk J. A., et al. (2017). Utilization of year-round data in the estimation of genetic parameters for internal parasite resistance traits in Dorper sheep. S. Rum. Res. 151, 5–10. doi: 10.1093/jas/sky064
Ngere L., Burke J. M., Morgan J. L. M., Miller J. E., Notter D. R. (2018). Genetic parameters for fecal egg counts and their relationship with body weights in Katahdin lambs. J. Anim. Sci. 96, 1590–1599. doi: 10.1093/jas/sky064
Notter D. R., Ngere L., Burke J. M., Miller J. E., Morgan J. L. (2018). Genetic parameters for ewe reproductive performance and peri-parturient fecal egg counts and their genetic relationships with lamb body weights and fecal egg counts in Katahdin sheep. J. Anim. Sci. 96, 1579–1589. doi: 10.1093/jas/sky100
Purfield D. C., McParland S., Wall E., Berry D. P. (2017). The distribution of runs of homozygosity and selection signatures in six commercial meat sheep breeds. PloS One 12, e0176780. doi: 10.1371/journal.pone.0176780
Riley D. G., Van Wyk J. A. (2009). Genetic parameters for FAMACHA© score and related traits for host resistance/resilience and production at differing severities of worm challenge in a Merino flock in. S. Afr. Vet. Parasitol. 164, 44–52. doi: 10.1016/j.vetpar.2009.04.014
Rodrigues F. N., Sarmento J. L. R., Leal T. M., de Araújo A. M., Figueiredo Filho L. A. S. (2021). Genetic parameters for worm resistance in Santa Inês sheep using the Bayesian animal model. Anim. Bios. 34, 185. doi: 10.5713/ajas.19.0634
Russel A. J. F., Doney J. M., Gunn R. G. (1969). Subjective assessment of body fat in live sheep. J. Agric. Sci. 72, 451–454. doi: 10.1017/S0021859600024874
Sams A. J. F., Boyko A. R. (2019). Fine-scale resolution of runs of homozygosity reveal patterns of inbreeding and substantial overlap with recessive disease genotypes in domestic dogs. G3: Genes, Genomes, Genetics, 9(1), 117–123.
Shannon P., Markiel A., Ozier O., Baliga N. S., Wang J. T., Ramage D., et al. (2003). Cytoscape: a software environment for integrated models of biomolecular interaction networks. Genome Res. 13 (11), 2498–2504. doi: 10.1101/gr.1239303
Silva J. S., Vespa G. N., Cardoso M. A., Aliberti J. C., Cunha F. Q. (1995). Tumor necrosis factor alpha mediates resistance to Trypanosoma cruzi infection in mice by inducing nitric oxide production in infected gamma interferon-activated macrophages. Infect. Immun. 63, 4862–4867. doi: 10.1128/iai.63.12.4862-4867.1995
Snyman M. A., Fisher A. D. (2019). Genetic parameters for traits associated with resistance to Haemonchus contortus in a South African Dohne Merino sheep flock. S. Rum. Res. 176, 76–88. doi: 10.1016/j.smallrumres.2019.01.004
Tamassia N., Arruda-Silva F., Wright H. L., Moots R. J., Gardiman E., Bianchetto-Aguilera F., et al. (2019). Human neutrophils activated via TLR8 promote Th17 polarization through IL-23. J. Leukoc. Bio. 105 (6), 1155–1165. doi: 10.1002/JLB.MA0818-308R
Thiel G., Rubil S., Lesch A., Guethlein L. A., Rössler O. G. (2017). Transient receptor potential TRPM3 channels: pharmacology, signaling, and biological functions. Pharmacol. Res. 124, 92–99. doi: 10.1016/j.phrs.2017.07.014
Thierfelder W. E., van Deursen J. M., Yamamoto K., Tripp R. A., Sarawar S. R., Carson R. T., et al. (1996). Requirement for Stat4 in interleukin-12-mediated responses of natural killer and T cells. Nature 382, 171–174. doi: 10.1038/382171a0
Van Wyk J. A., Bath G. F. (2002). The FAMACHA© system for managing haemonchosis in sheep and goats by clinically identifying individual animals for treatment. Vet. Res. 33, 509–529. doi: 10.1051/vetres:2002036
Werne S., Schwarz K., Thüer S., Bapst B. (2023). Breeding options for nematode resistance in Lacaune dairy sheep. Animals 17, 100772. doi: 10.1016/j.animal.2023.100772
Woolaston R. R., Baker R. L. (1996). Prospects of breeding small ruminants for resistance to internal parasites. Int. J. Parasitol. 26 (8-9), 845–855.
Woolastont R. R., Piper L. R. (1996). Selection of Merino sheep for resistance to Haemonchus contortus: genetic variation. Anim. Sci. 62 (3), 451–460.
Woolastont R. R., Windon R. G. (2001). Selection of sheep for response to Trichostrongylus colubriformis larvae: genetic parameters. Anim. Sci. 73 (1), 41–48.
Wright S. (1922). Coefficients of inbreeding and relationship. Amer. Nat. 56, 330–338. doi: 10.1086/279872
Zajac A. M., Conboy G. A. (2012). Vet. Clin. Parasitol. 8th ed (Ames: John Wiley and Sons, Inc., Publication).
Zajac A. M., Herd R. P., McClure K. E. (1988). Trichostrongylid parasite populations in pregnant or lactating and unmated Florida Native and Dorset/Rambouillet ewes. Int. J. Parasitol. 18 (7), 981–985.
Zhong R. Z., Fang Y., Wang Y. Q., Sun H. X., Zhou D. W. (2016). Effects of substituting finely ground sorghum for finely ground corn on feed digestion and meat quality in lambs infected with Haemonchus contortus. Anim. Feed. Sci. Technol. 211, 31–40. doi: 10.1016/j.anifeedsci.2015.08.007
Keywords: Florida Cracker sheep, genetic parameters, runs of homozygosity, gastrointestinal parasite resistance, heritage sheep
Citation: Hidalgo J, Estrada-Reyes ZM, Ogunade IM, Pech-Cervantes AA, Terrill T, Idowu MD and Taiwo G (2023) Estimation of genetic parameters for parasite resistance and genome-wide identification of runs of homozygosity islands in Florida Cracker sheep. Front. Anim. Sci. 4:1249470. doi: 10.3389/fanim.2023.1249470
Received: 28 June 2023; Accepted: 07 November 2023;
Published: 08 December 2023.
Edited by:
Beatriz Gutiérrez-Gil, University of León, SpainReviewed by:
Shamik Polley, West Bengal University of Animal and Fishery Sciences, IndiaOnur Yilmaz, Adnan Menderes University, Türkiye
Valentina Riggio, University of Edinburgh, United Kingdom
Copyright © 2023 Hidalgo, Estrada-Reyes, Ogunade, Pech-Cervantes, Terrill, Idowu and Taiwo. This is an open-access article distributed under the terms of the Creative Commons Attribution License (CC BY). The use, distribution or reproduction in other forums is permitted, provided the original author(s) and the copyright owner(s) are credited and that the original publication in this journal is cited, in accordance with accepted academic practice. No use, distribution or reproduction is permitted which does not comply with these terms.
*Correspondence: Zaira M. Estrada-Reyes, em1lc3RyYWRhcmV5ZXNAbmNhdC5lZHU=
†These authors share first authorship