 Esther Wurm
 Naemi von Jasmund
 Inga Tiemann
 Kathrin Schulze Rötering
 Wolfgang Büscher
- Institute of Agricultural Engineering, University of Bonn, Bonn, Germany
Animal activity in pigs can be a direct indicator of animal welfare. Passive infrared detectors (PID) provide one method of measuring animal activity on the pen level as a cost-effective and easy-to-use sensor technique. The study aimed to test PIDs on different commercial farms with fattening pigs. On each farm, a focus pen was selected and group activity, and activity in the feeding and exploration area was measured by using three PIDs. For data evaluation, three continuous 24h time periods were selected for each farm. Additionally, animal behavior was recorded by video cameras for visual scan sampling. To compare the PID outcome with the recorded behaviors, an ethogram was used to categorize active and inactive behaviors. Using scan sampling, the validation of the PID data was based on still frames at 10 min intervals. In addition, barn climate such as temperature, relative humidity, and ammonia concentration were measured. The analysis of seven farms showed a strong correlation between PID data and visual assessment for group activity from 0.67 - 0.91 (p < 0.001; n = 432). For the activity in the feeding area, medium to strong correlations between 0.44 - 0.65 (p < 0.001; n = 327) could be found. The PID data for the exploration area reached correlations with a smaller effect strength. Based on the activity data measured by PIDs, a typical diurnal rhythm for pigs could be found for all farms. Moreover, the PID data indicated different activity patterns depending on, e.g., feeding times and sex group composition. The results demonstrated that PIDs can also be used in different housing conditions for measuring animal activity. In combination with barn climate data, the PIDs can provide useful information for the farmer and also characterize farm-specific management.
1 Introduction
Today more than ever, modern and conventional livestock farming is caught between the conflicting priorities of animal welfare, environmental protection, and economics. Animal welfare in livestock farming has recently become increasingly important to society and might now be a decisive purchasing criterion (Sonoda et al., 2018; Sødring et al., 2020; Derstappen and Christoph-Schulz, 2022). Many consumers expect issues such as animal welfare to be recorded and observed along the value chain. Pig farming has potential conflicts due to animal welfare concerns about housing conditions, mutilations such as tail docking (Pedersen, 2017; Sødring et al., 2020), and medical treatments for diseases (Martínez-Avilés et al., 2017). In addition, animal production has been undergoing structural changes for years. As a result, the number of farms has declined, and the number of animals per farm and farmer has risen in recent years (Neuenfeldt et al., 2019). This ratio impacts tradeoff, since more animal welfare goes along with improved animal monitoring, but this is made more difficult by an increasing number of animals (Chapa et al., 2020).
In response to the increased interest in improving animal welfare, several animal health and welfare assessment protocols have been developed (Pfeifer et al., 2019). A common animal welfare assessment is provided by scoring guides such as the Welfare Quality® Assessment protocol for pigs (Welfare Quality®, 2009). Based on defined indicators for animal-, management- and resource-based measures, the animal welfare level can be assessed by means of a point system (Welfare Quality®, 2009). It must be considered that the evaluation could be influenced by the subjective decision of the observer (Blatchford, 2017). Moreover, welfare assessment protocols provide discontinuous information based on a snapshot during the whole production period taken by the farmer or competent authority. As a consequence, this method of animal welfare assessment may only be applied as health monitoring with limitations (Pfeifer et al., 2019; Chapa et al., 2020).
Precision Livestock Farming (PLF) supports on-farm self-monitoring (Berckmans, 2017). Among other things, PLF includes the recording, processing, and provision of data in agriculture. By integrating various technologies such as sensors, data analytics, and automation, it aims to improve herd management and animal welfare (Berckmans, 2017; Werkheiser, 2020). In pig farming, the most widely used sensors measure the environmental conditions in the barn, such as temperature and relative humidity (Huynh et al., 2005a; Vermeer and Hopster, 2018). The use of sensors for continuous health monitoring at group or individual animal level is not as widely used in pig farming as in, e.g., dairy farming. Concerning the increasing number of animals per farm and per caretaker, and the increase in animal welfare requirements, the possibilities for sensor-based recording of animal data are advantageous.
In pig farming, continuous measurement of animal activity behavior could support health monitoring and may serve as a direct animal-based indicator of animal welfare (Gómez et al., 2021). Especially in intensive housing systems, the activity behavior can be influenced by several factors such as the quality of the environmental enrichment (Zwicker et al., 2012), health constraints due to diseases (Martínez-Avilés et al., 2017), and lameness (Heinonen et al., 2013). By quantifying the pigs’ activity patterns, deviations from normal behavior can be identified and timely action be taken to ensure optimal animal welfare (Statham et al., 2009; Martínez-Avilés et al., 2017). For example, in an attempt to predict outbreaks of tail biting, Statham et al. (2009) found that activity was significantly higher four days before a severe outbreak compared to the control group. In addition, the barn climate influences the activity of the pigs, as the animals react to temperature fluctuations (Ngwabie et al., 2011) and relative humidity (Huynh et al., 2005b) with altered behavior. Ngwabie et al. (2011) verified that an increase in indoor temperature led to a decrease in animal activity.
Different technologies for measuring animal behavior have been tested in scientific studies and are already available on the market. Kapun et al. (2020) were able to use RFID (radio-frequency identification) technology to measure activity in the feeding and exploration area with a sensitivity of 80%. RFID requires tags attached to the individual animal, whereas video-based activity detection is often performed at the group level in pigs. Image processing techniques, in which foreground and background objects can be distinguished based on pixels and deep learning techniques, can be used to measure feeding activity (Alameer et al., 2020), lying positions (Riekert et al., 2020), and activity related to climate variations in the barn (Costa et al., 2014). Currently, RFID technology for measuring activity is only used in scientific research (Kapun et al., 2020) and camera technology is often a cost-intensive investment (Arulmozhi et al., 2021).
Passive Infrared Detectors (PIDs) provide another possibility to measure animal activity on a group level as a cost-effective (Ni et al., 2017) and easy-to-use technology. PIDs were first tested by Pedersen and Pedersen (1995) to measure activity under laboratory conditions. Since then, several researchers have used PIDs under laboratory conditions with simulated pigs (Cai et al., 2019), in piglet rearing (Besteiro et al., 2018b; Besteiro et al., 2021), and fattening pigs under trial conditions (Jasmund et al., 2020). As far as the authors were aware, no study has yet focused on whether PIDs also provide reliable activity data for specific focus areas, e.g., feeding and enrichment, in pen with fattening pigs, on-farm, and what challenges could potentially arise. Therefore, in this study, PIDs were tested on seven different commercial farms, with a focus on the following research questions:
1. Do PIDs provide reliable activity data for group activity, activity in the feeding, and the exploration area in fattening pigs?
2. What valuable information can be derived from the data of the PIDs about the activity patterns of pigs?
3. Is there a relationship between PID-measured activity data and barn climate characteristics?
This study aimed to provide valuable information on the practical use of PIDs in pig farming, focusing on measuring group-, feeding- and exploration activity to support and improve management and animal welfare.
2 Materials and methods
2.1 Description of farms, focus pens and animals
The results of the present study are based on the data collection from seven fattening pig farms in Germany, where PIDs were tested under on-farm conditions. All farms were conventionally managed and housed fattening pigs with typical breeding lines, kept on a fully slatted concrete floor. In each of the seven farms, a compartment representative of the corresponding farm was selected. In this compartment, a so-called focus pen was chosen and the activity of the fattening pigs as well as important environmental parameters within this pen were recorded. For further data evaluation, three continuous 24 h time periods were selected for each farm, in which no technical disturbances, changes in the typical farm routine, or other similar events impacted the recording or the behavior of the animals.
The compartments and pens of the farms differed in design. In general, pens differed in size, position of functional areas, and provision of enrichment materials. On average, the space allowance was 0.8 m² per animal. Enrichment materials were offered, e.g., chains, plastic balls, seesaws of different materials and organic substrates such as straws (from rack) or wooden sticks. Depending on the pen design, the functional areas of feeding (in the feeding area) and exploration (in the exploration area) were more or less well separated. For example, Figure 1 shows pens with non-separated, overlapping functional areas in Farm 1 (A) with separate, clearly distinguishable functional areas in Farm 2 (B).
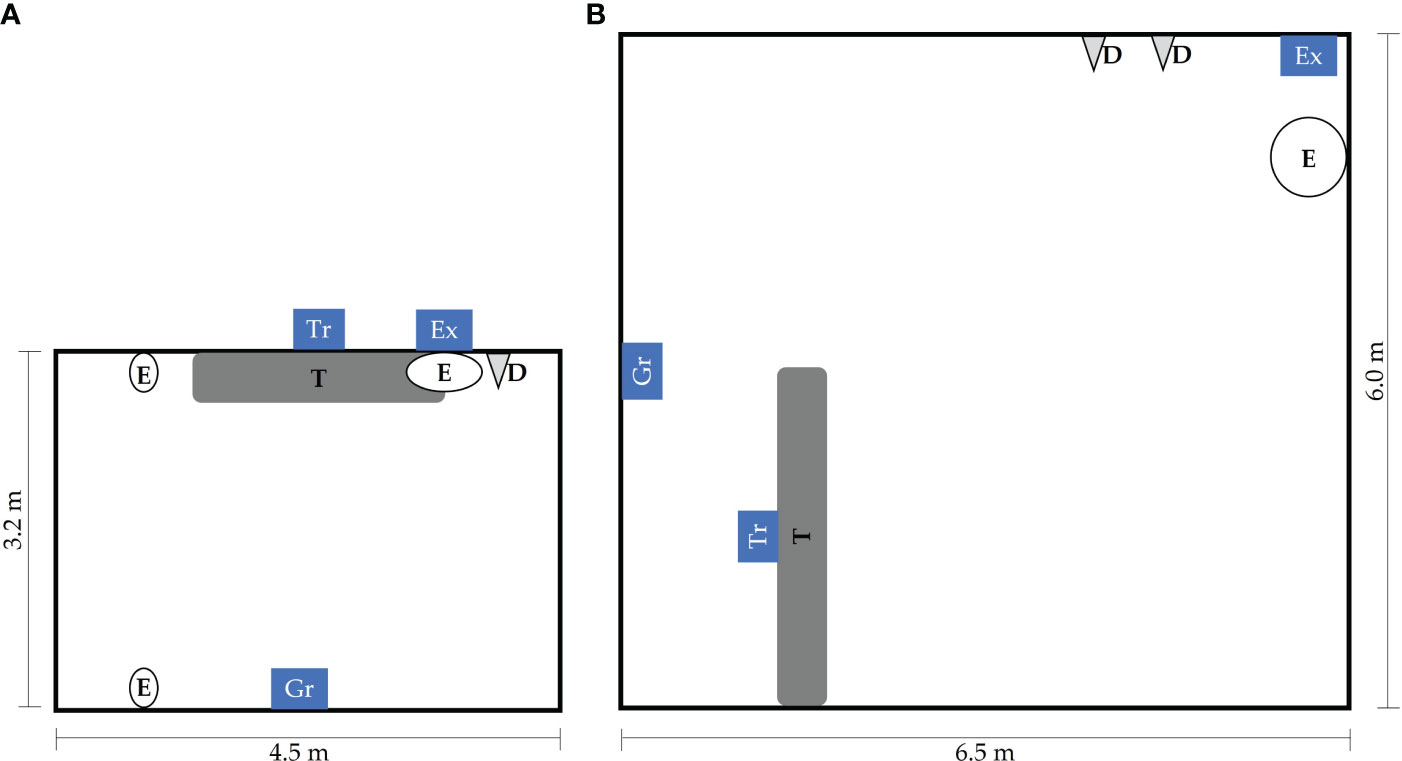
Figure 1 Pen with non-separated, overlapping functional areas for feeding (T = trough area) and exploring (E = exploration area) in Farm 1 (A) as well as pen with separated, clearly distinguishable functional areas in Farm 2 (B). Also shown in both are the drinkers (D) and the position of the three PIDs used for the measurement of activity of the group of animals (Gr), in the feeding area (Tr) and in the exploration area (Ex).
In particular, the corresponding farm-specific focus pens differed in the number of animals, group composition, fattening phase, and estimated average animal weight (see Table 1).
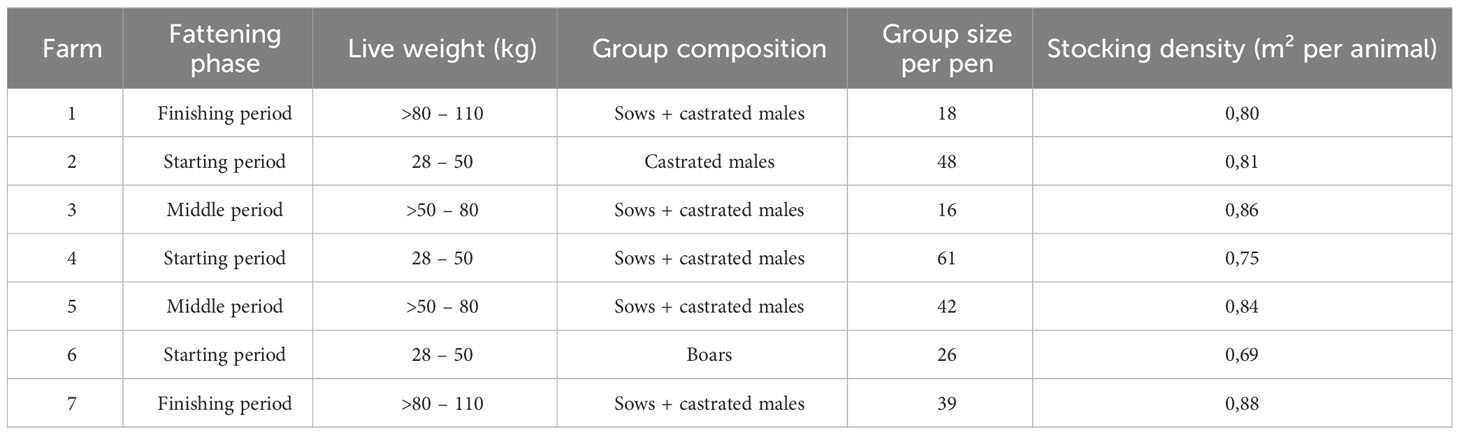
Table 1 Overview of farms.
On a total of 6 of the 7 farms, the animals were fed restrictively by a liquid feeding system with a sensor. The frequency of the feeding phases and dosing intervals during the course of the day significantly differed from two to ten. Farm 4 differed from the other farms as feed was available to the animal’s ad libitum via a mash feeder. The light and dark periods differed depending on the farm-specific light management and the corresponding season. All selected compartments had natural daylight (via windows) and artificial lighting.
2.2 Activity measurement by PIDs and visual assessment as reference method
The activity of the animals was recorded in each focus pen with a total of three PIDs (item no.1362922, Renkforce, Conrad Electronic SE, Hirschau, Germany), as indicated in Figure 1. One sensor recorded the activity of the entire group of animals in the focus pen to provide general information on periods of resting and periods of activity. A second sensor documented activity in the feeding area and thus recorded, for example, the activity during the feeding phases throughout the day. A third sensor recorded the activity in the exploration area based on the interaction with the enrichment material. If different enrichment materials were available to the animals in the pen, the PID was focused on the area most often occupied by the pigs. For this purpose, the interaction with the materials was observed before the placing the PID. The sensor’s signal output depended on both the temperature difference between the moving body and the floor, as well as the velocity of the moving body (Pedersen and Pedersen, 1995; Ni et al., 2017). More technical details of the PIDs such as output, installation of a signal light, and covering of the lens to limit the area recorded, are described by Jasmund et al. (2020). The data were stored every minute using a data logger (ALMEMO®, Ahlborn Mess- und Regelungstechnik GmbH, Holzkirchen, Germany).
Depending on the housing conditions, 2 - 3 infrared cameras (König Electronic SEC-CAM35B, Nedis B.V., ‘s-Hertogenbosch, Netherlands) were installed in each focus pen to validate PID using video recordings. To validate the group-related PID data, scan sampling was used at 10-minute intervals (144 frames per day and 432 frames per farm). For the evaluation of the PID data of the activity in the feeding and exploration area, it was previously investigated if the animals also showed activity such as eating or exploring at night. Because in the vast majority of cases, there was no activity at all, the night hours were excluded from further evaluation of the still frames, so that still frames from 5.00 – 23.00 h were evaluated at 10-min intervals (109 frames per day or 327 still frames per farm).
In addition, frames were assessed one second before and one second after to better judge whether animals were moving. To be able to make decisions in borderline cases, video frames were also viewed ten seconds before and ten seconds after the frame under discussion. The evaluation of the frames, regarding the activity and behavior of the animals, was run based on a previously determined ethogram (Table 2).
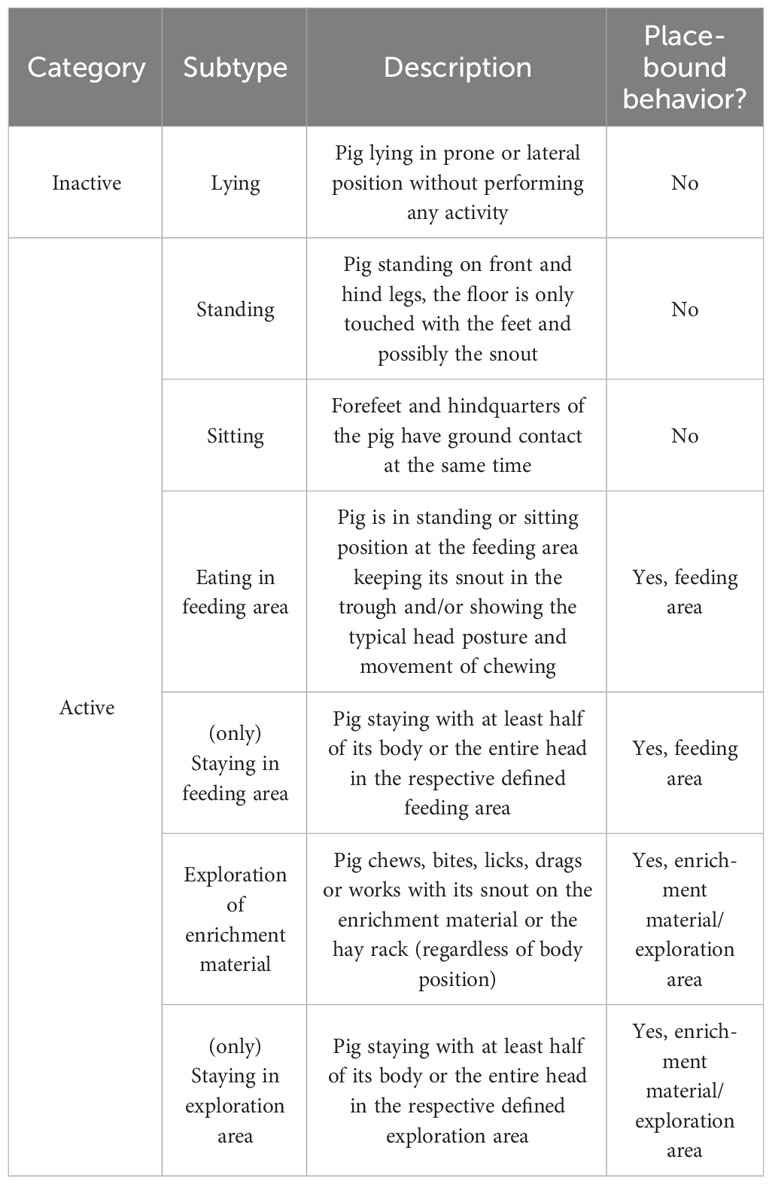
Table 2 Definition and assignment of behaviors.
The area within one animal length around the trough and the corresponding enrichment material was defined as the feeding and exploration area, respectively. Figure 2, for example, shows the spatial outline of the focus areas for the visual observation based on the videos.
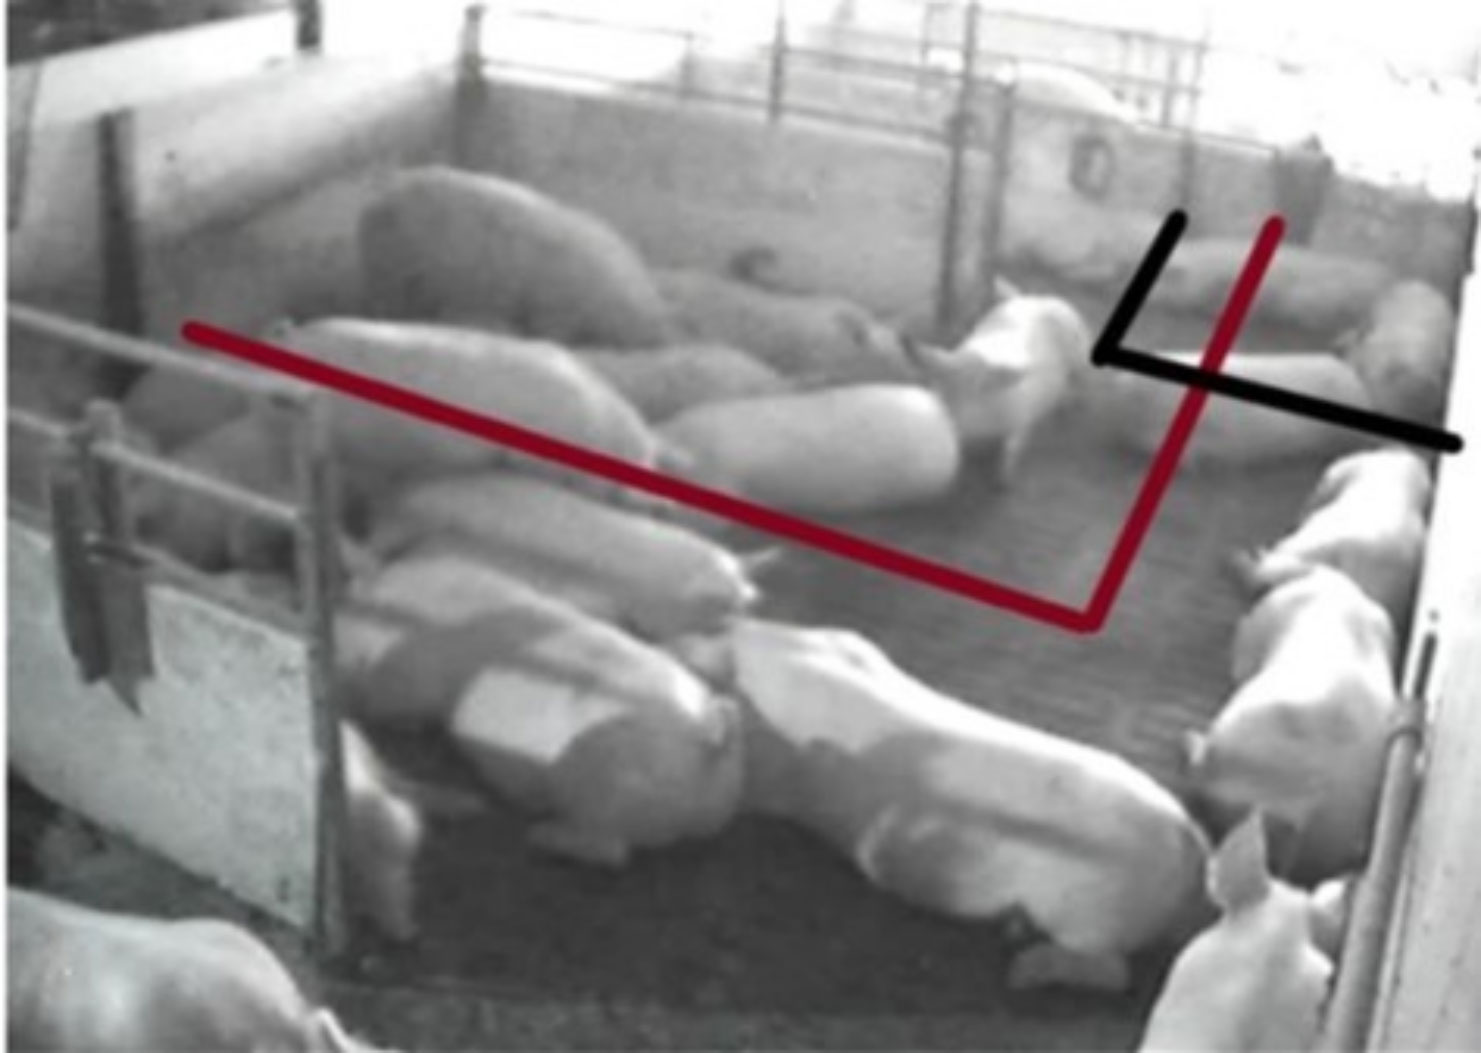
Figure 2 Exemplary representation of the focus areas feeding (red) and exploration (black) within the visual evaluation.
To compare the PID data (output in %) with the visual observation, the level of activity was determined (ratio of number of pigs per behavior and total number of animals in the specific focus area). The total activity of the group was determined based on the sum of all behaviors, except lying. The activity in the feeding and exploration area was calculated by comparing the number of animals eating or exploring with the general number of animals in the specific focus area. Live weight was calculated by multiplying the number of animals by their average weight and used to determine if the live weight per pen affected the group activity measurement of the PIDs.
2.3 NH3 concentration and Temperature Humidity Index (THI)
NH3 concentration (Polytron C300 equipped with DrägerSensor© NH3 AL, Dräger, Lübeck, Germany), as well as air temperature and relative humidity (FHAD 46-C2, ALMEMO®, Ahlborn Mess- und Regelungstechnik GmbH, Holzkirchen, Germany), were also measured every minute in the focus pens and stored on the same data logger as the activity data of the PIDs.
Based on the data on temperature and relative humidity, the THINOAA was calculated according to Vitt et al. (2017):
whereby dry bulb temperature is given by TDB (= air temperature T, °C), and relative humidity by R (%). A THINOAA-value of ≥ 72 was assumed as a threshold with a negative economic impact on fattening pigs (St-Pierre et al., 2003; Vitt et al., 2017).
2.4 Processing of data and statistical analysis
Due to technical problems and an obstructed field of view, a visual assessment of activity in the exploration area could not be conducted for Farm 6.
IBM SPSS Statistics version 29 (IBM, New York, NY, USA, 2022) was used for the statistical analysis of the data. Since the data were not normally distributed (checked by the Kolmogorov-Smirnov test), the quality of the linear relationship between the PID data and the visual assessment was calculated using Spearman–Rho. The strength of the effect size of the determined correlations was assessed using the classification by Cohen (1988). Nonparametric tests (Mann-Whitney-U and Kruskal-Wallis test) were used to check for significant differences (α-level set at p ≤ 0.05). The further analysis of the PID data is descriptive. To present the data graphically or to adapt the data to the respective question, data were averaged and summarized for specific phases or periods.
3 Results
3.1 Comparison between PID data and visual assessment
To assess if the PIDs are suitable for measuring group activity and activity in specific focus areas on the farm, the activity recorded by PID and activity determined by video recording were correlated for each farm individually. The correlations between the general group activity and activity in the feeding and exploration areas measured by PIDs and visual assessment are given in Table 3.
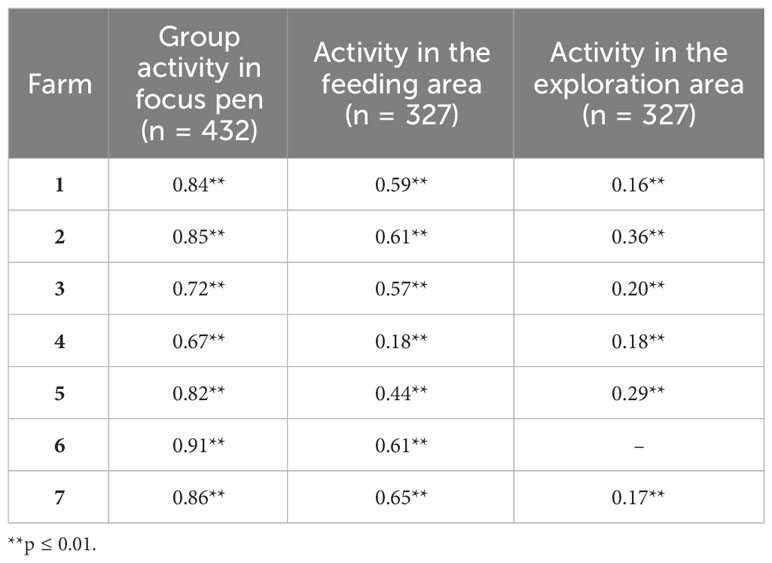
Table 3 Correlations between animal activity using PIDs and visual assessment based on still-frames (n) for group activity, activity in the feeding and exploration area for all farms.
A strongly significant correlation between group activity measured by PID and visual assessment was found for all farms (r = 0.76; p < 0.001; n = 3024). The strongest correlation was on Farm 6 (r = 0.91; p < 0.001; n = 432). The other farms also showed strong significant correlations between 0.61 - 0.86 (p < 0.001; n = 432). Figure 3 shows an example of the daily course of group activity measured by PID compared to the visual assessment for Farm 5 (r = 0.83; p < 0.001; n = 432). The figure demonstrates that activity peaks differ in intensity but are the same in their progression.
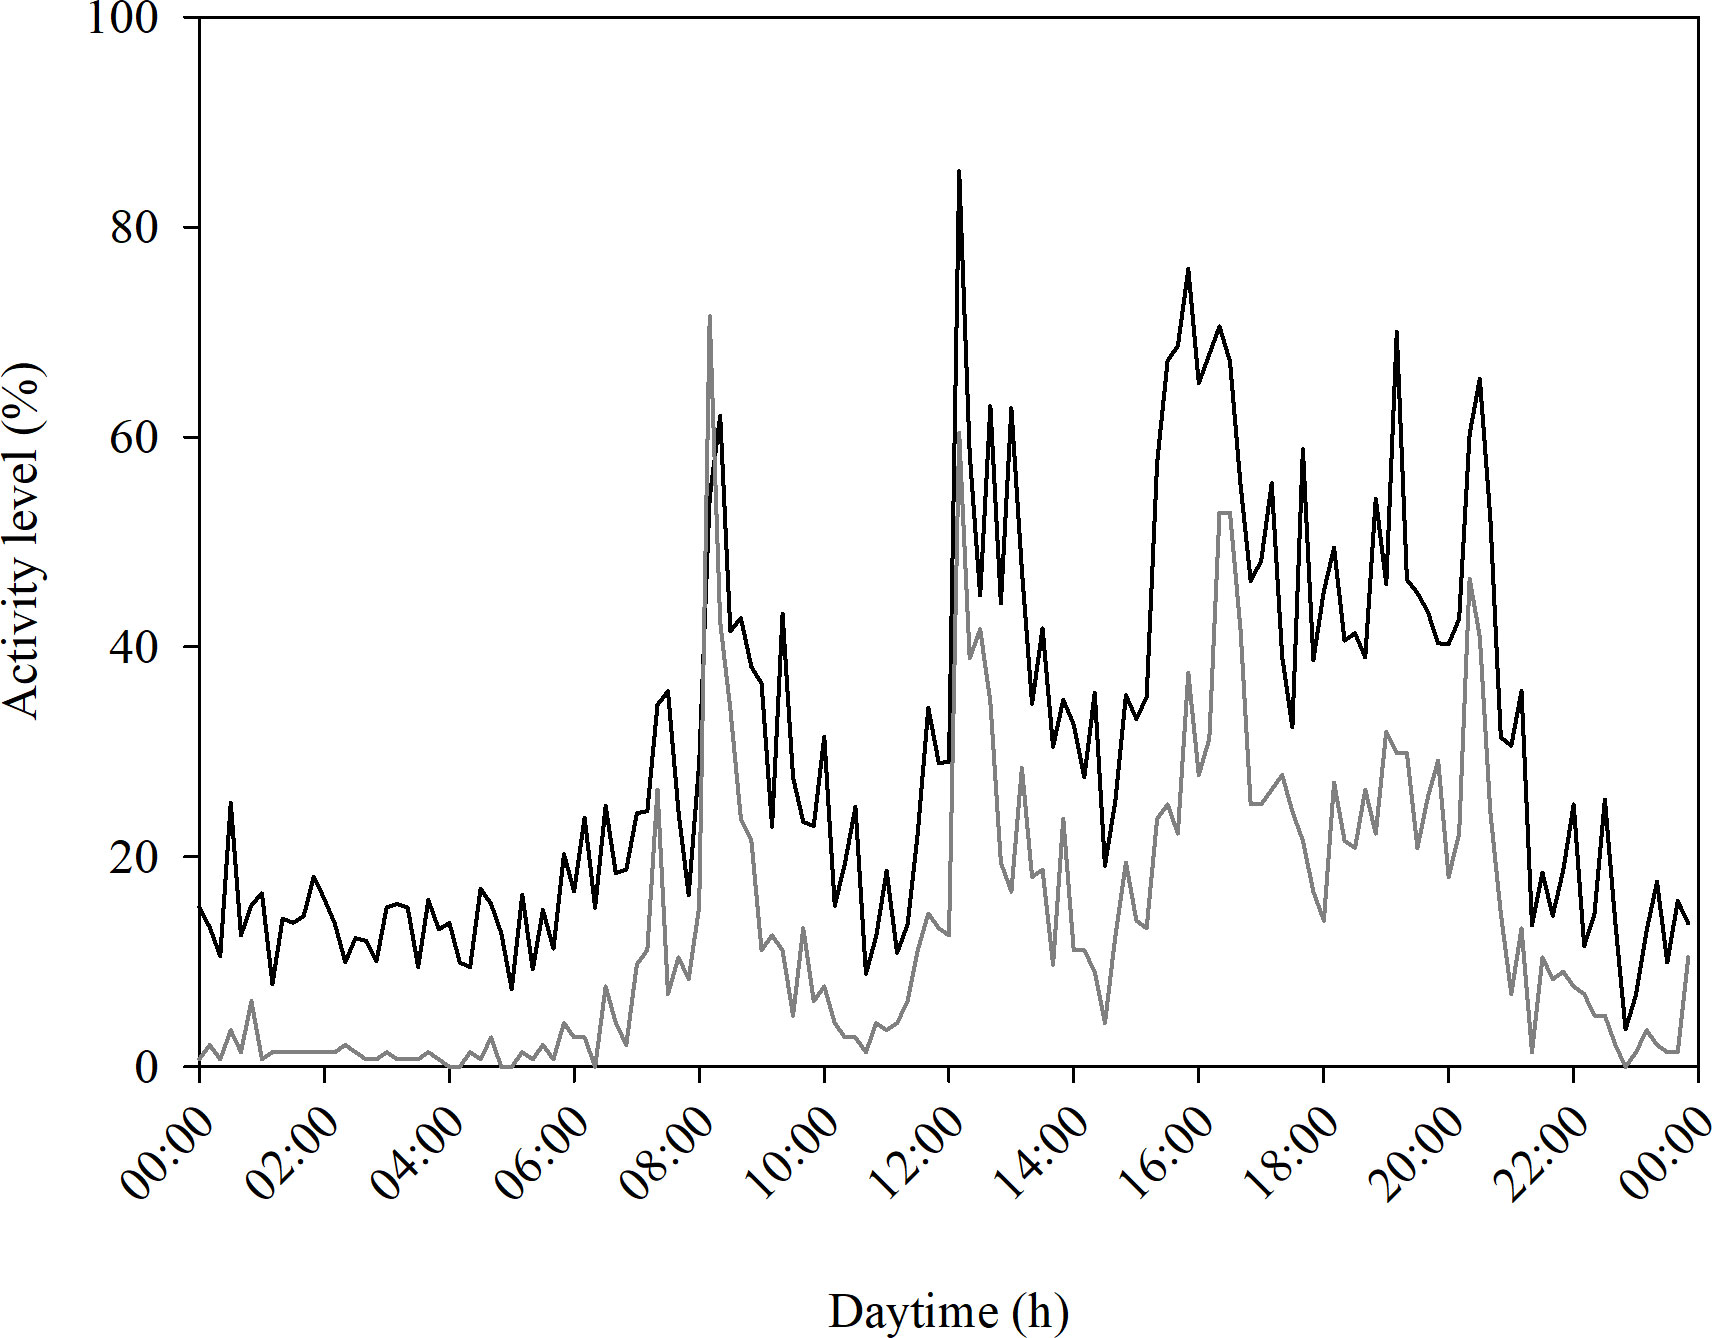
Figure 3 Comparison of the course of group activity measured by PID (black line) and visual assessment (gray line) shown for Farm 5 (r = 0.83; p < 0.001; n = 432). The figure shows the averaged data over the entire three focus days based on still frames at 10-min intervals.
Significant correlations between the feeding activity measured by PID and visual assessment were found with medium or large effect strength from 0.44 - 0.65 and with Farm 7 showing the strongest correlation (p < 0.001; n = 327). Only Farm 4 showed a significant correlation with a small effect strength of 0.18 (p < 0.001; n = 327).
Significant correlations with a rather small effect strength were found overall for activity measurement in the exploration area. A medium effect strength, out of the 0.36 maximum, was detected for Farm 2.
3.2 Activity patterns assessed by using PIDs and group behavior
Pigs on all farms show a diurnal rhythm with regard to the activity of the respective animal group in the focus pen. This is characterized by active phases interrupted by one or more rest phases in the course of the day as well as reduced activity or rather inactivity during the night hours. The individual farm activity patterns are decisively influenced by the different feeding regimes or feeding times and light hours (depending on seasonal differences and artificial lighting), shown as examples in Figures 4–6 for farms 2, 4, and 6.
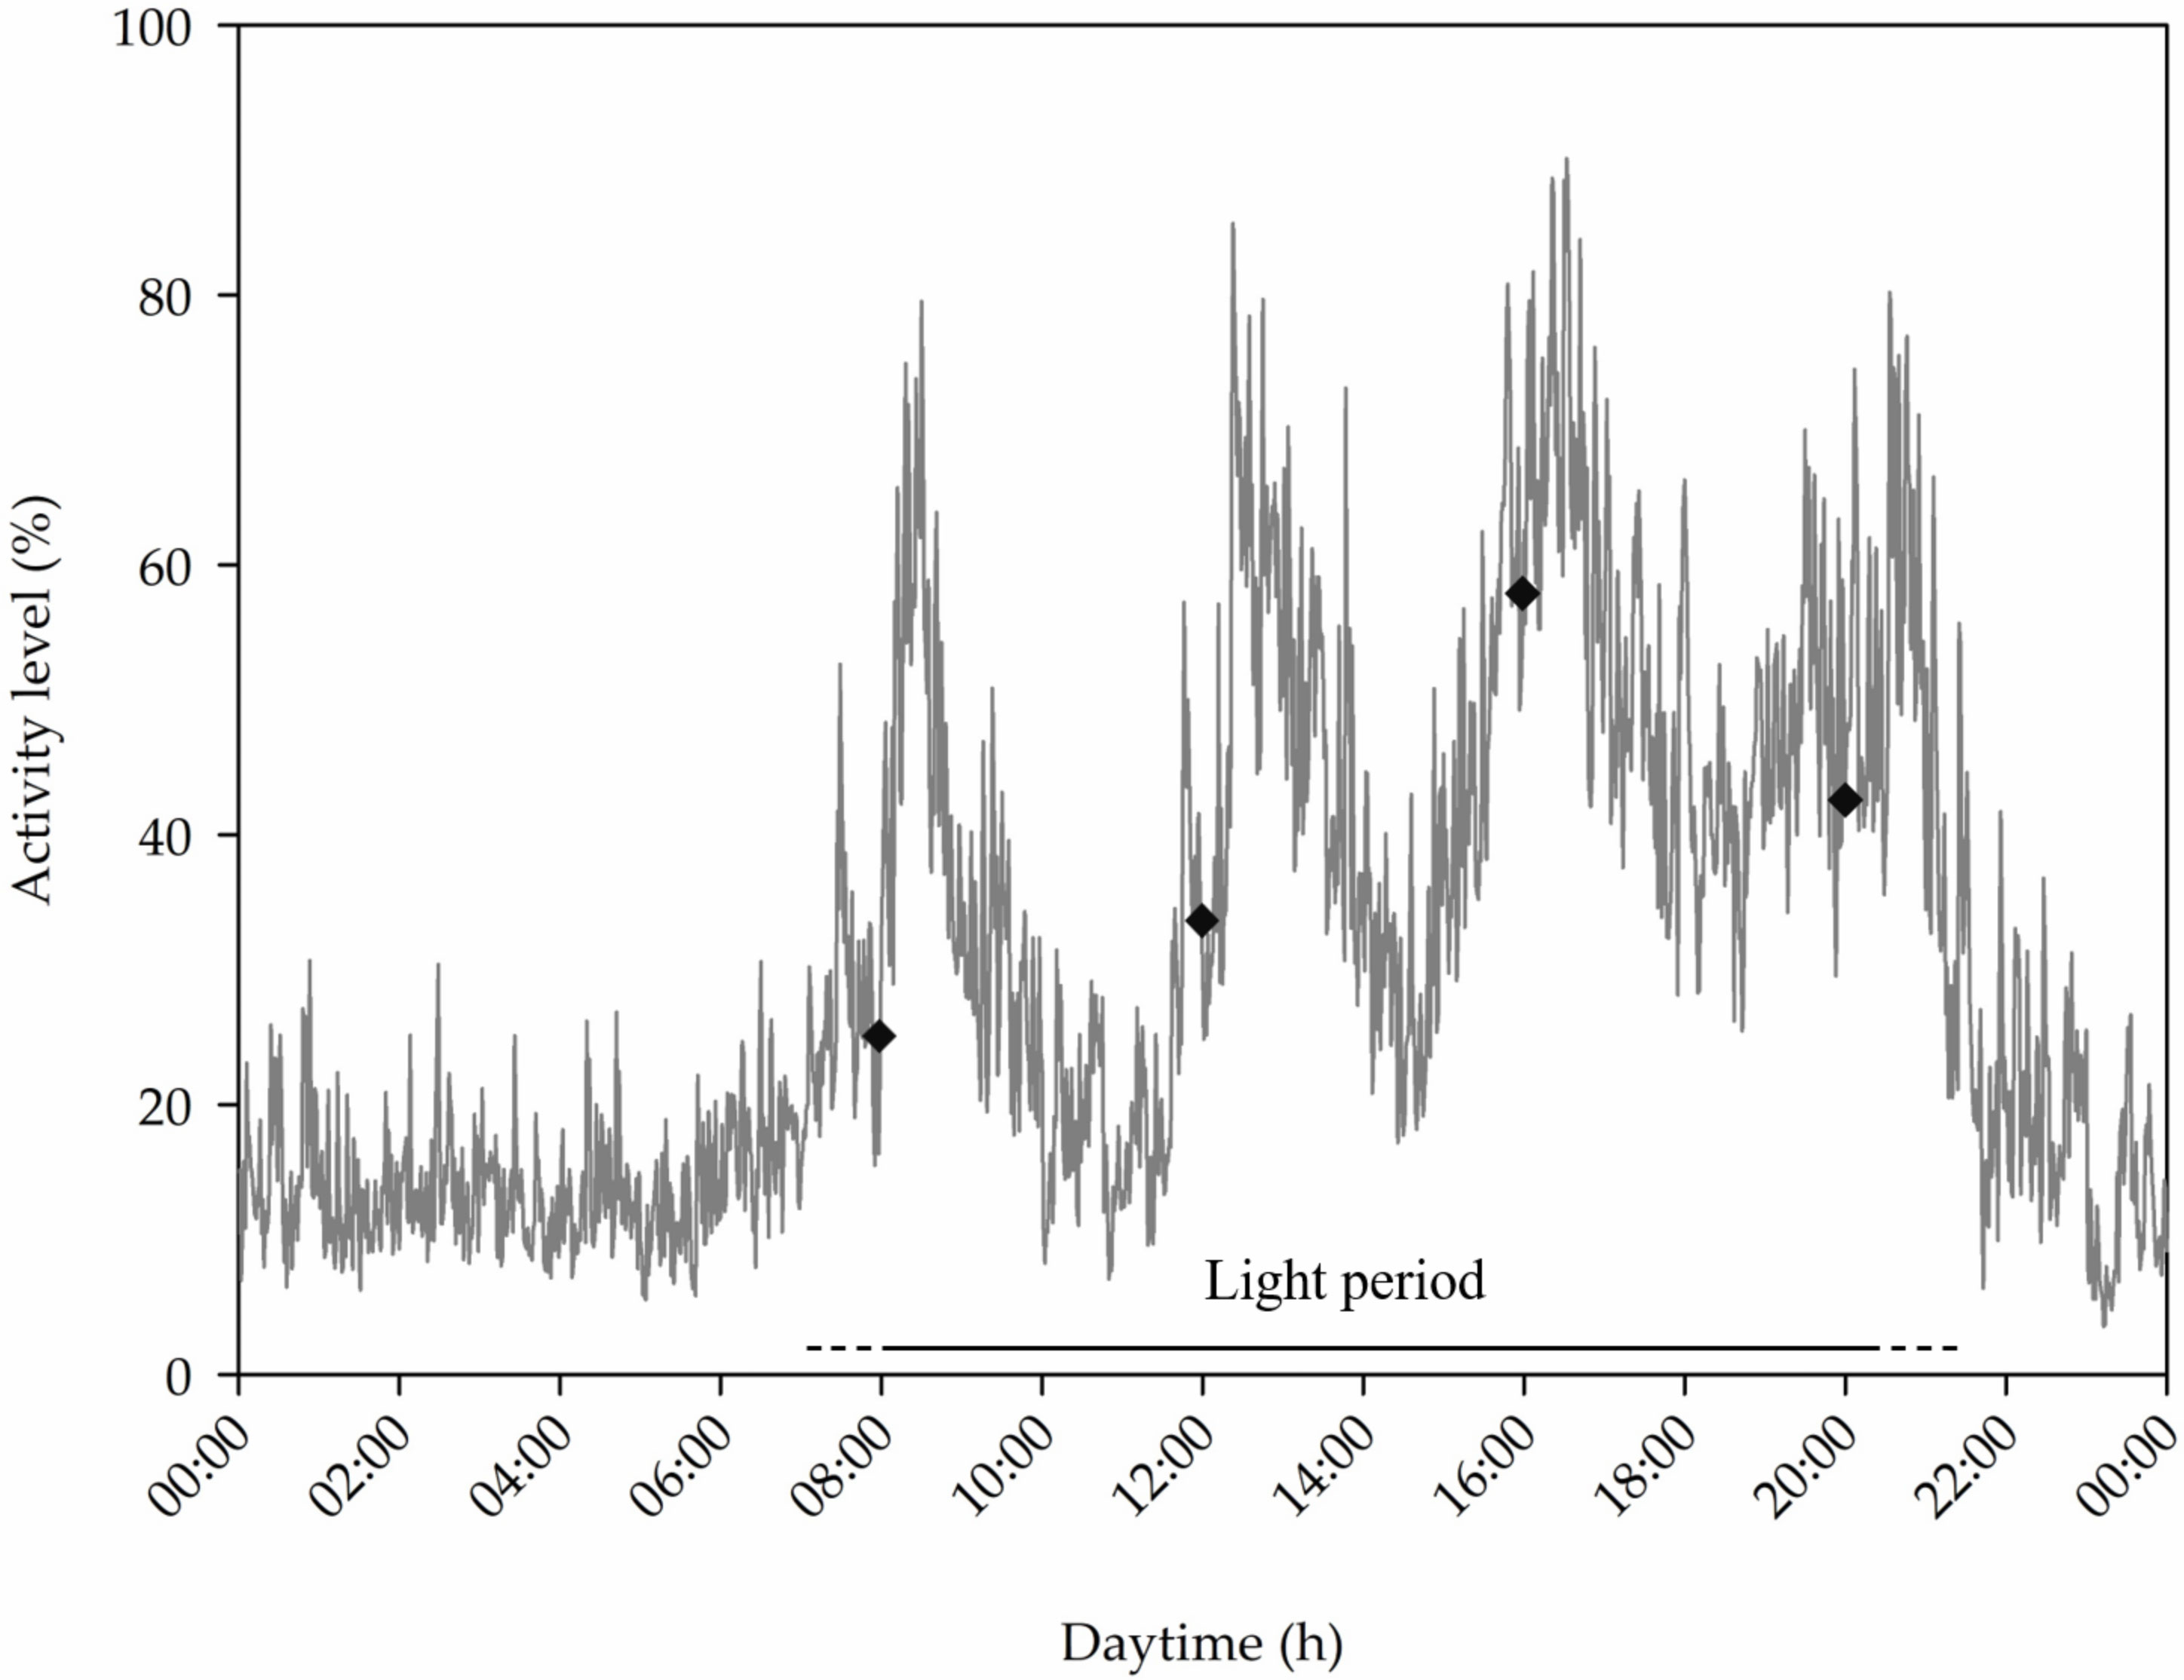
Figure 4 Diurnal rhythm of the animal activity on Farm 2 (line) and the respective start times of the total of four feeding phases during the course of the day (squares). The approximate length of the light period based on natural light incidence and artificial lighting is also presented. The figure shows the averaged data in 1-min intervals over the entire three focus days.
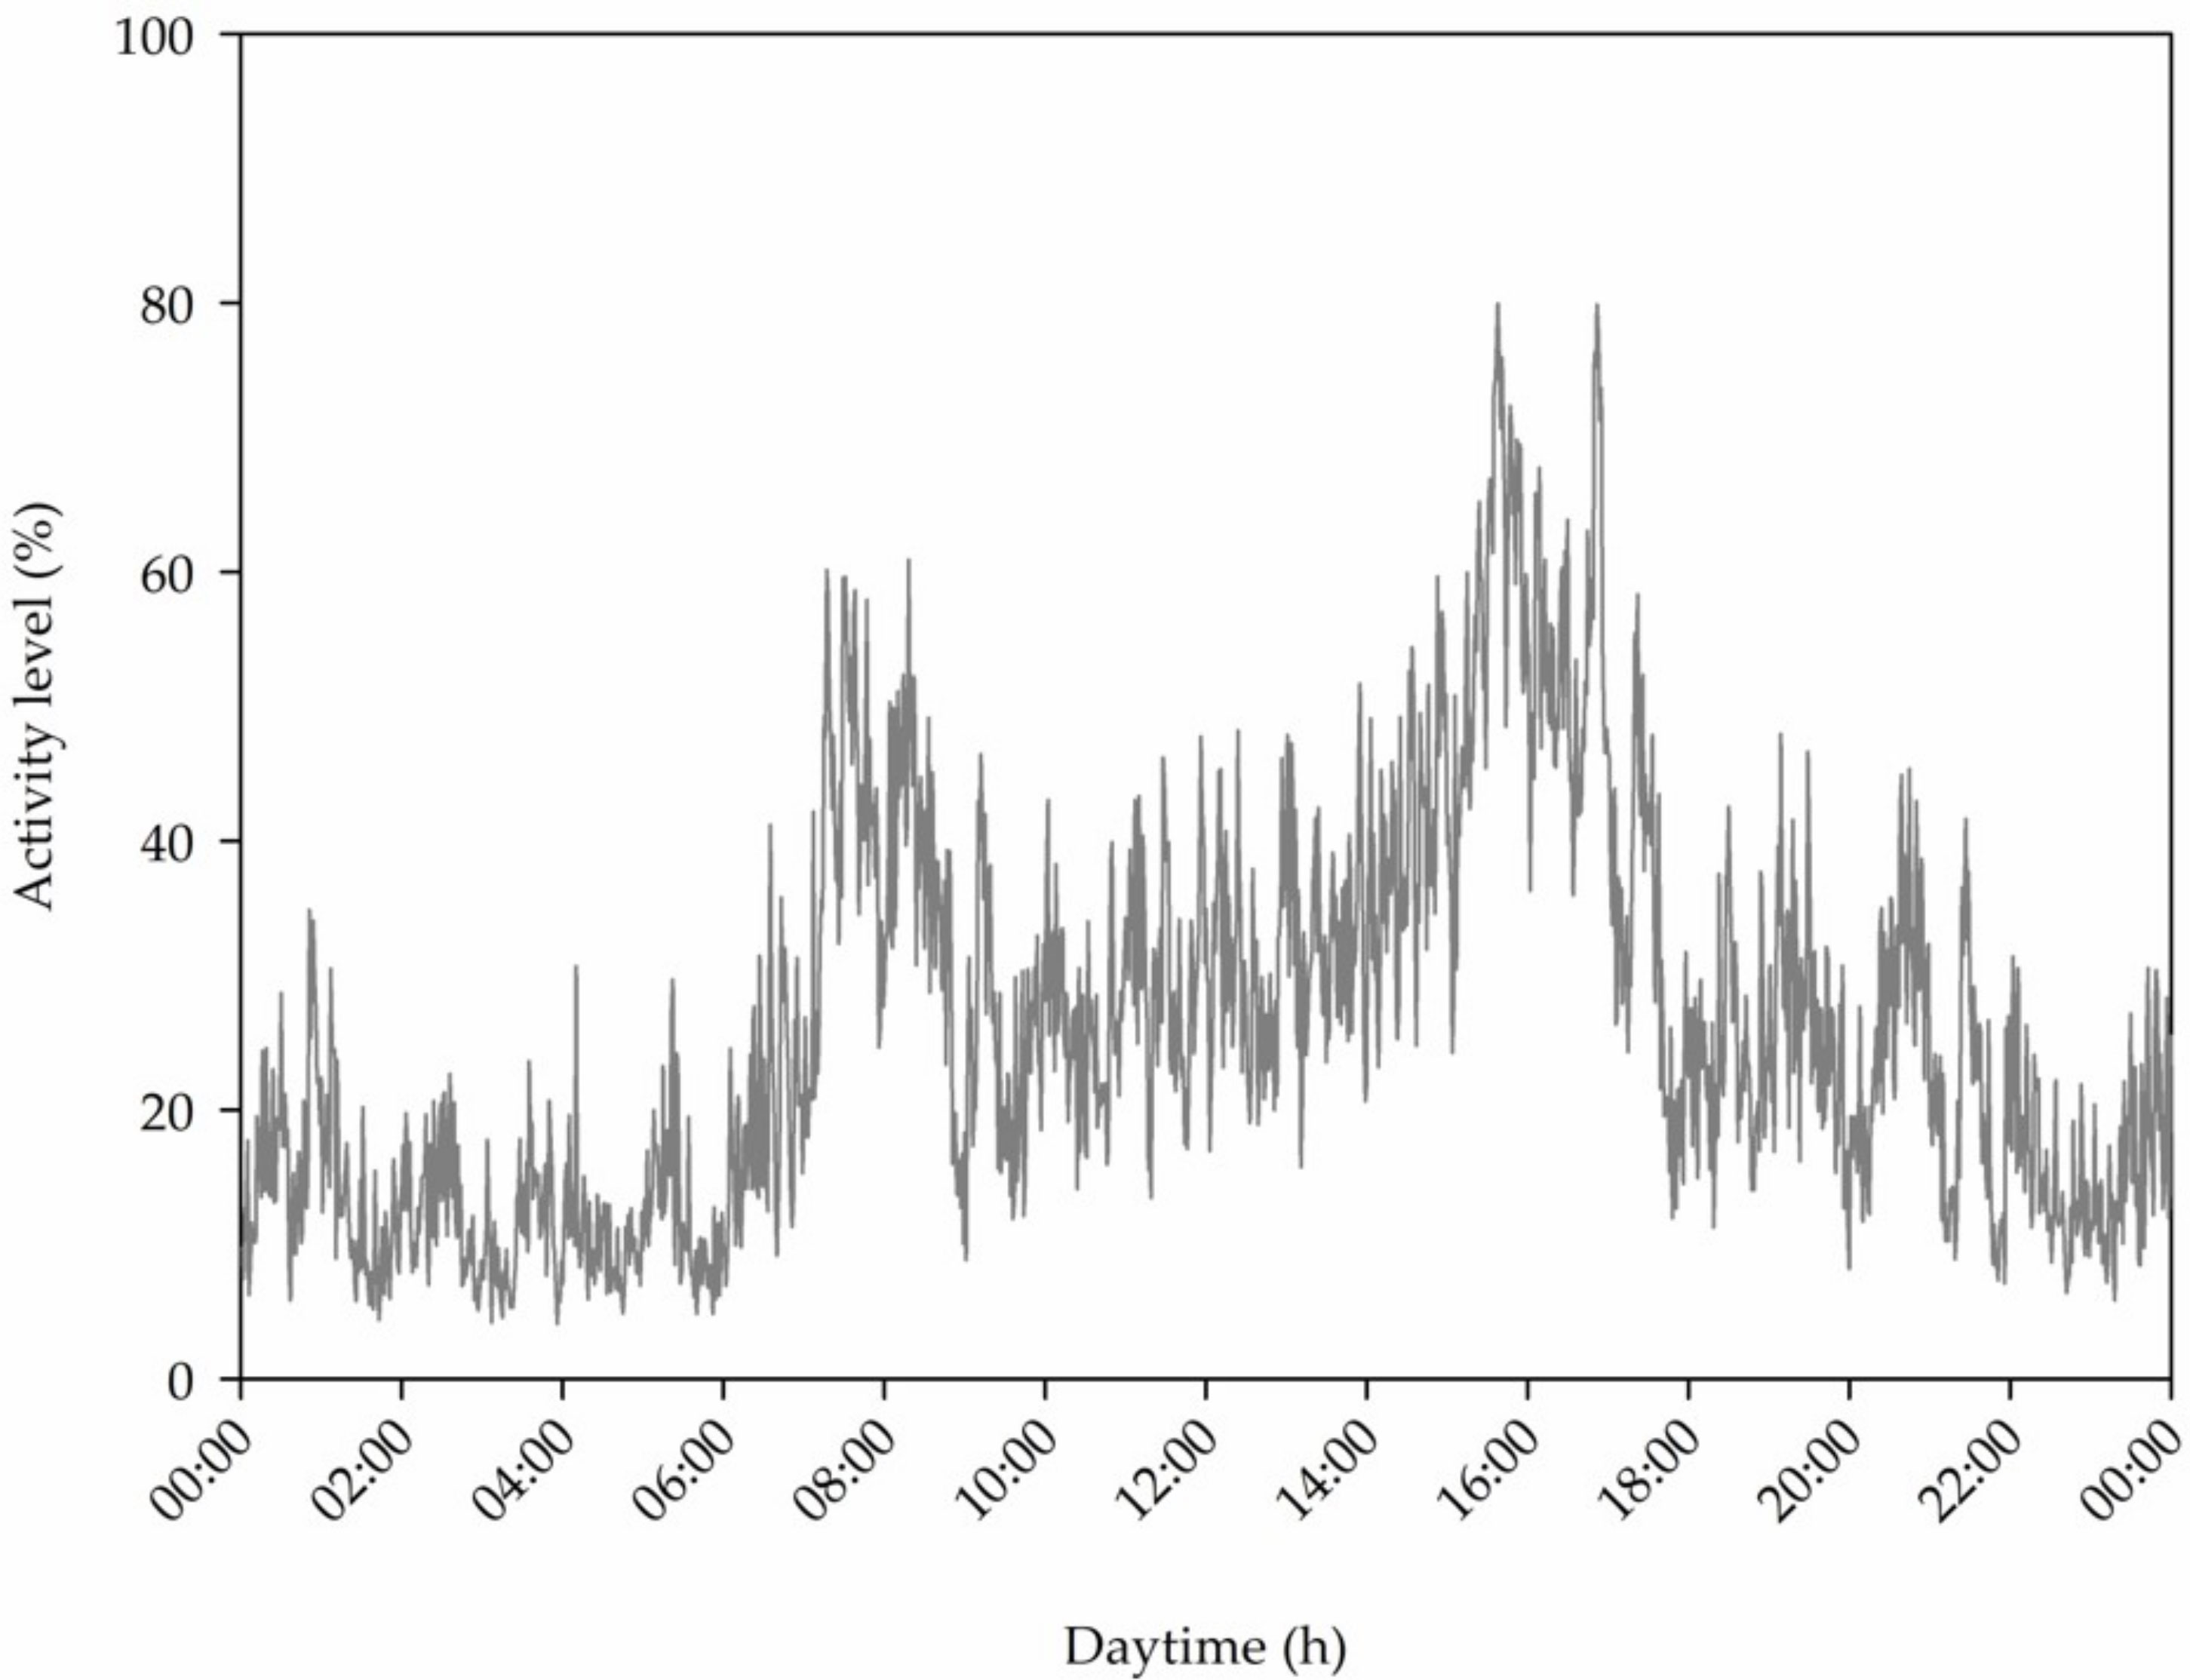
Figure 5 Diurnal rhythm of the animal activity on Farm 4 (line) with ad libitum feeding. The approximate length of the light period based on natural light incidence and artificial lighting is also presented. The figure shows the averaged data in 1-min intervals over the entire three focus days.
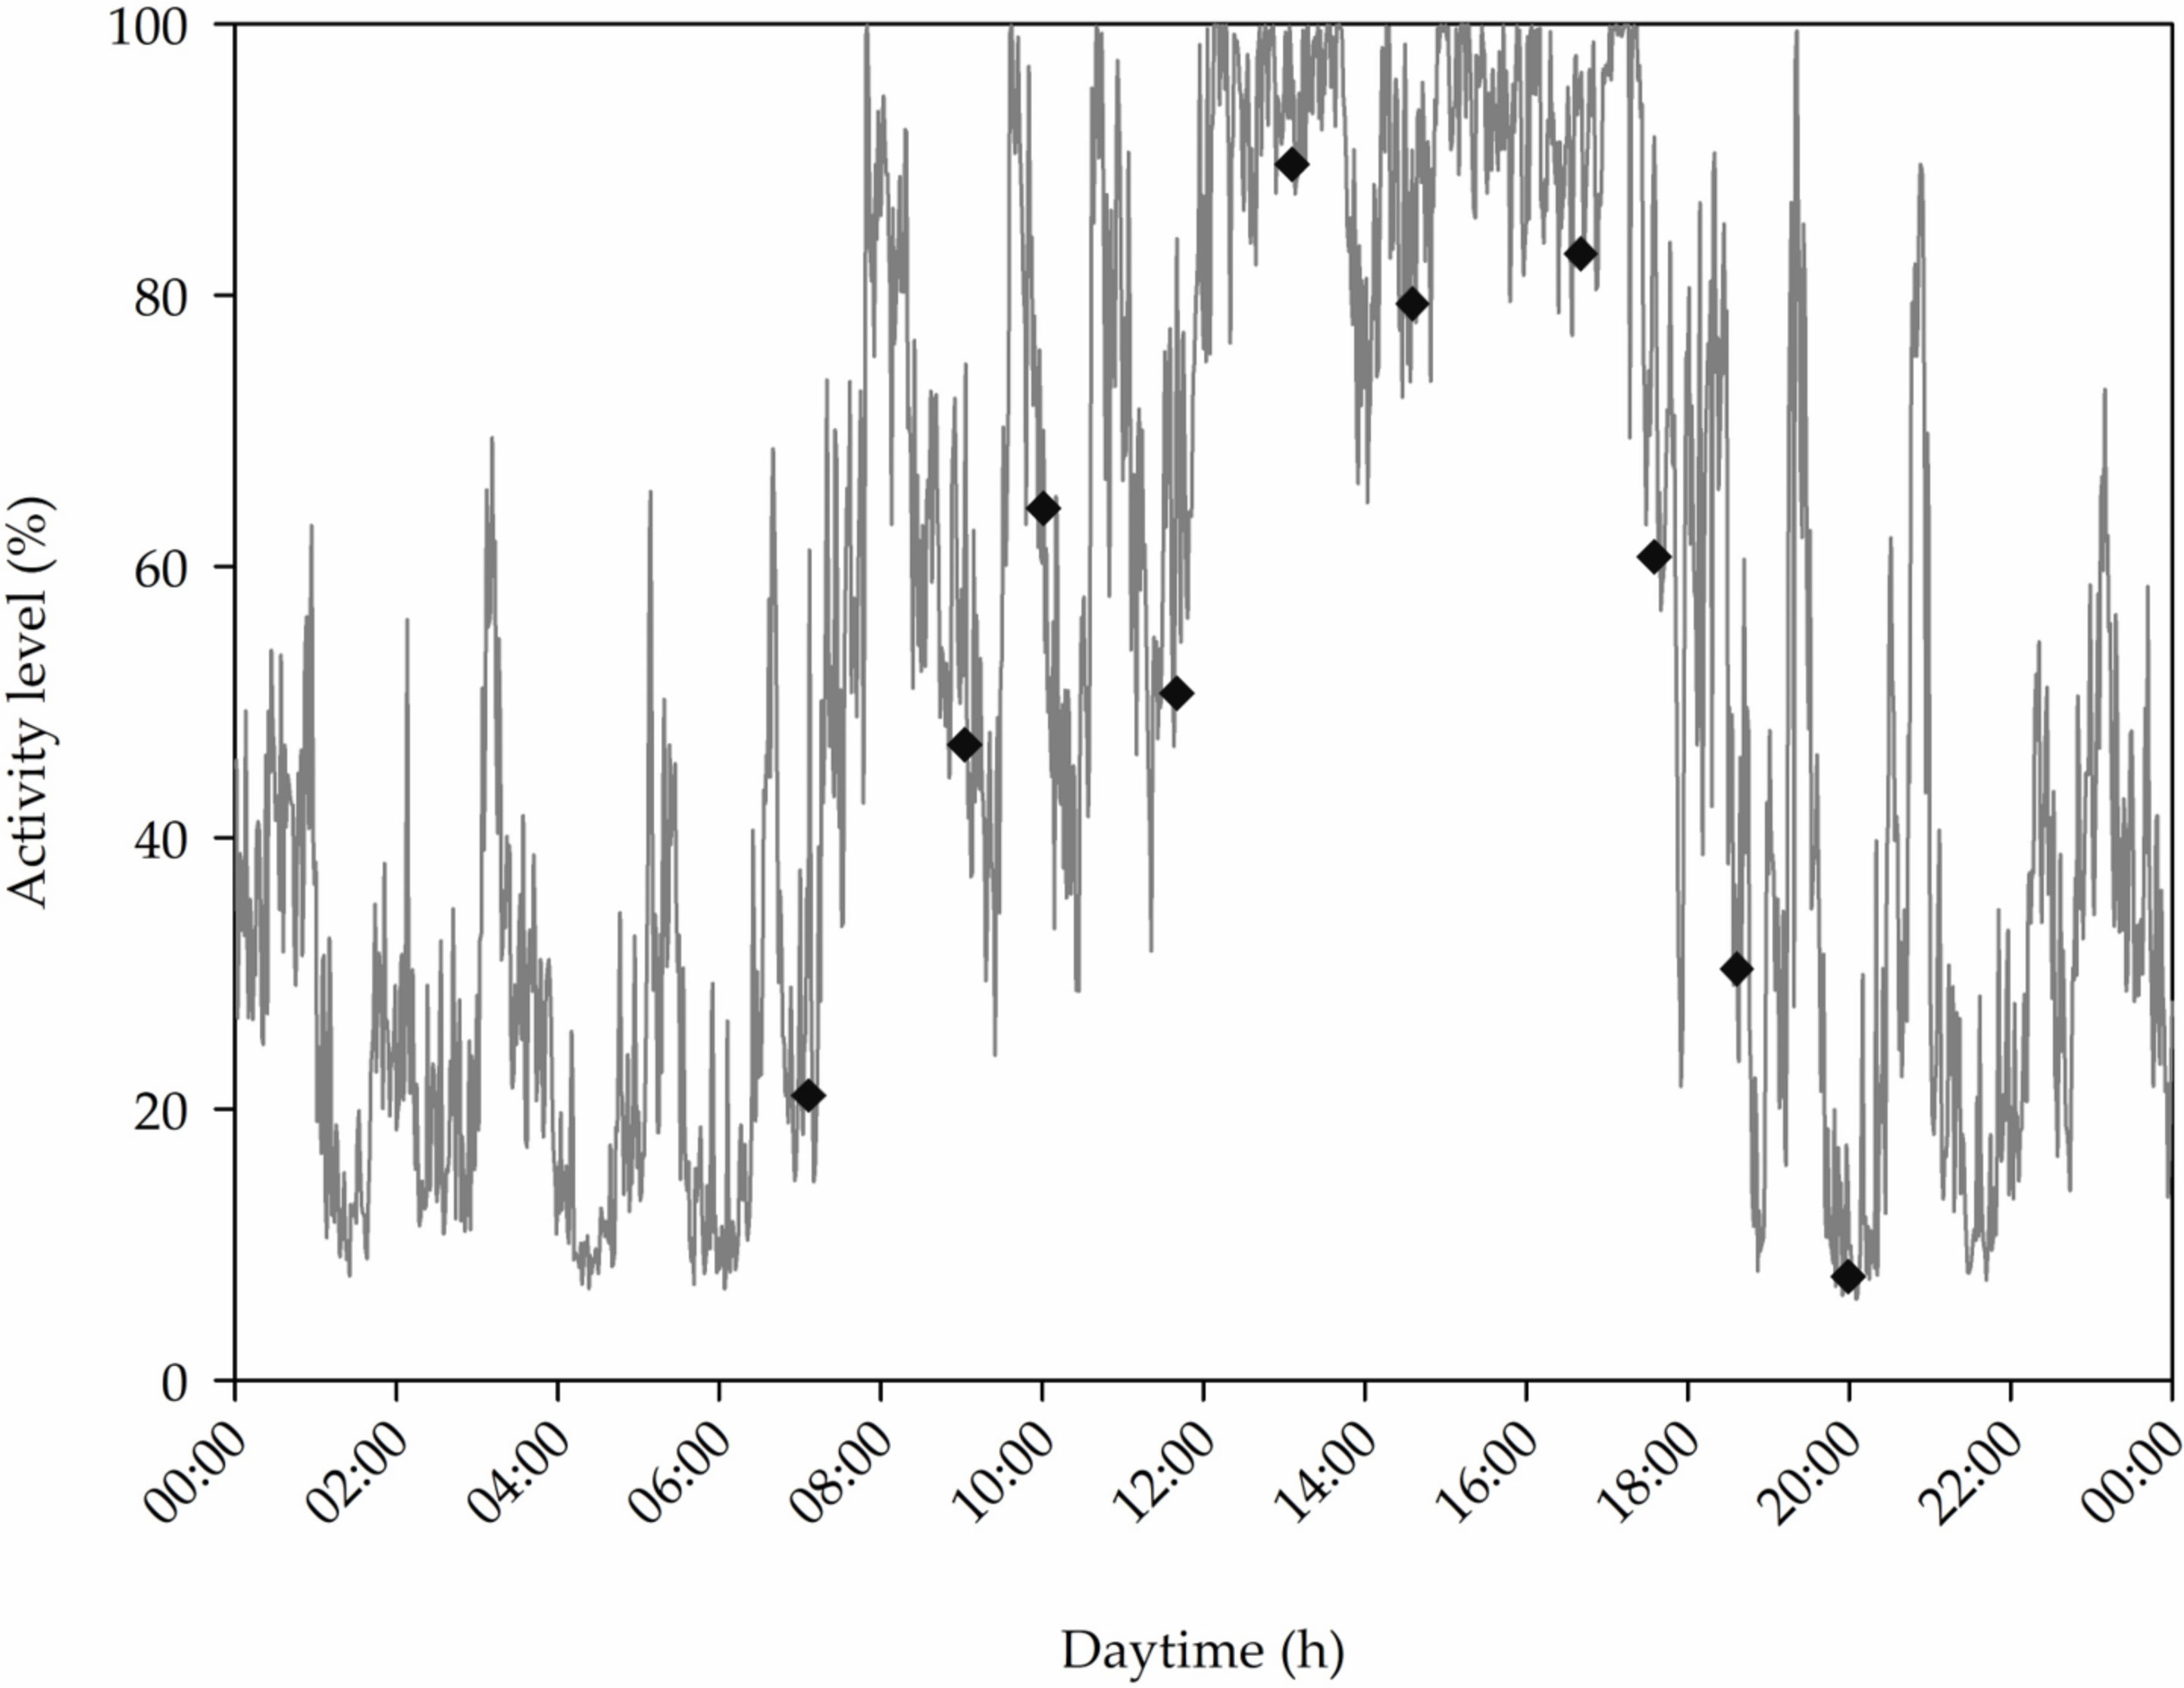
Figure 6 Diurnal rhythm of the animal activity on Farm 6 (line) and the respective start times of the total of ten feeding phases during the course of the day (squares). The approximate length of the light period based on natural light incidence and artificial lighting is also presented. The figure shows the averaged data in 1-min intervals over the entire three focus days.
Depending on the light hours and the feeding times, rest and activity phases alternate during the day. Farm 2 showed a multiphasic daily rhythm in their group activity with four activity peaks (Figure 4). In addition, the data indicate that, especially for the first two feeding phases of the day, the increase in activity relates to the start of feeding. A biphasic activity pattern, typical for pigs, was found for Farm 4, where pigs were fed ad libitum (Figure 5). Both farms showed a clear day-night rhythm. In contrast, Farm 6, with ten feeding times a day, showed a less clear rhythm in group activity (Figure 6). As shown in Figure 6, an increase in activity is partially but not necessarily triggered by the start of feeding and reached an activity level of 100% several times, especially between midday and afternoon.
However, the animal activity of the three exemplary farms was not only collated with feeding times. The animal activity of the farms was also compared with each other, considering the respective group composition. The other farms were excluded because only the three exemplary farms were in the same fattening period with different group compositions. Thus, the activity of a group of castrated males (Farm 2), a mixed-sex group (Farm 4), and boars (Farm 6) were compared.
As shown in Figure 7, the PID data for group activity on Farm 2 and Farm 4 were significantly different from Farm 6 (p < 0.001; n = 135). On average, the PID data showed higher activity on Farm 6 (M = 52.16%; SE = 1.73) compared to Farm 2 (M = 30.17%; SE = 1.05) and Farm 4 (M = 26.25%; SE = 0.98). Compared to the two other farms, the animals on Farm 6 showed activity peaks of up to 90%, especially in the afternoon, while the other groups showed activity peaks of 60%. In contrast, no significant differences were found between Farm 2 and Farm 4.
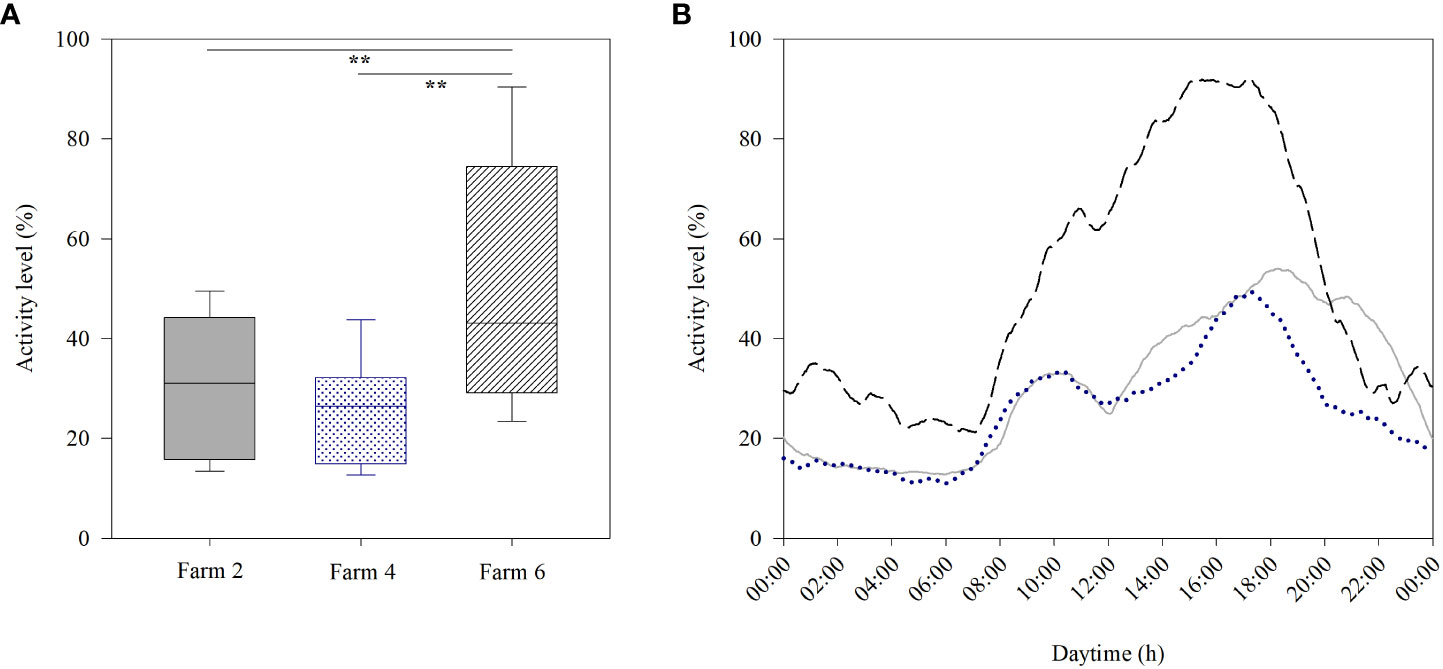
Figure 7 Group activity (A) and the activity pattern (B) of the individual farms for the entire three days. Activity is shown for Farm 2 (grey; castrated males), for Farm 4 (blue dots; mixed-sex group), and for Farm 6 (black lines; boars). Significant difference in group activity between farms are indicated ** with p ≤ 0.01.
3.3 Activity measurements with PID and barn climate
The barn climate data differs between farms and correlates with the corresponding fattening phase, season, and generally with the respective ventilation technology and management. On average, the temperature in the focus pens was 26.72°C ± 2.05°C with a range of 23.76°C - 29.53°C. The average relative humidity was 64.27% ± 7.20% with a range of 58.61% - 71.14% across farms. The average calculated THINOAA was 75.95 ± 3.21 with a range of 72.28 - 80.80 across farms. Across all farms, the average temperature range between minimum and maximum values on the three focus days was 3.14°C, while the average relative humidity range was 23.20%. Due to different seasonal trial periods affecting ammonia concentration (Ivanova-Peneva et al., 2008), a general consideration across all farms is not meaningful.
Concerning the correlation between the group activity of the animals and THINOAA, as well as the NH3 concentration, a different picture emerged based on the statistical evaluation. Table 4 shows an overview of the correlations per farm.
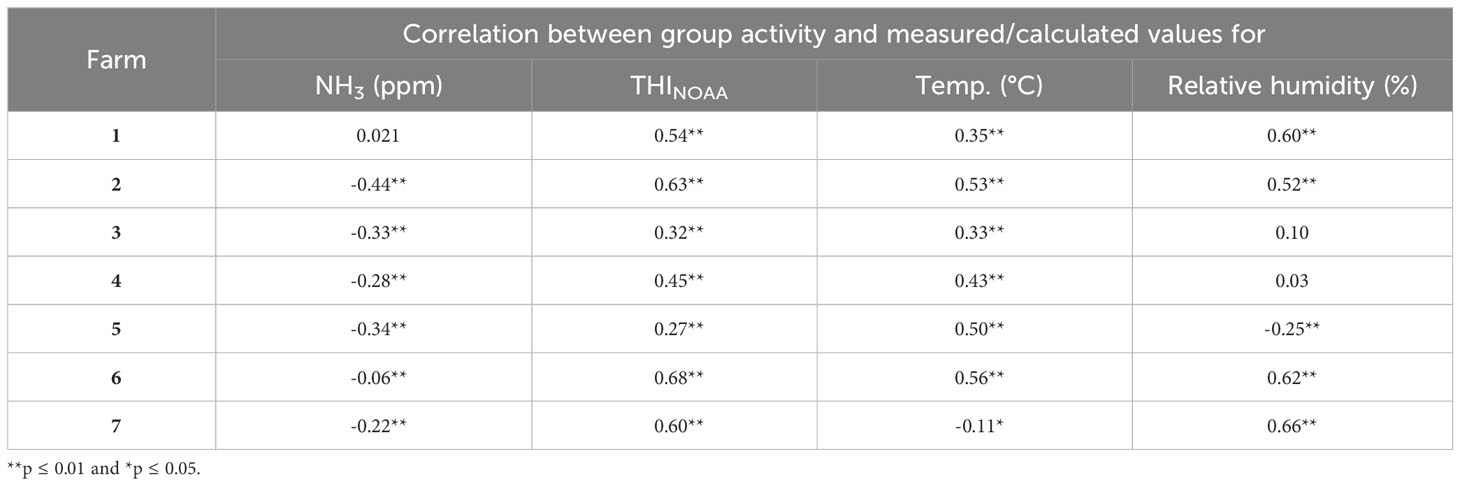
Table 4 Correlations between group activity measured by PID and barn climate (n = 432 per farm).
Except for Farm 1, significant negative correlations with small or medium effect strength between group activity and NH3 concentration were found for all farms. The graphical representation shows a pronounced decrease in the NH3 concentration during the day with increasing activity and increased NH3 concentrations at night, as seen in Figure 8 for Farm 5.
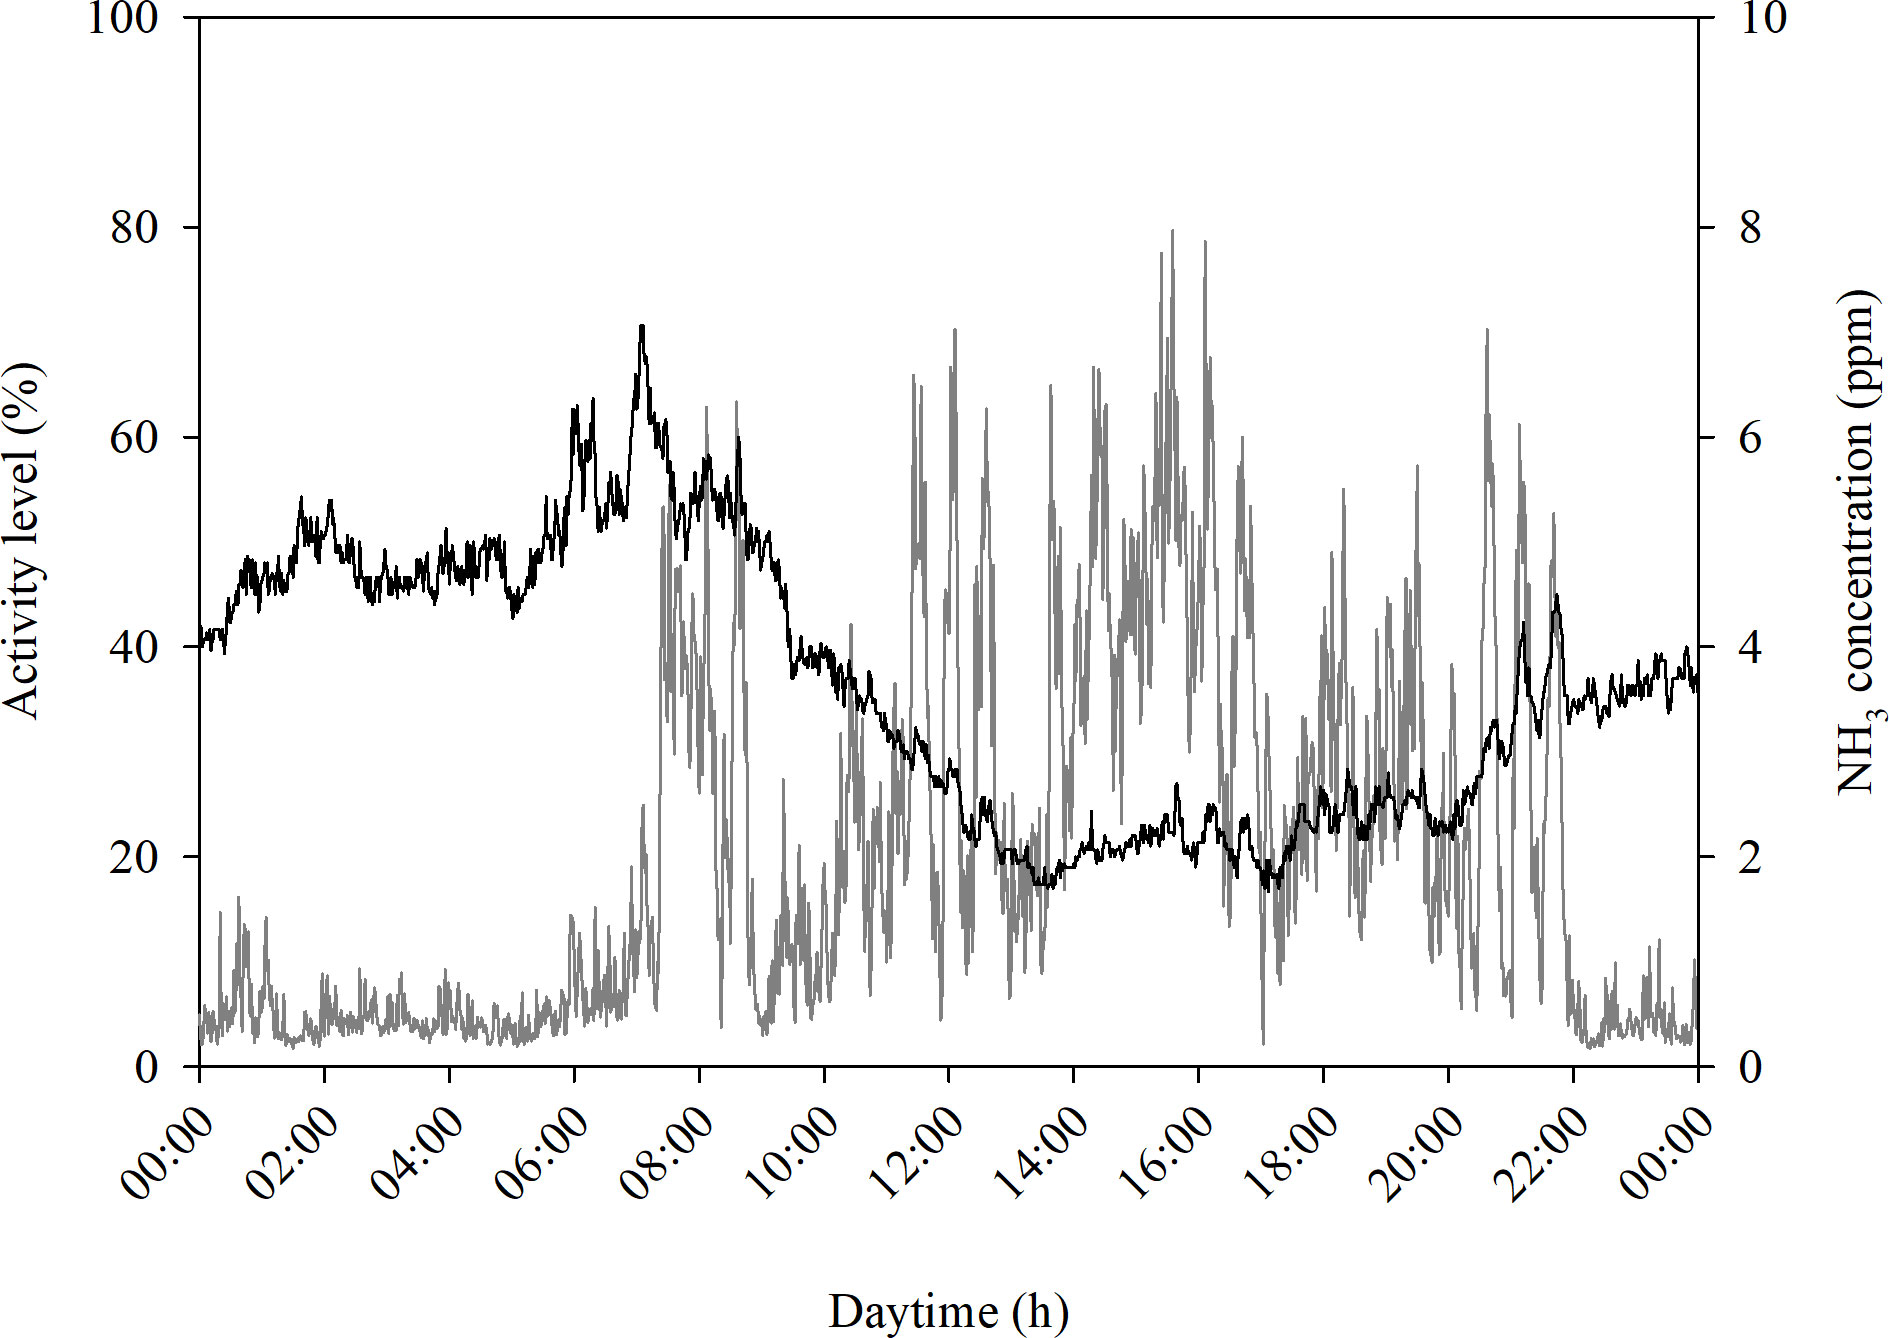
Figure 8 Group activity measured by PID (grey line) and NH3 concentration (black line) over the course of the day shown for Farm 5. The figure shows the averaged data in 1-min intervals over the entire three focus days.
NH3 concentration peaks with the first increase in group activity in the morning. Subsequently, the NH3 concentration decreases during the day to 2 ppm before increasing again toward evening.
During the day, THINOAA values increase with increasing animal activity. Except for Farm 7 (r = - 0.151; p < 0.001; n = 4320), moderate (r = 0.313; p < 0.001) to strong positive correlation (r = 0.585; p < 0.001; n = 4320) were found for all farms between group activity and THINOAA. As shown in Figure 9, the THINOAA increases during the day and reaches peak values with the activity peaks and decreases again in the evening or night hours.
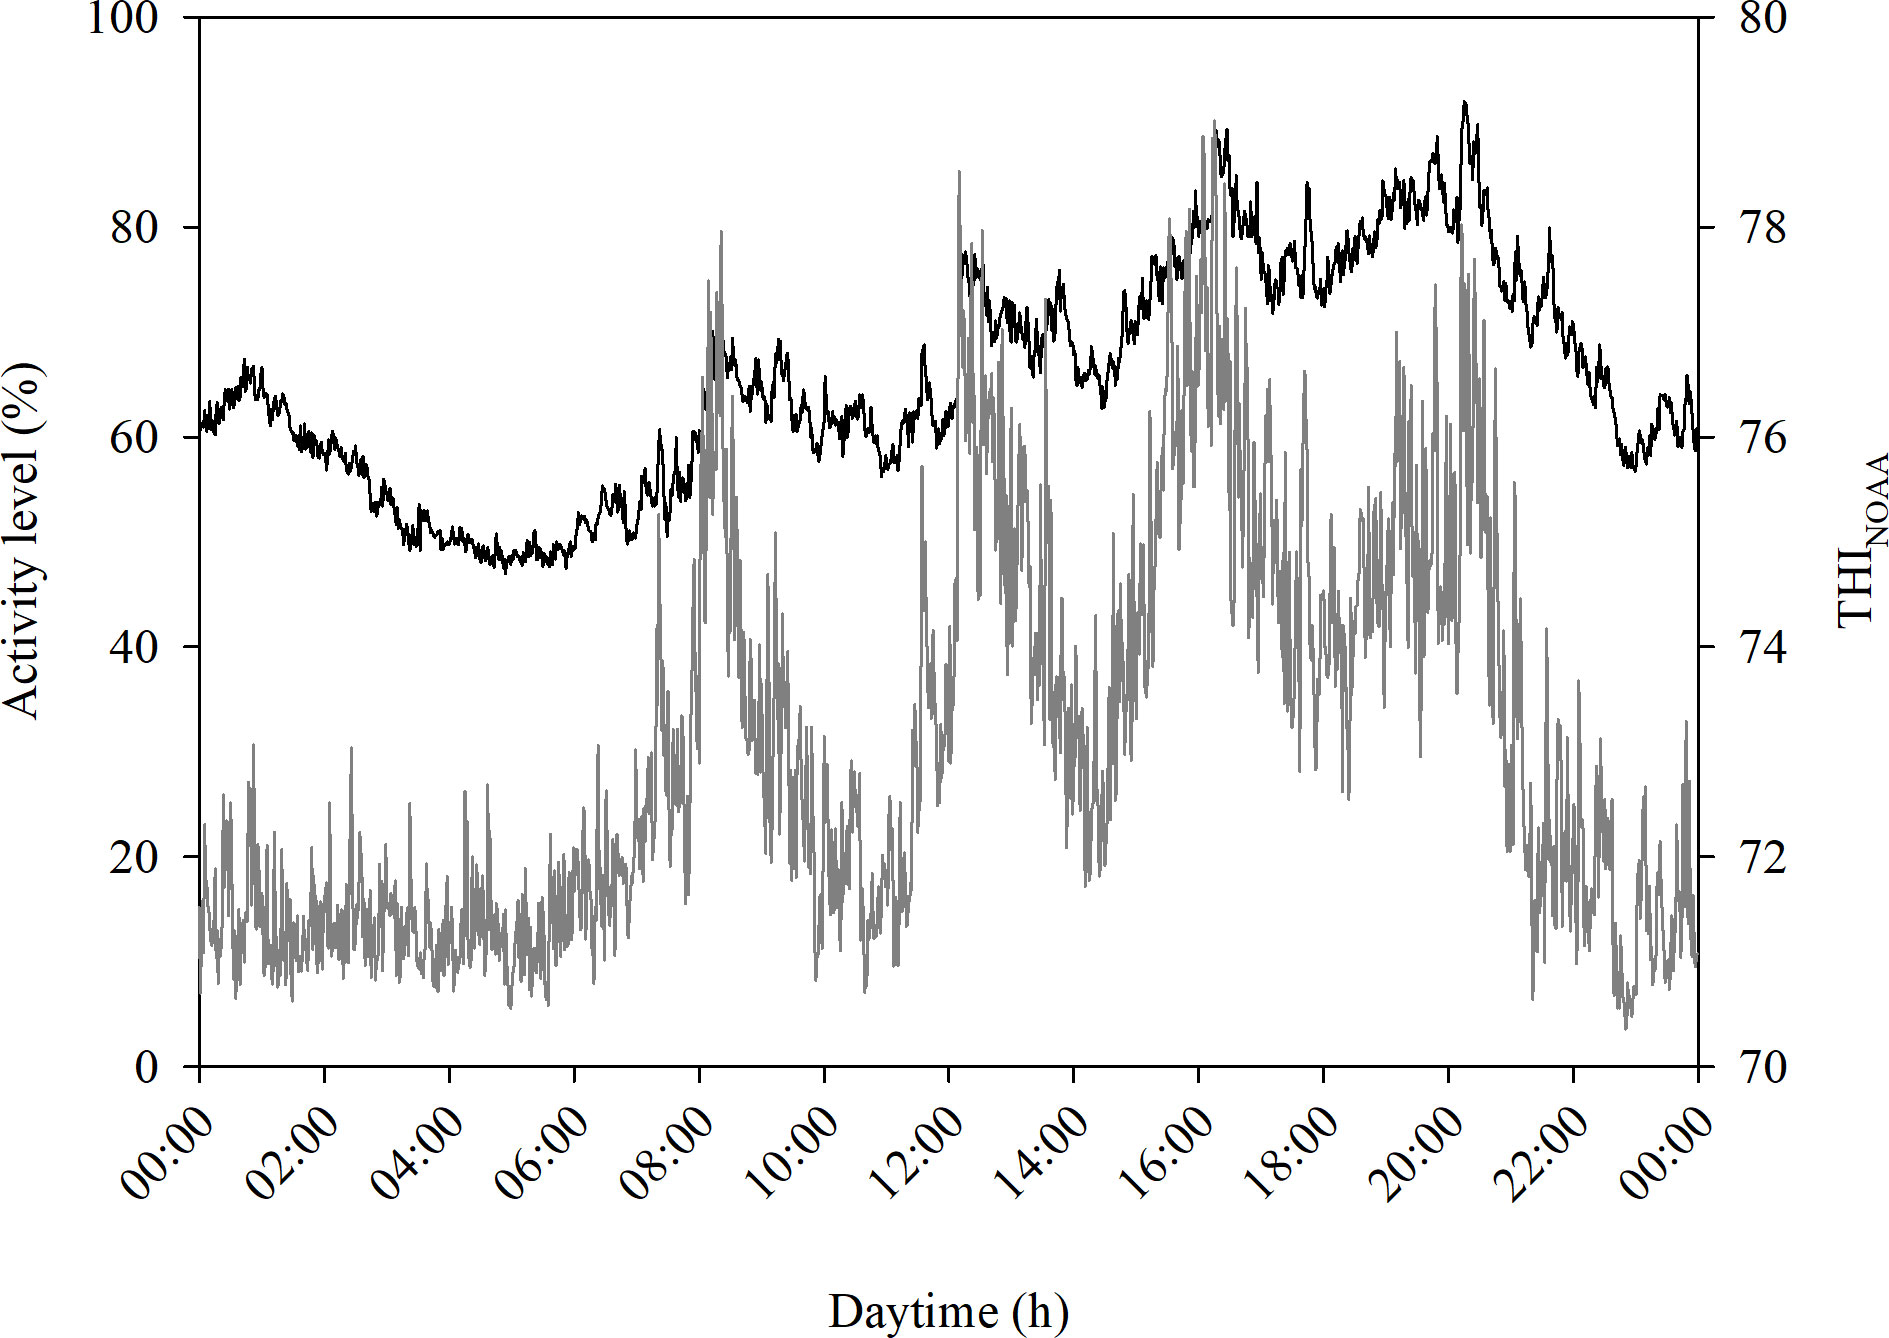
Figure 9 Group activity measured by PID (grey line) and THINOAA (black line) over the course of the day exemplary shown for Farm 2. The figure shows the averaged data in 1-min intervals over the entire three focus days.
4 Discussion
4.1 Comparison of PID data and visual assessment
In modern pig farming, the use of sensor systems to monitor and control feeding and housing conditions is well established. Measuring activity at the individual animal or group level in real-time can be another complementary method to improve animal health and welfare in pigs. In this study, a low-cost and easy-to-use technology was tested to measure group activity and activity in the feeding and exploration area. Even though the conditions varied within the seven test farms, the PIDs measured realistic values.
4.1.1 PID performance for measuring group activity
Strong correlations were found between group activity using PIDs and visual assessment for all farms. These findings are comparable to the results of the previous study by von Jasmund et al. (2020), where strong correlations were obtained between group activity as measured by PID and visual assessment. Similarly, other studies, such as Besteiro et al. (2018b), found strong correlations between group activity and visual assessment using PIDs. Also, Drexl et al. (2023) examined the relationship between different methods of measuring animal activity in piglet rearing. Strong correlations were observed between visual assessment and PID, as well as between dynamic background subtraction and PID for an activity area (Drexl et al., 2023). Other researchers have investigated camera techniques for activity measurements and posture detection, which showed comparable correlations to the PID technique. Thus, Ott et al. (2014) were able to use automated video analysis to measure group activity at the pen level, which also correlated strongly with visual assessment. Also, lateral and sternal lying postures in pigs could be successfully distinguished with high accuracy and sensitivity (Nasirahmadi et al., 2019). When detecting locomotion patterns within groups of piglets, Kashiha et al. (2014) were able to achieve also accuracy using automated image processing methods. In addition to image-based detection and analysis techniques, other simple sensors can measure animal activity too. Compared to PIDs, accelerometers in the ear tag provide information about the activity pattern of animals individually (Liu et al., 2018; Oczak et al., 2022). Liu et al. (2018) found a biphasic activity pattern with two main periods in sows with accelerometers. However, this technique for measuring activity has only been used in sows, as ear tags are easily ripped out by fighting or playing (Liu et al., 2018; Kapun et al., 2020). However, Arulmozhi et al. (2021) mention that on-farm lighting conditions, variations in lighting, obstacles, and airborne objects lead to limitations in the use of camera technology. In contrast, activity measurement with PIDs is not affected by these factors, which is advantageous for pig farms where an unfavorable environment for sensitive sensor technology often exists (Basteiro, 2018).
Group activity and PID data showed strong correlations. However, the data also showed that the PIDs tend to overestimate animal activity during the day and rest periods at night. Peaks of activity measured by PID could occur at night because individual animals sometimes rise to take in water or to change their lying position. Thus, the PIDs are limited in their ability to measure fluctuations in the number of animals observed during video analysis, and single small peaks in activity at rest periods indicate short-term and individual pig activity (Ni et al., 2017). While other researchers also indicate that PID data overestimate animal activity (Ni et al., 2017; Besteiro et al., 2018b; Besteiro et al., 2021; Drexl et al., 2023), the scan-sampling method in 10 min intervals used in this study could have limitations in accurately capturing animal activity, resulting in a tendency to underestimate activity. In addition, a slight negative correlation was found between live weight per pen and accuracy for measuring group activity. Stocking density does not seem to have an impact on the measurement of group activity, as strong correlations were obtained both at low stocking density (Farm 6) and at higher stocking density (Farm 7). In the study by Besteiro et al. (2018b) the correlation between visual assessment and daily activity decreased over the fattening period when using PIDs. This decrease is due to the technical functionality of PIDs, as the measurement depends on the temperature difference between the environment and the animal surface. Higher live weight creates a higher and more homogenous temperature range (Pedersen and Pedersen, 1995; Besteiro et al., 2018b). Another factor affecting the activity measurement is the velocity of the object. That, however, was unable to be included in this research. Thus, Cai et al. (2019) found that the PID signal increases in proportion to velocity. Therefore, important factors, such as surface temperature and animal velocity, should be recorded in further studies.
4.1.2 PID performance for measuring activity in specific focus areas
Regarding measuring animal activity in specific focus areas of a pen, correlations between PID and visual assessment were stronger for the feeding area than for the exploration area. The results seem to depend on the feeding regime (number of feeding phases) and the supply (ad libitum or restricted). Except for Farm 4, strong correlations were obtained for the activity in the feeding area. In contrast, correlations for the exploration area activity were low to moderate.
The lack of spatial distance between the different functional areas within the pen may have affected the PID data and, thus, the interpretation concerning the focus areas. The correlations for the feeding activity are strong, even if the focus areas cannot be differentiated, resulting in an overlapping exploration and other functional areas, e.g., the drinking area. The strong correlations between feeding activity and visual assessment were an unexpected result, as several studies define a clear spatial separation of the functional areas as one of the most important prerequisites for good performance of the applied techniques (Besteiro et al., 2018b; Jasmund et al., 2020). Nevertheless, the strongest correlation was on Farm 7, with the feeding area clearly differentiated from all other areas.
Data suggest that despite the difference between farms in animal age and weight, PIDs generate similar results. Compared to Besteiro et al. (2018b) in which the correlation between the PID and human observation for feeding behavior decreased with the growth of weaners, similar correlations were found in our study in the pre-fattening (Farm 2 and 6) and finishing period (Farm 7). Cai et al. (2019) found stronger correlations in post-weaning piglets around day 30 than around day 50, showing lower correlations.
Continuous measurements of activity in the exploration area are not yet well-established. The results of the present study indicate that for the exploration area, separation from other functional areas of the pen seems to play a significant role in the focusability and interpretability of the PID data, compared to the feeding area. Farm 1 shows that an unclear structuring of the exploration area leads to a low correlation between PID and visual assessment. On Farm 7, also showing a low correlation, the exploration area was next to a scouring area applied as a comfort enrichment to the pigs in the pen. Furthermore, the exploration area was used frequently as a transit area, which also impacted the recording of the PID data. Instead, a comparatively stronger correlation was found for Farm 2, which had a clearly structured pen. With different performance parameters, Veldkamp et al. (2023) found a similar low correlation between exploration activity using PIDs and visual assessment. Their results also showed that the PIDs are limited in detecting specific behaviors, such as exploring. In general, PIDs are a low-cost and easy-to-use technology that perform equally as well as the accelerometer and the neural network model algorithms based on video images when analyzing the interaction with enrichment material. In contrast, the previous study by von Jasmund et al. (2020) found strong correlations for the exploration area as reported here.
The validity for measurements of group activity might be stronger than measurements in the feeding and exploration area because the observation area included the whole focus pen. Another reason for the different correlations found for different farms could be due to the variability in PID location caused by specifics of the housing conditions applied. According to Cai et al. (2019), who tested PIDs under laboratory conditions with simulated pigs, different angles, distances to the object, and the object’s moving speed (m/s) affected the results.
Data cannot explain the low correlation between Farm 4’s feeding and exploration areas. Since the functional areas were clearly separated and the PID was placed directly above the feeding area, other behaviors could not be measured. Ad libitum feeding might have resulted in more short-duration animal visits to the feeding area (Angermann, 2021), leading to higher activity measurements by the PID. The video recordings show fewer animals in comparison.
4.2 Activity data by using PIDs and animals’ behavior
Pigs show a diurnal rhythm in their natural behavior (Hardin and Panda, 2013), which was also shown by each group of fattening pigs in this study. Active phases alternate with one or more rest phases during daytime, and reduced activity or rather inactivity during night hours. These findings are supported by a wide range of studies (Rijnen et al., 2003; Blanes-Vidal et al., 2008; Ni et al., 2017; Besteiro et al., 2018a; Besteiro et al., 2021). During the day, the animals show different activity patterns depending on the farm, which should be interpreted individually, as this can be influenced by a variety of factors such as feeding management (Pedersen et al., 2015), enrichment material (Nasirahmadi et al., 2017), and barn climate (Huynh et al., 2005a; Godyń et al., 2020; Jasmund et al., 2020).
A typical biphasic activity pattern, characterized by alternating feeding and activity peaks in the morning and at the end of the day (Ni et al., 2017), was observed only for Farm 4 with ad libitum feeding. This finding is consistent with results from other researchers, who also found a low activity peak in the morning and a higher one in the afternoon in pre-fattening pigs with ad libitum feeding (Ni et al., 2017; Besteiro et al., 2018a). However, the biphasic activity pattern typically develops later during fattening periods (Ni et al., 2017; Besteiro et al., 2018a). Ni et al. (2017) found different activity patterns during the fattening period, with pigs showing multiple activity peaks in the first month and a pattern with two activity peaks in the second month. The activity pattern of Farm 4 also differs from the activity pattern of the same-age pigs on Farm 2 and Farm 6. The present data suggest that this difference between group activity, especially in the daily activity pattern, is due to differences in feeding management. Farm 6 fed restrictively, with feed given ten times per day. Therefore, feeding times could have influenced the activity pattern resulting in many activity peaks. The multiphasic daily rhythm of the Farm 2 with activity peaks on Farm 4 also coincides with four feeding times. These results are consistent with Pedersen et al. (2015), who also found increased activity using PIDs when feed was dispensed. In Cai et al. (2019), the feeding times also coincided with the maximum daily activity of the pigs.
Furthermore, the farms differed not only in terms of activity pattern but also in the intensity of activity. For instance, the boars on Farm 6 were significantly more active than those on Farm 2 (castrated males) and Farm 4 (mixed-sex group). One reason for the increased activity of the boars could have been general restlessness before and after feeding times (Zoric et al., 2015). In some studies, boars were more aggressive than the castrated males and mixed-sex groups. In Holinger et al. (2015), the percentage of animals fighting was significantly higher in sole male groups compared to mixed-sex groups of sows and castrated males. In a similar study, Cronin et al. (2003) found that male pigs aged 21 weeks displayed higher levels of aggressive behavior than castrated males. However, contrary to the current results, Bünger et al. (2015) could not demonstrate any differences in activity between the sexes. The authors argue that the absence of a significant difference might be due to a low stocking density of 12 animals per pen and ad libitum feeding. In this study, the stocking density of 26 animals was higher than in Bünger et al. (2015). Nevertheless, animals should have sufficient periods of activity and rest, which can be measured using PIDs.
4.3 Activity data by using PIDs and barn climate
During the day and with increasing animal activity, there was a general decrease in NH3 concentration. An increase in concentration was measured in night hours. A negative relationship between NH3 concentration and pig activity was also shown by Kim et al. (2008). Here, we focused on air quality in the barn and, thus, NH3 concentration. In contrast, other studies often investigate NH3 emissions (Aarnink et al., 1995; Aarnink et al., 1996; Jeppsson, 2002; de Sousa and Pedersen, 2004; Blanes-Vidal et al., 2008). Therefore, a direct comparison of the values of this study to those from other studies is not possible. The decrease in NH3 concentration during the day and its increase during the night may be due to ventilation management. Typically the ventilation rate is higher during the day than at night, also seen in Aarnink et al. (1995); de Sousa and Pedersen (2004) and Blanes-Vidal et al. (2008). Thus, more air in the barn compartment and, consequently, more NH3 being transported out via ventilation. Data on the airflow and ventilation rate were not collected, therefore, no emission data could be calculated and compared with other studies. In addition, there was an observed rise in the concentration of NH3 during the morning hours. This increase might be due to the close relationship between the elimination behavior after resting and the activity of the pigs (Aarnink et al., 1996), which increases again after the nocturnal rest period and affect the ammonia level in the compartment. In Guo et al. (2015), elimination behavior also increased in the morning after nighttime and with the first feeding.
With regard to the THINOAA values, the relationship to activity was contrary to NH3 across all farms. As animal activity increases during the day, the THINOAA also increases and decreases again in the evening or night hours. In most cases, as activity increases, so do temperature and relative humidity in the focus pens. The average range between minimum and maximum values for temperature on the three focus days was 3.14°C across all focus farms. However, the average relative humidity range across farms is 23.20% and thus varies much more over the course of the day than temperature. Heat production of the animals influences the ambient temperature (Aarnink et al., 1996), which is, among other things, related to the activity of the animals (Aarnink et al., 1996; CIGR, 1999). The temperature in the barn, in turn, influences respiration, among other things (Olczak et al., 2015). And by respiration, more water vapor is released into the environment through evaporation via the exhaled air (Loeffler and Gäbel, 2009). Jeppsson (2002) also showed a positive correlation between water vapor emission and animal activity. So, if animal activity increases during the day, the temperature and the relative humidity of the ambient air also increase, which increases the THINOAA.
4.4 Outlook
Activity measurement in fattening pigs is not yet widely used in practice. PIDs are an easy, cost-effective (Ni et al., 2017), and non-invasive technique that allows continuous activity measurement. Compared to cameras, PIDs are robust, and their accuracy is not affected by light conditions or other environmental factors in the barn. Due to the comparatively low costs, activity can also be measured in several pens. The PIDs are particularly suitable for measuring group activity within a pen. To measure activity in individual focus areas, it is important to fulfill certain requirements: firstly, the PIDs must focus on specific areas. Secondly, the interpretative value of the data depends on the structuring of the pen, as the focus area should be separated from the other functional areas in the pen. However, this separation is not always guaranteed on-farm. The third point is the validation of activity tracking and behavior shown by the animals since the PID cannot distinguish between behaviors. In addition, there are many validation methods to investigate different techniques. Care should be taken to ensure that the validation technique best reflects the activity measurement of the PIDs and still capture the actual activity of the animals. Nevertheless, the possibility of simple activity measurement should be used, since daily rhythms as well as active and resting phases are recognizable and differ depending on the housing conditions. Similar to Basteiro (2018), we also conclude that the PID data show that each farm should also be considered individually and that standardization or general thresholds are not useful. Artificial intelligence could be used to display individual activity patterns of animal groups over days or weeks. This could allow the detection of deviations in activity behavior due to disease (Hart, 1988), cannibalism (Statham et al., 2009; Ursinus et al., 2014; Larsen et al., 2016; Larsen et al., 2019), or heat stress (Huynh et al., 2005b; Jasmund et al., 2020), for example. In this way, the recording of activity behavior using PIDs provide the farmer with useful information on animal welfare and could be implemented in a decision-support system.
5 Conclusion
This paper compared PID data with the visual assessment to assess group activity and activity in the feeding and exploration area in focus pens with fattening pigs on different farms under practical conditions. Furthermore, the activity behavior of the animals was examined in relation to feeding management and barn climate. Results showed that PIDs measuring group activity performed best, followed by activity measurement in the feeding area. Only moderate correlations were reached in measuring activity in the exploration area. Fattening pigs showed different diurnal activity patterns depending on housing conditions and management, leading to the assumption that farms should be considered individually. In summary, activity measurement in functional focus areas of the pen is a challenge, especially due to the necessity of pen structuring on-farm. Nevertheless, PIDs are a useful tool for activity measurement in groups of animals. They have the potential, in combination with other sensor systems and supported by algorithms and/or artificial intelligence in the context of evaluation, to provide animal and husbandry-related information to the farmer leading to substantial support for management decisions and well-being confirmation.
Data availability statement
The raw data supporting the conclusions of this article will be made available by the authors, without undue reservation.
Ethics statement
No ethical approval was required because no animal procedures were performed. The animals were observed only by sensor and camera. This study involved sensor technology for the barn, which did not need to be attached to the animal. The animals were not disturbed in their daily routine.
Author contributions
EW: Formal Analysis, Methodology, Validation, Visualization, Writing – original draft. NJ: Conceptualization, Data curation, Formal Analysis, Investigation, Methodology, Project administration, Validation, Writing – original draft. IT: Writing – review & editing. KS: Data curation, Investigation, Writing – review & editing. WB: Conceptualization, Funding acquisition, Project administration, Resources, Supervision, Writing – review & editing.
Funding
The author(s) declare financial support was received for the research, authorship, and/or publication of this article. The study as a part of a project is supported by funds of the Federal Ministry of Food and Agriculture (BMEL) based on a decision of the Parliament of the Federal Republic of Germany via the Federal Office for Agriculture and Food (BLE) under the innovation support program (FKZ 2817902615). This work was supported by the Open Access Publication Fund of the University of Bonn.
Acknowledgments
The authors thank all farmers for allowing them to conduct the experiment on their farms and the scientific workshop of the Institute of Agricultural Engineering of the Rheinische Friedrich-Wilhelms-University at Bonn for their great technical support.
Conflict of interest
The authors declare that the research was conducted in the absence of any commercial or financial relationships that could be construed as a potential conflict of interest.
Publisher’s note
All claims expressed in this article are solely those of the authors and do not necessarily represent those of their affiliated organizations, or those of the publisher, the editors and the reviewers. Any product that may be evaluated in this article, or claim that may be made by its manufacturer, is not guaranteed or endorsed by the publisher.
References
Aarnink A., Keen A., Metz J., Speelman L., Verstegen M. (1995). Ammonia emission patterns during the growing periods of pigs housed on partially slatted floors. J. Agric. Eng. Res. 62, 105–116. doi: 10.1006/jaer.1995.1069
Aarnink A., van den Berg A. J., Keen A., Hoeksma P., Verstegen M. (1996). Effect of slatted floor area on ammonia emission and on the excretory and lying behaviour of growing pigs. J. Agric. Eng. Res. 64, 299–310. doi: 10.1006/jaer.1996.0071
Alameer A., Kyriazakis I., Dalton H. A., Miller A. L., Bacardit J. (2020). Automatic recognition of feeding and foraging behaviour in pigs using deep learning. Biosyst. Eng. 197, 91–104. doi: 10.1016/j.biosystemseng.2020.06.013
Angermann E. B. (2021). Analyse des Wohlergehens tragender Sauen in einem gruppen-angepassten ad libitum Fütterungssystem anhand ausgewählter Indikatoren (Hannover: Tierärztliche Hochschule Hannover).
Arulmozhi E., Bhujel A., Moon B.-E., Kim H.-T. (2021). The application of cameras in precision pig farming: an overview for swine-keeping professionals. Animals 11, 2343. doi: 10.3390/ani11082343
Basteiro R. (2018). Animal activity to improve the welfare and energy and productive efficiencies in intensive production buildings of piglets (Santiago de Compostela: University of Santiago de Compostela).
Berckmans D. (2017). General introduction to precision livestock farming. Anim. Fron 7, 6–11. doi: 10.2527/af.2017.0102
Besteiro R., Arango T., Ortega J., Fernández M. D., Rodríguez M. R (2021). Long-term measurement of piglet activity using passive infrared detectors. Anim. (Basel) 11. doi: 10.3390/ani11061607
Besteiro R., Arango T., Rodríguez M. R., Fernández M. D., Velo R. (2018a). Estimation of patterns in weaned piglets' activity using spectral analysis. Biosyst. Eng. 173, 85–92. doi: 10.1016/j.biosystemseng.2017.06.014
Besteiro R., Rodríguez M. R., Fernández M. D., Ortega J. A., Velo R. (2018b). Agreement between passive infrared detector measurements and human observations of animal activity. Livestock Sci. 214, 219–224. doi: 10.1016/j.livsci.2018.06.008
Blanes-Vidal V., Hansen M. N., Pedersen S., Rom H. B. (2008). Emissions of ammonia, methane and nitrous oxide from pig houses and slurry: Effects of rooting material, animal activity and ventilation flow. Agriculture Ecosyst. Environ. 124, 237–244. doi: 10.1016/j.agee.2007.10.002
Blatchford R. A. (2017). Animal behavior and well-being symposium: Poultry welfare assessments: Current use and limitations. J. Anim. Sci. 95, 1382. doi: 10.2527/jas2016.0957
Bünger B., Schrader L., Schrade H., Zacharias B. (2015). Agonistic behaviour, skin lesions and activity pattern of entire male, female and castrated male finishing pigs. Appl. Anim. Behav. Sci. 171, 64–68. doi: 10.1016/j.applanim.2015.08.024
Cai Y., Ma L., Liu G. (2019). A night-time anomaly detection system of hog activities based on passive infrared detector. Appl. Eng. Agric. 35, 481–493. doi: 10.13031/aea.13007
Chapa J. M., Maschat K., Iwersen M., Baumgartner J., Drillich M. (2020). Accelerometer systems as tools for health and welfare assessment in cattle and pigs - A review. Behav. Processes 181, 104262. doi: 10.1016/j.beproc.2020.104262
CIGR (1999). Handbook of agricultural engineering: volume II animal production & Aquacultural engineering (St. Joseph, Mich. American Soc. of Agricultural Engineers).
Costa A., Ismayilova G., Borgonovo F., Viazzi S., Berckmans D., Guarino M. (2014). Image-processing technique to measure pig activity in response to climatic variation in a pig barn. Anim. Prod. Sci. 54, 1075. doi: 10.1071/AN13031
Cronin G., Dunshea F., Butler K., McCauley I., Barnett J., Hemsworth P. (2003). The effects of immuno- and surgical-castration on the behaviour and consequently growth of group-housed, male finisher pigs. Appl. Anim. Behav. Sci. 81, 111–126. doi: 10.1016/S0168-1591(02)00256-3
Derstappen R., Christoph-Schulz I. (2022). Consumer’s pork purchasing criteria and the relevance of animal welfare – a cross-national study. Proc. Food System Dynamics 31–34. doi: 10.18461/pfsd.2022.2203
de Sousa P., Pedersen S. (2004). Ammonia emission from fattening pig houses in relation to animal activity and carbon dioxide production. Agric. Eng. International: CIGR J.
Drexl V., Siebler D., Dittrich I., Heins R., Diers S., Krieter J. (2023). Use of a digital passive infrared motion detector in piglet rearing for the identification of animal activity. Smart Agric. Technol. 4, 100228. doi: 10.1016/j.atech.2023.100228
Godyń D., Herbut P., Angrecka S., Corrêa Vieira F. M. (2020). Use of different cooling methods in pig facilities to alleviate the effects of heat stress-A review. Animals 10, 1459. doi: 10.3390/ani10091459
Gómez Y., Stygar A. H., Iris J. M. M., Bokkers E. A. M., Pedersen L. J., Niemi J. K., et al. (2021). A systematic review on validated precision livestock farming technologies for pig production and its potential to assess animal welfare. Front. Vet. Sci. 8. doi: 10.3389/fvets.2021.660565
Guo Y., Lian X., Yan P. (2015). Diurnal rhythms, locations and behavioural sequences associated with eliminative behaviours in fattening pigs. Appl. Anim. Behav. Sci. 168, 18–23. doi: 10.1016/j.applanim.2015.01.011
Hardin P. E., Panda S. (2013). Circadian timekeeping and output mechanisms in animals. Curr. Opin. Neurobiol. 23, 724–731. doi: 10.1016/j.conb.2013.02.018
Hart B. L. (1988). Biological basis of the behavior of sick animals. Neurosci. Biobehav. Rev. 12, 123–137. doi: 10.1016/S0149-7634(88)80004-6
Heinonen M., Peltoniemi O., Valros A. (2013). Impact of lameness and claw lesions in sows on welfare, health and production. Livestock Sci. 156, 2–9. doi: 10.1016/j.livsci.2013.06.002
Holinger M., Früh B., Hillmann E. (2015). Group composition for fattening entire male pigs under enriched housing conditions—Influences on behaviour, injuries and boar taint compounds. Appl. Anim. Behav. Sci. 165, 47–56. doi: 10.1016/j.applanim.2015.01.016
Huynh T., Aarnink A., Gerrits W., Heetkamp M., Canh T. T., Spoolder H., et al. (2005a). Thermal behaviour of growing pigs in response to high temperature and humidity. Appl. Anim. Behav. Sci. 91, 1–16. doi: 10.1016/j.applanim.2004.10.020
Huynh T., Aarnink A., Verstegen M. (2005b). “Reactions of pigs to A hot environment,” in Livestock Environment VII, Proceedings of the Seventh International Symposium, Beijing, China, May 18.
Ivanova-Peneva S. G., Aarnink A. J., Verstegen M. W. (2008). Ammonia emissions from organic housing systems with fattening pigs. Biosyst. Eng. 99, 412–422. doi: 10.1016/j.biosystemseng.2007.11.006
Jeppsson K.-H. (2002). Diurnal variation in ammonia, carbon dioxide and water vapour emission from an uninsulated, deep litter building for growing/finishing pigs. Biosyst. Eng. 81, 213–223. doi: 10.1006/bioe.2001.0025
Kapun A., Adrion F., Gallmann E. (2020). Case study on recording pigs’ Daily activity patterns with a UHF-RFID system. Agriculture 10, 542. doi: 10.3390/agriculture10110542
Kashiha M. A., Bahr C., Ott S., Moons C. P., Niewold T. A., Tuyttens F., et al. (2014). Automatic monitoring of pig locomotion using image analysis. Livestock Sci. 159, 141–148. doi: 10.1016/j.livsci.2013.11.007
Kim K. Y., Ko H. J., Kim H. T., Kim C. N., Byeon S. H. (2008). Association between pig activity and environmental factors in pig confinement buildings. Aust. J. Exp. Agric. 48, 680–686. doi: 10.1071/EA06110
Larsen M. L. V., Andersen H. M.-L., Pedersen L. J. (2016). Can tail damage outbreaks in the pig be predicted by behavioural change? Vet. J. 209, 50–56. doi: 10.1016/j.tvjl.2015.12.001
Larsen M. L. V., Andersen H. M.-L., Pedersen L. J. (2019). Changes in activity and object manipulation before tail damage in finisher pigs as an early detector of tail biting. Anim. an Int. J. Anim. bioscience 13, 1037–1044. doi: 10.1017/S1751731118002689
Liu L.-S., Ni J.-Q., Zhao R.-Q., Shen M.-X., He C.-L., Lu M.-Z. (2018). Design and test of a low-power acceleration sensor with Bluetooth Low Energy on ear tags for sow behaviour monitoring. Biosyst. Eng. 176, 162–171. doi: 10.1016/j.biosystemseng.2018.10.011
Loeffler K., Gäbel G. (2009). Anatomie und Physiologie der Haustiere: 33 Tabellen (Stuttgart: Ulmer).
Martínez-Avilés M., Fernández-Carrión E., López García-Baones J. M., Sánchez-Vizcaíno J. M. (2017). Early detection of infection in pigs through an online monitoring system. Transboundary Emerging Dis. 64, 364–373. doi: 10.1111/tbed.12372
Nasirahmadi A., Edwards S. A., Matheson S. M., Sturm B. (2017). Using automated image analysis in pig behavioural research: Assessment of the influence of enrichment substrate provision on lying behaviour. Appl. Anim. Behav. Sci. 196, 30–35. doi: 10.1016/j.applanim.2017.06.015
Nasirahmadi A., Sturm B., Olsson A.-C., Jeppsson K.-H., Müller S., Edwards S., et al. (2019). Automatic scoring of lateral and sternal lying posture in grouped pigs using image processing and Support Vector Machine. Comput. Electron. Agric. 156, 475–481. doi: 10.1016/j.compag.2018.12.009
Neuenfeldt S., Gocht A., Heckelei T., Ciaian P. (2019). Explaining farm structural change in the European agriculture: a novel analytical framework. Eur. Rev. Agric. Economics 46, 713–768. doi: 10.1093/erae/jby037
Ngwabie N. M., Jeppson K.-H., Nimmermark S., Gustafsson G. (2011). Effects of animal and climate parameters on gas emissions from a barn for fattening pigs. Appl. Eng. Agric. 27, 1027–1037. doi: 10.13031/2013.40619
Ni J.-Q., Liu S., Radcliffe J. S., Vonderohe C. (2017). Evaluation and characterisation of Passive Infrared Detectors to monitor pig activities in an environmental research building. Biosyst. Eng. 158, 86–94. doi: 10.1016/j.biosystemseng.2017.03.014
Oczak M., Bayer F., Vetter S., Maschat K., Baumgartner J. (2022). Comparison of the automated monitoring of the sow activity in farrowing pens using video and accelerometer data. Comput. Electron. Agric. 192, 106517. doi: 10.1016/j.compag.2021.106517
Olczak K., Nowicki J., Klocek C. (2015). Pig behaviour in relation to weather conditions – a review. Ann. Anim. Sci. 15, 601–610. doi: 10.1515/aoas-2015-0024
Ott S., Moons C., Kashiha M. A., Bahr C., Tuyttens F., Berckmans D., et al. (2014). Automated video analysis of pig activity at pen level highly correlates to human observations of behavioural activities. Livestock Sci. 160, 132–137. doi: 10.1016/j.livsci.2013.12.011
Pedersen L. J. (2017). “Chapter 1 - Overview of commercial pig production systems and their main welfare challenges,” in Advances in pig welfare, vol. 3–25 . Ed. Špinka M. (Kent: Elsevier Science).
Pedersen S., Jørgensen H., Theil P. K. (2015). “Influence of diurnal variation in animal activity and digestion on animal heat production,” in 18th World Congress of CIGR. 18–29 (CIGR).
Pedersen S., Pedersen C. (1995). Animal activity measured by infrared detectors. J. Agric. Eng. Res. (61), 239–246. doi: 10.1006/jaer.1995.1051
Pfeifer M., Eggemann L., Kransmann J., Schmitt A. O., Hessel E. F. (2019). Inter- and intra-observer reliability of animal welfare indicators for the on-farm self-assessment of fattening pigs. Animal 13, 1712–1720. doi: 10.1017/S1751731118003701
Riekert M., Klein A., Adrion F., Hoffmann C., Gallmann E. (2020). Automatically detecting pig position and posture by 2D camera imaging and deep learning. Comput. Electron. Agric. 174, 105391. doi: 10.1016/j.compag.2020.105391
Rijnen M. M. J. A., Verstegen M. W. A., Heetkamp M. J. W., Schrama J. W. (2003). Effects of two different dietary fermentable carbohydrates on activity and heat production in group-housed growing pigs. J. Anim. Sci. 81, 1210–1219. doi: 10.2527/2003.8151210x
Sødring M., Nafstad O., Håseth T. T. (2020). Change in Norwegian consumer attitudes towards piglet castration: increased emphasis on animal welfare. Acta Vet. Scand. 62, 22. doi: 10.1186/s13028-020-00522-6
Sonoda Y., Oishi K., Chomei Y., Hirooka H. (2018). How do human values influence the beef preferences of consumer segments regarding animal welfare and environmentally friendly production? Meat Sci. 146, 75–86. doi: 10.1016/j.meatsci.2018.07.030
Statham P., Green L., Bichard M., Mendl M. (2009). Predicting tail-biting from behaviour of pigs prior to outbreaks. Appl. Anim. Behav. Sci. 121, 157–164. doi: 10.1016/j.applanim.2009.09.011
St-Pierre N. R., Cobanov B., Schnitkey G. (2003). Economic losses from heat stress by US livestock industries. J. Dairy Sci. 86, E52–E77. doi: 10.3168/jds.S0022-0302(03)74040-5
Ursinus W. W., van Reenen C. G., Kemp B., Bolhuis J. E. (2014). Tail biting behaviour and tail damage in pigs and the relationship with general behaviour: Predicting the inevitable? Appl. Anim. Behav. Sci. 156, 22–36. doi: 10.1016/j.applanim.2014.04.001
Veldkamp F., Garcia-Faria T. I., Witjes V. L., Rebel J. M., de Jong I. C. (2023). Validation of non-invasive sensor technologies to measure interaction with enrichment material in weaned fattening pigs. Appl. Anim. Behav. Sci. 263, 105923. doi: 10.1016/j.applanim.2023.105923
Vermeer H. M., Hopster H. (2018). Operationalizing principle-based standards for animal welfare-indicators for climate problems in pig houses. Animals 8, 44. doi: 10.3390/ani8040044
Vitt R., Weber L., Zollitsch W., Hörtenhuber S. J., Baumgartner J., Niebuhr K., et al. (2017). Modelled performance of energy saving air treatment devices to mitigate heat stress for confined livestock buildings in Central Europe. Biosyst. Eng. 164, 85–97. doi: 10.1016/j.biosystemseng.2017.09.013
von Jasmund N., Wellnitz A., Krommweh M. S., Büscher W. (2020). Using passive infrared detectors to record group activity and activity in certain focus areas in fattening pigs. Anim. (Basel) 10. doi: 10.3390/ani10050792
Werkheiser I. (2020). Technology and responsibility: a discussion of underexamined risks and concerns in Precision Livestock Farming. Anim. Front. 10, 51–57. doi: 10.1093/af/vfz056
Zoric M., Johansson S.-E., Wallgren P. (2015). Behaviour of fattening pigs fed with liquid feed and dry feed. Porc Health Manag 1, 14. doi: 10.1186/s40813-015-0009-7
Keywords: animal activity, animal behavior, PID, infrared sensor, welfare, ammonia, barn climate
Citation: Wurm E, von Jasmund N, Tiemann I, Rötering KS and Büscher W (2023) Recording group and area-specific activity of fattening pigs by using Passive Infrared Detectors on farm. Front. Anim. Sci. 4:1279086. doi: 10.3389/fanim.2023.1279086
Received: 17 August 2023; Accepted: 23 October 2023;
Published: 02 November 2023.
Edited by:
Oleksiy Guzhva, Swedish University of Agricultural Sciences, SwedenReviewed by:
Wilfried Vahjen, Free University of Berlin, GermanyIlias Giannenas, Aristotle University of Thessaloniki, Greece
Copyright © 2023 Wurm, von Jasmund, Tiemann, Rötering and Büscher. This is an open-access article distributed under the terms of the Creative Commons Attribution License (CC BY). The use, distribution or reproduction in other forums is permitted, provided the original author(s) and the copyright owner(s) are credited and that the original publication in this journal is cited, in accordance with accepted academic practice. No use, distribution or reproduction is permitted which does not comply with these terms.
*Correspondence: Esther Wurm, ZXN0aGVyLnd1cm1AdW5pLWJvbm4uZGU=
†These authors have contributed equally to this work and share first authorship