- 1Department of Biochemistry and Molecular Biology, Dalhousie University, Halifax, NS, Canada
- 2Institute for Comparative Genomics, Dalhousie University, Halifax, NS, Canada
- 3Department of Computer Science, Western University, London, ON, Canada
- 4Department of Biology, Western University, London, ON, Canada
Gene duplication is an important evolutionary mechanism capable of providing new genetic material for adaptive and nonadaptive evolution. However, bioinformatics tools for identifying duplicate genes are often limited to the detection of paralogs in multiple species or to specific types of gene duplicates, such as retrocopies. Here, we present a user-friendly, BLAST-based web tool, called HSDFinder, which can identify, annotate, categorize, and visualize highly similar duplicate genes (HSDs) in eukaryotic nuclear genomes. HSDFinder includes an online heatmap plotting option, allowing users to compare HSDs among different species and visualize the results in different Kyoto Encyclopedia of Genes and Genomes (KEGG) pathway functional categories. The external software requirements are BLAST, InterProScan, and KEGG. The utility of HSDFinder was tested on various model eukaryotic species, including Chlamydomonas reinhardtii, Arabidopsis thaliana, Oryza sativa, and Zea mays as well as the psychrophilic green alga Chlamydomonas sp. UWO241, and was proven to be a practical and accurate tool for gene duplication analyses. The web tool is free to use at http://hsdfinder.com. Documentation and tutorials can be found via the GitHub: https://github.com/zx0223winner/HSDFinder.
Introduction
Gene duplication is a near-ubiquitous phenomenon throughout the eukaryotic tree of life (Ohno, 1970). Sometimes it is beneficial, providing the raw genetic material for the acquisition of new functions (Conant and Wolfe, 2008). Other times it is deleterious. For example, the expression of near-identical genes can be disadvantageous in certain situations (Conrad and Antonarakis, 2007), which is perhaps why their presence is quite rare in eukaryotic genomes (Kubiak and Makałowska, 2017). Nevertheless, the maintenance of highly similar duplicate genes (HSDs) is possible if, for instance, the duplicates in question are in high demand, such as those encoding rRNAs or histones (Zhang, 2003). The presence of HSDs in genomes can also reflect recent duplication events, possibly representing duplicates that are potentially drifting to extinction (Conant and Wagner, 2002).
Duplicated genes formed and retained by various mechanisms and models have been widely discussed (Koonin, 2005; Innan and Kondrashov, 2010), and it is generally accepted that neutral processes are the primary drivers of duplicate gene evolution, particularly their appearance and loss from genomes through genetic drift (Nei and Roychoudhury, 1973; Li, 1980; Lynch, 2007; Brunet and Doolittle, 2018). However, there are various theories for how duplicate genes can be fixed by adaptive evolution, including the gene dosage hypothesis (Qian and Zhang, 2008), the “Escape from adaptive conflict” model (Des Marais and Rausher, 2008) and Ohno’s neofunctionalization model (Ohno, 1970). Indeed, there are many examples of duplicated genes related to stress response, sensory pathways, transport, and metabolism being fixed under certain environmental conditions (Kondrashov, 2012). Comparative genomics of the yeasts Saccharomyces cerevisiae and Schizosaccharomyces pombe provided evidence for the role of gene duplication in organismal adaptation (Qian and Zhang, 2014). Similarly, a large-scale genomic analysis of land plants concluded that gene duplication was contributing to the evolution of novel functions, including disease resistance and the production of specific floral structures (Panchy et al., 2016). More recently, it was suggested that hundreds of HSDs are aiding the survival of the Antarctic green alga Chlamydomonas sp. UWO241 via gene dosage (Cvetkovska et al., 2018; Zhang et al., 2021a).
The identification of duplicated genes in eukaryotic genomes can be challenging, especially in instances involving functional redundancy, multidomain protein structures, and/or extensive small-scale duplication events (Li et al., 2001; Prince and Pickett, 2002; Li et al., 2003b). There are five broad classes of duplication events in genomes: whole-genome duplication (WGD), tandem duplication, transposon-mediated duplication, segmental duplication, and retroduplication (Panchy et al., 2016). Two methods are typically used to evaluate the paralogous relationships of genes within species: the sequence similarity method and the gene structure method. For example, bioinformatics tools can detect duplicated genes based on their sequence similarity, which is usually measured by looking at three metrics: percentage sequence identity, aligned length, and E-value (Lallemand et al., 2020). There are various tools for rapidly quantifying sequence similarity and alignment length, such as BLAST (Kent, 2002) and DIAMOND (Buchfink et al., 2015). Furthermore, the thresholds of the metrics in the alignment tools are highly reliant on the timescale of paralogs. If the investigated paralogs are ancient, these thresholds have to be lower to remain sensitive. For instance, a BLAST all-against-all protein sequence similarity search usually involves the following thresholds as the cut-off when defining paralogs: ≥30% identity score, E-value cut-off ≤ 1e-5, and an aligned length of ≥150 amino acids (Sander and Schneider, 1991; Maere et al., 2005; Panchy et al., 2016).
More complex similarity-based metrics have also been developed. Rost (1999) and Li et al. (2001) proposed respective formulas based on the threshold curve from homology-derived secondary structures of proteins (HSSP) (Sander and Schneider, 1991). Gene structure can also help reinforce the paralogous relationship of two genes within a species. For instance, the conserved domains and pathways detected by InterPro (Mitchell et al., 2019), Pfam (El-Gebali et al., 2019), and KEGG (Kanehisa and Goto, 2000) can be strong indicators of homology (Lallemand et al., 2020). But they are best used alongside high-quality genome assembly and annotation data, otherwise there is the strong possibility that predicted duplicates will be false positives due to assembly artefacts.
Various bioinformatics tools and software suites have been developed for identifying gene duplications. When choosing tools for identifying duplicate genes, much depends on the biological questions being asked, the genomes being compared, and the bioinformatics skills of the user (Lallemand et al., 2020). GenomeHistory (Conant and Wagner, 2002), for example, is a popular tool, which does not require the user to manually run BLAST searches and also provides information on the synonymous and nonsynonymous substitution rates of duplicate genes. OrthoDB (Zdobnov et al., 2017) and OrthoMCL (Li et al., 2003a) use the graph-based method and Markovian Cluster algorithm to identify in-paralogs within species. Likewise, OrthoFinder (Emms and Kelly, 2015; Emms and Kelly, 2019) can detect orthogroups across species and infer gene duplication events from gene trees. RetrogeneDB was built to identify retrocopies with the criteria that the aligned sequences are at least 150 bp long and have at least 50% amino acid identity and coverage to parental genes (Kabza et al., 2014; Rosikiewicz et al., 2017). It is important to stress, however, that some of these bioinformatics algorithms and associated tools were not specifically designed for detecting duplicates.
There are some previously developed tools and databases for studying gene duplication. The Duplicated Gene Database (DGD), for instance, collected the co-localized and duplicate genes from nine species but has not updated any new species since 2012 (Ouedraogo et al., 2012). In the DGD, two genes were considered as co-localized duplicates when the all-against-all BLAST results were within a 100 gene window and satisfied the previously noted formula (Li et al., 2001). Similarly, the Plant Genome Duplication Database (PGDD) houses gene and genome duplication information (Lee et al., 2012; Lee et al., 2017), but the website no longer appears to be active. More recently, a research group developed a duplication events detection pipeline incorporated with the MCScanX algorithm (Wang et al., 2013) that can detect duplicates in plants derived from whole-genome, tandem, proximal, transposed, or dispersed duplication events (Wang et al., 2011; Qiao et al., 2019) (see the detailed method comparisons in the Results and Discussion section).
We recently showed that the nuclear genome of Antarctic green alga Chlamydomonas sp. UWO241 harbours hundreds of HSDs, which might be aiding its survival in the cold via gene dosage (Cvetkovska et al., 2018; Zhang et al., 2021a). These HSDs were curated into a filtered gene set whereby each group of duplicates had near-identical protein lengths (within 10 amino acids of each other) and ≥90% pairwise identities (Zhang et al., 2021b). In our analysis of the UWO241 genome, we struggled to find adequate bioinformatics tools to identify, annotate, categorize, and visualize duplicated genes with similar gene structures (i.e., similar Pfam domains and InterPro annotations). Consequently, we designed an easy-to-use, automated, and online software tool called HSDFinder.
The software is catered to identifying highly similar duplicate genes and not necessarily highly divergent duplicates. In other words, HSD finder is best used to find paralogs that are highly similar in sequence and thus likely carry out the same function. Highly similar paralogs likely (but not certainly) arose more recently than more diverged paralogs (i.e., HSDs likely represent more recent duplication events than less similar duplicates). From a functional perspective, HSDs/HS-paralogs probably encode proteins that carry out the same function and thus are more likely to have a role in gene dosage as compared to more divergent duplicates/paralogs.
This software is also designed with a user-friendly interface for parsing BLAST all-against-all protein sequence similarity searches via homology assessment metrics (i.e., amino acid pairwise identity and amino acid length variance); it integrates structural information, including Pfam domains and InterPro annotations, in order to better annotate gene duplicates; it displays the duplicates to be categorized over KEGG pathway schematics; and it offers an online publication-ready heatmap plotting option for visualizing the duplicates across species.
Materials and Methods
Requirements and Implementation
HSDFinder can be run on the Apache server through an online web interface designed using HTML and Python scripts (http://hsdfinder.com) or through a local environment (Linux and Python 3) after downloading the software package from GitHub (https://github.com/zx0223winner/HSDFinder). But to run it locally, the pre-installed Python (preferably Python 3) and Linux (e.g., Ubuntu 20.04 LTS) environments are required. Usually, a minimum specification requirement is a machine with two cores and 4 GB of random-access memory (RAM), which should allow HSDs to be identified and visualized within a few minutes. The tested data and external software resources, including links, are listed in the key resources table (Supplementary Table S1). The documentation and tutorials can be found via the GitHub: https://github.com/zx0223winner/HSDFinder.
The software implementation is written in Python 3. There are three groups of custom scripts and platforms: 1) HSDFinder.py, operation.py, and pfam.py filter, which annotate the duplicates from BLAST all-against-all protein similarity search results and protein annotation databases (e.g., Pfam domain); 2) HSD_to_KEGG.py categorizes the duplicates under KEGG pathway functional categories; and 3) Django (3.1.5), a Python-based web platform used to maintain the web server as well as pandas (1.2.2), the software library used for manipulating the data. The full HSDFinder source code can be found in the GitHub repository. Necessary input files include the 12-column BLAST all-against-all protein similarity search output in tab-delimited file and the 13-column InterProScan (Quevillon et al., 2005) search output in a tab-delimited file. The HSD results are summarized in an 8-column tab-delimited file. To create a heatmap of the HSDs under pathway functional categories, the KO accession file with each gene model identifier must be retrieved from the KEGG database internal tools (BlastKOALA or GhostKOALA) (Kanehisa and Goto, 2000; Kanehisa et al., 2016). The result of HSDs under different KEGG functional categories is summarized in an 8-column tab-delimited file. For examples of input and output files, please refer to a published protocol using HSDFinder for analyzing HSDs in seven green algal species (Supplementary Table S1) (Zhang et al., 2021b).
Software Procedures
Before running HSDFinder, two tab-delimited files created by external tools are needed (Figure 1A). The first is the all-against-all protein sequence BLAST search file (defaulted parameters: E-value cut-off ≤ 1e-5, BLASTP -outfmt 6, -word_size 3, -gapopen 11, -gapextend 1, -max_target_seqs 15). Note, if the species of interest has a large number of gene duplicates, we recommend users enlarge the value of -max_target_seqs. The second is the protein function file acquired from the software InterProScan (defaulted parameters: -f tsv, -dp, -goterms, -pa), which allows protein sequence to be scanned by different protein signature databases (e.g., Pfam domain). Then, the two tab-delimited files can be uploaded to HSDFinder with some personalized options. The default setting of HSDFinder filters HSDs with near-identical protein lengths (within 10 amino acids of each other) and ≥90% pairwise amino acid identities. But users can customize the threshold metrics to optimize their dataset of gene duplicate candidates. The output of HSDFinder is arranged in an 8-column tab-delimited file containing the HSD identifier, gene copy number, and protein signature (e.g., Pfam domain) (Figure 1B). To compare HSDs across different species and visualize HSD results in different KEGG pathway categories, we provide an online heatmap plotting option. Users will need to use the HSD results from the previous steps to employ this feature. Additionally, the file retrieved from the KEGG database documenting the correlation of KEGG Orthology (KO) accession with each gene model identifier will be used to categorize HSDs. Once the two files have been submitted for each species, the HSDs will be displayed in a heatmap (the color for the matrix reflects the number of HSDs across species) and a tab-delimited file under different KEGG functional categories, such as carbohydrate metabolism, energy metabolism, and translation (Figure 1C).
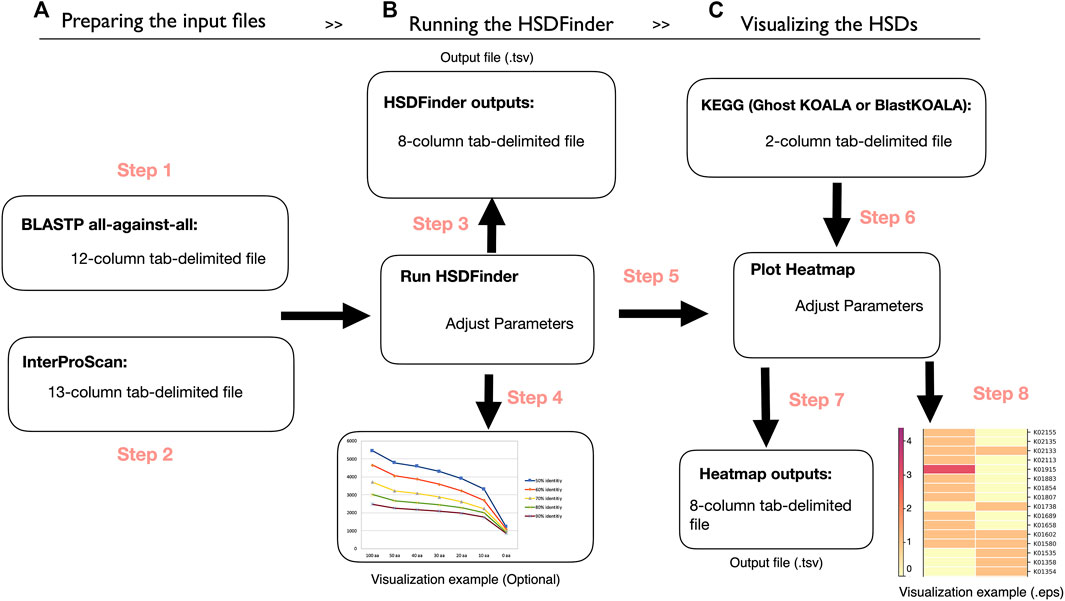
FIGURE 1. The workflow of HSDFinder. (A) Step 1-2: Preparing the protein BLAST all-against-all protein similarity search result file and preparing the InterProScan search result file. (B) Step 3-4: Yielding the output of HSDFinder with three personalized options and visualizing the HSDFinder results. (C) Step 5-8: Uploading the results of HSDFinder from your respective genomes, uploading a gene list with KO annotation from KEGG database, generating the output files of the online heatmap visualization tool and visualizing the heatmap of HSD levels across species.
Software Principles
HSDFinder is a BLAST-based method, which is designed to parse the BLAST all-against-all protein similarity search result via amino acid pairwise identity and amino acid length variance. By default, HSDFinder filters HSDs with near-identical protein lengths (within 10 amino acids of each other) and ≥90% pairwise amino acid identities. Choosing such a strict cut-off might rule out other genuine duplicates from the list. But based on our past experience with green algal genomes (Zhang et al., 2021a) and validation analyses with some of the best assembled model eukaryotic genomes (discussed in Results section), these default thresholds can capture a large number of HSDs. For poorly curated genomes, potential bottlenecks include an increase in the number of hypothetical proteins among predicted HSDs. But since the similarity of duplicated genes within and among genomes can vary significantly, the thresholds can be adjusted (e.g., selecting ≥80% pairwise amino acid identity, still within 10 amino acid length of each other) to acquire more possible HSD candidates (Figure 2A). Similar to the clustering strategy of DGD co-localized genes (Ouedraogo et al., 2012), gene copies in HSD groups were clustered based on the principle of a simple transitive link between the remaining genes: if gene copy A was highly similar to gene copy B and to gene copy C, then gene copies A, B, and C were clustered in the same HSD group, even if gene copies B and C were less similar (Figure 2B). This is also why the amino acid length variances and percent identity thresholds of HSDFinder were set to a default of 10 and 90%, respectively — to increase the prediction accuracy of HSDs, especially for genomes with large numbers of duplicate genes.
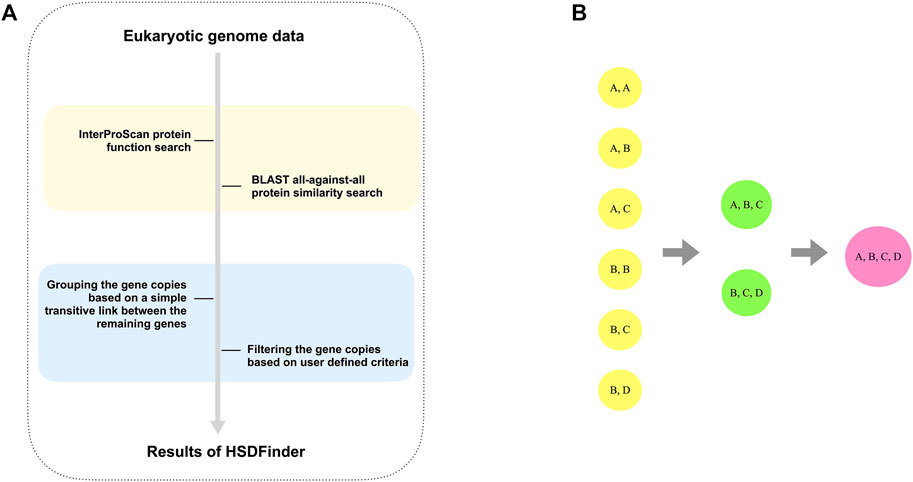
FIGURE 2. The principle of detecting and grouping the HSDs for eukaryotic genomes. (A) The flowchart to parse the BLAST all-against-all protein similarity search result via amino acid pairwise identities and amino acid length variances. (B) The principle used to group the satisfied gene copies is based on a simple transitive link between the remaining genes.
3 Results and Discussion
Data Collection
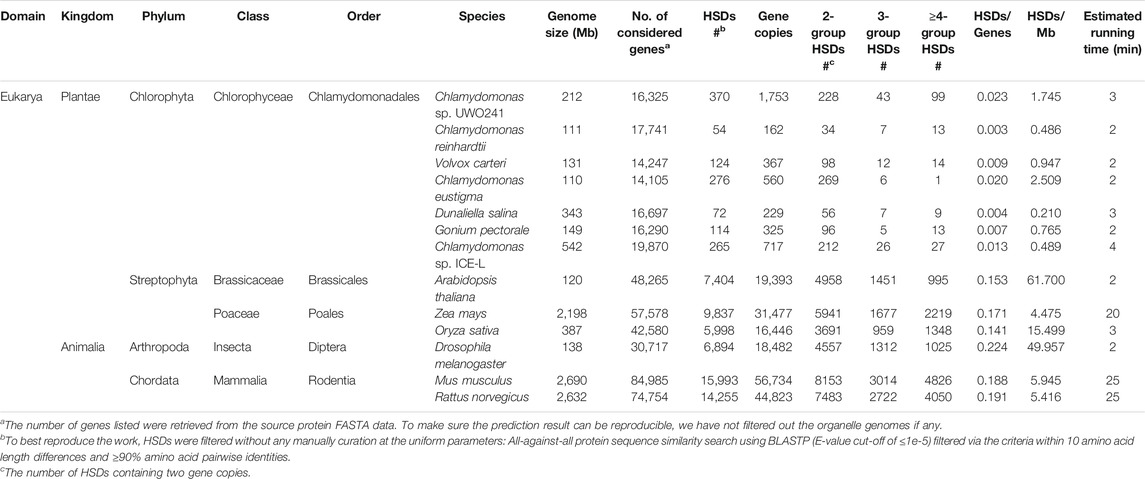
We collected and catalogued HSDs from thirteen nuclear genomes from land plants, animals, and green algae (Table 1). Seven different algal species were selected due to our specific interest in green algal genomics and because of their relatively small genome sizes and gene numbers, which can help decrease the processing time (running time can range from 2–5 min) and central processing unit (CPU) when testing the HSDFinder tool. The other six plant and animal genomes were used to test the performance of HSDFinder. Altogether, we identified 61,656 HSD groups in the thirteen genomes, totaling 191,468 gene copies. The HSD groups with only two, three, and at least four gene copies are 35,776, 11,241, and 14,639, respectively. Compared to the explored green algal genomes, the land plant and animal genomes had higher detected numbers of HSDs, as well as higher ratios of HSDs/Mb and HSDs/total genes (Table 1). For example, the HSDs/Mb values in A. thaliana, O. sativa, D. melanogaster were 61.7, 15.5 and 50.0, respectively, while the largest HSDs/Mb value among selected green algae was 2.5 in Chlamydomonas eustigma. This might reflect the diploid nature of the plant and animal genomes, which can yield more gene duplicates via whole-genome duplication events as compared to their haploid green algal counterparts. This can be observed from the results of 3-group HSDs and at least 4-group HSDs in diploid species, which still retain large numbers of HSDs (e.g., 3-group: 1,451 (20% of total) and ≥ 4-group: 995 (13% of total) in A. thaliana) compared to the haploid algal species (e.g., 3-group: 26 (10% of total) and ≥ 4-group: 27 (10% of total) in Chlamydomonas sp. ICE-L) (Table 1). Note, HSD density is also positively associated with genome size, which tends to be larger in land plants and animals as compared to green algae.
To explore the functions of detected HSDs, we compared three green algae species all of which had relatively large numbers of HSDs/genes. These algae can survive under different extreme environmental conditions, and include the Antarctic psychrophilic green algae UWO241 (0.021) and Chlamydomonas sp. ICE-L (0.013) and the acidophilic species C. eustigma (0.020) (Table 1). The identified duplicates are involved in a diversity of cellular pathways, including gene expression, cell growth, membrane transport, and energy metabolism, but also include ribosomal proteins (species: HSDs number/gene copies number; UWO241: 19/42; ICE-L: 41/91; C. eustigma: 8/16), histone functional domains (UWO241: 5/99; ICE-L: 8/93; C. eustigma: 4/13) (Table 2). Although HSDs for protein translation, DNA packaging, and photosynthesis are particularly prevalent, around 30% of the HSDs are hypothetical proteins without any Pfam domains.
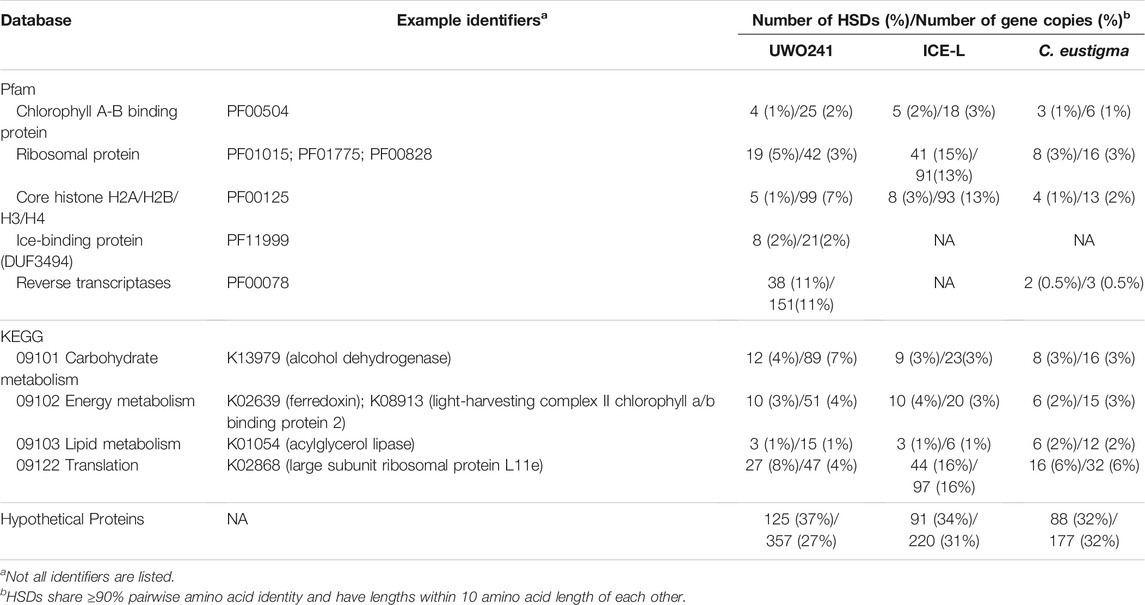
TABLE 2. Summary statistics of highly similar duplicate gene (HSDs) functions in selected eukaryotic green algae (Chlamydomonas sp. UWO241, Chlamydomonas sp. ICE-L, and Chlamydomonas eustigma).
Performance
To test the performance of HSDFinder, six well-assembled model eukaryotic nuclear genomes were selected, including those of A. thaliana, O. sativa, Z. mays, D. melanogaster, M. musculus, and R. norvegicus. The statistics of HSD candidates in each species via different thresholds are summarized in Table 3 and Supplementary Table S2. The distributions of gene duplicates in each species filtered by various thresholds are presented in Figure 3 and Supplementary Figure S1. Taking the A. thaliana genome as an example, an all-against-all protein sequence similarity search using BLASTP (E-value cut-off of ≤1e-5) was filtered via the following criteria: from 10 to 100 amino acid length differences and from ≥60% to ≥90% amino acid pairwise identities (Table 3). The capturing rate of the results and the performance of the BLAST-based tool were evaluated by the following equations:
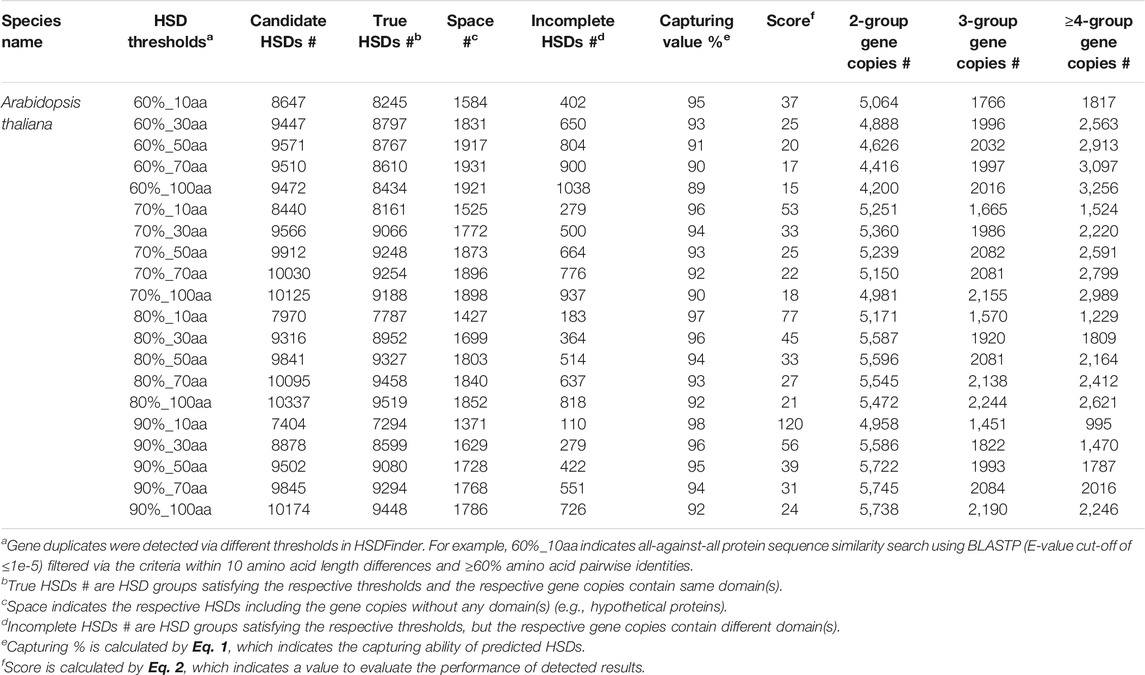
TABLE 3. Summary statistics of gene duplicates in Arabidopsis thaliana detected via different thresholds in HSDFinder.
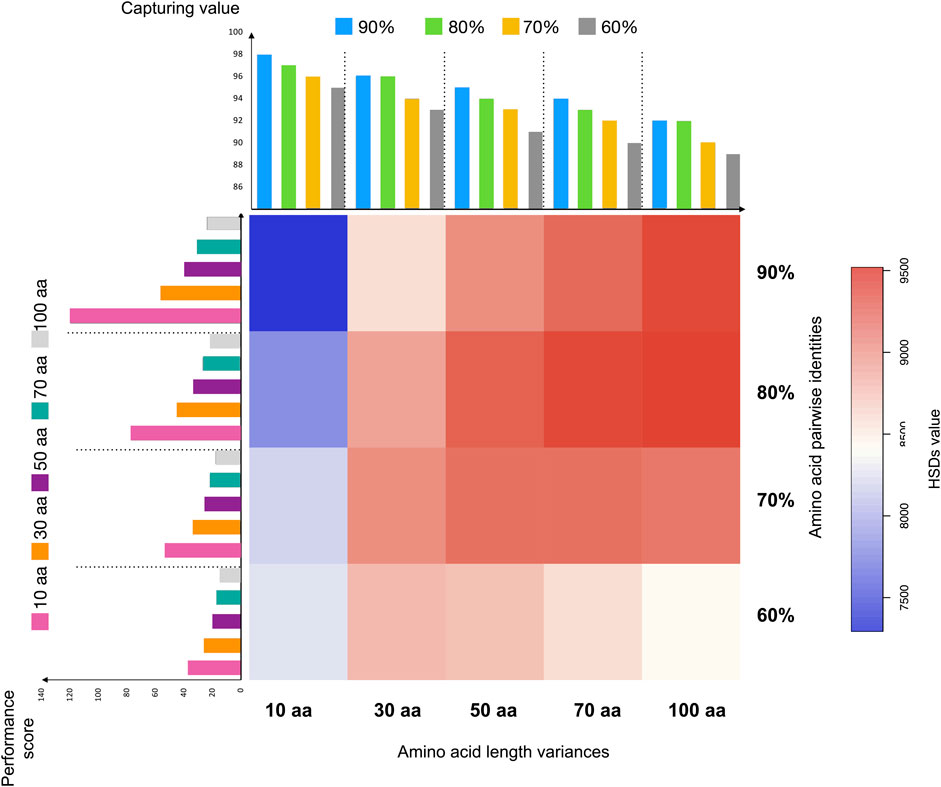
FIGURE 3. The distribution of duplicates in Arabidopsis thaliana detected via different thresholds in HSDFinder. Note: (1) The X-axis labelling for heatmap, for example, 10 aa indicates all-against-all protein sequence similarity search using BLASTP (E-value cut-off of ≤1e-5) filtered via the criteria within 10 amino acid length differences; the Y-axis labelling for heatmap, for example, 90% indicates ≥90% amino acid pairwise identities; the color matrix indicates the number of true HSDs from the lowest (blue) to highest (red); (2) The X-axis labelling for the bar graph on the left-hand side of the heatmap, the color bar indicates the amino acid length threshold, for example, pink for threshold within 10 amino acid length differences (orange for 30 aa, purple for 50 aa, cyan for 70 aa and light grey for 100 aa); the Y-axis is the performance score indicating a value to evaluate the performance of detected results. (3) The X-axis labelling for the bar graph on the top side of the heatmap, the color bar indicates the amino acid pairwise identity threshold, for example, blue for threshold within 90% amino acid pairwise identities (green for 80%, yellow for 70%, and grey for 60%); the Y-axis is the capturing value indicating the capturing ability of predicted HSDs.
In Table 3, “True HSD #” is the number of HSD groups that satisfy the respective thresholds and for which the respective gene copies contain the same domain(s). “Space” denotes HSDs (including gene copies) without any domain(s) (e.g., hypothetical proteins). “Incomplete HSD #” indicates the number of gene duplicates that satisfy the respective thresholds but for which the associated gene copies contain different domain(s). Note, incomplete HSDs and partial duplicates with differing domain structures could have undergone duplication as well as other evolutionary processes, such as recombination (Long and Langley, 1993; Katju and Lynch, 2003; Zhang et al., 2004). Also, keep in mind that there is the possibility of false positives when identifying gene duplicates. The capturing value Eq. 1 reflects the number of predicted HSDs. As displayed in Figure 3, when keeping the amino acid length at the same level, the capturing value (bar graph at the top) decreases with the amino acid pairwise identity going down. This is true with the amino acid length variance from ≥10 amino acids to ≥100 amino acids. Larger amino acid length variances can result in more partial duplicates (i.e., possible genes copies with different domains), decreasing the capturing rate of predicted HSDs. But loosening the thresholds for amino acid length variance and pairwise identity can increase the sensitivity of prediction (Figure 4). Since a gold standard cut-off is impossible to determine, different metrics will lead to different results (Lallemand et al., 2020). We set the parameters of the default to ≥90% amino acid pairwise identity and 10 amino acid length variances, then refine the possible HSDs candidates from ≥80% amino acid pairwise identity and 10 amino acid length variances. This is a highly conservative sensitivity.
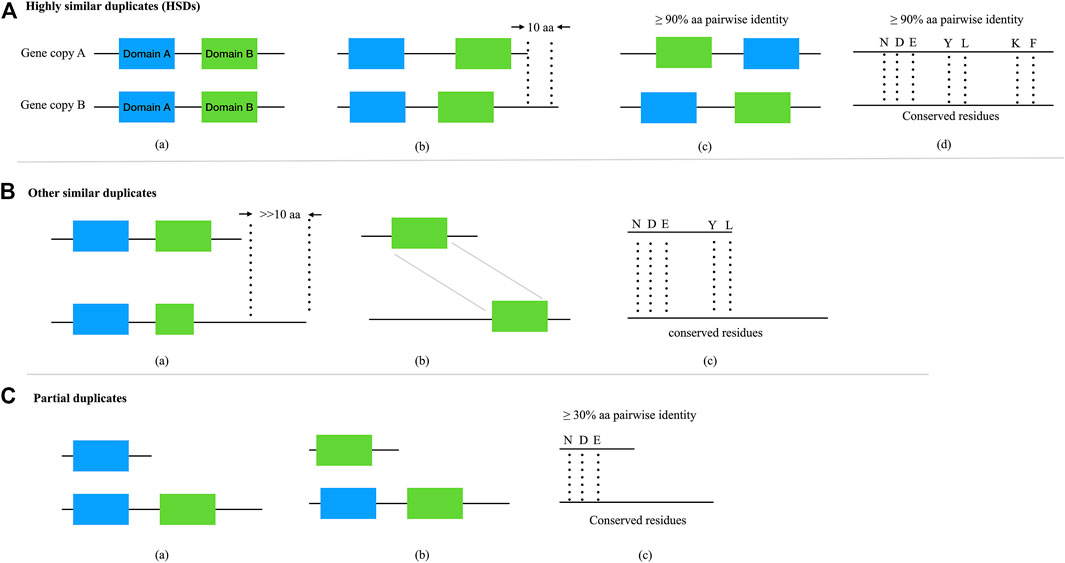
FIGURE 4. The categories and relationships of complete and partial gene duplicates. (A) Complete duplicates with highly similar structures (i.e., HSDs). a,b,cDuplicates with shared domain(s), satisfied with ≥90% protein pairwise identity and ≤10 amino acid length variances; bduplicates share with conserved residues, satisfied with ≥90% protein pairwise identity and ≤10 amino acid length variances. (B) Other similar duplicates with highly conserved structure but very different amino acid length. a,b,cDuplicates shared with same domain(s) or residues, satisfied with ≥30% protein pairwise identity (Li et al., 2001) and >>10 amino acid length (C) Partial gene duplicates. a,b,cDuplicates partially shared with domain(s) or residues, satisfied with ≥30% protein pairwise identity.
Users of HSDFinder should evaluate the performance of each threshold to best filter the appropriate gene duplicate set. Unfortunately, there are no simulated data available to do the benchmark work (running time, results, false positives, false negatives, etc.). But we introduced a simple equation to roughly evaluate the performance of each metric. For example, in Eq. 2, the numerator is the total of true HSDs plus the HSD groups containing functional domains (Incomplete HSDs + True HSDs -Space). The denominator is the incomplete HSDs plus one, to get rid of zero as a denominator. We designed the software to acquire as many accurate HSD predictions as possible, especially those that contain matching (and complete) domains. Thus, incomplete HSDs results in a penalty score to the denominator, true HSDs and value (Incomplete HSDs + True HSDs -Space) earning a bonus score as the numerator. Taking A. thaliana as an example (Figure 3 and Supplementary Figure S1), the performance score reflected the highest value at the threshold of ≥90% amino acid pairwise identity and 10 amino acid length variances, with the second highest value at ≥80% amino acid pairwise identity and 10 amino acid length variances. Similar results were also observed with the other explored genomes (i.e., those of Z. mays, O. sativa, D. melanogaster, M. musculus and R. norvegicus) (Supplementary Figure S1). Thus, for HSDFinder, we set the default parameters to ≥90% amino acid pairwise identity and 10 amino acid length variances, then refine the possible HSDs candidates from ≥80% amino acid pairwise identity and 10 amino acid length variances.
To validate the performance of these parameters in HSDFinder, we compared the number of duplicated genes predicted by HSDFinder to other previously used methods for A. thaliana, Z. mays, and O. sativa (Table 4). Our detection results gave comparable numbers of nearly identical gene duplicates: 21,516 (HSDFinder) vs 21,622 for A. thaliana (Wang et al., 2011; Qiao et al., 2019); 34,581 (HSDFinder) vs 43,000 (Panchy et al., 2016) for Z. mays; and 17,989 (HSDFinder) vs 21,461 (Wang et al., 2011; Qiao et al., 2019) for O. sativa. Note: we used the most up-to-date assembly versions of the published genomes because HSDFinder is dependent on the existence of high-quality genome assembly and annotation data. For example, in A. thaliana, 21,516 and 19,393 gene copies were detected to be highly similar using a ≥80% amino acid pairwise identity and a 10 amino acid length variance and a ≥90% amino acid pairwise identity and a 10 amino acid length variance, respectively. However, 11,937 and 12,761 gene duplicates were collected using BLASTN (all-against-all at ≥40% nucleotide identity) (Blanc and Wolfe, 2004) and BLASTP (all-against-all at ≥30% identity) (Maere et al., 2005). This large discrepancy in the number of duplicates recovered between the two methods is mostly due to the updating of protein annotations in A. thaliana. The Arabidopsis Information Resource (TAIR) genome has released ten annotation versions over the past decade.
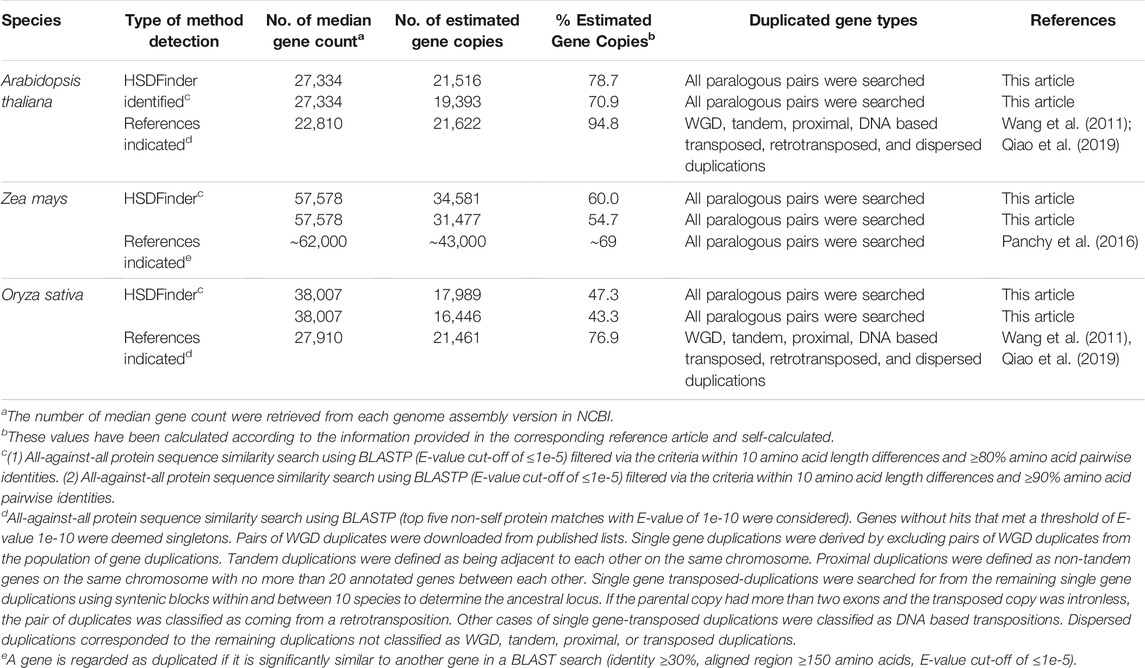
TABLE 4. Comparison of the number of duplicated genes by different methods in model species, such as Arabidopsis thaliana, Oryza sativa (Rice) and Zea mays. Adapted from Lallemand et al. (2020) under the creative commons attribution license.
4 Limitations
HSDFinder can identify duplicated genes when the duplicates satisfy the assigned criteria: near-identical protein lengths (within 10 amino acids of each other) and ≥90% pairwise amino acid identities. However, it does not rule out another widespread method for duplication detection based on Best BLAST Mutual Hits (BBMH) (Droc et al., 2006). Unlike the pipeline tool DupGen_finder (Wang et al., 2011; Qiao et al., 2019), our software cannot efficiently differentiate duplicates arising from tandem, proximal, dispersed, whole-genome, DNA-based transposon, or retrotransposon duplication events. The limitations of HSDFinder also include the requirement of users to be familiar with the external tools such as the BLAST package, InterProScan, and KEGG’s BlastKOALA and GhostKOALA. But we do provide build-in references for each input file as well as a step-by-step protocol (Zhang et al., 2021b). In our experiences (Zhang et al., 2021a), the default settings of HSDFinder were able to detect a significant proportion of intact duplicated genes, but many fragmented and partial duplicates were missed. Users can employ different metrics to filter for their desired duplicates, and HSDFinder can easily group those duplicates into a list if the genome assembly is of good quality. However, the challenge is to separate complete gene duplicates from divergent partial duplicates. Thus, it is easy to uncover more duplicates via lowering the threshold, but hundreds of partials and divergent paralogs could be generated at the same time. It is our hope in the future to optimize the metrics of sequence similarity (e.g., amino acid sequence similarity and length variance) and protein structure (e.g., Pfam domain) to increase the capturing ability of detecting complete duplicates. The software will also be expanded to consider other types of genomic data, such as prokaryotic and organelle genomes. We will also employ the software on other chlorophyte algae and model eukaryotic genomes. The results will be documented in HSDatabase (http://hsdfinder.com/database/).
5 Conclusion
With the decreasing cost of biological analyses (e.g., next-generation sequencing), biologists are dealing with larger amounts of data, and many bioinformatics software analysis suites require considerable knowledge of computer scripting and microprogramming. HSDFinder is designed to fill the demand for custom-made scripts to move from one analysis step to another. It can analyze duplicated genes from genome sequences by integrating the results from InterProScan and KEGG. HSDFinder aims to become a useful platform for the identification and comprehensive analysis of HSDs in eukaryotic genomes. In the future, the software will be improved by taking into account more scientific discoveries in the field of gene duplication, particularly substitution rate analyses and expression levels.
Data Availability Statement
The datasets of eukaryotes supporting the conclusions of this article are available from JGI (https://phytozome.jgi.doe.gov/pz/portal.html) or NCBI (https://www.ncbi.nlm.nih.gov) database.
Author Contributions
The study was conceptualized by XZ and DS. XZ wrote the initial draft and performed the data analysis. YH implemented the HSDFinder website. DS contributed to the manuscript editing. All authors commented to produce the manuscript for peer review.
Funding
The authors gratefully acknowledge funding of Discovery Grants from the Natural Sciences and Engineering Research Council of Canada (NSERC).
Conflict of Interest
The authors declare that the research was conducted in the absence of any commercial or financial relationships that could be construed as a potential conflict of interest.
Publisher’s Note
All claims expressed in this article are solely those of the authors and do not necessarily represent those of their affiliated organizations, or those of the publisher, the editors and the reviewers. Any product that may be evaluated in this article, or claim that may be made by its manufacturer, is not guaranteed or endorsed by the publisher.
Acknowledgments
We appreciate the constructive suggestions from all the reviewers.
Supplementary Material
The Supplementary Material for this article can be found online at: https://www.frontiersin.org/articles/10.3389/fbinf.2021.803176/full#supplementary-material
References
Blanc, G., and Wolfe, K. H. (2004). Widespread Paleopolyploidy in Model Plant Species Inferred from Age Distributions of Duplicate Genes. Plant Cell 16, 1667–1678. doi:10.1105/tpc.021345
Brunet, T., and Doolittle, W. F. (2018). The Generality of Constructive Neutral Evolution. Biol. Philos. 33, 1–25. doi:10.1007/s10539-018-9614-6
Buchfink, B., Xie, C., and Huson, D. H. (2015). Fast and Sensitive Protein Alignment Using Diamond. Nat. Methods 12, 59–60. doi:10.1038/nmeth.3176
Conant, G. C., and Wagner, A. (2002). GenomeHistory: a Software Tool and its Application to Fully Sequenced Genomes. Nucleic Acids Res. 30, 3378–3386. doi:10.1093/nar/gkf449
Conant, G. C., and Wolfe, K. H. (2008). Turning a Hobby into a Job: How Duplicated Genes Find New Functions. Nat. Rev. Genet. 9, 938–950. doi:10.1038/nrg2482
Conrad, B., and Antonarakis, S. E. (2007). Gene Duplication: a Drive for Phenotypic Diversity and Cause of Human Disease. Annu. Rev. Genomics Hum. Genet. 8, 17–35. doi:10.1146/annurev.genom.8.021307.110233
Cvetkovska, M., Szyszka-Mroz, B., Possmayer, M., Pittock, P., Lajoie, G., Smith, D. R., et al. (2018). Characterization of Photosynthetic Ferredoxin from the Antarctic Alga Chlamydomonas Sp. UWO241 Reveals Novel Features of Cold Adaptation. New Phytol. 219, 588–604. doi:10.1111/nph.15194
Des Marais, D. L., and Rausher, M. D. (2008). Escape from Adaptive Conflict after Duplication in an Anthocyanin Pathway Gene. Nature 454, 762–765. doi:10.1038/nature07092
Droc, G., Ruiz, M., Larmande, P., Pereira, A., Piffanelli, P., Morel, J. B., et al. (2006). OryGenesDB: a Database for rice Reverse Genetics. Nucleic Acids Res. 34, D736–D740. doi:10.1093/nar/gkj012
El-Gebali, S., Mistry, J., Bateman, A., Eddy, S. R., Luciani, A., Potter, S. C., et al. (2019). The Pfam Protein Families Database in 2019. Nucleic Acids Res. 47, D427–D432. doi:10.1093/nar/gky995
Emms, D. M., and Kelly, S. (2019). OrthoFinder: Phylogenetic Orthology Inference for Comparative Genomics. Genome Biol. 20, 238–314. doi:10.1186/s13059-019-1832-y
Emms, D. M., and Kelly, S. (2015). OrthoFinder: Solving Fundamental Biases in Whole Genome Comparisons Dramatically Improves Orthogroup Inference Accuracy. Genome Biol. 16, 157–214. doi:10.1186/s13059-015-0721-2
Innan, H., and Kondrashov, F. (2010). The Evolution of Gene Duplications: Classifying and Distinguishing between Models. Nat. Rev. Genet. 11, 97–108. doi:10.1038/nrg2689
Kabza, M., Ciomborowska, J., and Makałowska, I. (2014). RetrogeneDB--a Database of Animal Retrogenes. Mol. Biol. Evol. 31, 1646–1648. doi:10.1093/molbev/msu139
Kanehisa, M., and Goto, S. (2000). KEGG: Kyoto Encyclopedia of Genes and Genomes. Nucleic Acids Res. 28, 27–30. doi:10.1093/nar/28.1.27
Kanehisa, M., Sato, Y., and Morishima, K. (2016). BlastKOALA and GhostKOALA: KEGG Tools for Functional Characterization of Genome and Metagenome Sequences. J. Mol. Biol. 428, 726–731. doi:10.1016/j.jmb.2015.11.006
Katju, V., and Lynch, M. (2003). The Structure and Early Evolution of Recently Arisen Gene Duplicates in the Caenorhabditis elegans Genome. Genetics 165, 1793–1803. doi:10.1093/genetics/165.4.1793
Kent, W. J. (2002). BLAT--the BLAST-like Alignment Tool. Genome Res. 12, 656–664. doi:10.1101/gr.229202
Kondrashov, F. A. (2012). Gene Duplication as a Mechanism of Genomic Adaptation to a Changing Environment. Proc. Biol. Sci. 279, 5048–5057. doi:10.1098/rspb.2012.1108
Koonin, E. V. (2005). Orthologs, Paralogs, and Evolutionary Genomics. Annu. Rev. Genet. 39, 309–338. doi:10.1146/annurev.genet.39.073003.114725
Kubiak, M. R., and Makałowska, I. (2017). Protein-coding Genes’ Retrocopies and Their Functions. Viruses 9, 1–27. doi:10.3390/v9040080
Lallemand, T., Leduc, M., Landès, C., Rizzon, C., and Lerat, E. (2020). An Overview of Duplicated Gene Detection Methods: Why the Duplication Mechanism Has to Be Accounted for in Their Choice. Genes (Basel) 11, 1046. doi:10.3390/genes11091046
Lee, T.-H., Kim, J., Robertson, J. S., and Paterson, A. H. (2017). Plant Genome Duplication Database. Methods Mol. Biol. 1533, 267–277. doi:10.1007/978-1-4939-6658-5_16
Lee, T. H., Tang, H., Wang, X., and Paterson, A. H. (2012). PGDD: a Database of Gene and Genome Duplication in Plants. Nucleic Acids Res. 41, D1152–D1158. doi:10.1093/nar/gks1104
Li, L., Stoeckert, C. J., and Roos, D. S. (2003a). OrthoMCL: Identification of Ortholog Groups for Eukaryotic Genomes. Genome Res. 13, 2178–2189. doi:10.1101/gr.1224503
Li, W. H., Gu, Z., Cavalcanti, A. R., and Nekrutenko, A. (2003b). Detection of Gene Duplications and Block Duplications in Eukaryotic Genomes. J. Struct. Funct. Genomics 3, 27–34. doi:10.1007/978-94-010-0263-9_3
Li, W. H., Gu, Z., Wang, H., and Nekrutenko, A. (2001). Evolutionary Analyses of the Human Genome. Nature 409, 847–849. doi:10.1038/35057039
Li, W. H. (1980). Rate of Gene Silencing at Duplicate Loci: a Theoretical Study and Interpretation of Data from Tetraploid Fishes. Genetics 95, 237–258. doi:10.1093/genetics/95.1.237
Long, M., and Langley, C. H. (1993). Natural Selection and the Origin of Jingwei, a Chimeric Processed Functional Gene in Drosophila. Science 260, 91–95. doi:10.1126/science.7682012
Lynch, M. (2007). The Frailty of Adaptive Hypotheses for the Origins of Organismal Complexity. Proc. Natl. Acad. Sci. U S A. 104 Suppl 1, 8597–8604. doi:10.1073/pnas.0702207104
Maere, S., De Bodt, S., Raes, J., Casneuf, T., Van Montagu, M., Kuiper, M., et al. (2005). Modeling Gene and Genome Duplications in Eukaryotes. Proc. Natl. Acad. Sci. U S A. 102, 5454–5459. doi:10.1073/pnas.0501102102
Mitchell, A. L., Attwood, T. K., Babbitt, P. C., Blum, M., Bork, P., Bridge, A., et al. (2019). InterPro in 2019: Improving Coverage, Classification and Access to Protein Sequence Annotations. Nucleic Acids Res. 47, D351–D360. doi:10.1093/nar/gky1100
Nei, M., and Roychoudhury, A. K. (1973). Probability of Fixation of Nonfunctional Genes at Duplicate Loci. The Am. Naturalist 107, 362–372. doi:10.1086/282840
Ouedraogo, M., Bettembourg, C., Bretaudeau, A., Sallou, O., Diot, C., Demeure, O., et al. (2012). The Duplicated Genes Database: Identification and Functional Annotation of Co-localised Duplicated Genes across Genomes. PloS one 7, e50653. doi:10.1371/journal.pone.0050653
Panchy, N., Lehti-Shiu, M., and Shiu, S. H. (2016). Evolution of Gene Duplication in Plants. Plant Physiol. 171, 2294–2316. doi:10.1104/pp.16.00523
Prince, V. E., and Pickett, F. B. (2002). Splitting Pairs: the Diverging Fates of Duplicated Genes. Nat. Rev. Genet. 3, 827–837. doi:10.1038/nrg928
Qian, W., and Zhang, J. (2008). Gene Dosage and Gene Duplicability. Genetics 179, 2319–2324. doi:10.1534/genetics.108.090936
Qian, W., and Zhang, J. (2014). Genomic Evidence for Adaptation by Gene Duplication. Genome Res. 24, 1356–1362. doi:10.1101/gr.172098.114
Qiao, X., Li, Q., Yin, H., Qi, K., Li, L., Wang, R., et al. (2019). Gene Duplication and Evolution in Recurring Polyploidization-Diploidization Cycles in Plants. Genome Biol. 20, 38–23. doi:10.1186/s13059-019-1650-2
Quevillon, E., Silventoinen, V., Pillai, S., Harte, N., Mulder, N., Apweiler, R., et al. (2005). InterProScan: Protein Domains Identifier. Nucleic Acids Res. 33, W116–W120. doi:10.1093/nar/gki442
Rosikiewicz, W., Kabza, M., Kosiński, J. G., Ciomborowska-Basheer, J., Kubiak, M. R., and Makałowska, I. (2017). RetrogeneDB–a Database of Plant and Animal Retrocopies. Database (Oxford) 2017, bax038. doi:10.1093/database/bax038
Rost, B. (1999). Twilight Zone of Protein Sequence Alignments. Protein Eng. 12, 85–94. doi:10.1093/protein/12.2.85
Sander, C., and Schneider, R. (1991). Database of Homology-Derived Protein Structures and the Structural Meaning of Sequence Alignment. Proteins 9, 56–68. doi:10.1002/prot.340090107
Wang, Y., Li, J., and Paterson, A. H. (2013). MCScanX-Transposed: Detecting Transposed Gene Duplications Based on Multiple Colinearity Scans. Bioinformatics 29, 1458–1460. doi:10.1093/bioinformatics/btt150
Wang, Y., Wang, X., Tang, H., Tan, X., Ficklin, S. P., Feltus, F. A., et al. (2011). Modes of Gene Duplication Contribute Differently to Genetic novelty and Redundancy, but Show Parallels across Divergent Angiosperms. PloS one 6, e28150. doi:10.1371/journal.pone.0028150
Zdobnov, E. M., Tegenfeldt, F., Kuznetsov, D., Waterhouse, R. M., Simão, F. A., Ioannidis, P., et al. (2017). OrthoDB v9.1: Cataloging Evolutionary and Functional Annotations for Animal, Fungal, Plant, Archaeal, Bacterial and Viral Orthologs. Nucleic Acids Res. 45, D744–D749. doi:10.1093/nar/gkw1119
Zhang, J., Dean, A. M., Brunet, F., and Long, M. (2004). Evolving Protein Functional Diversity in New Genes of Drosophila. Proc. Natl. Acad. Sci. U S A. 101, 16246–16250. doi:10.1073/pnas.0407066101
Zhang, J. (2003). Evolution by Gene Duplication: an Update. Trends Ecol. Evol. 18, 292–298. doi:10.1016/s0169-5347(03)00033-8
Zhang, X., Hu, Y., and Smith, D. R. (2021b). Protocol for HSDFinder: Identifying, Annotating, Categorizing, and Visualizing Duplicated Genes in Eukaryotic Genomes. Star Protoc. 2, 100619. doi:10.1016/j.xpro.2021.100619
Keywords: comparative genomics, genome duplication, genome evolution, gene duplication, paralogous genes
Citation: Zhang X, Hu Y and Smith DR (2021) HSDFinder: A BLAST-Based Strategy for Identifying Highly Similar Duplicated Genes in Eukaryotic Genomes. Front. Bioinform. 1:803176. doi: 10.3389/fbinf.2021.803176
Received: 27 October 2021; Accepted: 25 November 2021;
Published: 16 December 2021.
Edited by:
Joao Carlos Setubal, University of São Paulo, BrazilReviewed by:
Julian Vosseberg, Utrecht University, NetherlandsNatasha Andressa Jorge, Leipzig University, Germany
Copyright © 2021 Zhang, Hu and Smith. This is an open-access article distributed under the terms of the Creative Commons Attribution License (CC BY). The use, distribution or reproduction in other forums is permitted, provided the original author(s) and the copyright owner(s) are credited and that the original publication in this journal is cited, in accordance with accepted academic practice. No use, distribution or reproduction is permitted which does not comply with these terms.
*Correspondence: Xi Zhang, eHpoYTI1QHV3by5jYQ==; David Roy Smith, ZHNtaXQyNDJAdXdvLmNh
 Xi Zhang
 Yining Hu
 David Roy Smith