 Joseph Kwasi Afrifa
 Obed Segbefia
 Abdulai Sulemana
- 1Department of Wildlife and Range Management, Kwame Nkrumah University of Science and Technology, Kumasi, Ghana
- 2Ghana Wildlife Society, Accra, Ghana
- 3Advocates for Biodiversity Conservation, Accra, Ghana
Citizen science has emerged as a cost-effective complement to structured biodiversity surveys, yet its reliability for small-scale avian monitoring in Africa remains underexplored. This study compared avifaunal species richness, detection accuracy, and the influence of species traits on detectability between full-protocol African BirdMap data (citizen science) and structured surveys conducted within the Cape Coast Metropolitan Area, Ghana. Structured surveys recorded 208 species, while citizen science reported 215, with 176 species (71.3%) shared. A total of 32 and 39 species were unique to the structured survey and citizen science data, respectively. Structured surveys showed higher data accuracy and a narrower confidence interval (99.5%, CI: 0.97–0.99) than citizen science (96.4%, CI: 0.93–0.98). Generalized linear modeling also showed that species detectability was influenced primarily by traits rather than survey method. High vocalization and moderate plumage conspicuousness increased detection likelihood, whereas rarely vocal species were significantly underdetected. Once traits were accounted for, method type was not a significant predictor of detectability (p = 0.85). These findings indicate that well-standardized citizen science protocols can yield avian richness and detectability estimates comparable to structured surveys, though expert-led verification remains vital to minimize misidentification and maintain data quality. The results support integrating citizen science into local avifaunal monitoring, particularly in resource-limited contexts.
Introduction
Avian biodiversity plays a vital role in ecological processes—from pollination to pest control—while also providing cultural and economic benefits to communities (Mariyappan et al., 2023). Effective conservation and management of avian populations require accurate assessments of species richness and distribution patterns (Carroll et al., 2022). Traditionally, these assessments have relied on carefully planned surveys conducted by trained ornithologists, often requiring considerable time and funding. In recent decades, however, citizen science initiatives, where volunteers contribute observational data, have gained popularity as a cost-effective way to collect biodiversity data across vast spatial extents and long temporal scales (Balestrini et al., 2021; Fraisl et al., 2022). One such project is the African BirdMap project (Brooks et al., 2022), a large-scale citizen science program that follows a standardized, grid-based protocol. Each grid cell (“pentad”) measures five minutes of latitude by five minutes of longitude (approximately 9 × 8 km) and serves as the smallest mapping unit (Underhill, 2016). Volunteers submit either full-protocol cards, which cover at least 2 h of focused birdwatching over a maximum of 5 days and across diverse habitats, or ad hoc cards, which include shorter surveys or incidental sightings (Brooks et al., 2022). African BirdMap data have been widely used for mapping bird distributions, detecting range shifts, and assessing population trends (Ringim et al., 2022; Quintana et al., 2024; Tende et al., 2024; Nussbaumer et al., 2025), as well as for determining and comparing changes in bird populations in an area (Lee et al., 2021, 2024; Lee and Hammer, 2022). Nationally, the Ghana Bird Atlas, a previous partial citizen science survey by Dowsett-Lemaire and Dowsett (2014), has contributed immensely to understanding the avifauna of the country.
While citizen science datasets offer broad spatial and temporal coverage, questions remain regarding their comparability to data from structured surveys conducted by research scientists in terms of species richness and detectability. Differences in observer experience, survey methodology, and sampling effort can introduce variability (Stuber et al., 2022). In particular, species detectability (i.e., the likelihood of a species being observed if it is present) can significantly influence the estimation of species richness and distribution maps, with studies showing that an average of 15% of species remain undetected even after multiple surveys (Kéry and Schmid, 2004). Species detectability, in turn, is influenced by multiple factors, including species-specific traits such as body size, behavior, vocalization characteristics, and foraging strategy (Sólymos et al., 2018; Zamora-Marín et al., 2021; Stuber et al., 2022). Additionally, environmental conditions, such as habitat structure, weather, seasonality, and time of day, further influence detectability, as do observer skills and survey protocols (Anderson et al., 2015; Morelli et al., 2022).
In most parts of Africa, citizen science datasets have primarily been used at large spatial scales, often focusing on continental or regional species distribution patterns (e.g Lee and Hammer, 2022; Ringim et al., 2022; Quintana et al., 2024; Tende et al., 2024; Nussbaumer et al., 2025). In contrast, fine-scale detectability comparisons evaluating how well citizen science performs in capturing local-scale species richness and detectability remain rare. Without such fine-scale studies, our understanding of the accuracy of citizen science for site-level biodiversity monitoring is limited. Additionally, despite the increasing use of several citizen science projects in avian monitoring, few studies have explicitly compared species detectability and richness between data collected via citizen science and those obtained by trained research scientists through structured survey protocols. For instance, Callaghan et al. (2018) compared bird species community composition and richness in urban greenspace in Sydney, using eBird data and structured surveys. The study found that structured surveys recorded lower overall species richness (80 species versus 116) and Shannon diversity (3.64 versus 3.94) compared to eBird data. The study attributed the larger magnitudes of the biodiversity indices from the eBird data to the increase in effort, as manifested in the number of observers, time spent surveying and spatial coverage. Whether this is also true for the African BirdMap project and structured surveys remains unknown.
The Cape Coast Metropolitan Area in southern Ghana offers an ideal setting for such comparison and assessment. The area features a heterogeneous urban–rural mosaic of built-up zones, farmlands, coastal habitats, and remnant forests, which support a high diversity of resident and migratory bird species (Deikumah and Kudom, 2010; Afrifa et al., 2022). It is also well represented in the African BirdMap database due to relatively active local birdwatching groups and accessibility, while remaining logistically feasible for structured surveys. This combination of ecological diversity and existing data availability makes Cape Coast a strong case study for testing the agreement between citizen science and structured surveys in estimating species richness and detectability, as well as data accuracy.
To address this gap, we compared African BirdMap data with structured field surveys conducted by trained researchers in Cape Coast. Specifically, we evaluated (i) differences in species richness, (ii) differences in detectability and the influence of species traits (e.g., vocalization, size, plumage) on detection probability, and (iii) variation in detection accuracy and confidence interval widths between the two datasets. We expected that (1) citizen science data would show higher apparent richness due to greater cumulative effort, (2) detectability would differ between methods, with certain traits influencing detection more strongly in one method, and (3) structured surveys would yield higher detection accuracy with narrower confidence intervals.
Materials and methods
Study area
The Cape Coast Metropolitan Area occupies approximately 122 km² along Ghana’s central coastline (Figure 1). It is bounded by the Gulf of Guinea to the south and the neighboring districts Komenda, Edina, Eguafo, Abirem to the west; Abura, Asebu, Kwamankese to the east; and Twifu Heman–Lower Denkyira to the north. This administrative area is governed by the Cape Coast Metropolitan Assembly and is also the regional capital of the Central Region, with an estimated population of 189,925 as of 2021 (Ghana Statistical Service, 2021). The metropolis features a hilly landscape with slopes interspersed by valleys that often host seasonal streams, such as the Kakum River, with wetlands draining into the Fosu Lagoon and eventually the sea. The climate is tropical, with a double rainfall peak occurring between May–June and October during the rainy season. The Harmattan-dominated dry season extends from November to February. Rainfall ranges from 90 cm at the coastal edge to 110–160 cm inland, with temperatures typically between 24°C and 34°C and relative humidity ranging from 60% to 80% (Ghana Meteorological Agency, 2021). Vegetation across the metropolis is a mosaic of coastal savanna—marked by shrubs, grasses, and scattered trees—and secondary growth woodlands. Although heavily altered by human activity, pockets of original flora remain in the form of remnant forest fragments within the campuses of two universities and several second-cycle schools (Deikumah and Kudom, 2010). Aided by varied soil types, agricultural activities remain vital, particularly on the outskirts, with vegetable, root, and staple crop farming being common.
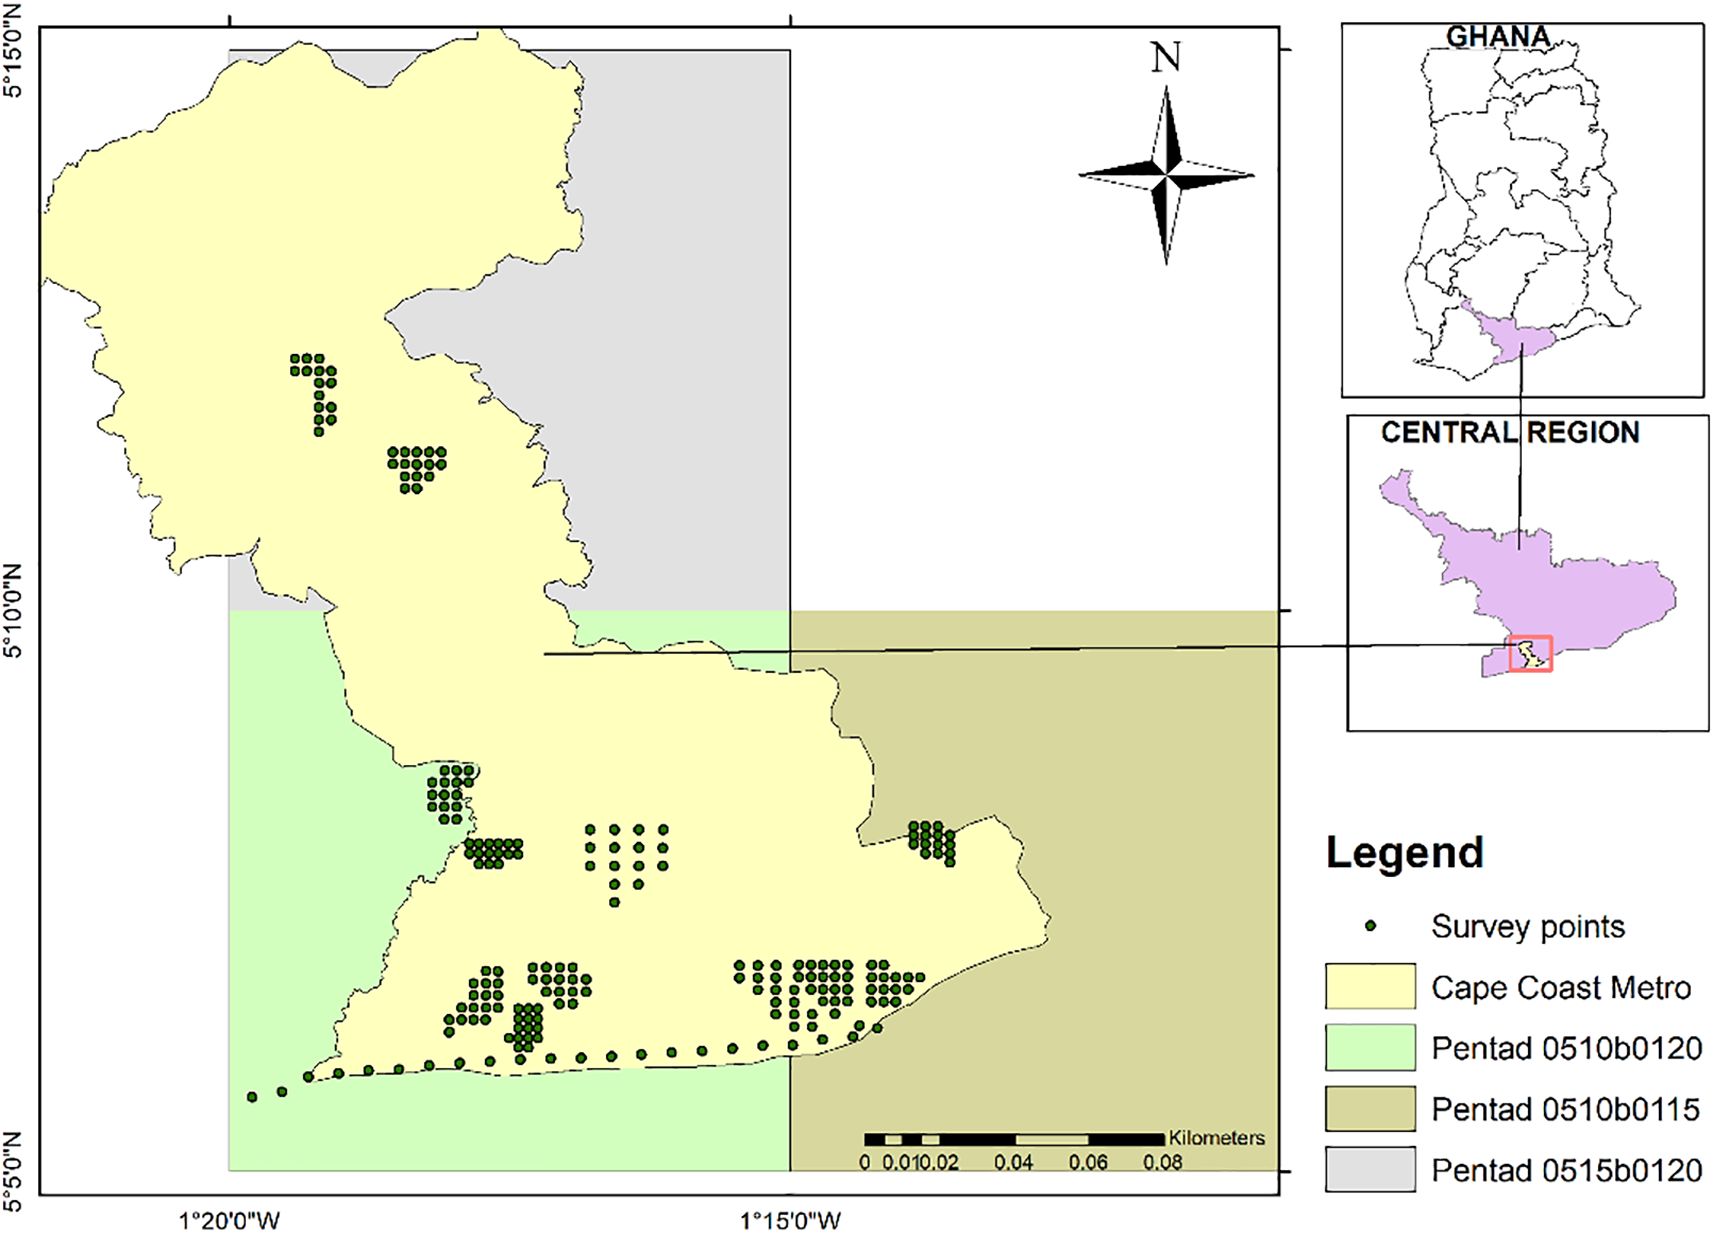
Figure 1. Map of the study area showing points where structured survey data were collected within the Cape Coast Metropolitan Assembly and the locations of the three pentads from which citizen science data were extracted.
Data source
Two sources of species occurrence data were used in this study: structured scientific survey data and citizen science data.
Structured scientific survey data
Structured survey data were compiled from multiple independent studies with varying aims, sampling designs, survey years, and levels of effort. We first conducted a systematic search in the Scopus database to identify studies that surveyed bird populations or communities within the Cape Coast Metropolitan Area. The inclusion criteria focused on studies that employed standard avian survey methods such as point counts, point transects, or line transects. In the Scopus database, the search terms used were: “avian” OR “avifauna” OR “bird” AND “Ghana” OR “Cape Coast.” To ensure relevance, the search was restricted to articles categorized under Agricultural and Biological Sciences and Environmental Science, with no limit on publication year. After reviewing, three articles (Afrifa et al., 2022, 2023; Tamekloe et al., 2025), met the inclusion criteria and were considered for further analysis. The remaining studies were excluded because they were conducted outside the study area.
In addition, we searched the University of Cape Coast (UCC) Thesis Repository for unpublished academic work using the keywords “bird” OR “avifauna” OR “avian,” restricting the search to master’s and doctoral theses from the School of Biological Sciences, with no limit on publication year. This search returned eight master’s theses. After reviewing them, only one study (Opoku, 2018) met the selection criteria for further analysis. The species lists from these four studies were merged, and duplicates were removed based on both scientific and common names, resulting in a structured dataset of 209 unique species.
Citizen science data
Citizen science data were downloaded from the African Bird Atlas Project (African BirdMap; database (https://www.birdmap.africa), focusing on three pentads: 0510_0120, 0510_0115, and 0515_0120, which together encompass the Cape Coast Metropolitan Area. The African BirdMap database includes two types of survey submissions: full-protocol cards and ad hoc cards. While both contribute valuable information on species presence and distribution, for the purpose of this study we focused exclusively on full-protocol cards to ensure consistency and comparability across records, rather than ad hoc cards, which do not meet all or some of the requirements of the protocol.
Although citizen science data were available from 2017, the first eligible structured surveys were in 2018. To ensure temporal overlap with BirdMap data and maintain comparability between datasets, we restricted the analysis to records collected from 2018 onward. Between 2018 and 2025, we retrieved 68 full-protocol cards from the three pentads submitted by 17 observers, with a total of 223 species. These records were classified as citizen science data.
Trait classification
For both datasets, species were assigned the following trait information: body size, vocalization and plumage conspicuousness, using Cornell Birds of the World (https://birdsoftheworld.org) (Table 1).
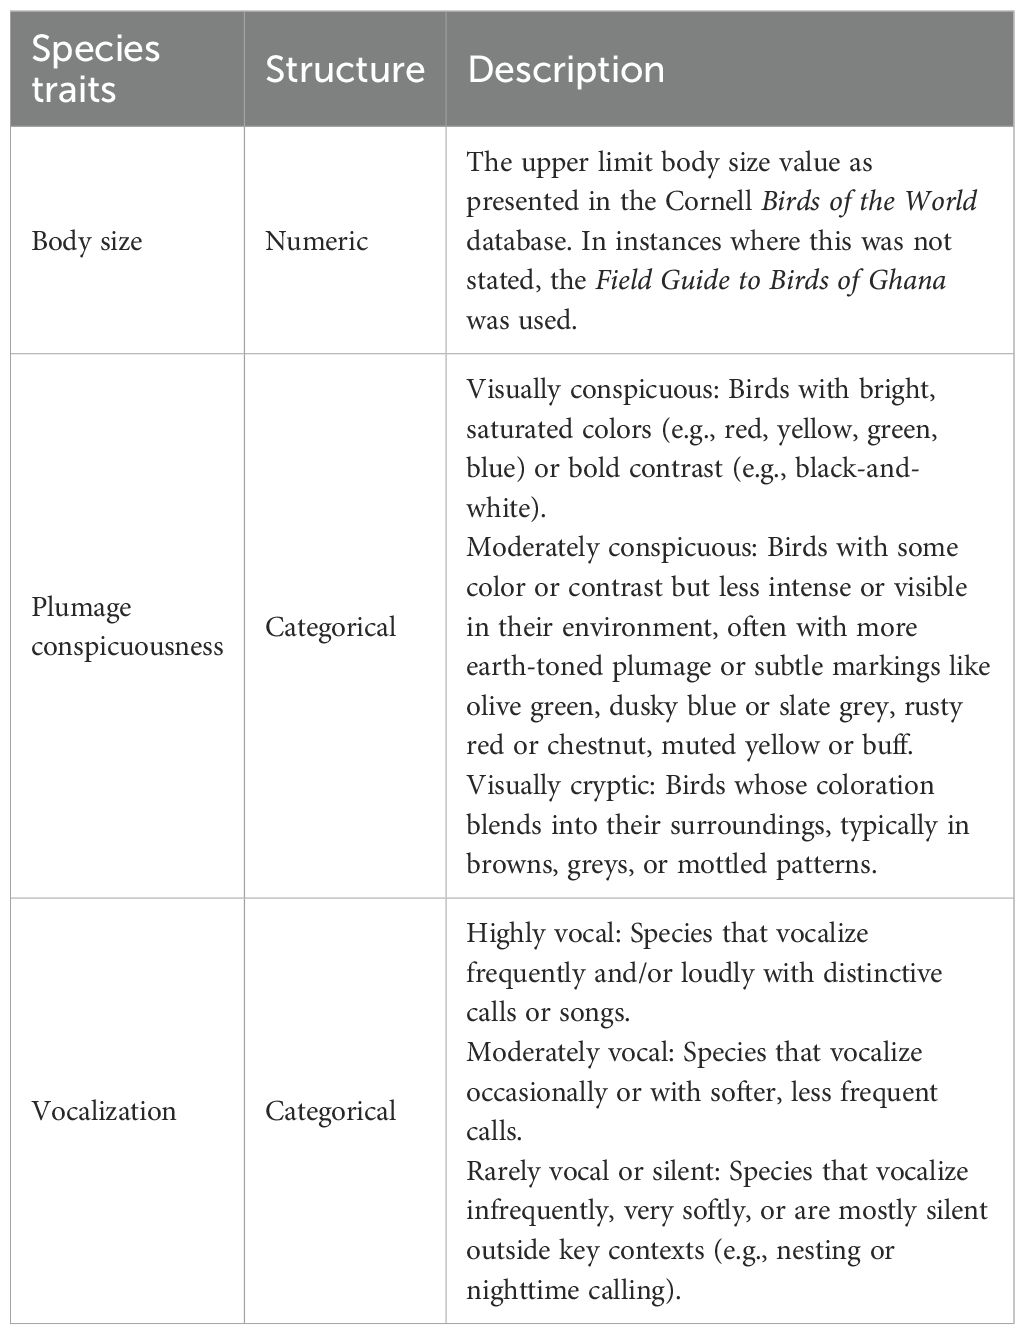
Table 1. Bird species trait classification scheme for avian detectability analysis based on body size, plumage conspicuousness, and vocalization.
Data processing and analysis
Due to differences in some scientific and or common names between the species lists from both datasets, we used the IOC World Bird List (version 15.1; www.worldbirdnames.org) to verify names and also confirm the presence of each species in the study location. The data were then processed to check for spelling inconsistencies and to obtain uniform datasets that could be compared. We overlaid the IUCN species range maps with the Cape Coast area to assess whether each species fell within its expected range. A species was classified as out of range if its documented distribution was at least one country away from the study area.
After reviewing the citizen science data, eight species—White-thighed Hornbill Bycanistes albotibialis, Oriole Finch Linurgus olivaceus, Miombo Wren-warbler Calamonastes undosus, Eastern Plantain-eater Crinifer zonurus, Common Scoter Melanitta nigra, Bronzy Sunbird Nectarinia kilimensisb, Black-throated wattle-eye Platysteira peltate and a species listed as unknown, were found to be out of range or invalid entries and were not included in future analyses except for the data accuracy assessment. Similarly, the Gabon Woodpecker Dendropicos gabonensis was considered to be out of range from the structured dataset.
We calculated species richness from the two surveys and determined the species shared between them, as well as survey-specific unique species, using the R package dplyr (Yarberry, 2021). We tested for significant differences in species richness between the two estimates using Pearson’s chi-squared test with Yates’ continuity correction. We also calculated the unconditional detection probability for each species as the proportion of detections without conditioning on other variables in each survey method—recorded as “1” for presence or “0” for absence.
We then used a generalized linear model (GLM) with a binomial family and a logit link to model detection probability (which followed a binomial distribution) as a function of survey method, species traits (body size, plumage, and vocalization), and their interactions. First, we built a global model with all variables and their interactions. Model diagnostics were performed using the “check_model” function in the performance package. Collinearity among dependent variables was assessed using variance inflation factors (VIF), and linearity was evaluated using residual plots. The diagnostics confirmed that the model was fit for purpose. The global model was then dredged using the “dredge” function in the MuMIn package, and the best model was selected based on model averaging (see Supplementary Material Appendix A for model selection results).
Additionally, we defined and calculated accuracy in terms of extralimital records (species recorded outside their known range), without accounting for possible misidentifications. Accuracy in each dataset was calculated using the formula: Accuracy = (Number of correct entries representing the number of species confirmed to be within range)/(Total number of entries), and the confidence interval in each dataset was calculated using the Wilson method (Wilson, 1927). All analyses and plots were done in R 4.5.1 and with packages ggplot2, ggvenn, binom, tidyverse, stringr, and lme4.
Results
The four studies reported 208 species, while 215 species were reported from the citizen science database. Together, a total of 247 species were recorded in the area. Of these, 176 were recorded by both survey methods, 32 were unique to the structured survey data collected by research scientists, and 39 were unique to the citizen science data, as shown in Figure 2 (see Supplementary Material Appendix B for species list). The results of the Pearson’s chi-squared test with Yates’ continuity correction showed no significant difference in species richness between the two methods (X2 = 0.41, p = 0.52).
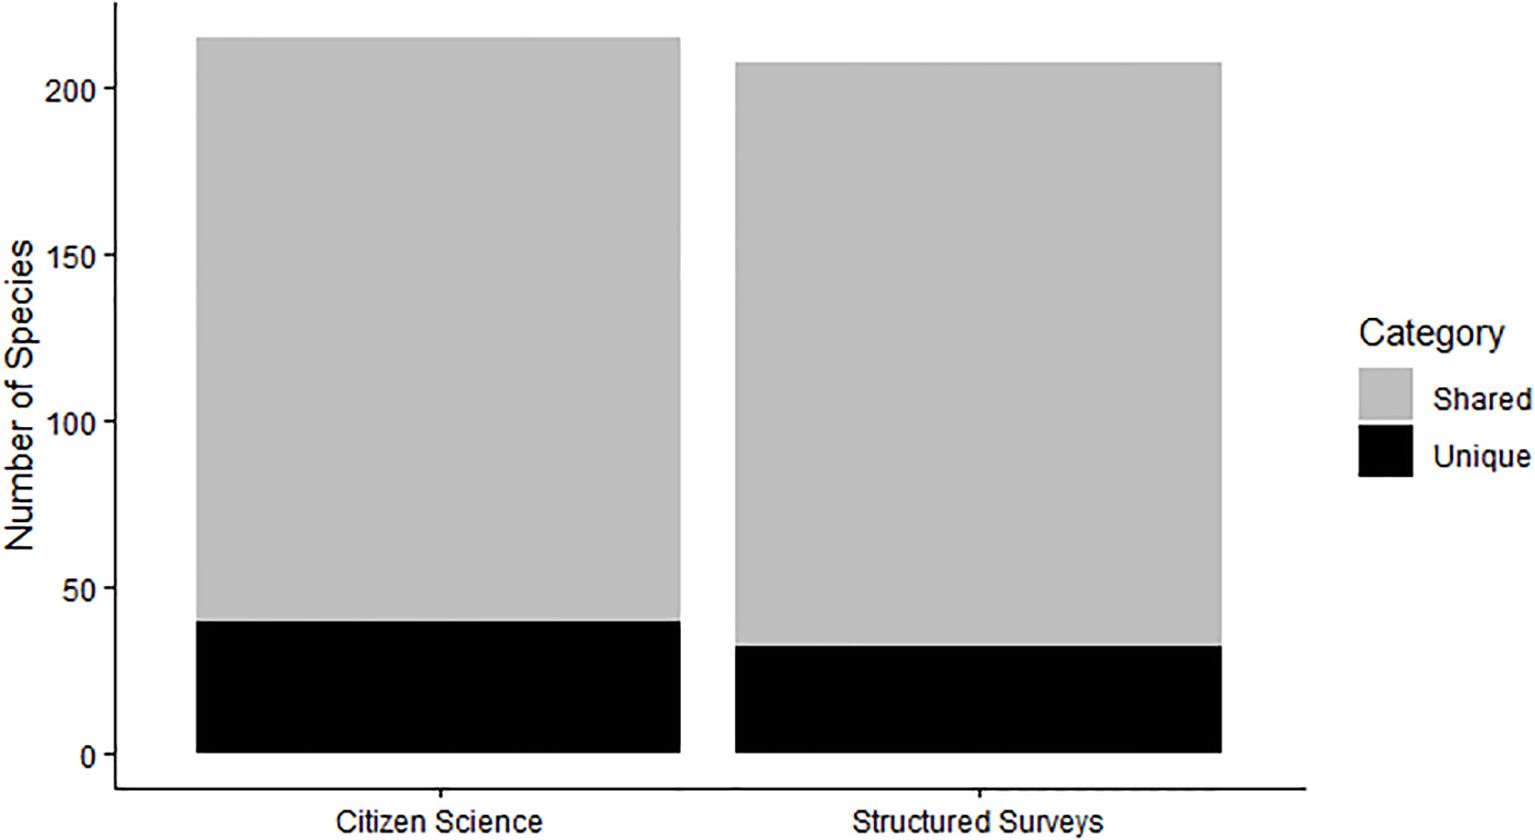
Figure 2. The number of unique and shared species observed in structured research surveys and citizen science efforts.
Accuracy and confidence interval between citizen science and structured bird survey data
The structured survey data had a higher accuracy of 99.5% and a narrower confidence interval (CI: 0.97–0.99), indicating greater confidence in the data than the citizen science dataset, which had an accuracy of 96.4% and a confidence interval of 0.93–0.98.
Influence of species traits on species detectability in citizen science and structured bird surveys
Among the variables tested, the best model showed that bird detectability was influenced more by species traits than by the survey method itself. The model indicated that the intercept (moderately conspicuous, highly vocal, and citizen science) was significant. These results suggest that species that are highly vocal and moderately conspicuous in plumage had the highest detection across both structured and citizen science surveys. In contrast, rarely vocal species were significantly less likely to be recorded (p = 0.03). Although visually cryptic species also showed reduced detection likelihood, the effect was marginally non-significant (p = 0.07). The body size of species did not show a significant influence on detection probability. Interestingly, once species traits were controlled for, the survey method (structured vs. citizen science) was not a significant predictor of detectability (p = 0.85), indicating that well-structured citizen science protocols can yield comparable data for many bird species (Table 2).
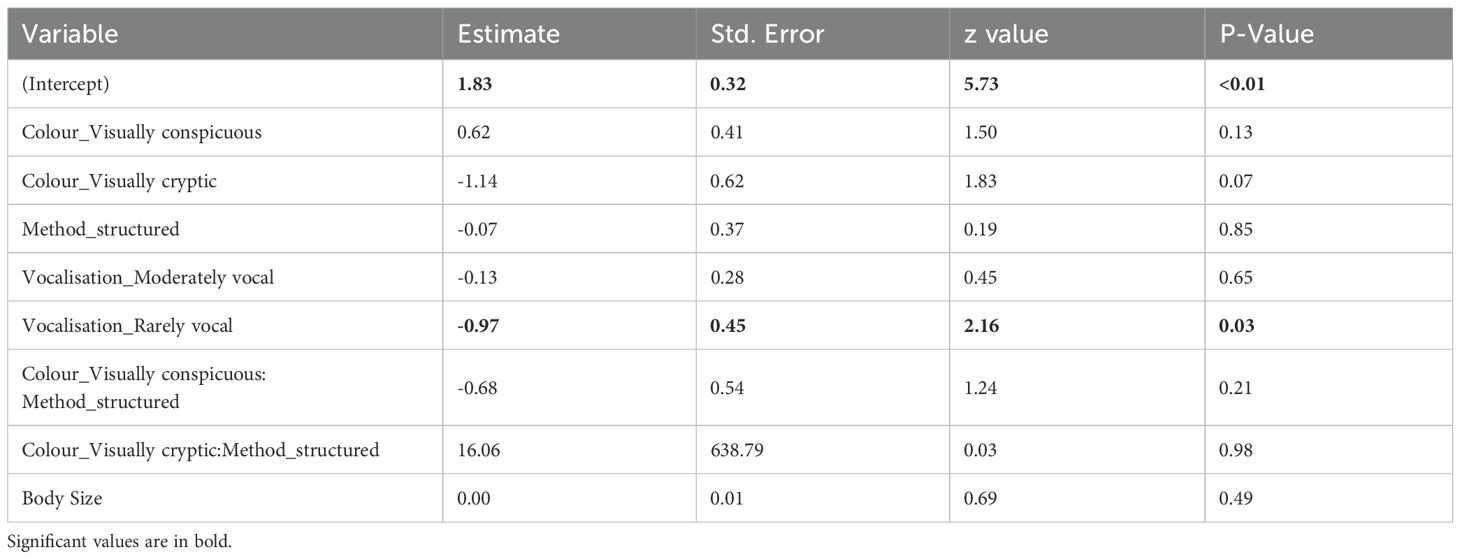
Table 2. Results of the final best model testing detection probability as a function of survey method and species traits.
Discussion
This study compared avian species richness, detection accuracy, and the influence of species traits on detectability between citizen science data from the African BirdMap project and structured scientific survey data gathered from the literature within the Cape Coast Metropolis, Ghana. Our findings show that citizen science data from the African BirdMap can match the performance of structured surveys in capturing local avian richness and detectability, even at a fine spatial scale. This is encouraging for biodiversity monitoring in African contexts where resources for structured surveys are often limited. Although both data sources capture a substantial portion of the avifaunal community, nuanced differences in data quality and species detectability exist.
As hypothesized, citizen science data reported slightly more species than the structured scientific surveys. While structured surveys together reported 208 species and citizen science data captured 215 species, the overlap of 71.3% was substantial, and each method yielded a unique set of species (13.0% and 15.8%, respectively). However, statistical analysis using Pearson’s chi-squared test indicated no significant difference in species richness between the two datasets. These findings support earlier results by Callaghan et al. (2018), who also found that citizen science efforts (in their case, eBird) reported higher richness than structured surveys in urban green spaces. The lack of a significant difference in our study suggests that the full-protocol design of the African BirdMap project provides a higher level of standardization sufficient to approximate structured surveys, even in relatively small geographical areas such as a single pentad. However, it is worth noting that the slight numerical advantage in citizen science data may be due to cumulative sampling over a longer period, diverse observer effort, and greater spatial coverage, even within the same pentad. Nevertheless, the presence of erroneous or out-of-range species within the citizen science dataset highlights the need for caution. Although such records were few (eight in total), their inclusion can skew biodiversity estimates and conservation planning if left unchecked.
Similarly, our second hypothesis was supported. Without accounting for possible misidentifications of species and relying solely on accuracy in terms of extralimital records, the structured survey data showed higher accuracy (99.5%) and a narrower confidence interval (0.97–0.99) compared to the citizen science dataset (96.4% accuracy, CI: 0.93–0.98). These findings emphasize the value of expert-led surveys in generating reliable baseline data, particularly in regions where misidentification risks are high due to species similarity. This suggests that while citizen science data are a valuable supplementary source for broad-scale monitoring, users of these datasets should exercise caution.
The third hypothesis, which posited that detection probabilities would differ between survey types and be influenced by species traits, was also supported. From our best model, species that were highly vocal and moderately conspicuous had higher detection probabilities in both datasets. In contrast, rarely vocal species had significantly lower detection probabilities, confirming the findings of Sólymos et al. (2018), who reported a strong relationship between singing rates and the detection of vocal birds in acoustic surveys. Nee et al. (1991) examined the relationship between body size and population abundance in British birds and found a negative relationship—larger bird species tend to occur at lower population densities than smaller ones. Given that species with larger populations are generally easier to detect, it is not surprising that our study found no significant relationship between body size and detection probability across the two survey methods. This is because larger-bodied birds, despite being more conspicuous individually, are less frequently encountered overall compared to the more abundant small-bodied species. Although there was little difference between the first best model and the second best model, the first model included more ecologically relevant variables than the second, and was therefore selected.
However, our findings should be interpreted in light of certain limitations. First, sampling intensity and spatial coverage were unequal between the two datasets. The structured survey data were compiled from studies with varying objectives, sampling intensity, and temporal coverage, which may have introduced heterogeneity. Similarly, despite filtering for full-protocol lists, citizen science data may still contain variation in observer skill and effort. Second, there is a temporal mismatch between the datasets, with structured surveys and citizen science records spanning different years from 2018 to 2025. This may confound richness and detectability comparisons due to genuine temporal changes in bird communities. In addition, we were unable to determine the full species list of the study area, which limits the ability to identify species potentially missed by both methods. Further studies could explore this gap. Despite these constraints, the consistency in trait–detectability relationships across methods strengthens confidence in citizen science for monitoring.
Within the African continent, studies have demonstrated the validity and contribution of citizen-based bird data in mapping the distribution of bird species at large spatial scales (eg., Nussbaumer et al., 2025; Tende et al., 2024), case-specific instances (eg., Daniel et al., 2024) and species-focused instances (eg., Ong’ondo et al., 2025). Our analysis shows that it is possible to rely on citizen science data from BirdMap at small spatial scales. Site managers can be confident that BirdMap provides comparable, and perhaps even better, biodiversity estimates than structured surveys. Unlike citizen scientists, who typically visit hotspots and often take random birdwatching routes, structured surveys, such as those compared here, usually involve stratification by habitat. However, habitat classifications inevitably omit some low-occurrence or mixed habitats and tend to undersample extensive habitats, thereby missing species. Therefore, where budgets limit professional surveys, citizen science can fill data gaps. Nevertheless, scientists and conservation practitioners must exercise caution when interpreting species richness or distribution based solely on citizen science data. While valuable, such data may overrepresent conspicuous species and underreport habitat specialists or rarities, which could bias conservation priorities if not carefully corrected.
To overcome these limitations, we recommend that platforms like the African BirdMap continue and strengthen their verification processes. National or regional reviewers should routinely screen submitted records, particularly for species with narrow ranges or confusing morphology. Additionally, targeted training for citizen scientists on species identification and survey protocols could improve data quality. We also recommend that future monitoring strategies include hybrid models in which professional surveys target hard-to-detect species or undersampled habitats, while citizen science continues to provide long-term, wide-coverage trend data. Such integration could be particularly valuable for informing local conservation decisions and environmental impact assessments.
Data availability statement
The raw data supporting the conclusions of this article will be made available by the authors, without undue reservation.
Author contributions
JA: Conceptualization, Data curation, Formal Analysis, Writing – original draft. OS: Data curation, Validation, Writing – review & editing. AS: Writing – review & editing.
Funding
The author(s) declare that no financial support was received for the research, and/or publication of this article.
Acknowledgments
We extend our heartfelt thanks to all citizen scientists whose dedication and contributions make the African Bird Atlas possible. A special thanks goes to Opoku Bright and Tamekloe Samuel for sharing with us the data from their study. We are also deeply grateful to the Tropical Biology Association for their enriching workshops and seminars, which equipped us with the skills and knowledge necessary for effective data analysis and interpretation.
Conflict of interest
The authors declare that the research was conducted in the absence of any commercial or financial relationships that could be construed as a potential conflict of interest.
Generative AI statement
The author(s) declare that no Generative AI was used in the creation of this manuscript.
Any alternative text (alt text) provided alongside figures in this article has been generated by Frontiers with the support of artificial intelligence and reasonable efforts have been made to ensure accuracy, including review by the authors wherever possible. If you identify any issues, please contact us.
Publisher’s note
All claims expressed in this article are solely those of the authors and do not necessarily represent those of their affiliated organizations, or those of the publisher, the editors and the reviewers. Any product that may be evaluated in this article, or claim that may be made by its manufacturer, is not guaranteed or endorsed by the publisher.
Supplementary material
The Supplementary Material for this article can be found online at: https://www.frontiersin.org/articles/10.3389/fbirs.2025.1686148/full#supplementary-material
References
Afrifa J. K., Deikumah J. P., and Monney K. A. (2023). Comparative use of artificial structures and natural vegetation by birds in a built-up urban area in Ghana. Avian Conserv. Ecol. 18:6. doi: 10.5751/ACE-02351-180106
Afrifa J. K., Monney K. A., and Deikumah J. P. (2022). Effects of urban land-use types on avifauna assemblage in a rapidly developing urban settlement in Ghana. Urban Ecosyst. 26, 67–79. doi: 10.1007/s11252-022-01281-0
Anderson A. S., Marques T. A., Shoo L. P., and Williams S. E. (2015). Detectability in audio-visual surveys of tropical rainforest birds: the influence of species, weather and habitat characteristics. PLoS One 10, e0128464. doi: 10.1371/journal.pone.0128464
Balestrini M., Kotsev A., Ponti M., and Schade S. (2021). Collaboration matters: capacity building, up-scaling, spreading, and sustainability in citizen-generated data projects. Human Soc. Sci. Commun. 8, 1–15. doi: 10.1057/s41599-021-00851-5
Brooks M., Rose S., Altwegg R., Lee A. T., Nel H., Ottosson U., et al. (2022). The African Bird Atlas Project: a description of the project and BirdMap data-collection protocol. Ostrich 93, 223–232. doi: 10.2989/00306525.2022.2125097
Callaghan C. T., Martin J. M., Major R. E., and Kingsford R. T. (2018). Avian monitoring–comparing structured and unstructured citizen science. Wildlife Res. 45, 176–184. doi: 10.1071/WR17141
Carroll K. A., Farwell L. S., Pidgeon A. M., Razenkova E., Gudex‐Cross D., and Helmers D. P. (2022). Mapping breeding bird species richness at management-relevant resolutions across the United States. Ecol. Appl. 32, e2624. doi: 10.1002/eap.2624
Daniel K., Underhill L., and Van Rooyen J. (2024). Bird atlas in action: using citizen science data to generate population trend alerts in Hessequa, South Africa. Front. Bird Sci. 3, 1214800 doi: 10.3389/fbirs.2024.1214800
Deikumah J. P. and Kudom A. A. (2010). Biodiversity status of urban remnant forests in Cape coast, Ghana. J. Sci. Technol. (Ghana) 30. doi: 10.4314/just.v30i3.64643
Fraisl D., Hager G., Bedessem B., Gold M., Hsing P. Y., and Danielsen F. (2022). Citizen science in environmental and ecological sciences. Nat. Rev. Methods Primers 2, 64. doi: 10.1038/s43586-022-00144-4
Ghana Meteorological Agency (2021). Ghana Meteorological Agency’s Seasonal Forecast for the Northern Sector and Seasonal Forecast Update for Southern Sector of Ghana. Accra, Ghana. Ghana Meteorological Agency.https://www.meteo.gov.gh/documents/5054/2025_FORECAST_FOR_NORTHERN_GHANA.pdf (Accessed October 13, 2025).
GSS, (Ghana Statistical Service) (2021). Ghana 2021 Population and Housing Census Report. Accra, Ghana. Ghana Statistical Service. https://statsghana.gov.gh/gssmain/fileUpload/pressrelease/2021%20PHC%20General%20Report%20Vol%203A_Population%20of%20Regions%20and%20Districts_181121.pdf (Accessed July 20, 2025).
Kéry M. and Schmid H. (2004). Monitoring programs need to take into account imperfect species detectability. Basic Appl. Ecol. 5, 65–73. doi: 10.1078/1439-1791-00194
Lee A. T. K., Ottosson U., Jackson C., Shema S., and Reynolds C. (2021). Urban areas have lower species richness, but maintain functional diversity: insights from the African Bird Atlas Project. Ostrich 92, 1–15. doi: 10.2989/00306525.2021.1902876
Lee A. T. K., Chetty K., and Colyn R. (2024). Reassessing the population and distribution of the Southern Bald Ibis: insights from diverse citizen science data sources. Waterbirds 46, 229–242. doi: 10.1675/063.046.0413
Lee A. T. K. and Hammer S. A. J. (2022). A comparison of migrant and resident bird population changes in South Africa using citizen science data: trends in relation to Northern Hemisphere distribution. Ostrich 93, 160–170. doi: 10.2989/00306525.2022.2145383
Mariyappan M., Rajendran M., Velu S., Johnson A. D., Dinesh G. K., Solaimuthu K., et al. (2023). Ecological role and ecosystem services of birds: a review. Int. J. Environ. Climate Change 13, 76–87. doi: 10.9734/ijecc/2023/v13i61800
Morelli F., Brlík V., Benedetti Y., Bussière R., Moudrá L., Reif J., et al. (2022). Detection rate of bird species and what it depends on: Tips for field surveys. Front. Ecol. Evol. 9, 671492. doi: 10.3389/fevo.2021.671492
Nee S., Read A. F., Greenwood J. J., and Harvey P. H. (1991). The relationship between abundance and body size in British birds. Nature 351, 312–313. doi: 10.1038/351312A0
Nussbaumer R., Nussbaumer A., Guchu S., Hatfield R. S., Kanga E. M., Kung'u G. N., et al. (2025). Historical bird atlas and contemporary citizen science data reveal long-term changes in geographic range of Kenyan birds. Diversity Distribut. 31, e13935. doi: 10.1111/ddi.13935
Ong’ondo F. J., Trevelyan R., Kuria A., Njoroge P., Guchu S., and Jackson C. (2025). Predicting the distribution and abundance of bustards, storks, and harriers in Kenya using citizen science data. Front. Ecol. Evol. 13, 1489795. doi: 10.3389/fevo.2025.1489795
Opoku B. (2018). Bird Assemblages and Vegetation Structre along Urbanization Gradient in Central Region, Ghana. (University of Cape Coast). Available online at: http://hdl.handle.net/123456789/6976(Accessed July 20, 2025).
Quintana I., Willemse S., Daniel K., Hardaker T., and Underhill L. G. (2024). Range expansion of African Red-eyed Bulbul Pycnonotus nigricans in western South Africa. Ostrich 95, 252–262. doi: 10.2989/00306525.2024.2413570
Ringim A. S., Muhammad S. I., Bako L. A., Abubakar H. M., Isa S. M., Nelly D. J., et al. (2022). How citizen scientists are rapidly generating big distribution data: lessons from the Arewa Atlas Team, Nigerian Bird Atlas Project. Ostrich 93, 24–33. doi: 10.2989/00306525.2022.2058105
Sólymos P., Matsuoka S. M., Stralberg D., Barker N. K., and Bayne E. M. (2018). Phylogeny and species traits predict bird detectability. Ecography 41, 1595–1603. doi: 10.1111/ecog.03415
Stuber E. F., Robinson O. J., Bjerre E. R., Otto M. C., Millsap B. A., Zimmerman G. S., et al. (2022). The potential of semi-structured citizen science data as a supplement for conservation decision-making: Validating the performance of eBird against targeted avian monitoring efforts. Biol. Conserv. 270, 109556. doi: 10.1016/j.biocon.2022.109556
Tamekloe S. E., Ansah-Monney K., and Deikumah J. P. (2025). Key environmental predictors as drivers of avifauna assemblages in Ghana’s coastal ecosystems. Discov. Environ. 3, 6. doi: 10.1007/s44274-025-00187-w
Tende T., Iniunam I. A., Ivande S. T., Awoyemi A. G., Danmallam B. A., Ringim A. S., et al. (2024). Citizen science mitigates the lack of distributional data on Nigerian birds. Ecol. Evol. 14, e11280. doi: 10.1002/ece3.11280
Wilson E. B. (1927). Probable inference, the law of succession, and statistical inference. J. Am. Stat. Assoc. 22, 209–212. doi: 10.1080/01621459.1927.10502953
Yarberry W. (2021). “Dplyr,” in CRAN recipes: DPLYR, stringr, lubridate, and regex in R (Apress, Berkeley: Springer), 1–58. doi: 10.1007/978-1-4842-6876-6_1
Keywords: bird monitoring, detection probability, species traits, data accuracy, African Bird Atlas
Citation: Afrifa JK, Segbefia O and Sulemana A (2025) Avifauna richness and detection reliability between structured scientific surveys and citizen science data. Front. Bird Sci. 4:1686148. doi: 10.3389/fbirs.2025.1686148
Received: 14 August 2025; Accepted: 15 October 2025;
Published: 30 October 2025.
Edited by:
Ulf Ottosson, Halmstad University, SwedenReviewed by:
Mário Gabriel Santiago Santos, University of Trás-os-Montes and Alto Douro, PortugalMark F. Hulme, The University of the West Indies St. Augustine, Trinidad and Tobago
Copyright © 2025 Afrifa, Segbefia and Sulemana. This is an open-access article distributed under the terms of the Creative Commons Attribution License (CC BY). The use, distribution or reproduction in other forums is permitted, provided the original author(s) and the copyright owner(s) are credited and that the original publication in this journal is cited, in accordance with accepted academic practice. No use, distribution or reproduction is permitted which does not comply with these terms.
*Correspondence: Joseph Kwasi Afrifa, am9zZXBoLmsuYWZyaWZhQGdtYWlsLmNvbQ==