 Kenji Sudo
 Serina Maehara
 Masahiro Nakaoka
 Masahiko Fujii
- 1Akkeshi Marine Station, Field Science Center for Northern Biosphere, Hokkaido University, Akkeshi, Japan
- 2Graduate School of Environmental Science, Hokkaido University, Sapporo, Japan
- 3Faculty of Environmental Earth Science, Hokkaido University, Sapporo, Japan
Tropicalization characterized by an increase in marine species originating from the tropical waters affects human society in various ways. An increase in toxic harmful species negatively affects fisheries and leisure use, and an increase in herbivorous fish affects fisheries and carbon sink capacity by decreasing seagrass/seaweed beds. On the other hand, an increase in tropical reef fish attracts more tourism. This study aimed to predict future shifts in the distribution of functional groups of tropicalization indicator fish that can affect marine ecosystem services in temperate coastal waters of Japan. We estimated the distribution of harmful fish Aluterus scriptus and Scarus ovifrons, herbivorous fish Kyphosus bigibbus and Siganus fuscescens, and tropical reef fish Amphiprion frenatus and Chaetodon auriga by collecting their distribution data from open databases. Distributions in 2000–2018 and the future (2046–2055 and 2091–2100) under different climate change scenarios (the representative concentration pathways; RCPs) were estimated using a species distribution model. We used environmental variables such as minimum sea surface temperature (SST), depth, slope, coral reef area, and seagrass/seaweed bed area as predictors and carried out future predictions using the future ocean regional projection (FORP) dataset. The minimum SST was the factor most responsible for the estimated distribution patterns for all species. The depth, slope, and seagrass/seaweed bed were also important for some species. The estimated probability of occurrence was high along the Pacific coast, which was affected by the warm Kuroshio Current and Tsushima Current along the coast of the Sea of Japan. Projected shifts in distributions based on different RCP scenarios showed that these indicator species would significantly increase their distribution in the middle to northern parts of Japan (32–37°N). By the 2090s, their habitat range was estimated to increase to 1.2–1.9 times that of 2000-2018 with severe warming (RCP8.5). However, the target species habitat range would not change significantly with stringent mitigation (RCP2.6). Our results suggest that ambitious commitment to reducing CO2 and other greenhouse gas emissions, such as following the Paris Agreement, will alleviate future tropicalization. Moreover, the fine resolution results can also be directly used for planning climate adaptation programs for local decision makers.
Introduction
Temperate coastal waters are becoming warmer as a result of global climate change. The ongoing climate change will affect the global demographics, abundance, distribution, and phenology of many marine species through environmental changes, such as increases in water temperature and ocean acidification (e.g., Orr et al., 2005; Harley et al., 2006; Yara et al., 2012; Poloczanska et al., 2016). Future projections suggest that changes in community composition and local species loss would occur worldwide (e.g., Beaugrand et al., 2015; García Molinos et al., 2016), which can further affect the use of marine resources by humans.
The Japanese archipelago stretches from subtropical to subarctic regions. Temperate marine ecosystems are shifting toward tropical ecosystems as the water temperature increases; for example, the temperature of Japanese waters has increased by 1.16°C for the last 100 years, which is twice the global average of 0.56°C (Japan Meteorological Agency, 2021). Tropicalization characterized by an increase in marine species originating from tropical waters not only changes marine biodiversity and ecosystem structures in temperate regions but also affects the human society in various ways (Vergés et al., 2016; Kumagai et al., 2018; Vergés et al., 2019; Fisheries Agency Japan, 2021). An increase in toxic harmful species negatively affects human health, either by food poisoning or injury during sea bathing. A northern shift of herbivorous fish leads to a decline in the abundance of seagrass/seaweed beds (Vergés et al., 2016; Kumagai et al., 2018; Fisheries Agency Japan, 2021), which in turn negatively affects coastal fisheries and the blue carbon sink capacity (Kamimura and Shoji, 2009; Vergés et al., 2016; Vergés et al., 2019; United Nations Environment Programme, 2020). On the other hand, an increase in tropical reef fish may attract more tourism and provide aquarium trade fish, opportunities for tourism, and education (Vergés et al., 2014; Woodhead et al., 2019). Social interest is increasing not only for climate mitigation but also for adaptation to new societies and economies that will change with climate change. However, our knowledge regarding the future response of marine ecosystem services in Asia to climate change is limited, especially in coastal fish studies (Poloczanska et al., 2016; Vergés et al., 2019; Woodhead et al., 2019). Some previous studies (i.e., studies by Kuwahara et al., 2006; Takao et al., 2015) predicted that there are changes in the distribution of coastal fish in Japan, but the target species were limited.
Species occurrence data, environmental variable data, and future projection models are necessary to estimate the species distributional changes for understanding tropicalization. Studies on marine biodiversity have been facilitated by the development of open-access global databases, such as the Global Biodiversity Information Facility (GBIF; https://www.gbif.org/) and Ocean Biodiversity Information System (OBIS; https://obis.org/). Information on the distribution of marine species in Japanese waters has been collated in the Biological Information System for Marine Life (BISMaL; https://www.godac.jamstec.go.jp/bismal/j/). Using these databases, future changes in species distribution have been predicted by modeling under different climate change scenarios (Beaugrand et al., 2015; García Molinos et al., 2016; Sudo et al., 2020). Recently, species occurrence data have accumulated for coastal areas around Japan. In addition, environmental data and future projection models for coastal regions have been developed with a high accuracy and resolution around Japan (Tsujino et al., 2017; Abe, 2021; Fujii et al., 2021; Nishikawa et al., 2021). Since the development of environmental data and the accumulation of occurrence data, it has become possible to estimate species distributions and project future changes for the coastal areas.
The present study aimed to predict future shifts in the distribution of functional groups of tropicalization indicator fish that can affect marine ecosystem services in temperate coastal waters of Japan. This study also aims to prepare for adaptation measures for human health, fisheries, and leisure use in the context of changing ecosystem services. We first estimated the species distribution of two toxic harmful fish (Aluterus scriptus and Scarus ovifrons), two herbivorous fish (Kyphosus bigibbus and Siganus fuscescens), and two tropical reef fish (Amphiprion frenatus and Chaetodon auriga). We examined which combination of environmental factors affected distribution of these species. Based on the relationships between occurrence and environmental data, we then projected changes in the distribution of each species using a high-resolution projection model for the future ocean environment based on different emission scenarios from representative concentration pathways (RCP2.6 and 8.5).
Methods
Study Sites and Species
The research area of this study was set along the coast of subtropical to temperate regions of Japan between 24.0°N and 41.6°N and 122.9°E and 142.2°E (Figure 1). From the 4,500 fish species that inhabit in Japanese waters (Motomura, 2020), we selected six fish species that represent different ecosystem services to humans and that have sufficient occurrence data (n > 10) for the estimation of recent and future distribution by the maximum entropy model (MaxEnt) (Wisz et al., 2008; Ishihama, 2017). We selected Aluterus scriptus and Scarus ovifrons as toxic harmful fish, Kyphosus bigibbus and Siganus fuscescens as herbivorous fish, and Amphiprion frenatus and Chaetodon auriga as tropical reef fish (Table 1). These toxic harmful fish contain a kind of palytoxin in their internal organs. These species could be mistaken for Stephanolepis cirrhifer and Chlorurus microrhinos because of their similar shapes. Food poisoning can cause death by accidental ingestion, and poisoning has been reported in more than 100 people between 1953 and 2020 (Ministry of Health, Labor and Welfare Japan, 2021). Distributional changes in these species increase the risk in unfamiliar regions (Ministry of Health, Labour and Welfare Japan, 2021; Taniyama et al., 2003). In addition, expanding of herbivorous fish causes barren grounds of seagrass/seaweed beds due to their increased grazing pressure under warm water temperatures (Vergés et al., 2016; Kumagai et al., 2018; Fisheries Agency Japan, 2021). On the other hand, these tropical reef fish are popular for marine leisure and aquarium exhibition purposes.
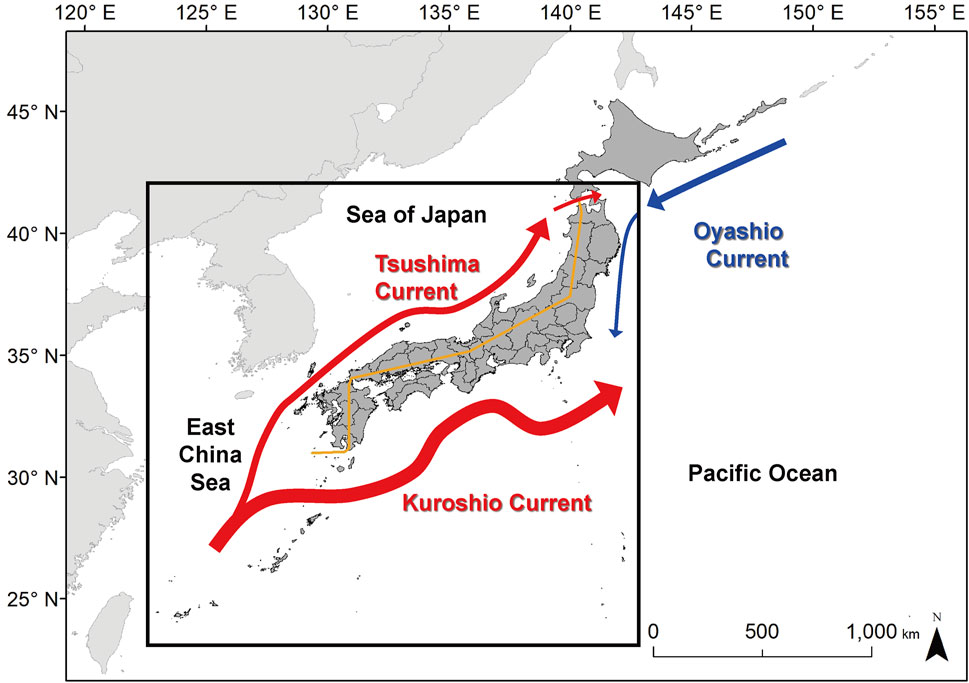
FIGURE 1. Study area (outlined in bold) and major ocean currents around Japan. The warm currents are in red and the cold currents in blue. The ocean current data are based on Nishimura (1981). The orange line divides the coast of the Sea of Japan side and the coast of the Pacific Ocean.
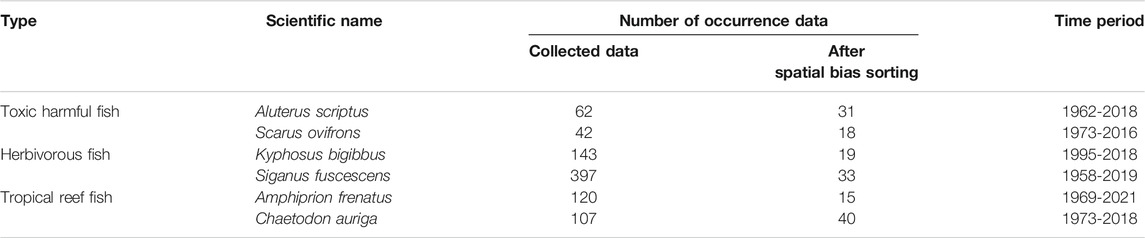
TABLE 1. Fish species analyzed in this study.
Data Collection
The distribution data of six targeted fish species consisted of a total of 871 records collected and stored in open source databases using the GBIF (2021) (https://www.gbif.org), OBIS (2021) (https://obis.org/), BISMaL (https://www.godac.jamstec.go.jp/bismal/j/), Science Museum Net (S-Net; http://science-net.kahaku.go.jp/), and the Fish Image Database (2021) (FishPix; http://fishpix.kahaku.go.jp/fishimage/). For the FishPix data, we obtained the coordinate information with third decimal coordinate accuracy using the site name from the list of diving spots for the sighting information data only with the site name (Marine Planning, 2001; Professional Association of Diving Instructors Diving Spot Information, 2021). We corrected spatial biases to one or two occurrence data per 0.5° grid (Boria et al., 2014; Fourcade et al., 2014). A total of 156 of these data for the six indicator fish species were recorded between 1962 and 2021 (Table 1). We excluded young or juvenile fish occurrence data because of the possibility of abortive migration that appears from summer to autumn and disappears during winter in warm current areas (Shimizu et al., 2009; Booth et al., 2011), although some databases do not provide life stage status. Thus, this dataset includes abortive migration fish due to insufficient life stage data. For quality control of the dataset, we also excluded low accuracy occurrence data because it was lower than the third decimal coordinate accuracy.
Species Distribution Models
Species distribution models (SDMs) identify the relationships between the presence of a species and environmental variables. Many algorithms exist for SDMs, among which MaxEnt is the most commonly used because it is robust against georeferencing errors using presence-only records (Phillips et al., 2006; Graham et al., 2008; Elith et al., 2011). It outperforms most other algorithms, such as generalized linear models, generalized additive models, and random forests, and it is particularly appropriate for marine species (Elith et al., 2006; Ready et al., 2010; Aguirre-Gutiérrez et al., 2013). MaxEnt also performs well in estimating potential range shifts for a species due to climate change (Hijmans and Graham, 2006). Therefore, MaxEnt was selected for this study. All MaxEnt models were run using the default settings (version 3.3.3 k; Phillips et al., 2006) and replicated ten times using cross-validation (Marsland, 2009). The entire data were randomly divided into ten parts: 10% of the data were used for verification, and the remaining 90% were used for learning. All the divided parts were used for verification during the ten runs of the model to evaluate the model results. The model accuracy was examined using the area under the curve (AUC) (Fielding and Bell, 1997), for which values >0.7 are commonly accepted (Swets, 1988; Raes and ter Steege, 2007). Predicted logistic values of each grid were converted to presence/absence values using a ten percentile training presence logistic threshold. This threshold was calculated based on the omission errors, which allow a 10% false presence of the training data. Logistic values lower than this threshold were classified as absence, and higher probabilities were classified as presence (Escalante et al., 2013).
Environmental Dataset for Estimating Species Distribution
We created a database of five environmental variables at 1 km resolution. We chose the following variables: 1) coldest month sea surface temperature (SST), 2) depth, 3) slope, 4) seagrass/seaweed bed area, and 5) coral reef area (Table 2). Cold month sea surface temperature was chosen because cold temperature restricts the distribution range of tropical fish. Depth was used because the variable well explained coral reef fish and temperate reef fish habitat. Slope represents topographic complexity that affects fish habitat preference, and seagrass/seaweed bed area well-explained the occurrence of nearshore temperate reef fishes (Pittman et al., 2007; Young and Carr, 2015; Leriorato et al., 2021). The coral reef area was used as a proxy for tropical reef fish habitat. We set the resolution of all variables to a 1 km grid by interpolation with the inverse distance weighting method (Bartier and Keller, 1996). Among the various seasonal SST data, we used the coldest month water temperature because it has been discussed that the distributional changes of tropical fish are most sensitive to the lowest temperature (Leriorato et al., 2021). This is because an abortive migration of larvae occurs from summer to autumn and disappears in winter due to low temperatures in the warm current area (Nakazono, 2002; Shimizu et al., 2009). The coldest month SST data were obtained from Modis-Terra with an approximately 4-km horizontal resolution and averaged for the period of 2000-2018 to avoid the effect of the Pacific decadal oscillation (Mantua and Hare, 2002). The seafloor structure, such as depth and topography, is one of the important factors to explain a suitable habitat for fish (Pittman et al., 2007; Costa et al., 2014; Young and Carr, 2015). For the depth data, we used Digital Bathymetric M7000 which is the most accurate data around Japan, and averaged depth data in each 1-km grid. We then calculated the slope from the difference in depth and distance between the grid and eight neighbors (Tan θ = difference of depth/distance) using the ESRI ArcGIS Spatial Analyst slope function. The complex structure of coral reefs provides a habitat for many tropical reef fish species. On the other hand, the seaweed and seagrass provide food resources for many fish species. Therefore, occurrence of two target tropical reef fish species and herbivorous fish is likely related to the presence and absence coral reefs and seaweed/seagrass beds. For these reasons, we included the coral reef area and seaweed/seagrass bed area in each 1-km grid as the environmental variables. The coral reef dataset included those in the temperate region along the coast of the Pacific Ocean affected by the warm Kuroshio Current. The seaweed/seagrass dataset was based on satellite image analyses, which evaluates the area of large seaweeds (such as sargassum and kelp) and seagrass.
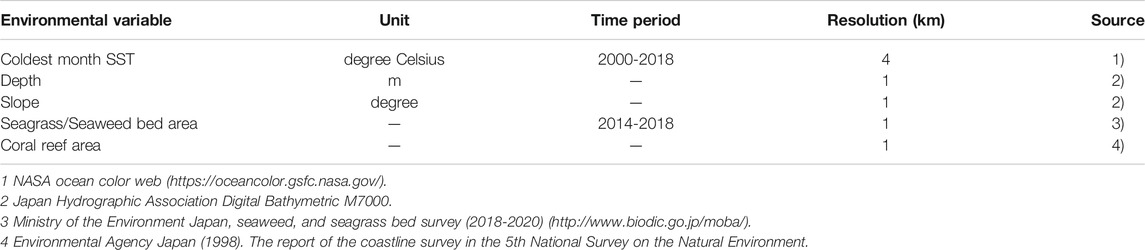
TABLE 2. Environmental variables used for the species distribution model.
Environmental Dataset for Future Projections
The future ocean regional projection (FORP) dataset was produced by high-resolution regional ocean model simulations with ensemble atmospheric forcing from Coupled Model Intercomparison Project phase 5 (CMIP5; Taylor et al., 2012) models and with a future emission scenario based on the representative concentration pathways (RCPs; Moss et al., 2010). These were developed by the Japan Agency for Marine-Earth Science and Technology (JAMSTEC) under the Social Implementation Program on Climate Change Adaptation Technology (SI-CAT) (Nishikawa et al., 2021). The Meteorological Research Institute Community Ocean Model version 4 (MRI.COMv4; Tsujino et al., 2017) was used for the regional ocean models. FORP-JPN02 version2 is a historical and future ocean projection dataset surrounding Japan with a horizontal resolution of approximately 2 km, produced by the dynamical downscaling simulation. This dataset precisely expresses coastal topography and ocean currents to apply to coastal areas. We used the averaged results from four climate models from FORP-JPN02 version2 (GFDL-ESM2M, MRI-CGCM3, MIROC5, and IPSL-CM5A-MR) to improve the performance and decrease the uncertainties of a forecast based on the fundamental assumption that climate model results generally have biases and errors (Tebaldi and Knutti, 2007). We used climate model results for 2046–2055 under RCP8.5 and during 2091-2100 under RCP2.6 and 8.5 simulations to examine the effects of ocean warming on potential habitats. RCP2.6 is the scenario that aims to keep global warming likely below 2°C above pre-industrial temperatures, and RCP8.5 scenario is the worst-case scenario assuming greenhouse gas emissions continue to rise throughout the 21st century (IPCC, 2014). Other RCP simulations have not yet been provided for this dataset. The averaged results from four climate models (for the years 1996-2005) in FORP-JPN02 version2 were 0.91 ± 1.06°C lower than the satellite observation data for 2000-2018. The biases between the observed and the model results were corrected by adding the difference of the model results to the observed climatology using the method of Yara et al. (2011). We added the difference values between the model results from 1996–2005 and 2046–2055 under the RCP8.5 simulations to the satellite observation data of SST and between 1996–2005 and 2091–2100 to the observed SST under the RCP2.6 and RCP8.5 simulations. SST data from 2000–2018 were substituted with RCP climate scenario data for the projection models, and suitability was recalculated using MaxEnt for each species. The shift in the latitudinal distribution of each target fish species was compared between the Pacific coast and the Sea of Japan. The total grid number within each degree of latitude (e.g., 29.00°N to 29.99°N) was calculated by summing the number of grids with a species’ presence. Even though it is not directly influenced by the Kuroshio Current, the coastal area of the East China Sea was classified as the Pacific coast in this study for graphical representation. Water depth, seagrass/seaweed areas, and coral reef areas will change in response to increase in water temperature. Although the sea level is anticipated to rise in accordance with global warming (i.e., Oppenheimer et al., 2019), a precise projection of sea level rise is difficult by using models with a spatial resolution of ∼1 km, as used in this study. Furthermore, to predict precisely the future distribution of coral reefs and seaweed beds, various factors such as water temperature, ocean acidification, the rise in sea level, and wave height, are needed to be considered (Yara et al., 2012; Takao et al., 2015; Morim et al., 2019). Therefore, it is difficult to predict their changes in this study. We, therefore, used the same water depth, seagrass/seaweed, and coral reef area data of the 2000–2018 estimation for future predictions.
Results
Present Species Distribution
The predicted distribution of six fish species in 2000–2018 varied from 4,006 to 16,430 grids in the models (Table 3). Among them, S. ovifrons, C. auriga, and A. frenatus had the same northern limit, ranging from 35°N along the Pacific Ocean coast. In addition, semi-closed seas such as Seto Inland Sea, Ise-Mikawa Bay, and Tokyo Bay were not suitable for these species on the Pacific Ocean side (Figures 2–7, Supplementary Figure S2). A. scriptus had the widest distribution ranging from 38°N, along the Sea of Japan. The second most abundant species K. bigibbus and S. fuscescens were estimated to occur to 36–37°N along the Sea of Japan. On the other hand, A. frenatus, S. ovifrons, and C. auriga were limited to 34°N along the Sea of Japan (Figures 2–7, Supplementary Figure S4).
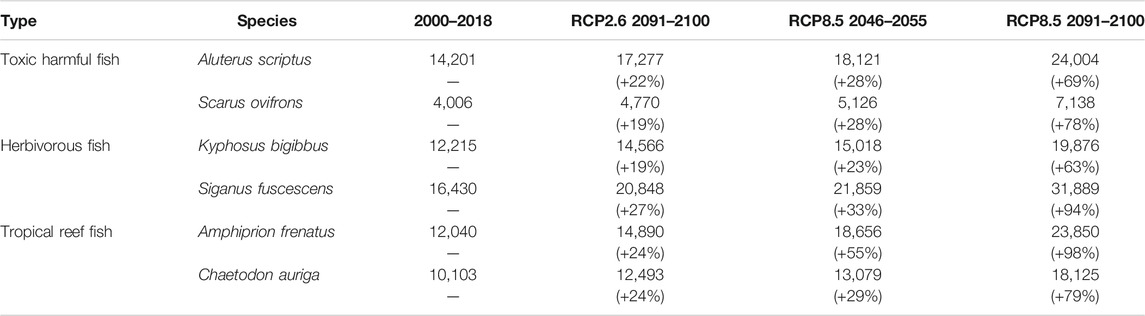
TABLE 3. Predicted number of grids for six fish species based on different climate scenarios. The numerals in the parenthesis indicate percent change from the 2000–2018 estimates.
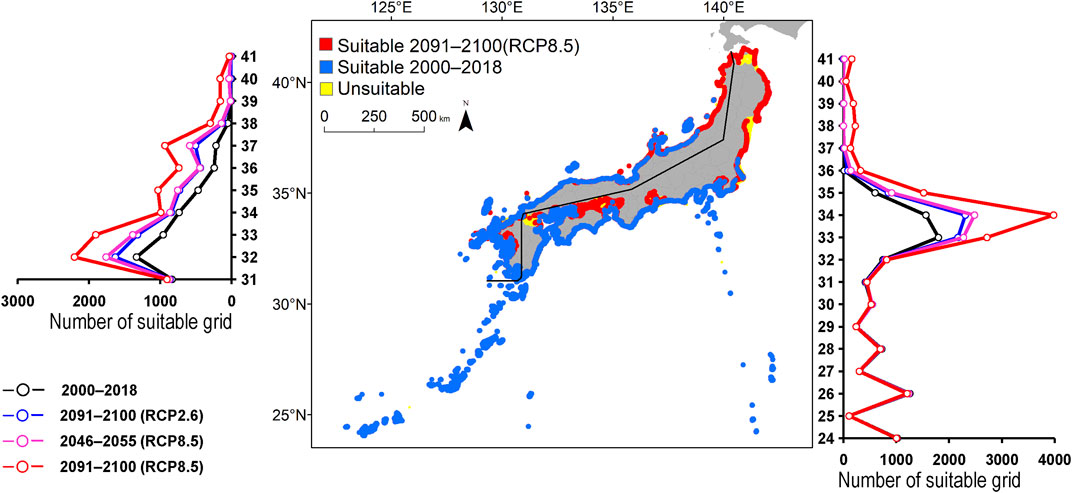
FIGURE 2. Estimated distribution of Aluterus scriptus. The maps show their distribution changes between 2000–2018 and 2091–2100 (for RCP8.5 scenario). The line graphs represent the estimated number of suitable grids by latitude in 2000–2018 (black line) and predicted distribution in 2091–2100 based on the RCP2.6 scenarios (blue line), 2046–2055 (for RCP8.5 scenario; pink line), and 2091-2100 (for RCP8.5 scenario; red line). The left line graph shows the coast of the Sea of Japan, and the right bar graph shows the coast of the Pacific Ocean.
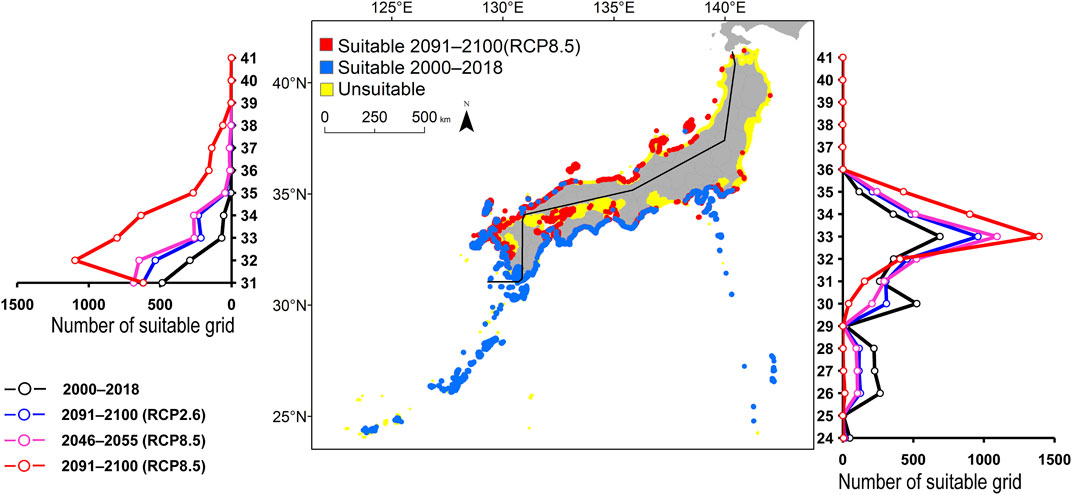
FIGURE 3. Estimated distribution of Scarus ovifrons. See Figure 2 for the explanation.
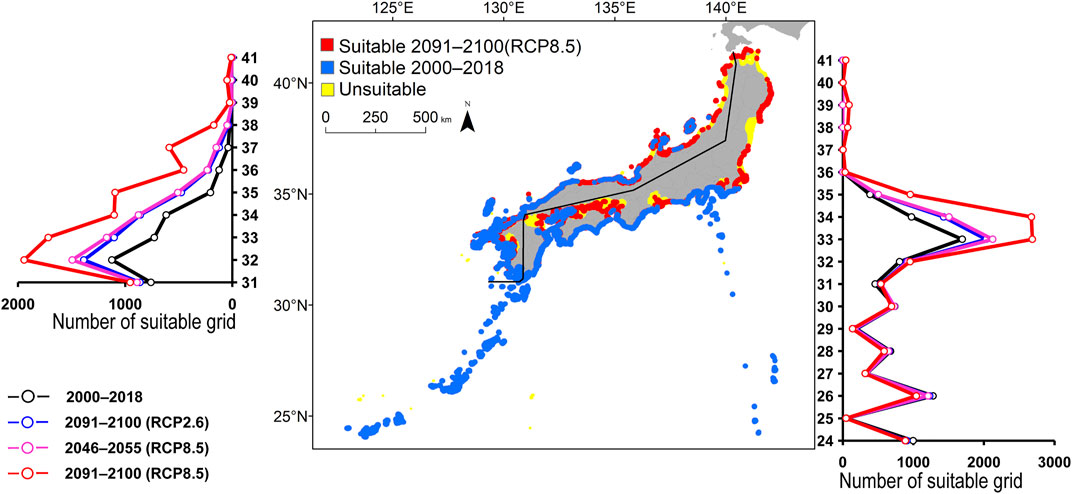
FIGURE 4. Estimated distribution of Kyphosus bigibbus. See Figure 2 for the explanation.

FIGURE 5. Estimated distribution of Siganus fuscescens. See Figure 2 for the explanation.
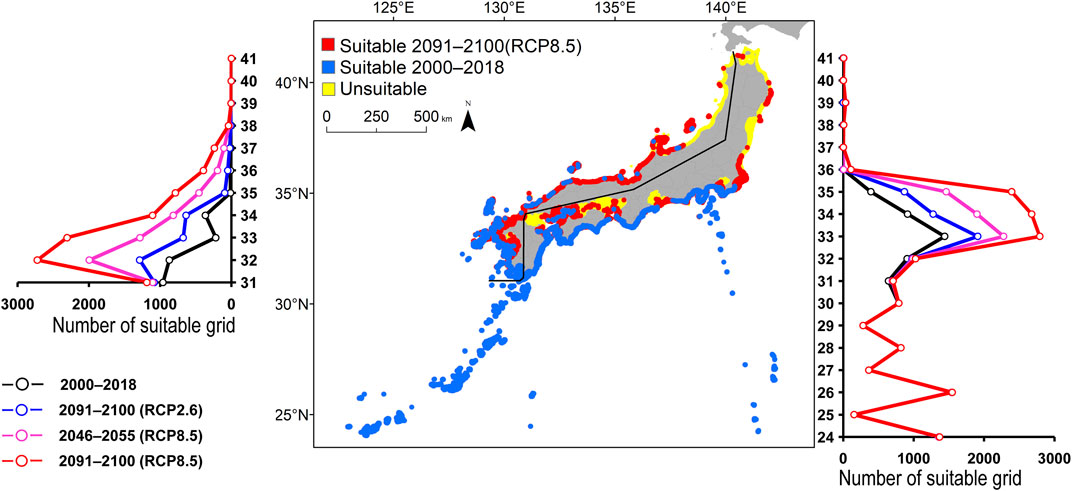
FIGURE 6. Estimated distribution of Amphiprion frenatus. See Figure 2 for the explanation.
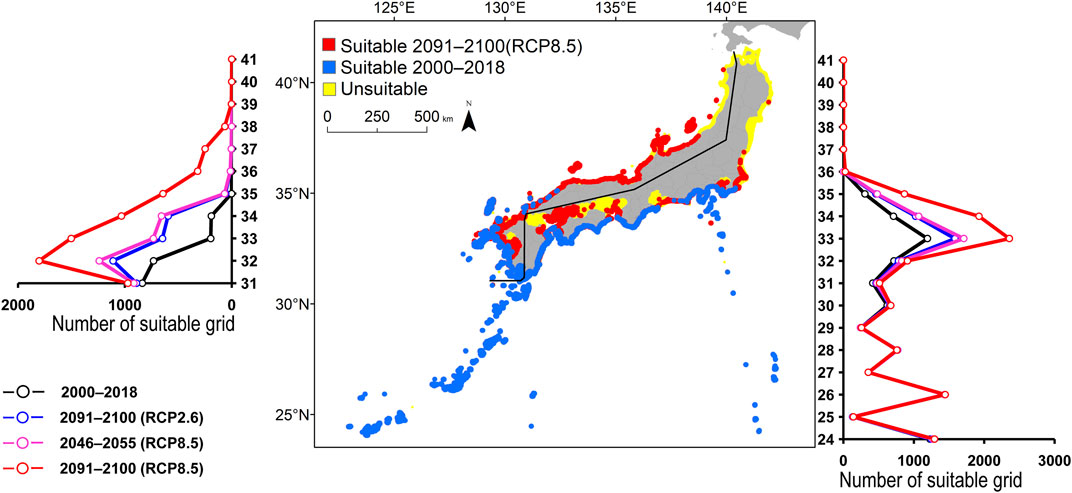
FIGURE 7. Estimated distribution of Chaetodon auriga. See Figure 2 for the explanation.
The distribution of the six fish species was well predicted by the combination of five environmental variables with a mean AUC of 0.82 to 0.93 in the models (Table 4). The SSTs accounted for nearly 50% to more than 80% of the SDMs. In contrast, the slope was the second most influential factor for S. ovifrons and K. bigibbus. Depth was the second most influential factor for A. scriptus and S. fuscescens that inhabit shallower depths. Seagrass/seaweed beds contributed 7–8% of the estimated distribution for S. ovifrons and S. fuscescens.

TABLE 4. Contribution (%) of each environmental variable and the area under the curve (AUC) of the species distribution models for six fish species.
Future Projections
All species were predicted to expand in distribution under the two different future carbon emission scenarios (Table 3). The model with RCP8.5 by the 2091–2100 forecasted wide expansion to northeastwards (Figures 2–7, Supplementary Figure S4). The predicted expansion differed between the Pacific coast and the Sea of Japan.
All species were predicted to expand in distribution under the two different future carbon emission scenarios (Table 3). The model with RCP8.5 2091–2100 forecasted wide expansion to northeastwards (Figures 2–7, Supplementary Figure S4). The predicted expansion was different between the Pacific coast and the Sea of Japan.
The predictions showed significant differences in the northern shift among species on the Pacific Ocean side. For C. auriga, A. frenatus, and S. ovifrons, the model RCP2.6 and 8.5 predicted a slight northern shift along the coast of the Pacific Ocean by 2091–2100. Similarly, for A. scriptus, K. bigibbus, and S. fuscescens, the model RCP2.6 predicted a slight northern shift along the coast of the Pacific Ocean by 2091-2100, and the model RCP8.5, by 2046–2055. In contrast, the model RCP8.5 predicted a 500–600 km northern shift along the coast by 2091–2100 (Figures 2–7, Supplementary Figure S4).
Some species were predicted to expand in semi-closed seas located on the Pacific Ocean side (Supplementary Figure S2). For S. fuscescens, the model RCP8.5 was predicted to expand to Seto Inland Sea, Ise–Mikawa Bay, and Tokyo Bay by 2091–2100. In contrast, for A. scriptus, K. bigibbus, A. frenatus, and C. auriga the model RCP8.5 predicted to expand to only Seto-Inland Sea by 2091–2100. In contrast, for S. ovifrons, the model predicted expansion only along the coast of the Pacific Ocean.
The predictions showed significant differences in the northern shift in the Sea of Japan compared to the Pacific Ocean. For all the target species, the model RCP2.6 predicted a 100–300 km shift north by 2091–2100 along the coast of the Sea of Japan, and also the model RCP8.5, by 2046–2055. However, the model RCP8.5 predicted 200–400 km by 2091–2100. Among the six species, only a 100–200 km shift north was predicted for A. frenatus for both RCP2.6 and 8.5 scenarios by 2091–2100.
Discussion
This study demonstrated that six fish species that indicate different aspects of marine ecosystem services will shift northward with ongoing tropicalization of the Japanese coast. The future prediction model, constructed using a fine-resolution environmental dataset and ocean modeling, revealed large differences in the speed of northern shift among species and between the two major coastal waters of Japan. The results indicate that various human activities along the Japanese coasts, such as fisheries and leisure use, and human health can be greatly affected by the distributional shift of these fish either negatively or positively if proper mitigation measures against climate change are not conducted. This suggests a need to establish adaptation plans for tropicalization by local governments and communities.
Factors Affecting Species Distribution
The coldest month SSTs were selected as key environmental factors for the models in our study, which agrees with previous studies on S. fuscescens distributional change in Japan (Takao et al., 2015). Water temperature is an important environmental factor for ectotherms. Body temperature is affected by environmental water temperature in most fish species and controls the survival, feeding, growth, reproduction, and geographical distribution of organisms (Angilletta et al., 2006). Physiologically, fish survive in a particular temperature range, and natural geographical distribution is related to minimum water temperature (O'Connor et al., 2007; Payne et al., 2016). An increase in the water temperature affects the starvation risk associated with a high metabolic rate (Houde, 1989; Munday et al., 2012). Food consumption of K. bigibbus was the highest at 30°C, declined to less than 16°C, and stopped at less than 12°C in the aquarium experiment (Noda et al., 2016). The feeding activity of S. fuscescens becomes most active at 26–29°C, decreases at temperatures lower than 20°C, and stops at < 15°C (Fisheries Agency Japan, 2021). In addition, A. scriptus survives at temperatures higher than 14°C (Tanase et al., 1992), and C. auriga survives at 15–33°C (Tsuchida et al., 2018). It is likely that the distribution of fish studied here is mostly sensitive to changes in temperature with the ongoing climate change.
Seafloor structures, such as depth and topography, are important factors in explaining suitable habitats for many fish species (Pittman et al., 2007; Costa et al., 2014; Young and Carr, 2015). In this study, depth and slope contributed to the model results and correlated with the lower depth and steeper slope for the target species (Supplementary Figure S3). Adults of A. scriptus are seen along deep coastal slopes or outer reef drop-offs at a depth of around 20 m, and they are usually captured between 3 and 20 m (Kuiter and Tonozuka, 2001; Luiz Jr et al., 2008; Izzo et al., 2010). Their habitat preference was consistent with depth and slope contribution of the model. Some fish change their habitat in a day because of feeding and hiding. For example, S. ovifrons spends most of their time in shallow water lower than 10 m in the daytime. However, S. ovifrons sleeps at 10–15 m during nighttime (Gomi et al., 2021). Biotelemetry attached to K. bigibbus showed that the most time was spent at a depth of 10–15 m near the seafloor with migration to shallow water to search for seaweeds in western Japan (Yamaguchi et al., 2006). These behaviors show a habitat preference for steep-slope along rocky shores.
Coral reefs provide habitats for tropical reef fish. Thus, we hypothesized that coral reefs contribute to these models especially for A. frenatus and C. auriga. However, coral reef contributions were regarded to be low for all species by the models. Coral reef fish can survive not only in coral reefs but also in rocky reefs, given the availability of food resources. C. auriga feeds on benthic invertebrates, and A. frenatus inhabits specific anemones and does not inhabit corals (Hattori, 2011; Nakamura et al., 2013).
The presence of seagrass/seaweed was selected as an important factor for S. ovifrons and S. fuscescens, which have different food preferences. Scarus ovifrons is a scraper that feeds on small epiphytic algae on rocky substrata and dead corals (Steneck et al., 2017; Gomi et al., 2021). The contribution of seagrass/seaweed beds to the S. ovifrons model can be attributed to the fact that the macroalgae vegetate on rocky reefs and the rocky reefs form the habitats of S. ovifrons. In contrast, S. fuscescens is a browser that prefers to graze seaweeds and seagrasses (Noda et al., 2011). For these species, the seagrass/seaweed was positively correlated with the probability of occurrence. In contrast, the seagrass/seaweed did not contribute to K. bigibbus, the main diet of which is seaweed. This species was not found in seaweed beds during the daytime. However, their groups were found around structures such as breakwaters and rocky areas (Kadota et al., 2017). Their specific behavior can cause low contribution of seaweed beds for this species.
The high contribution of minimum water temperature for all the target species was caused by the wide range of evaluations stretching from the southern to northern part of Japan. Additionally, the depth and slope were contributing factors for all the species because none of them were found in tidal flats, gentle slopes, and deep waters. However, these results may have sampling bias because some areas, such as steep slope or deep water, are difficult to survey. For a more strict evaluation, data on true-absence of the species in those areas need to be collected.
The AUC is the probability that a randomly chosen datum of presence is ranked above a datum of pseudo-absence chosen randomly from the study area (Phillips et al., 2006). Basically, modeling on the basis of presence only renders evaluation of the model accuracy difficulty, owing to the lack of true-absence data. Machine learning models based on presence only tend to overfit the model accuracy (Warren and Seifert, 2011; Merow et al., 2013). The model results include accidental noise in the occurrence data, which decreases the generality of the model results and its predictive ability (Wenger and Olden, 2012). If there is a sufficient amount of less-biased occurrence data, it would be possible to reduce the overfit by using the different dataset for the evaluation. Moreover, low-resolution environmental variables also tend to show high accuracy because the relationship between occurrence data and environmental variables becomes unclear owing to the averaged data in a large grid (Randin et al., 2009). Although a 1-km resolution is high for large-scale modeling, this study has a possibility of overestimating the AUC.
Future Projections
Ongoing water temperature rise with global climate change is predicted to shift fish distributions toward higher latitudes, as revealed in this study and others (Takao et al., 2015; García Molinos et al., 2016). In fact, shifts in the global distribution of fish species have already been observed in the past (Nakamura et al., 2013; Vergés et al., 2014; Wernberg et al., 2016; Kumagai et al., 2018). These fish have overcome abortive migration and will expand their distributional range according to future increases in water temperature.
The expansion of the distributional range was different between the Pacific Ocean and the Sea of Japan side. This difference can explain in relation to ocean current systems around Japan. The indicator fish species can expand the distribution range on the Pacific Ocean side, which is influenced by a warm Kuroshio Current (Figure 1). However, the distribution shift further north was limited due to the Oyashio Current that flows from the northeast to the southwest, meeting Kuroshio at around 35–36°N. In contrast, tropicalization expands to higher latitudes in the Sea of Japan side influenced by the Tsushima Current, which diverges from the Kuroshio Current around 30°N and flows along the coast up to 40°N or a higher latitude. Kumagai et al. (2018) also provided evidence of the interaction between water temperature increase and ocean currents for the dispersal of marine organisms using the 60-year records in this region. Although we attempted to minimize the biases and errors by using the ensemble model, the results of future projection models still include uncertainty. The relative increase in water temperature of the ensemble model for the years 2091-2100 was 1.2 ± 0.4°C for RCP2.6 and 3.6 ± 0.8°C for RCP8.5 (Supplementary Table S1).
Future projections of S. fuscescens were different from a previous study by Takao et al. (2015) who predicted a narrower expansion along the coast of the Sea of Japan by 2100 using similar scenarios. This discrepancy is ascribed to the use of different ocean models for forecasting future ocean conditions and the use of SST in different seasons. Because our study used higher resolution ocean model outputs (FORP-JPN02 version2) which also includes information on ocean current and topography and because we used the coldest water temperature which is more critical for determining the northern limit of tropical fish distribution, the results of our study provide a more realistic prediction of future shifts in the indicator fish species with multiple climate scenarios.
The models with RCP8.5 by the years 2091-2100 predict that there will be an expansion to semi-closed seas such as Seto Inland Sea, Ise-Mikawa Bay, and Tokyo Bay that are not directly affected by warm currents. Water temperature of these seas will increase at a slower rate than that in the coastal areas. Water temperature greatly contributed to the model for S. fuscescens which is widely distributed because of its tolerance to low temperatures (Figure 5, Supplementary Figure S1–2, Supplementary Figure S2, Supplementary Figure S3–2). Thus, tolerance to low temperatures is one of the factors for the expansion of S. fuscescens to semi-closed seas. Architects, Regional Planners and Associates et al. (2019) reported future predictions for S. fuscescens in the Seto Inland Sea. This report expanded the area of species range shifts by 90–100% by 2100 using the MRI-CGCM climate model (RCP8.5). The report applied 10.4–11.1°C as a lower limiting water temperature threshold which estimated survival of S. fuscescens in aquarium conditions (Ueta and Tanada, 2018, Supplementary Figure S1). Their study evaluated only the use of SST and applied the harshest threshold. There was natural population dispersal northward to cooler waters from breeding population in the south. These dispersal individuals have difficulty surviving in the winter due to low temperature (Lenanton et al., 2017). But in the summer, they overgraze the seagrass/seaweed. Thus, physiological performance in the aquarium often did not explain well the distribution of species in nature (Payne et al., 2016). Because of these reasons, the range shift was largely different from our model results.
The barren ground sites that were caused by herbivorous fish shifted northward from the 1970s to the 2000s and changed coastal ecosystem services in the western part of Japan (Kumagai et al., 2018). In addition, increases in water temperature enable these fish activities throughout the year and affect coastal ecosystem services. Suitable habitats for coral reefs and tropical seaweed/seagrass beds may also shift northward in the future. However, temperate seaweed species disappear as the water temperature rises (Yara et al., 2011; Tanaka et al., 2012; Takao et al., 2015). However, the dispersal velocity of algae is slow compared to that of other taxa (Poloczanska et al., 2013). If the northern shift velocity is faster than the dispersal velocity, it may cause the disappearance of suitable habitats.
Impacts of Tropicalization on Coastal Ecosystem Services
We only evaluated six fish species (two for each of the three functional groups) as indicators due to the limitations of collecting adequate occurrence data. More fish in the same functional groups occur in the same distributional range, for example, Pterois lunulata and Hapalochlaena fasciata as toxic harmful species, Calotomus japonicus and Prionurus scalprum as herbivorous fish, and Chrysiptera cyanea and Nemateleotris magnifica as coral reef fish that are attractive to the tourists. These species are also expected to expand their distributional range northward, similar to our indicator species, affecting various ecosystem services for the human society. A precise prediction of future forecasts of these indicator species, derived from this study, is thus useful for preparing adaptation measures against changes in ecosystem services due to distributional changes of fish.
The region predicted as the suitable habitat for toxic harmful fish in the future would experience more cases of human food poisoning caused by consuming these fish and more injuries by accidental contact during marine leisure. To decrease such incidents, local governments may need to raise public awareness with fishers to prevent these species from being sold in the marketplace and with managers of beach and sea bathers to avoid these toxic fish that were previously unknown on their beaches. To mitigate the expansion of herbivorous fish, local governments and fishery communities in the western regions of Japan need to prepare for the effective protection of seagrass/seaweed beds. Currently, effective methods to remove these detrimental herbivorous fish species are not well developed. However, some efforts such as the exclusion of fish by setting bait cages in seagrass/seaweed beds and selective harvesting of these fish may be considered as management measures. Extraction from fisheries catch and promotion of the consumption of these detrimental herbivorous fish in the marketplace can reduce their population and negative effects (Fisheries Agency Japan, 2021). Suitable site selection for seaweed aquaculture can assist local fisheries (Liu et al., 2013). On the other hand, an increase in the abundance and species richness of tropical reef fish may attract tourism, such as snorkeling and scuba diving, which can benefit local economies. In addition, the monetary value of fisheries production and the species richness of aquarium fish may increase in the temperate regions in the future, and ecosystem services from the reef fish may change (Biodiversity Center of Japan, 2015; Sato et al., 2021). Changes in the distribution of coral-dependent tropical fishes, such as obligate coral dwellers and corallivores, cannot be estimated using this model. This is because changes in the coral reef distribution were not considered in this model. Therefore, the estimated changes in the distribution of the two tropical fish species do not indicate changes in the future distribution of all coral reef fishes.
Conclusion
In this study, we projected future shifts in the distribution of functional groups of indicator species of fish that can either negatively or positively affect marine ecosystem services of the temperate coastal waters of Japan. We estimated the distribution of harmful fish, herbivorous fish, and tropical reef fish in 2000-2018 and the future (2046-2055 and 2091-2100) under different climate scenarios. The estimated probability of occurrence was high along the Pacific coast, which was affected by the Kuroshio Current and Tsushima Current along the coast of the Sea of Japan. Projected shifts in distributions based on different RCP scenarios showed that target species would significantly increase their distribution toward the northern part of Japan. By the 2090s, the overall habitat range was estimated to increase to 1.2–1.9 times that of 2000–2018 with severe warming (RCP8.5), while the habitat range shift could be alleviated notably if we limit anthropogenic greenhouse gas emissions following the Paris Agreement (RCP2.6). The fine-resolution model used in this study provides realistic future forecasts of different indicator species, which could be useful for local decision makers to plan adaptation programs against disservices expected by the increase of harmful fish, herbivorous fish, and toward better use of services that will be positively affected by increases in useful fish.
Data Availability Statement
Publicly available datasets were analyzed in this study. This data can be found here: GBIF (https://www.gbif.org), OBIS (https://obis.org/), BISMaL (https://www.godac.jamstec.go.jp/bismal/j/), Science Museum Net (S-Net; http://science-net.kahaku.go.jp/), and the fish image database FishPix(http://fishpix.kahaku.go.jp/fishimage/).
Ethics Statement
Ethical review and approval was not required for the animal study because we used the observed data from databases.
Author Contributions
All authors contributed to the manuscript. SM and MF contributed to the study conception and design.
Funding
This study was supported by the Integrated Research Program for Advancing Climate Models (TOUGOU) Grant Number JPMXD0717935498 from the Ministry of Education, Culture, Sports, Science, and Technology (MEXT), Japan; The Japan Society for the Promotion of Science (JSPS) KAKENHI Grant Number JP 16H01792: Environment Research and Technology Development Funds by Environmental Restoration and Conservation Agency, Japan (S-15: Predicting and Assessing Natural Capital and Ecosystem Services); Hokkaido University Functional Enhancement Project; Agriculture, Forestry and Fisheries Research Council, Development of Blue Carbon Evaluation Method and Efficient Seaweed/Seagrass Bed Formation and Expansion Technology (JPJ008722). This study utilized the dataset “Future Ocean Regional Projection” (FORP), which was produced by the Japan Agency for Marine-Science and Technology (JAMSTEC) under the “SI-CAT” project (Grant Number: JPMXD0715667163) of the Ministry of Education, Culture, Sports, Science and Technology, Japan.
Conflict of Interest
The authors declare that the research was conducted in the absence of any commercial or financial relationships that could be construed as a potential conflict of interest.
Publisher’s Note
All claims expressed in this article are solely those of the authors and do not necessarily represent those of their affiliated organizations, or those of the publisher, the editors, and the reviewers. Any product that may be evaluated in this article, or claim that may be made by its manufacturer, is not guaranteed or endorsed by the publisher.
Acknowledgments
We thank Dr. Takehisa Yamakita, Dr. Hiroya Yamano, and Dr. Shintaro Takao for their practical and useful comments. We also thank Dr. T. E. Angela L. Quiros for editing a draft of this manuscript. This study utilized the dataset “Future Ocean Regional Projection” (FORP), which was produced by the Japan Agency for Marine-Science and Technology (JAMSTEC) under the “SI-CAT” project (Grant Number: JPMXD0715667163) of the Ministry of Education, Culture, Sports, Science and Technology, Japan. In this study, FORP-JPN02 version2 provided by JAMSTEC was utilized. This dataset was also collected and provided under the Data Integration and Analysis System (DIAS), which was developed and operated by a project supported by the Ministry of Education, Culture, Sports, Science and Technology. We appreciate two reviewers’ valuable comments to improve this manuscript.
Supplementary Material
The Supplementary Material for this article can be found online at: https://www.frontiersin.org/articles/10.3389/fbuil.2021.788700/full#supplementary-material
References
Abe, H. (2021). Climate Warming Promotes Pacific Oyster (Magallana Gigas) Production in a Subarctic Lagoon and bay, Japan: Projection of Future Trends Using a Three Dimensional Physical-Ecosystem Coupled Model. Reg. Stud. Mar. Sci. 47, 101968. doi:10.1016/j.rsma.2021.101968
Aguirre-Gutiérrez, J., Carvalheiro, L. G., Polce, C., van Loon, E. E., Raes, N., Reemer, M., et al. (2013). Fit-for-Purpose: Species Distribution Model Performance Depends on Evaluation Criteria - Dutch Hoverflies as a Case Study. PloS ONE 8 (5), e63708. doi:10.1371/journal.pone.0063708
Angilletta Jr., M. J., Bennett, A. F., Guderley, H., Navas, C. A., Seebacher, F., and Wilson, R. S. (2006). Coadaptation: a Unifying Principle in Evolutionary thermal Biology. Physiol. Biochem. Zool. 79 (2), 282–294. doi:10.1086/499990
Architects, Regional Planners and AssociatesHiroshima UniversityJapan Weather Association (2019). Report on Local Climate Change Adaptation Consortium Chugoku-Shikoku Region. In Japanese. Available at: https://adaptation-platform.nies.go.jp/conso/report/5-3.html (Accessed September 27, 2021).
Bartier, P. M., and Keller, C. P. (1996). Multivariate Interpolation to Incorporate Thematic Surface Data Using Inverse Distance Weighting (IDW). Comput. Geosci. 22 (7), 795–799. doi:10.1016/0098-3004(96)00021-0
Beaugrand, G., Edwards, M., Raybaud, V., Goberville, E., and Kirby, R. R. (2015). Future Vulnerability of marine Biodiversity Compared with Contemporary and Past Changes. Nat. Clim. Change 5 (7), 695–701. doi:10.1038/nclimate2650
Biodiversity Center of Japan (2015). Monitoring Sites 1000 Coral Reef Survey 2008-. In Japanese. Available at: http://www.biodic.go.jp/moni1000/findings/reports/pdf/h20-h24_coral_reefs.pdf (Accessed September 27, 2021).
Booth, D. J., Bond, N., and Macreadie, P. (2011). Detecting Range Shifts Among Australian Fishes in Response to Climate Change. Mar. Freshw. Res. 62 (9), 1027–1042. doi:10.1071/mf10270
Boria, R. A., Olson, L. E., Goodman, S. M., and Anderson, R. P. (2014). Spatial Filtering to Reduce Sampling Bias Can Improve the Performance of Ecological Niche Models. Ecol. Model. 275, 73–77. doi:10.1016/j.ecolmodel.2013.12.012
Costa, B., Taylor, J. C., Kracker, L., Battista, T., and Pittman, S. (2014). Mapping Reef Fish and the Seascape: Using Acoustics and Spatial Modeling to Guide Coastal Management. PloS one 9 (1), e85555. doi:10.1371/journal.pone.0085555
Elith, J., Graham, C., Anderson, R. P., Dudík, M., Ferrier, S., Guisan, A., et al. (2006). Novel Methods Improve Prediction of Species' Distributions from Occurrence Data. Ecography 29 (2), 129–151. doi:10.1111/j.2006.0906-7590.04596.x
Elith, J., Phillips, S. J., Hastie, T., Dudík, M., Chee, Y. E., and Yates, C. J. (2011). A Statistical Explanation of MaxEnt for Ecologists. Divers. Distributions 17 (1), 43–57. doi:10.1111/j.1472-4642.2010.00725.x
Escalante, T., Rodríguez-Tapia, G., Linaje, M., Illoldi-Rangel, P., and González-López, R. (2013). Identification of Areas of Endemism from Species Distribution Models: Threshold Selection and Nearctic Mammals. Tip 16 (1), 5–17. doi:10.1016/s1405-888x(13)72073-4
Fielding, A. H., and Bell, J. F. (1997). A Review of Methods for the Assessment of Prediction Errors in Conservation Presence/absence Models. Envir. Conserv. 24 (1), 38–49. doi:10.1017/S0376892997000088
Fisheries Agency Japan (2021). Guide Line for Countermeasures for Rocky-Shore Denudation 3th Edition. in Japanese. Available at: https://www.jfa.maff.go.jp/j/gyoko_gyozyo/g_gideline/ (Accessed September 27, 2021).
Fish Image Database (2021). FishPix. Available at: http://fishpix.kahaku.go.jp/fishimage/ (Accessed September 2, 2021).
Fourcade, Y., Engler, J. O., Rödder, D., and Secondi, J. (2014). Mapping Species Distributions with MAXENT Using a Geographically Biased Sample of Presence Data: A Performance Assessment of Methods for Correcting Sampling Bias. PLoS One 9, e97122. doi:10.1371/journal.pone.0097122
Fujii, M., Takao, S., Yamaka, T., Akamatsu, T., Fujita, Y., Wakita, M., et al. (2021). Continuous Monitoring and Future Projection of Ocean Warming, Acidification, and Deoxygenation on the Subarctic Coast of Hokkaido, Japan. Front. Mar. Sci. 8, 590020. doi:10.3389/fmars.2021.590020
García Molinos, J., Halpern, B. S., Schoeman, D. S., Brown, C. J., Kiessling, W., Moore, P. J., et al. (2016). Climate Velocity and the Future Global Redistribution of marine Biodiversity. Nat. Clim Change 6 (1), 83–88. doi:10.1038/nclimate2769
GBIF (2021). Global Biodiversity Information Facility. Available at: https://www.gbif.org (Accessed June 22, 2021).
Gomi, K., Nakamura, Y., Kanda, M., Honda, K., Nakaoka, M., Honma, C., et al. (2021). Diel Vertical Movements and Feeding Behaviour of Blue Humphead Parrotfish Scarus Ovifrons in a Temperate Reef of Japan. J. Fish. Biol. 99, 131. doi:10.1111/jfb.14704
Graham, C. H., Elith, J., Hijmans, R. J., Guisan, A., Townsend Peterson, A., Loiselle, B. A., et al. (2008). The Influence of Spatial Errors in Species Occurrence Data Used in Distribution Models. J. Appl. Ecol. 45 (1), 239–247. doi:10.1111/j.1365-2664.2007.01408.x
Harley, C. D. G., Randall Hughes, A., Hultgren, K. M., Miner, B. G., Sorte, C. J. B., Thornber, C. S., et al. (2006). The Impacts of Climate Change in Coastal marine Systems. Ecol. Lett. 9 (2), 228–241. doi:10.1111/j.1461-0248.2005.00871.x
Hattori, A. (2011). Diversity of Symbiotic Relationship between Host Sea Anemone and Anemonefish: an Ecological Review of Their Distributions and Combinations. Nihon Sangosho Gakkaishi 13 (1), 1–27. doi:10.3755/jcrs.13.1
Hijmans, R. J., and Graham, C. H. (2006). The Ability of Climate Envelope Models to Predict the Effect of Climate Change on Species Distributions. Glob. Change Biol. 12 (12), 2272–2281. doi:10.1111/j.1365-2486.2006.01256.x
Houde, E. D. (1989). Comparative Growth, Mortality, and Energetics of marine Fish Larvae: Temperature and Implied Latitudinal Effects. Fish. Bull. 87 (3), 471–495.
Ishihama, F. (2017). Techniques for Presence-Only Species Distribution Modelling. Jpn. J. Conservation Ecol. 22, 21–40. doi:10.18960/hozen.22.1_21
Izzo, P., Milessi, A., Ortega, L., and Marley, A. (2010). A First record of Aluterus scriptus (Monacanthidae) in Mar del Plata, Argentina. Mar. Biodivers 1, 1–3. doi:10.1017/S1755267210000369
Japan Meteorological Agency (2021). Available at: https://www.data.jma.go.jp/gmd/kaiyou/data/shindan/a_1/japan_warm/japan_warm.html (Accessed September 27, 2021).
Kadota, T., Kiyomoto, S., Fukuda, H., and Yoshimura, T. (2017). Temporal Patterns of Aggregation Formation Around Wave-Dissipating Blocks in the Grey Sea Chub Kyphosus bigibbus. Nsugaf 83, 74–76. doi:10.2331/suisan.16-00035
Kamimura, Y., and Shoji, J. (2009). Seasonal Changes in the Fish Assemblage in a Mixed Vegetation Area of Seagrass and Macroalgae in the central Seto Inland Sea. Aquacult. Sci. 57 (2), 233–241. doi:10.11233/aquaculturesci.57.233
Kuiter, R. H., and Tonozuka, T. (2001). Pictorial Guide to Indonesian Reef Fishes. Part 3. Jawfishes - Sunfishes, Opistognathidae - Molidae. Zoonetics, Australia: Seaford, Vic., 623–893.
Kumagai, N. H., García Molinos, J., Yamano, H., Takao, S., Fujii, M., and Yamanaka, Y. (2018). Ocean Currents and Herbivory Drive Macroalgae-To-Coral Community Shift under Climate Warming. Proc. Natl. Acad. Sci. USA 115 (36), 8990–8995. doi:10.1073/pnas.1716826115
Kuwahara, H., Akeda, S., Kobayashi, S., Takeshita, A., Yamashita, Y., and Kido, Y. (2006). Predticted Changes on the Distribution Areas of marine Organisms Around Japan Caused by the Global Warming. Glob. Environ. Res. 10, 189–199. in Japanese.
Lenanton, R. C. J., Dowling, C. E., Smith, K. A., Fairclough, D. V., and Jackson, G. (2017). Potential Influence of a marine Heatwave on Range Extensions of Tropical Fishes in the Eastern Indian Ocean-Invaluable Contributions from Amateur Observers. Reg. Stud. Mar. Sci. 13, 19–31. doi:10.1016/j.rsma.2017.03.005
Leriorato, J. C., Nakamura, Y., and Uy, W. H. (2021). Cold thermal Tolerance as a Range-Shift Predictive Trait: an Essential Link in the Disparity of Occurrence of Tropical Reef Fishes in Temperate Waters. Mar. Biol. 168 (6), 1–18. doi:10.1007/s00227-021-03875-2
Liu, Y., Saitoh, S.-I., Radiarta, I. N., Isada, T., Hirawake, T., Mizuta, H., et al. (2013). Improvement of an Aquaculture Site-Selection Model for Japanese Kelp (Saccharinajaponica) in Southern Hokkaido, Japan: an Application for the Impacts of Climate Events. ICES J. Mar. Sci. 70 (7), 1460–1470. doi:10.1093/icesjms/fst108
Luiz Jr., O. J., Carvalho-Filho, A., Ferreira, C. E. L., Floeter, S. R., Gasparini, J. L., and Sazima, I. (2008). The reef fish assemblage of the Laje de Santos Marine State Park, Southwestern Atlantic: annotated checklist with comments on abundance, distribution, trophic structure, symbiotic associations, and conservation. Zootaxa 1807 (1), 1–25. doi:10.11646/zootaxa.1807.1.1
Mantua, N. J., and Hare, S. R. (2002). The Pacific Decadal Oscillation. J. Oceanography 58 (1), 35–44. doi:10.1023/a:1015820616384
Marine Planning (2001). Divers paradise Japan. Monthly Diving World. Issued in March. Tokyo: Marine Planning, 272. In Japanese.
Marsland, S. (2009). Machine Learning: An Algorithmic Perspective. Boca Raton: Chapman and Hall/CRC, 390.
Merow, C., Smith, M. J., and Silander, J. A. (2013). A Practical Guide to MaxEnt for Modeling Species' Distributions: what it Does, and Why Inputs and Settings Matter. Ecography 36 (10), 1058–1069. doi:10.1111/j.1600-0587.2013.07872.x
Ministry of Health, Labour and Welfare Japan (2021). Available at: https://www.mhlw.go.jp/topics/syokuchu/poison/animal_det_03.html (Accessed September 27, 2021).
Morim, J., Hemer, M., Wang, X. L., Cartwright, N., Trenham, C., Semedo, A., et al. (2019). Robustness and Uncertainties in Global Multivariate Wind-Wave Climate Projections. Nat. Clim. Chang. 9 (9), 711–718. doi:10.1038/s41558-019-0542-5
Moss, R. H., Edmonds, J. A., Hibbard, K. A., Manning, M. R., Rose, S. K., Van Vuuren, D. P., et al. (2010). The Next Generation of Scenarios for Climate Change Research and Assessment. Nature 463 (7282), 747–756. doi:10.1038/nature08823
Motomura, H. (2020). “List of Japan’s All Fish Species,” in Current Standard Japanese and Scientific Names of All Fish Species Recorded from Japanese Waters (Kagoshima: The Kagoshima University Museum), 560. Available at: https://www.museum.kagoshima-u.ac.jp/staff/motomura/jaf.html.
Munday, P. L., McCormick, M. I., and Nilsson, G. E. (2012). Impact of Global Warming and Rising CO2 Levels on Coral Reef Fishes: what hope for the Future? J. Exp. Biol. 215 (22), 3865–3873. doi:10.1242/jeb.074765
Nakamura, Y., Feary, D. A., Kanda, M., and Yamaoka, K. (2013). Tropical Fishes Dominate Temperate Reef Fish Communities within Western Japan. PLoS One 8 (12), e81107. doi:10.1371/journal.pone.0081107
Nakazono, A. (2002). Fate of Tropical Reef Fish Juveniles that Settle to a Temperate Habitat. Fish. Sci. 68 (Suppl. l), 127–130. doi:10.2331/fishsci.68.sup1_127
Nishikawa, S., Wakamatsu, T., Ishizaki, H., Sakamoto, K., Tanaka, Y., Tsujino, H., et al. (2021). Development of High-Resolution Future Ocean Regional Projection Datasets for Coastal Applications in Japan. Prog. Earth Planet. Sci. 8 (1), 1–22. doi:10.1186/s40645-020-00399-z
Nishimura, S. (1981). Sea and Life on Earth Introduction to Marine Biogeography. Tokyo: Kaimeisha. In Japanese.
Noda, M., Kawano, M., Okamoto, K., and Murase, N. (2016). Estimation of Daily Feeding Rate and Diel Feeding Rhythm of Herbivorous Fish Kyphosus bigibbus in Captivity. J. Shimonoseki Univ. Fish. 64 (4), 219–225. In Japanese.
Noda, M., Ohara, H., Urakawa, K., Murase, N., and Yamamoto, K. (2011). Diet and Prey Availability of Siganus fuscescens Occurring in a Sargassum Bed at Futaoi Island in the Sea of Hibiki with Respect to Feeding on Large Brown Macroalgae. Nsugaf 77, 1008–1019. In Japanese. doi:10.2331/suisan.77.1008
O'Connor, M. I., Bruno, J. F., Gaines, S. D., Halpern, B. S., Lester, S. E., Kinlan, B. P., et al. (2007). Temperature Control of Larval Dispersal and the Implications for marine Ecology, Evolution, and Conservation. Proc. Natl. Acad. Sci. 104 (4), 1266–1271. doi:10.1073/pnas.0603422104
OBIS (2021). Ocean Biodiversity Information System. Intergovernmental Oceanographic Commission of UNESCO. Available at: https://obis.org/(Accessed October 9, 2021).
Oppenheimer, M., Glavovic, B. C., Hinkel, J., van de Wal, R., Magnan, A. K., Abd-Elgawad, A., et al. (2019). “Sea Level Rise and Implications for Low-Lying Islands, Coasts and Communities,” in IPCC Special Report on the Ocean and Cryosphere in a Changing Climate. Editors H. O. Pörtner, D. C. Roberts, V. Masson-Delmotte, P. Zhai, M. Tignor, E. Poloczanskaet al. (Cambridge, UK: Cambridge University Press).
Orr, J. C., Fabry, V. J., Aumont, O., Bopp, L., Doney, S. C., Feely, R. A., et al. (2005). Anthropogenic Ocean Acidification over the Twenty-First century and its Impact on Calcifying Organisms. Nature 437, 681–686. doi:10.1038/nature04095
Payne, N. L., Smith, J. A., Meulen, D. E., Taylor, M. D., Watanabe, Y. Y., Takahashi, A., et al. (2016). Temperature Dependence of Fish Performance in the Wild: Links with Species Biogeography and Physiological thermal Tolerance. Funct. Ecol. 30 (6), 903–912. doi:10.1111/1365-2435.12618
Phillips, S. J., Anderson, R. P., and Schapire, R. E. (2006). Maximum Entropy Modeling of Species Geographic Distributions. Ecol. Model. 190 (3-4), 231–259. doi:10.1016/j.ecolmodel.2005.03.026
Pittman, S. J., Christensen, J. D., Caldow, C., Menza, C., and Monaco, M. E. (2007). Predictive Mapping of Fish Species Richness across Shallow-Water Seascapes in the Caribbean. Ecol. Model. 204, 9–21. doi:10.1016/j.ecolmodel.2006.12.017
Poloczanska, E. S., Brown, C. J., Sydeman, W. J., Kiessling, W., Schoeman, D. S., Moore, P. J., et al. (2013). Global Imprint of Climate Change on marine Life. Nat. Clim Change 3 (10), 919–925. doi:10.1038/nclimate1958
Poloczanska, E. S., Burrows, M. T., Brown, C. J., García Molinos, J., Halpern, B. S., Hoegh-Guldberg, O., et al. (2016). Responses of marine Organisms to Climate Change across Oceans. Front. Mar. Sci. 3, 62. doi:10.3389/fmars.2016.00062
Professional Association of Diving Instructors Diving Spot Information (2021). Available at: https://www.padi.co.jp/scuba-diving/scuba-vacations/vacation-spotlight/(Accessed Sep 28, 2021).
Raes, N., and ter Steege, H. (2007). A Null-Model for Significance Testing of Presence-Only Species Distribution Models. Ecography 30 (5), 727–736. doi:10.1111/j.2007.0906-7590.05041.x
Randin, C. F., Engler, R., Normand, S., Zappa, M., Zimmermann, N. E., Pearman, P. B., Vittoz, P., Thuiller, W., and Guisan, A. (2009). Climate Change and Plant Distribution: Local Models Predict High-Elevation Persistence. Glob. Change Biol. 15 (6), 1557–1569. doi:10.1111/j.1365-2486.2008.01766.x
Ready, J., Kaschner, K., South, A. B., Eastwood, P. D., Rees, T., Rius, J., et al. (2010). Predicting the Distributions of marine Organisms at the Global Scale. Ecol. Model. 221 (3), 467–478. doi:10.1016/j.ecolmodel.2009.10.025
IPCC (2014). “Contribution of Working Groups I, II and III to the Fifth Assessment Report of the Intergovernmental Panel on Climate Change,” in Climate Change 2014: Synthesis Report. Editors R. K. Pachauri, and L. A. Meyer (Geneva, Switzerland: IPCC), 151.
Sato, M., Nakamura, Y., and Hori, M. (2021). Potential Stocks of Reef Fish‐based Ecosystem Services in the Kuroshio Current Region: Their Relationship with Latitude and Biodiversity. Popul. Ecol. 63 (1), 75–91. doi:10.1002/1438-390x.12061
Shimizu, N., Matsuura, K. Y., Shigeta Sakai Hashimoto, T. Y. H., and Ohtsuka, S. (2009). Science Museum Net. Available at: http://science-net.kahaku.go.jp/. (Accessed September 2, 2021).
Steneck, R. S., Bellwood, D. R., and Hay, M. E. (2017). Herbivory in the marine Realm. Curr. Biol. 27 (11), R484–R489. doi:10.1016/j.cub.2017.04.021
Sudo, K., Watanabe, K., Yotsukura, N., and Nakaoka, M. (2020). Predictions of Kelp Distribution Shifts along the Northern Coast of Japan. Ecol. Res. 35 (1), 47–60. doi:10.1111/1440-1703.12053
Swets, J. A. (1988). Measuring the Accuracy of Diagnostic Systems. Science 240 (4857), 1285–1293. doi:10.1126/science.3287615
Takao, S., Kumagai, N. H., Yamano, H., Fujii, M., and Yamanaka, Y. (2015). Projecting the Impacts of Rising Seawater Temperatures on the Distribution of Seaweeds Around Japan under Multiple Climate Change Scenarios. Ecol. Evol. 5 (1), 213–223. doi:10.1002/ece3.1358
Tanaka, K., Taino, S., Haraguchi, H., Prendergast, G., and Hiraoka, M. (2012). Warming off Southwestern Japan Linked to Distributional Shifts of Subtidal Canopy-Forming Seaweeds. Ecol. Evol. 2 (11), 2854–2865. doi:10.1002/ece3.391
Tanase, H., Araga, C., Ohta, M., and Yamamoto, T. (1992). “Survival Limits of Some Marine Fishes at Low Temperature,” in Kyoto University Annual Report of the Seto Marine Biological Laboratory (Shirahama), 5, 49–54. In Japanese.
Taniyama, S., Arakawa, O., Terada, M., Nishio, S., Takatani, T., Mahmud, Y., et al. (2003). Ostreopsis sp., a Possible Origin of Palytoxin (PTX) in Parrotfish Scarus Ovifrons. Toxicon 42 (1), 29–33. doi:10.1016/S0041-0101(03)00097-7
Taylor, K. E., Stouffer, R. J., and Meehl, G. A. (2012). An Overview of CMIP5 and the experiment Design. Bull. Am. Meteorol. Soc. 93 (4), 485–498. doi:10.1175/BAMS-D-11-00094.1
Tebaldi, C., and Knutti, R. (2007). The Use of the Multi-Model Ensemble in Probabilistic Climate Projections. Phil. Trans. R. Soc. A. 365 (1857), 2053–2075. doi:10.1098/rsta.2007.2076
Tsuchida, S., Miura, T., Setoguma, T., Watanabe, Y., and Yoshino, S. (2018). Temperature Tolerance of Fourteen Japanese Coastal Fishes. Report of Marine Ecology Research Institute, No. 23 (23), 69–73. In Japanese.
Tsujino, H., Nakano, H., Sakamoto, K., Urakawa, S., Hirabara, M., Ishizaki, H., et al. (2017). Reference Manual for the Meteorological Research Institute Community Ocean Model Version 4 (MRI. COMv4). Technical Reports, 80. Meteorological Research Institute, 306. doi:10.11483/mritechrepo.80
Ueta, Y., and Tanada, N. (2018). Influences of Low Water Temperature and Food Availability in winter on the Survival and Feeding of the Rabbitfish, Siganus fuscescens in Captivity. Tokushima: Bulletin of Tokushima Prefectural Agriculture, Forestry and Fisheries Technology Support Center Fisheries Research Institute 12 (1), 1–19. In Japanese.
United Nations Environment Programme (2020). Out of the Blue: The Value of Seagrasses to the Environment and to People. Nairobi: UNEP.
Vergés, A., Doropoulos, C., Malcolm, H. A., Skye, M., Garcia-Pizá, M., Marzinelli, E. M., et al. (2016). Long-term Empirical Evidence of Ocean Warming Leading to Tropicalization of Fish Communities, Increased Herbivory, and Loss of Kelp. Proc. Natl. Acad. Sci. USA 113 (48), 13791–13796. doi:10.1073/pnas.1610725113
Vergés, A., McCosker, E., Mayer‐Pinto, M., Coleman, M. A., Wernberg, T., Ainsworth, T., et al. (2019). Tropicalisation of Temperate Reefs: Implications for Ecosystem Functions and Management Actions. Funct. Ecol. 33 (6), 1000–1013. doi:10.1111/1365-2435.13310
Vergés, A., Steinberg, P. D., Hay, M. E., Poore, A. G. B., Campbell, A. H., Ballesteros, E., et al. (2014). The Tropicalization of Temperate marine Ecosystems: Climate-Mediated Changes in Herbivory and Community Phase Shifts. Proc. R. Soc. B. 281 (1789), 20140846. doi:10.1098/rspb.2014.0846
Warren, D. L., and Seifert, S. N. (2011). Ecological Niche Modeling in Maxent: the Importance of Model Complexity and the Performance of Model Selection Criteria. Ecol. Appl. 21 (2), 335–342. doi:10.1890/10-1171.1
Wenger, S. J., and Olden, J. D. (2012). Assessing Transferability of Ecological Models: an Underappreciated Aspect of Statistical Validation. Methods Ecol. Evol. 3 (2), 260–267. doi:10.1111/j.2041-210x.2011.00170.x
Wernberg, T., Bennett, S., Babcock, R. C., De Bettignies, T., Cure, K., Depczynski, M., et al. (2016). Climate-driven Regime Shift of a Temperate marine Ecosystem. Science 353 (6295), 169–172. doi:10.1126/science.aad8745
Wisz, M. S., Hijmans, R. J., Li, J., Peterson, A. T., Graham, C. H., Guisan, A., et al. (2008). Effects of Sample Size on the Performance of Species Distribution Models. Divers. Distributions 14 (5), 763–773. doi:10.1111/j.1472-4642.2008.00482.x
Woodhead, A. J., Hicks, C. C., Norström, A. V., Williams, G. J., and Graham, N. A. (2019). Coral Reef Ecosystem Services in the Anthropocene. Funct. Ecol. 33 (6), 1023–1034. doi:10.1111/1365-2435.13331
Yamaguchi, A., Inoue, K., Furumitsu, K., Kiriyama, T., Yoshimura, T., Koido, T., et al. (2006). Behavior and Migration of Rabbitfish Siganus fuscescens and Grey Seachub Kyphosus bigibbus off Nomozaki, Kyushu, Tracked by Biotelemetry Method. Nsugaf 72 (6), 1046–1056. doi:10.2331/suisan.72.1046
Yara, Y., Oshima, K., Fujii, M., Yamano, H., Yamanaka, Y., and Okada, N. (2011). Projection and Uncertainty of the Poleward Range Expansion of Coral Habitats in Response to Sea Surface Temperature Warming: a Multiple Climate Model Study. Galaxea, J. Coral Reef Stud. 13 (1), 11–20. doi:10.3755/galaxea.13.11
Yara, Y., Vogt, M., Fujii, M., Yamano, H., Hauri, C., Steinacher, M., et al. (2012). Ocean Acidification Limits Temperature-Induced Poleward Expansion of Coral Habitats Around Japan. Biogeosciences 9 (12), 4955–4968. doi:10.5194/bg-9-4955-2012
Keywords: climate change, Northwest Pacific, species distribution model, mitigation and adaptation, climate model
Citation: Sudo K, Maehara S, Nakaoka M and Fujii M (2022) Predicting Future Shifts in the Distribution of Tropicalization Indicator Fish that Affect Coastal Ecosystem Services of Japan. Front. Built Environ. 7:788700. doi: 10.3389/fbuil.2021.788700
Received: 03 October 2021; Accepted: 30 November 2021;
Published: 05 January 2022.
Edited by:
Nobuhito Mori, Kyoto University, JapanCopyright © 2022 Sudo, Maehara, Nakaoka and Fujii. This is an open-access article distributed under the terms of the Creative Commons Attribution License (CC BY). The use, distribution or reproduction in other forums is permitted, provided the original author(s) and the copyright owner(s) are credited and that the original publication in this journal is cited, in accordance with accepted academic practice. No use, distribution or reproduction is permitted which does not comply with these terms.
*Correspondence: Kenji Sudo, a3N1ZG8uaG9rdWRhaUBnbWFpbC5jb20=
†Present Address: Serina Maehara, Osaka Aquarium Kaiyukan Co., Ltd., Osaka, Japan