 Mehrdad Rabani
 Simen Sønderland2
 Mehran Rabani
- 1Department of Built Environment, Faculty of Technology, Art and Design, Oslo Metropolitan University, Oslo, Norway
- 2Department of Energy and Technology, Multiconsult AS, Oslo, Norway
- 3Department of Mechanical Engineering, Faculty of Engineering, Ardakan University, Ardakan, Iran
The Climate House at Tøyen in Oslo is a nearly Zero Emission Building (nZEB) designed for exhibitions and educational purposes. It operates with a hybrid ventilation system, where natural ventilation via operable windows serves as the primary strategy, supplemented by mechanical ventilation when natural ventilation alone cannot maintain acceptable indoor thermal comfort and air quality. However, monitoring and analysis indicate that the current ventilation system underperforms, particularly during the winter season, resulting in suboptimal thermal comfort and reduced energy efficiency. This study aims to investigate whether optimized hybrid ventilation control strategies can be beneficial in nZEB buildings in cold climates, both under current and future conditions. A new control strategy was tested using IDA-ICE 5.0 simulations, prioritizing mechanical ventilation while using natural ventilation as a supplement. Results show a 13% energy reduction compared to full mechanical ventilation, with improved thermal comfort and compliance with indoor air quality standards. When tested under future climate scenarios (RCP 2.6, 4.5, and 8.6), the strategy yields energy savings of 19%–21% by 2050 and up to 30% by 2100. However, under extreme heat conditions in 2100, the system may struggle with overheating, indicating the need for higher airflow rates and extended night ventilation. Overall, the findings suggest that, with adaptive control, hybrid ventilation is a promising solution for improving energy efficiency in low-energy buildings in cold climates—even as temperatures rise.
1 Introduction
Buildings account for up to 40% of total energy consumption in Europe, with HVAC (Heating, Ventilation, and Air Conditioning) systems responsible for approximately half of a building’s total energy use (Pérez-Lombard et al., 2008; Cao et al., 2016). Given that people spend up to 90% of their time indoors, significant efforts have been made to integrate HVAC systems to maintain high indoor environmental quality (Cao et al., 2016). Research highlights that inadequate thermal comfort can reduce workplace productivity, while poor air quality negatively impacts cognitive function (Seppanen et al., 2003; Cedeño Laurent et al., 2021).
Climate change is significantly impacting building energy demand, even in cold climates. In Finland, simulations show that heating demand for a typical detached house could drop by 20%–40% by 2100, while cooling demand may rise by 40%–80%, depending on greenhouse gas emission scenarios. Despite higher summer cooling needs, total annual energy use for heating and cooling is projected to decrease by 20%–35% (Jylhä et al., 2015).
The Representative Concentration Pathways (RCPs) were introduced by the Intergovernmental Panel on Climate Change (IPCC) in the Fifth Assessment Report (AR5) in 2014 (Kottek et al., 2006). RCPs present different scenarios for future climate projections based on continued increases in greenhouse gas emissions. They serve as an essential tool for projecting future climate data. There are four main RCP pathways: RCP 2.6, 4.5, 6.0, and 8.5, categorized based on the total radiative forcing expected by the year 2100. Radiative forcing represents the net change in incoming and outgoing radiation at the top of the atmosphere due to changes in greenhouse gas concentrations and other climate drivers. It is a key metric used in climate projections, such as the RCPs, and is expressed in watts per square meter (W/m2). Figure 1 illustrates a comparison between RCP 2.6 and RCP 8.5, showing significant differences in both temperature increase and changes in precipitation levels between the periods 1986–2005 and 2081–2100 (Stocker et al., 2013). To meet the growing demand for both thermal comfort and indoor air quality, hybrid (mixed-mode) ventilation systems, which combine natural and mechanical ventilation strategies, are increasingly seen as a sustainable and energy-efficient solution. In office buildings, educational institutions, and other commercial settings, these systems can significantly reduce energy use by relying on natural ventilation when outdoor conditions are favorable.
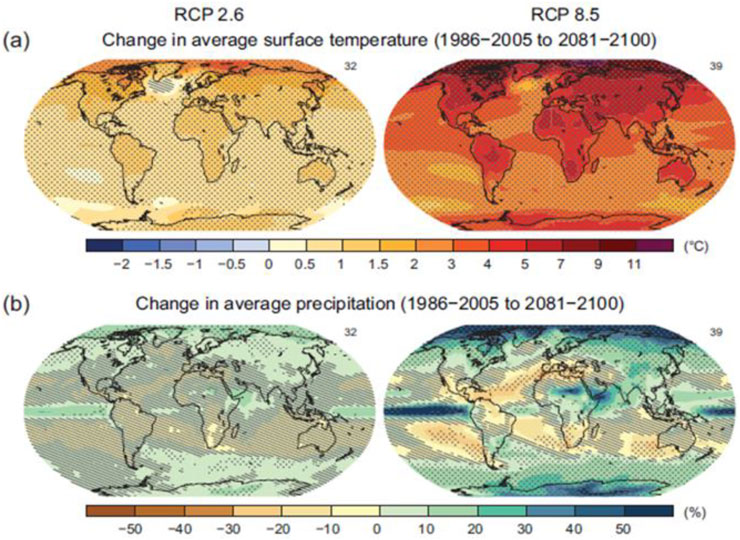
Figure 1. Changes in temperature and precipitation under RCP 2.6 and RCP 8.5 (Stocker et al., 2013). (a) Change in average surface temperature (1986–2005 to 2081–2100). (b) Change in average precipitation (1986–2005 to 2081–2100).
Mixed-mode ventilation refers to a strategy that integrates natural ventilation (such as operable windows, vents, or passive airflow) with mechanical systems (like HVAC units, or air handling systems). The goal is to enhance indoor air quality and occupant comfort while minimizing energy consumption. These systems can automatically switch between or simultaneously operate both modes based on factors such as weather conditions, indoor temperatures, occupancy levels, and air quality.
Typically, mixed-mode systems function in three main modes:
• Natural Mode—using only passive airflow.
• Mechanical Mode—relying solely on mechanical systems.
• Mixed Mode—operating both systems in coordination.
This flexible approach is particularly effective in climates with varying seasonal or daily conditions. However, implementing mixed-mode ventilation in commercial buildings also presents challenges, especially in maintaining consistent indoor comfort amid fluctuating occupancy and use patterns. In cold climates, achieving optimal performance demands careful architectural design and a well-coordinated control strategy for managing window openings, façade elements, and ventilation schedules.
2 Literature review
2.1 Past research and benchmark projects
Several major research initiatives have examined hybrid ventilation over the past two decades. The International Energy Agency’s Annex 35 (Heiselberg, 2025) investigated hybrid ventilation in office and educational buildings across various climates, but did not specifically address the challenges of cold climates. Similarly, the EU-funded RESHYVENT project (RESHYVENT Consortium, 2005) explored demand-controlled hybrid systems in residential buildings, with limited focus on cold-climate performance. Annex 68 (Rode, 2025) placed more emphasis on IAQ in residential settings using natural and mechanical ventilation yet also lacked specific insight into hybrid strategies for colder regions.
2.2 Application of hybrid ventilation in different building types
2.2.1 Educational buildings
A number of Norwegian studies focus on educational buildings. Algrøy (2014) evaluated automated and manual window opening in a naturally ventilated school classroom using IDA ICE simulations. Results showed 4% energy savings but raised concerns about drafts and indoor CO2 exceedances. Lie (2015) simulated mixed-mode ventilation in schools, integrating CO2, weather, and wind conditions in control logic. Despite 15.7% energy savings, the study reported summer overheating and CO2 levels exceeding recommended thresholds. Buvik (2003) measured the performance of a hybrid system with natural stack ventilation supported by mechanical fans. The findings indicated acceptable IAQ but no clear advantage over balanced mechanical ventilation. Grimsbo Øgård (2014) simulated a kindergarten building with automated window opening controlled by indoor sensors and a weather station. The results showed up to 14% energy savings, but thermal discomfort occurred during warmer periods.
In contrast, Peng et al. (2022) conducted one of the most comprehensive international reviews on hybrid ventilation, analyzing 74 studies and classifying them based on climate, building type, and control strategy using the Köppen-Geiger climate classification (Köppen and Geiger, 1930). Their findings revealed that hybrid ventilation has primarily been studied in Cfb (marine), Cfa (humid subtropical), and Csa (Mediterranean) climates, with commercial, residential, and educational buildings being the most common cases. However, studies focusing on cold climates (Dfb), such as those found in Nordic countries, were underrepresented. This gap emphasizes the importance of recent Norwegian contributions and provides a benchmark for evaluating hybrid ventilation performance in cold-climate educational buildings. Table 1 summarizes these key studies on educational buildings, detailing control strategies, performance outcomes, and limitations.
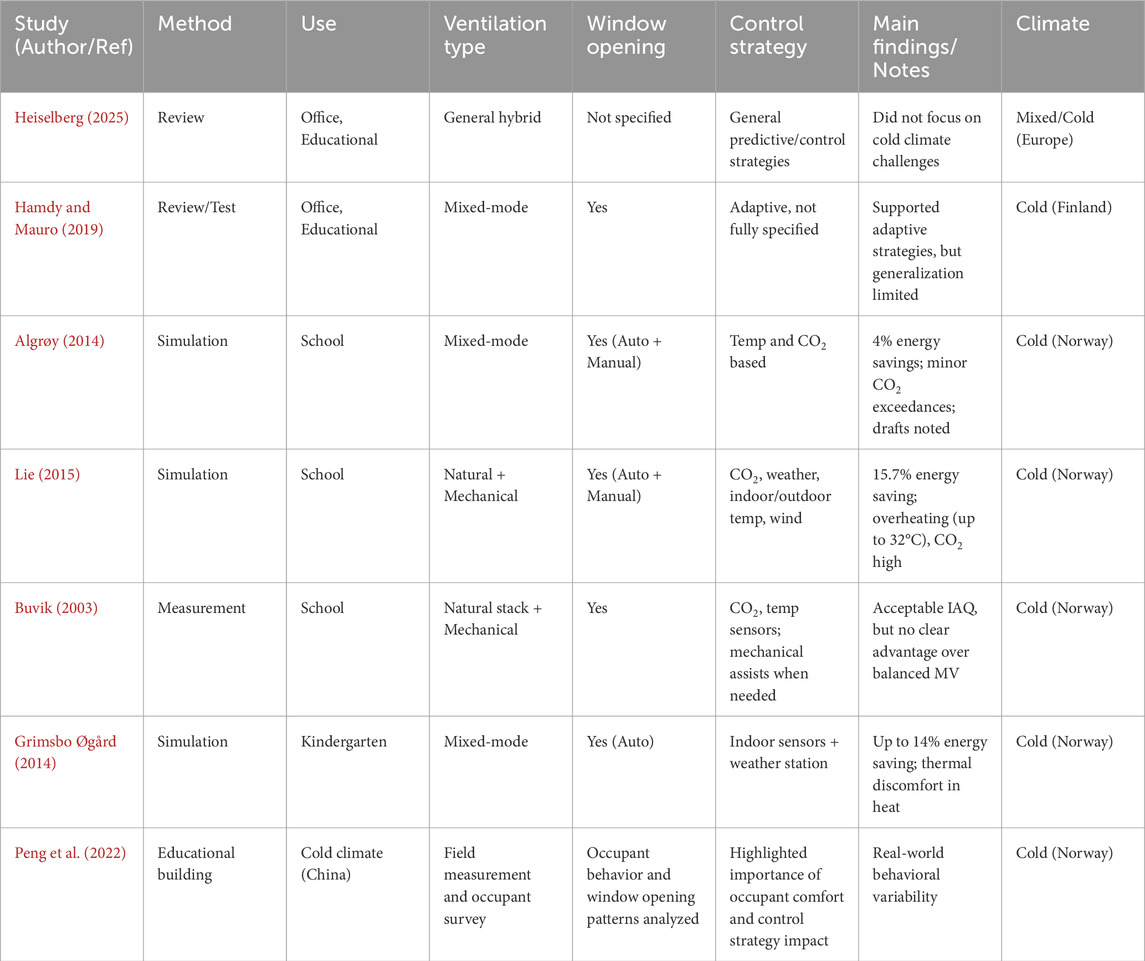
Table 1. Summary of studies on educational buildings.
2.2.2 Office buildings
Office buildings have been a primary focus in simulation-based studies. Naili et al. (2023) demonstrated that automated window control based on environmental conditions could save up to 40% energy while maintaining good IAQ. Manual control was less effective. Chaudhary et al. (2025) applied deep learning to control mixed-mode systems in offices, finding potential benefits but lacking occupant behavior modeling and real-world validation. Rabani and Petersen (2023) validated mixed-mode strategies using both field measurements and simulations, revealing 50% energy savings with demand-controlled ventilation and automated windows. Hsu et al. (2024) and Liu et al. (2021) also explored natural ventilation, noting IAQ benefits and behavioral trends without quantifying energy performance. Waterson and Hunt (2024) analyzed hybrid night purge strategies analytically, highlighting operational challenges like stack flow reversal. Table 2 summarizes the studies on office buildings, highlighting the methodologies employed and their key findings.
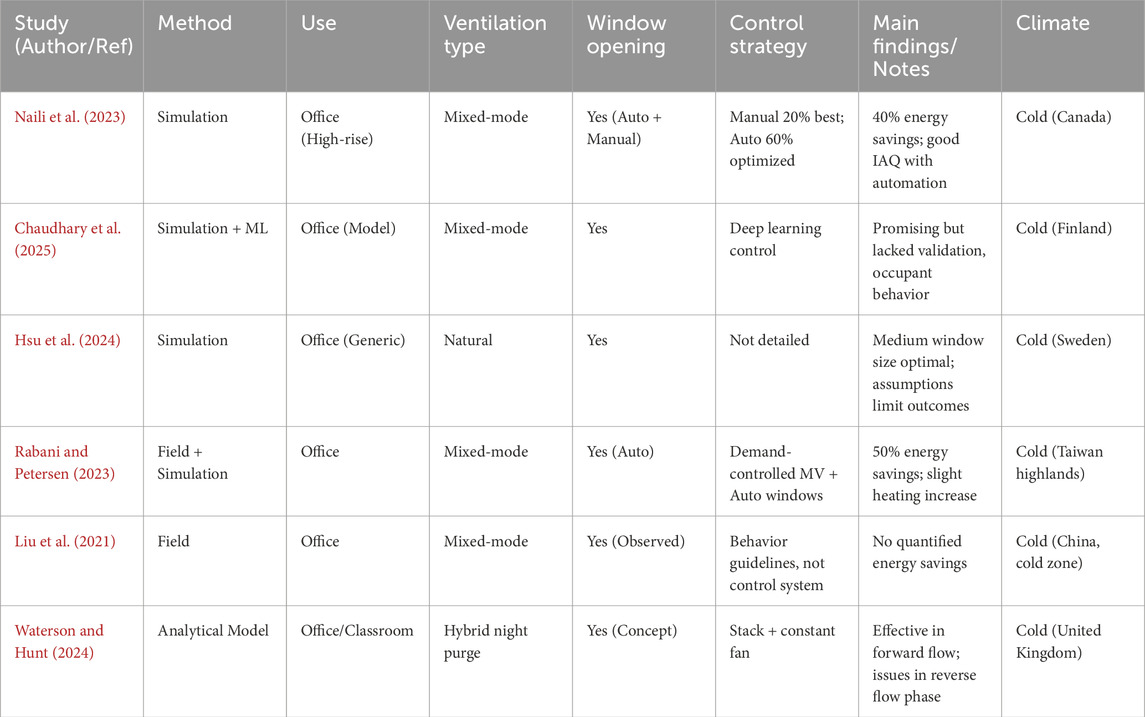
Table 2. Summary of studies on office buildings.
2.2.3 Residential buildings
Residential studies are fewer and more fragmented. RESHYVENT Consortium (2005) focused on demand-controlled hybrid ventilation, but without addressing cold-climate specifics. Annex 68 (Rode, 2025) emphasized IAQ rather than hybrid strategies. Haktorson (2018) simulated mixed-mode ventilation in apartments using IDA ICE. Automated window control cut energy use from 67.6 to 39.7 kWh/m2, but indoor CO2 levels rose in winter. Deng et al. (2020) monitored 30 homes with occupant-controlled natural ventilation. Although CO2 sensors were installed, IAQ was often compromised during cold periods due to infrequent window use. Table 3 summarizes the studies on residential buildings, highlighting the methodologies employed and their key findings.
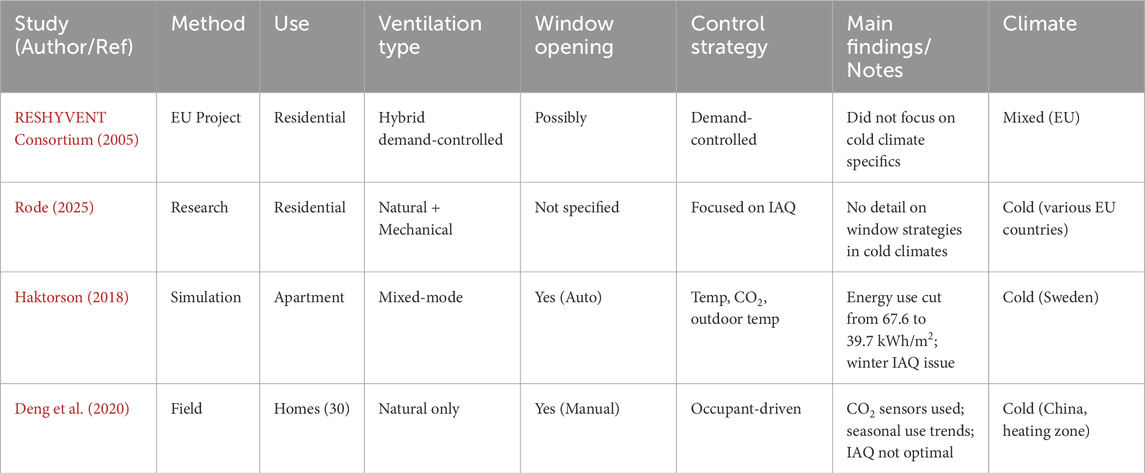
Table 3. Summary of studies on residential buildings.
2.3 Simulation vs. measurement approaches
Simulation dominates hybrid ventilation research, particularly using tools like IDA ICE and EnergyPlus. While simulations offer controlled comparisons of scenarios and control strategies, real-world data remains critical. Measurement studies like those by Buvik (2003), Rabani and Petersen (2023), and Deng et al. (2020) validate assumptions but reveal occupant behavior and environmental variability often deviate from models. This divergence highlights the need for more long-term, monitored case studies in cold climates.
2.4 Window opening and control strategies
Window operation plays a central role in hybrid ventilation. Studies like those by Naili et al. (2023), Algrøy (2014), and Haktorson (2018) show automated control based on CO2, temperature, and weather inputs yields better performance than manual use. However, even with sensors, issues like over-ventilation, occupant discomfort, or high CO2 levels during cold weather persist. Few studies directly assess window usability or occupant satisfaction, especially in educational settings.
2.5 Hybrid ventilation under future climate scenarios
Some studies simulate hybrid ventilation in the context of climate change. Bamdad et al. (2022) in Australia and Sánchez-García et al. (2019) in Spain found mixed-mode strategies could offset future cooling loads, yielding 38%–47% energy savings. In cold climates, Gilani and O’Brien (2021) and Wang et al. (2017) noted reduced energy savings under future scenarios and did not address IAQ. These findings suggest that hybrid ventilation may need reevaluation or redesign to remain effective in colder regions under warming trends. Table 4 summarizes the studies on hybrid ventilation with various climate scenarios, highlighting the methodologies employed and their key findings.
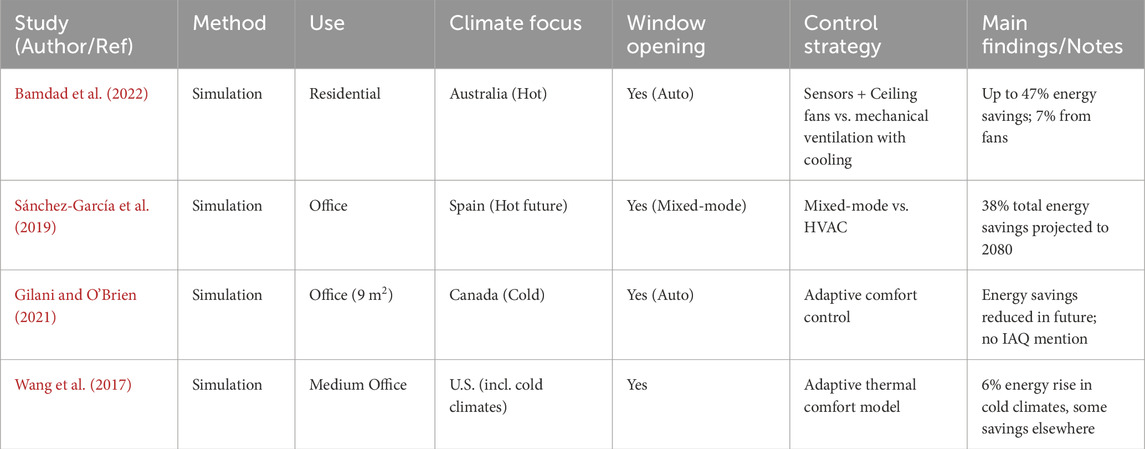
Table 4. Summary of hybrid ventilation studies with various climate-scenarios.
Despite growing interest and research on hybrid ventilation, significant gaps remain, especially regarding its effectiveness in future cold climates. Most existing studies focus on warmer regions where rising temperatures and extreme heatwaves are expected to increase cooling demands, thereby reducing the potential energy savings achievable through natural ventilation alone.
In contrast, buildings in cold climates, such as Norway, rely heavily on mechanical ventilation with heat recovery during long heating seasons. However, with the anticipated shortening of heating periods due to climate change, hybrid ventilation strategies may involve more frequent use of window ventilation. This shift prompts critical questions about the applicability and efficiency of hybrid ventilation in airtight, low-energy buildings, such as nearly Zero Emission Building (nZEBs), compared to conventional constructions.
Key research gaps include:
• Limited studies specifically addressing hybrid ventilation performance in cold climates under future climate scenarios.
• Uncertainty about whether hybrid ventilation can maintain or improve energy savings and indoor air quality in highly airtight and energy-efficient buildings.
• A need for integrated models that simultaneously consider energy use, indoor air quality, thermal comfort, and occupant behavior.
Addressing these gaps is essential for optimizing hybrid ventilation strategies and supporting sustainable building design tailored to the evolving climate conditions in cold regions.
3 Case study: climate house
Figure 2 shows the exterior and interior of case study, Climate house. The building is an exhibition and educational building at the Natural History Museum in the Botanical Garden, Oslo, Norway. Classified as a nearly Zero Emission Building (nZEB), the building meets passive house-level energy standards and fulfills the ZEB-O÷EQ level, meaning it offsets all operational energy-related emissions except those associated with user-controlled equipment such as appliances and electronics (Wang et al., 2022).
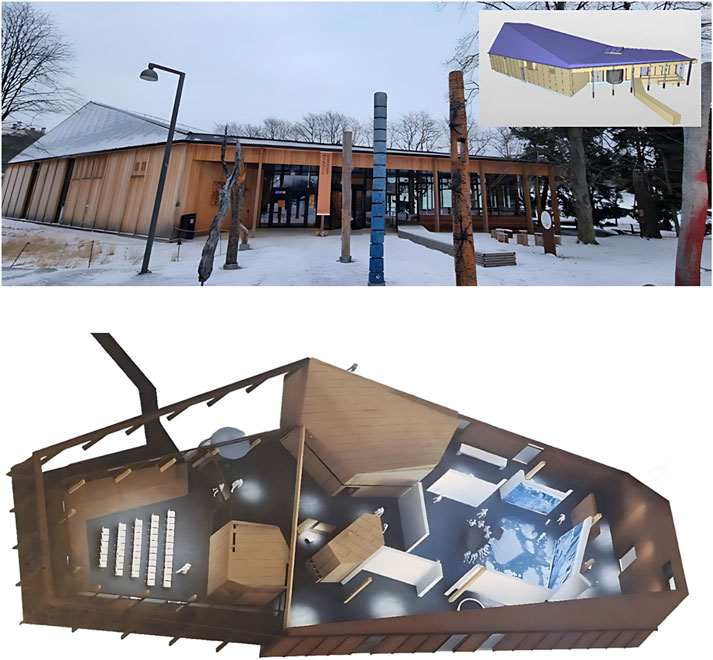
Figure 2. Interior and exterior spaces of the Climate House.
The building’s heating, cooling, and ventilation demands are primarily met through district heating/cooling, with thermal energy supplied from the Natural History Museum at the University of Oslo. This is supplemented by a ground-source system utilizing collector pipes installed approximately 1 m below the base slab, providing additional heating and cooling capacity. A waterborne underfloor heating system is implemented throughout the building, supported by a mixing valve and a frequency-controlled circulation pump to modulate thermal output. The underfloor loops also offer a limited potential for passive cooling. The detailed configuration of the HVAC system is illustrated in Figure 3a.
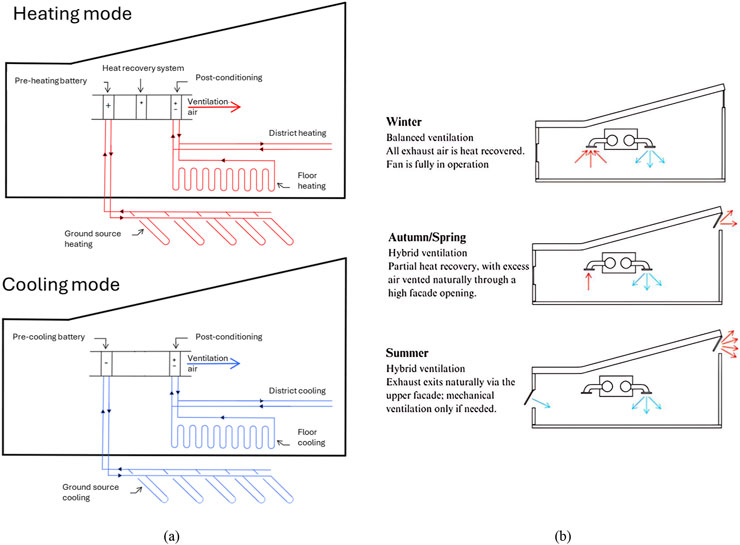
Figure 3. Schematic of the (a) HVAC system and (b) Hybrid ventilation system in the climate house (Ahmadi, 2023).
The hybrid ventilation system in the Climate House primarily relies on natural ventilation through operable windows, with mechanical ventilation serving as a supplementary system. The mechanical ventilation unit includes heating and cooling coils, as well as a heat recovery system. The system operates such that mechanical ventilation is activated only when natural ventilation alone is insufficient to maintain thermal comfort or indoor air quality. However, the hybrid ventilation mode is not used during the winter season, meaning that window openings are mainly intended for use in periods when CO2 concentration limits cannot be met through mechanical ventilation alone (Figure 3b). The hybrid ventilation control is managed through temperature and CO2 sensors, which regulate the windows and exhaust system. These sensors are strategically placed at a height of approximately 1.6 m from the finished floor to optimize indoor climate regulation.
4 Methodology
4.1 Building envelope and internal load characteristics
For modelling the building, IDA-ICE 5.0 has been employed. The building model was first imported via Naviate Simple BIM and then exported to IDA-ICE 5.0 using SketchUp as shown in Figure 4. Two zones are considered in this model called Amphitheater and Exhibition.
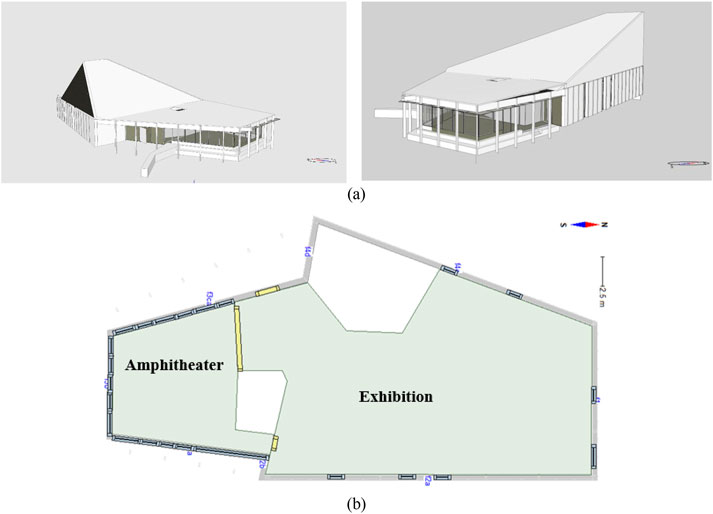
Figure 4. (a) 3D model and (b) floor plan of the Climate House in IDA-ICE 5.0.
The building envelope and technical properties adhere to the stipulations outlined in the Norwegian Building Code, TEK 17 (TEK17, 2017) and the specific requirements of the building. Factors contributing to internal gains—namely occupancy, lighting, and equipment—along with their respective utilization profiles, were chosen based on the real usage in the building (Table 5).
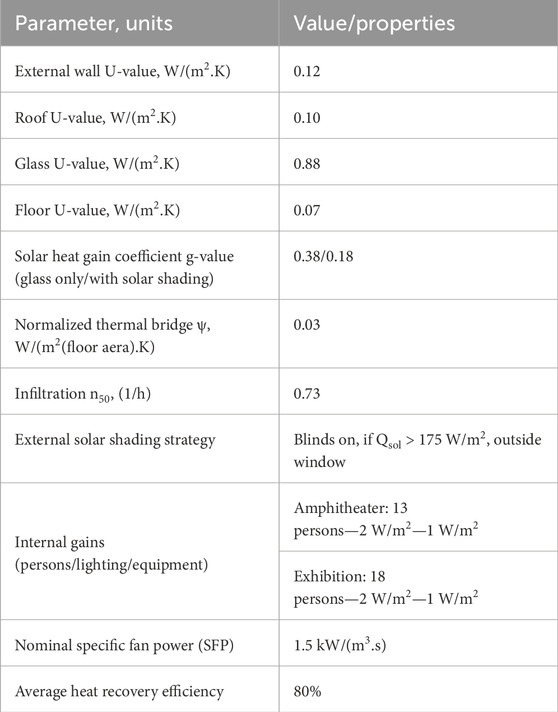
Table 5. Details of the building envelope properties, internal gains, and mechanical ventilation specifications.
The usage profile for the occupants, lighting, and equipment are considered based on the information collected from users. The opening hours of the Climate House are every day from 9:00 to 17:00 (Figure 5).
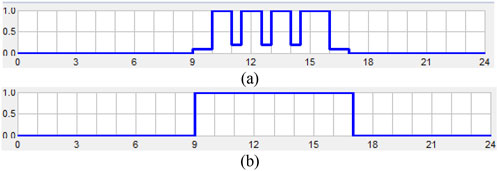
Figure 5. Usage profile for (a) occupants and (b) lighting and equipment.
4.2 Ventilation scenarios
The current hybrid ventilation control strategy in the Climate House, shown in Figure 3b, relies only on CO2 and indoor air temperature and schedule opening. User feedback indicates that the current hybrid ventilation system in the Climate House does not adequately maintain thermal comfort and indoor air quality. To address this, an optimized hybrid control strategy is proposed, prioritizing mechanical ventilation while utilizing natural ventilation as a supplementary approach. The window opening mechanism is regulated based on air change per hour (ACH), indoor temperature, CO2 concentration, outdoor temperature, and a predefined operation schedule.
The hybrid ventilation control system is designed to prioritize mechanical ventilation over natural ventilation via window openings (Figure 6). However, windows are automatically activated when specific indoor environmental conditions are not met in designated control areas (2, 3, and 5). Specifically, window operation is triggered if the indoor air temperature exceeds 24°C and is at least 1°C higher than the outdoor temperature (control area 4), or if CO2 concentration surpasses 950 ppm—provided this occurs between 7:00 a.m. and 6:00 p.m. (control area 7). Outside of occupancy hours (6:00 p.m. to 7:00 a.m.), windows will open if the indoor temperature exceeds 21°C, the outdoor temperature is above 12°C, and there is a minimum 1°C temperature difference favoring indoor warmth. Throughout the day, the window opening is further regulated by a maximum allowable air change rate (ACH), ensuring that natural ventilation does not exceed predefined limits (control area 1). The degree of window opening is modulated automatically to maintain optimal conditions.
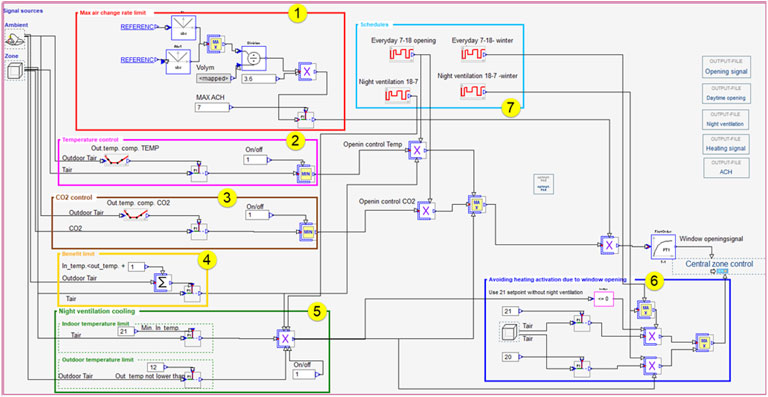
Figure 6. Schematic of the window opening control used in the hybrid ventilation system of the Climate House (Rabani and Petersen, 2023).
Additionally, the heating system is activated when the indoor temperature drops below 21°C. However, during night-time ventilation, the heating setpoint is lowered to 20°C (control area 6) to prevent the simultaneous operation of radiators and window openings, thus improving energy efficiency (Rabani and Petersen, 2023). Minor adjustments have been made to reflect the occupants’ usage patterns. The hybrid ventilation approach is evaluated in comparison to a fully mechanical ventilation system, which includes heating and cooling coils as well as heat recovery, to assess its performance in reducing energy consumption while maintaining indoor thermal comfort. Table 6 presents the ventilation airflow rates for both scenarios. In the full mechanical ventilation case, night ventilation is additionally implemented from May 1st to September 1st.
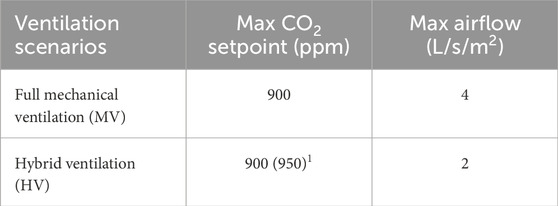
Table 6. Setpoints for ventilation strategies.
4.3 Thermal comfort criteria
To access the indoor thermal climate and thermal comfort requirements, the Fanger model (Fanger, 1970) has been used for scenarios with full mechanical ventilation, and the adaptive thermal comfort model for hybrid ventilation scenarios. This distinction is based on guidance provided in the RIF industry guidelines (Association of Consulting Engineers in Norway) and Norway’s technical building regulations (TEK17), which acknowledge the applicability of adaptive models when natural ventilation is present (Karlsen et al., 2021). For the MV, according to TEK17, specifically § 13-4 on thermal indoor climate, it is recommended that the indoor operative temperature should not exceed 26°C for more than 50 h per year under normal conditions.
The adaptive thermal comfort was applied based on the model specified in NS-EN 16798-1 (Norsk Standard, 2019). This standard provides a method suitable for buildings without mechanical cooling systems, where occupants can adapt to the indoor climate through behavioral, physiological, or psychological means.
The analysis focused on Category II comfort conditions, which represent a normal level of expectation and are recommended for existing buildings and typical applications. According to NS-EN 16798-1, Category II specifies acceptable indoor operative temperature ranges based on the running mean outdoor temperature, with ±3°C limits for naturally ventilated buildings.
The adaptive comfort temperature was calculated using the following Equation 1:
Where:
• Tcomf: is the neutral (comfortable) operative temperature [°C]
• Trm: is the running mean outdoor temperature [°C]
For Category II, the acceptable temperature range is Equation 2:
In this study this criterion is used to assess the number of hours during which indoor temperatures exceeded the comfort limits in HV scenario.
4.4 Climate data and future climate scenarios
The future climate files for this study were generated using Meteonorm (Meteotest, 2020), a comprehensive software tool that provides access to historical climate data from various weather stations. Meteonorm enables interpolation between multiple stations to enhance location-specific accuracy. It is fully compatible with IDA-ICE 5.0, allowing climate files to be exported in PRN format for seamless integration into simulations. Additionally, historical climate data can be utilized to model future climate scenarios. For this study, we used climate data from the Oslo Blindern weather station, referred to as “Historic.” This is the most recent TMYx 2007–2021 dataset available for this location. TMYx represents typical weather conditions and is similar to traditional TMY files but is based on a longer and more recent period than older TMY2 or TMY3 datasets (Crawley et al., 2020).
To evaluate the resilience of the hybrid ventilation control strategy, the Climate House will be simulated using future climate data. All setpoint values, system properties, and parameters will remain unchanged, with no adjustments or modifications. Simulations will be conducted for two future time periods: 2050 and 2100. For each period, three climate models will be used RCP 2.6, RCP 4.5, and RCP 8.5.
Figure 7 presents the average monthly temperatures for the years 2050 and 2100.
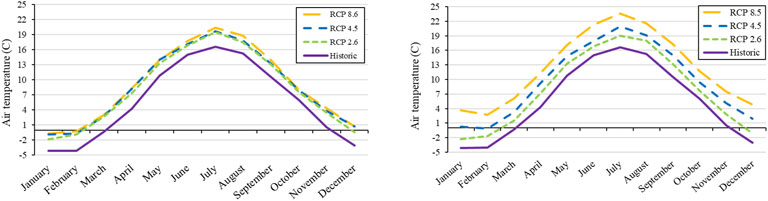
Figure 7. Projected monthly average outdoor temperatures for Blindern, Oslo: Year 2050 (left) and Year 2100 (right).
The purple line represents the baseline climate. While the year 2050 shows minimal variation among the different climate scenarios, significant differences emerge by 2100. In particular, under the RCP 8.5 scenario, the average temperature in July reaches 23.6°C, representing a 7°C increase compared to the current climate.
4.5 Validation of the simulation model
Due to the shared energy metering system between the Climate House and the adjacent Natural History Museum, isolating the Climate House’s specific energy consumption is not feasible. This limitation restricts the possibility of directly validating the simulated energy use with measured data. Consequently, the validation strategy was redirected toward indoor environmental parameters. The simulation model was evaluated using detailed monitoring data, with a focus on indoor air temperature and CO2 concentration levels measured on 7 January 2023. The measurement equipment and sensor placement for both temperature and CO2 are illustrated in Figure 8. Details of the equipment and sensors used to measure air temperature and CO2 concentrations are provided in Supplementary Appendix 1.
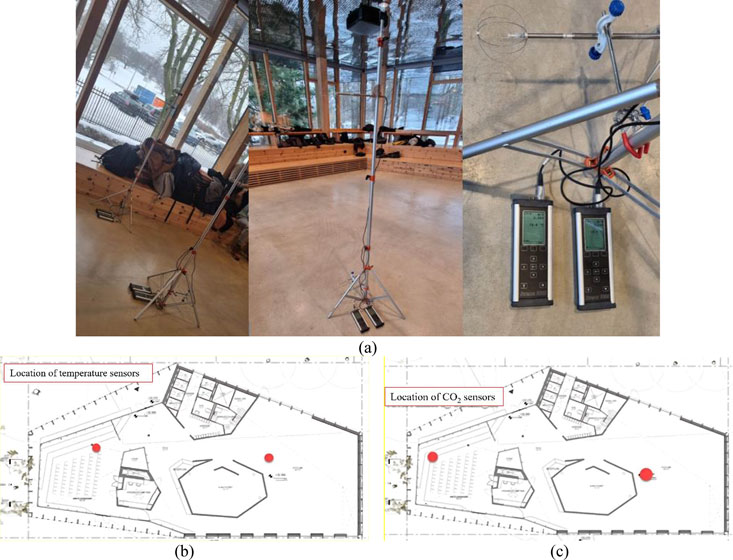
Figure 8. (a) Equipment and sensors used for measuring air temperature, (b) placement of temperature sensors, and (c) placement of CO2 sensors in both Amphitheater and Exhibition.
A macro for window control was developed in IDA-ICE to validate measured data from the existing ventilation system of the Climate House, which combines natural ventilation via window openings with mechanical support (Figure 9). This macro operates using PI control, and when either the room temperature exceeds 21°C or the CO2 level surpasses 650 ppm, the windows gradually open to maintain the setpoints. The “Max” control ensures that the higher of the two signals (0–1) takes priority and activates the window opening accordingly. The mechanical ventilation is set to activate at 700 ppm CO2. In other words, the windows will open first, and if that is not sufficient, the mechanical ventilation will be activated. This is how the building currently operates.
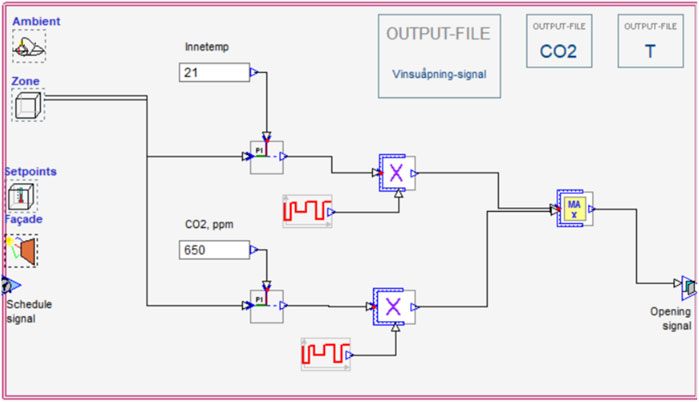
Figure 9. Macro for a window-opening strategy prioritizing natural ventilation, with mechanical ventilation used as a supplementary system for validating the current ventilation setup in the Climate House.
5 Results
5.1 Validation results
Figure 10 presents a comparison between the measured and simulated air temperatures at the two measurement points illustrated in Figure 8. The temperature fluctuations fall within the expected sensor error range and generally align well with the measured variations in both the Amphitheater and Exhibition areas.
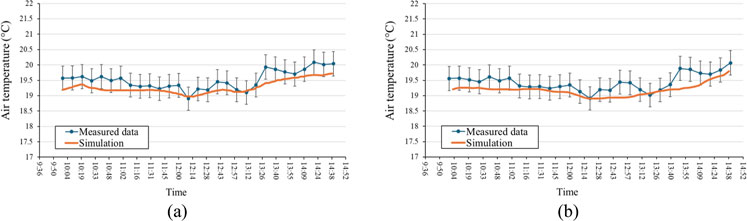
Figure 10. Air temperature trends at the selected sensor locations for (a) Amphitheater and (b) Exhibition.
Similarly, Figure 11 shows a comparison between the measured and simulated air temperatures at the two measurement points illustrated in Figure 8. While the simulation results generally follow the measured trends, some deviations are observed. These discrepancies may be attributed to the fact that CO2 levels in the measurements were recorded at specific points, whereas the simulation provided only an average value, which could account for the differences.
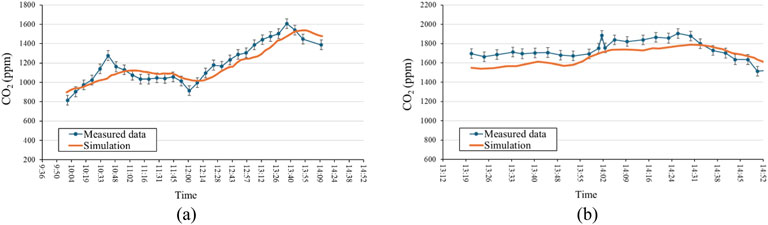
Figure 11. CO2 concentration trend at the selected sensor locations for (a) the Amphitheater and (b) the Exhibition area.
5.2 Analysis of energy use and indoor climate in climate house
Figure 12 presents the variations in operative temperature and window opening signals on the coldest winter day in the Amphitheater, under the existing hybrid ventilation system in the Climate House. During winter operation in mixed-mode ventilation, the windows are required to open to control indoor CO2 levels. However, this introduces significant drops in indoor temperature, making it difficult to maintain thermal comfort.
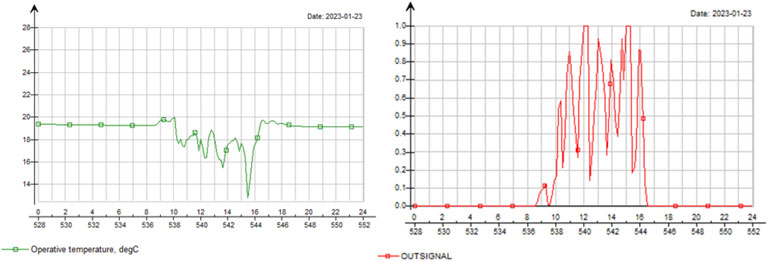
Figure 12. Operative temperature (left) and window opening degree (right) in the Amphitheater under the Blindern, Oslo Historic climate scenario.
When the outdoor temperature reached −15°C, the operative temperature in the Amphitheater fell below 13°C. These temperature reductions occurred exclusively during occupancy hours when the Climate House primarily relies on natural ventilation through window openings. User feedback further confirms that the current hybrid ventilation control system is ineffective, likely due to the reliance on natural ventilation as the primary system, with mechanical ventilation serving only as secondary support.
The thermal comfort results for both new HV and MV are presented in Figure 13. The operative temperature predominantly remains near the lower threshold for extended periods. Temperature fluctuations are significantly more pronounced in the Amphitheater compared to the Exhibition across both ventilation strategies. Among the analyzed scenarios, the Amphitheater with HV presents the greatest challenge in maintaining a stable operative temperature, with a total of 41 h exceeding 26°C. According to the adaptive thermal comfort model, the operative temperature under HV remains within Category II for the majority of the time, with only 8 h of exceedance in the Amphitheater and 1 h in Exhibition (as shown in Table 7).
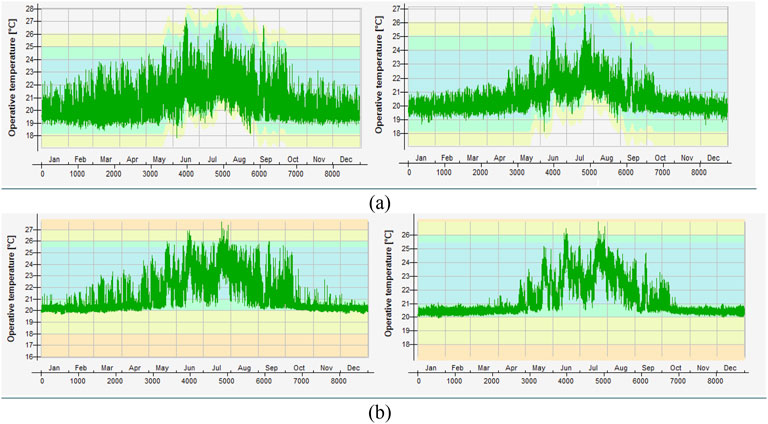
Figure 13. Operative temperature in the Amphitheater (left) and Exhibition (right) for (a) HV and (b) MV, categorized according to NS-EN 16798-1. The colored thresholds correspond to the thermal comfort categories defined in NS-EN 16798-1: Category I (High)—Light blue, Category II (Medium)—Light green, Category III (Moderate)—Light yellow, and Category IV (Low)—Light orange.
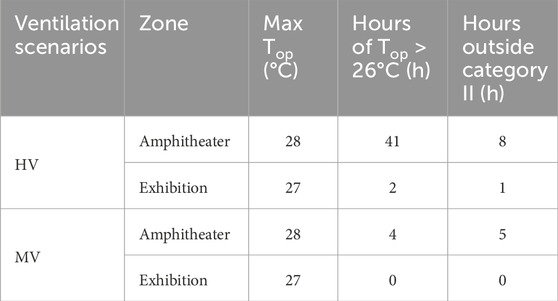
Table 7. Analysis of thermal comfort criteria for both MV and HV.
In contrast, MV demonstrates better thermal stability, with just 5 h outside Category II in the Amphitheater and none in the Exhibition. The larger window areas and a greater reliance on window openings contribute to the increased temperature variability in the Amphitheater, particularly in the HV scenario. The maximum operative temperature is relatively consistent across both zones and ventilation strategies, reaching approximately 27°C. While MV ensures a more stable indoor temperature, much of the temperature variation occurs outside operating hours, reducing its impact on overall thermal comfort assessment.
To assess the risk of draft (DR%), a detailed zone analysis was conducted using IDA-ICE 5.0. The grid resolution of the model is 0.2 m × 0.2 m with time interval 0.25 h. The analysis was performed for two different days, one in winter and one in summer. Figure 14 presents the DR% for the coldest winter day (23rd January), with an outdoor temperature of −15°C. The analysis was conducted at 15 O’clock, during which the window opening percentage was limited to 15%.
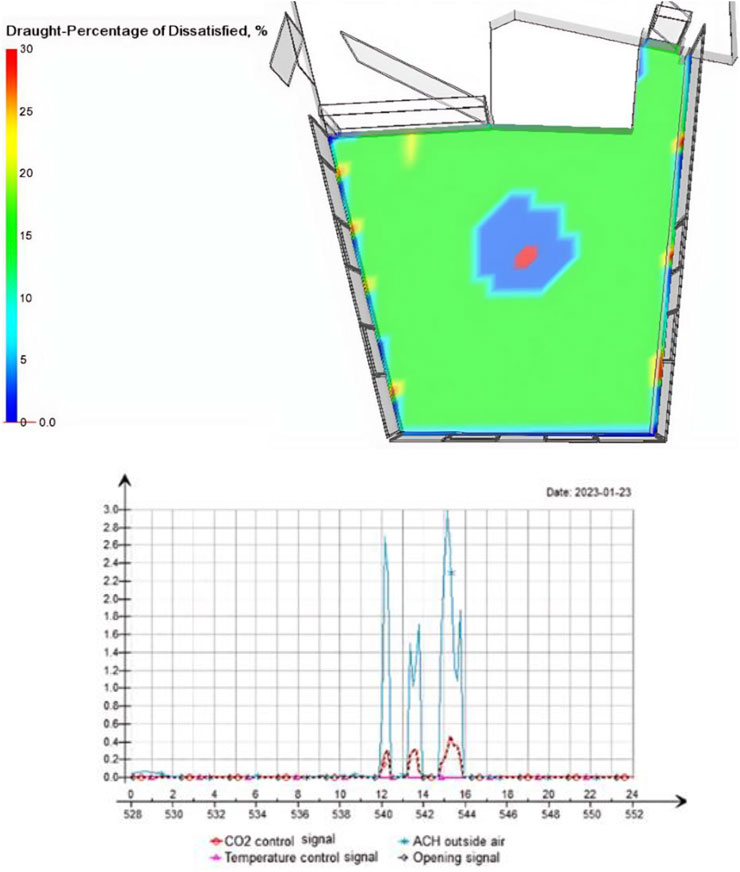
Figure 14. Detailed zone analysis of perceived draught in the Amphitheater (top) and the corresponding average indoor air temperature and CO2 signal (bottom) under HV on the coldest winter day.
During this time period, the ACH reached three, achieved through window opening in response to CO2 levels, as indicated by the control signals, temperature control was inactive, and window operation followed the CO2 signal. A noticeable draft was observed near the door to the Exhibition area, while draft levels near the windows remained minimal. DR% across the zone was approximately 10%–13%. The concentrated draft in the center corresponds to the location of the single supply air vent in the Amphitheater, which leads to elevated airflow velocities and explains the draft sensation in that area. The results show a significant DR% under HV during extremely cold winter days when using the proposed new control strategy, an outcome not achievable with the current model.
Figure 15 illustrates the average surface temperature across horizontal cross-sections at different heights within space. The simulation was performed for a winter day with an outdoor temperature of approximately −9°C. According to NS-EN ISO 7730 (Standard Norge, 2005), the maximum permissible vertical temperature difference is defined as heights ranging from 0.1 to 1.1 m above the floor. The average surface temperature values shown are calculated by IDA-ICE, following the method described in Javed et al. (2021). The results indicate that while opening the windows leads to a decrease in air temperature, it remains within a comfortable range. Notably, the vertical temperature difference is lower when the windows are open, approaching ∼0°C. This reduction is likely attributed to enhanced air mixing, as the substantial temperature gradient between indoor and outdoor air drives cold air inflow, promoting effective ventilation.
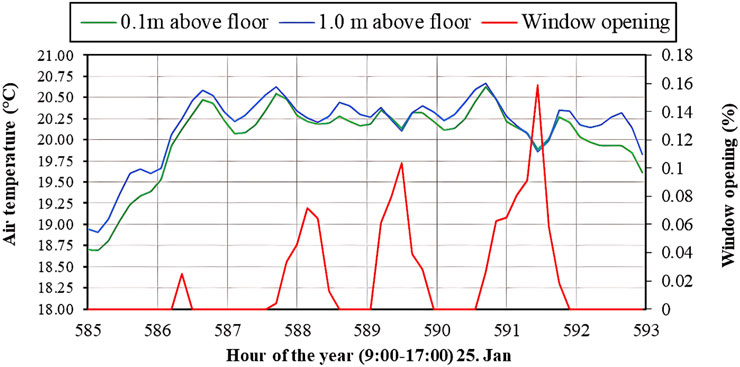
Figure 15. Vertical air temperature difference with window opening in the Amphitheater for January 25th.
The air quality in terms of CO2 concentration (ppm) for the Climate House is presented in Figure 16 for HV and MV scenarios. The data indicates occasionally high CO2 levels during occupancy but never exceeds the Norwegian Labour Inspection Authority’s guideline (Norwegian Labour Inspection Authority Arbeidstilsynet and in Norwegian, 2023), which sets a maximum CO2 level of 1,000 ppm. For HV, the upper threshold is 950 ppm, at which point the CO2 control system signals window openings. HV operates with an upper threshold of 950 ppm, triggering window openings, whereas MV is set at 900 ppm.
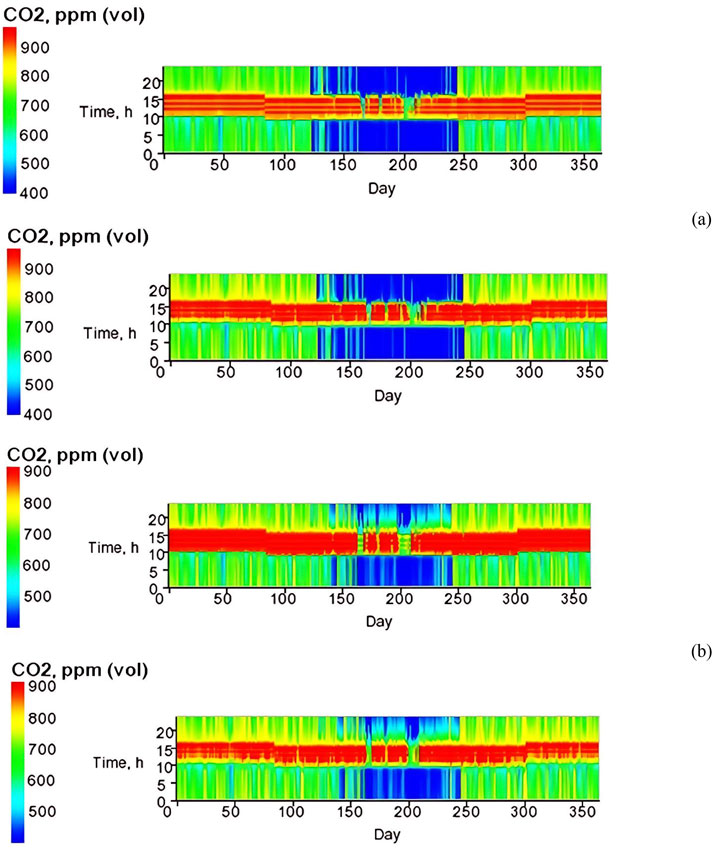
Figure 16. “Carpet plot” for air quality measured in ppm CO2 for (a) HV and (b) MV and for the Amphitheater (upper) and Exhibition (lower) in each ventilation scenario.
In HV scenario, elevated CO2 levels persist longer in the exhibition area, likely due to fewer windows compared to the amphitheater. In contrast, for MV, higher CO2 levels are more pronounced in the amphitheater, driven by a higher occupant density relative to room size. Notably, HV demonstrates superior CO2 reduction efficiency during night ventilation, effectively lowering concentrations to 400 ppm over extended periods compared to MV.
Furthermore, air quality improvements are more pronounced in HV during the warmest summer periods, benefiting from enhanced ventilation rates that not only regulate temperature but also optimize air exchange. This suggests that HV offers a dynamic and responsive strategy by leveraging natural airflow to enhance indoor air quality while maintaining thermal comfort. This is supported by Table 8, which shows a lower number of occupancy hours with CO2 concentrations exceeding 800 ppm in the HV scenario.
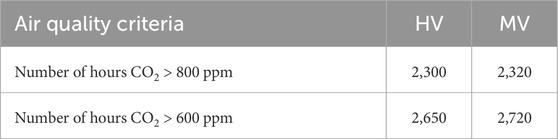
Table 8. Number of occupied hours with CO2 concentrations exceeding 600 and 800 ppm.
Figure 17 illustrates the energy consumption for heating, cooling, and fan operation in the Climate House equipped with HV and MV systems.
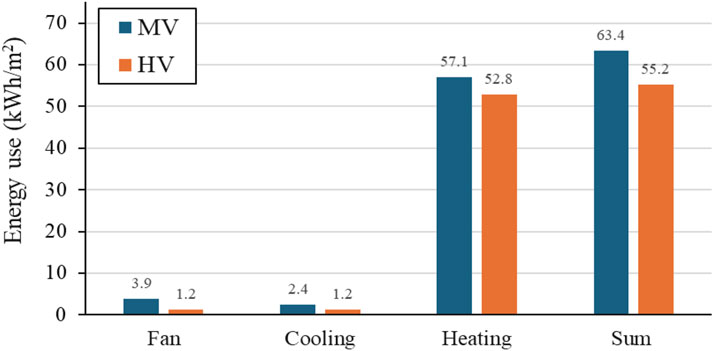
Figure 17. Energy use of the Climate House with mechanical ventilation and hybrid ventilation.
5.3 Analysis of energy use and indoor climate in climate house with future climate
Figure 18 presents a diagram illustrating the percentage of occupancy time during which windows are open in the Amphitheater. The innermost circle serves as a reference, representing window opening under the current climate conditions. By 2050, there is already an increase of approximately 10%, with minimal variation between different climate models—window opening times range from 26% for RCP 2.6%–29% for RCP 8.5. However, by 2100, a more significant divergence emerges between future climate scenarios, with windows expected to be open for 27% of the time under RCP 2.6 and 39% under RCP 8.5. This trend is anticipated, as higher outdoor temperatures increase cooling demand.
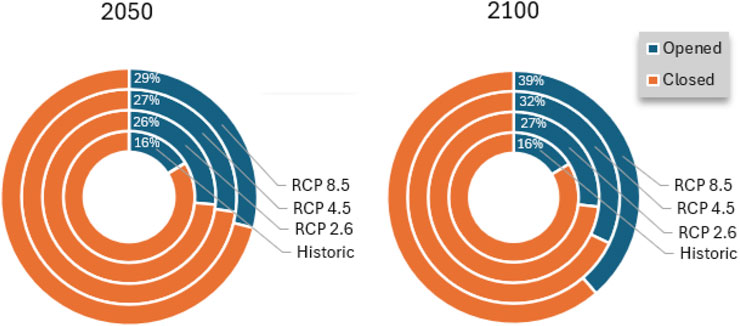
Figure 18. Percentage of occupancy time with open windows in Amphitheater for different climate data.
Figure 19 presents the thermal comfort analysis for the Climate House with both HV and MV. Dissatisfaction percentages (PPD) are calculated exclusively during occupancy hours, omitting non-operational periods. For MV, the percentage of dissatisfied occupants rarely exceeds 25%, aligning with the Category IV threshold in NS-EN 16798-1. Similarly, for HV, PPD values above 25% are infrequent. However, under the RCP 8.5 scenario for 2100, HV faces challenges in maintaining acceptable indoor temperatures during summer months, resulting in elevated PPD levels. Specifically, 6.7% of occupancy time exceeds the 25% PPD threshold, primarily due to increased indoor temperatures. Nevertheless, considering the recommended commercial building limit of 10%, HV still demonstrates a clear advantage over MV under future climate conditions.
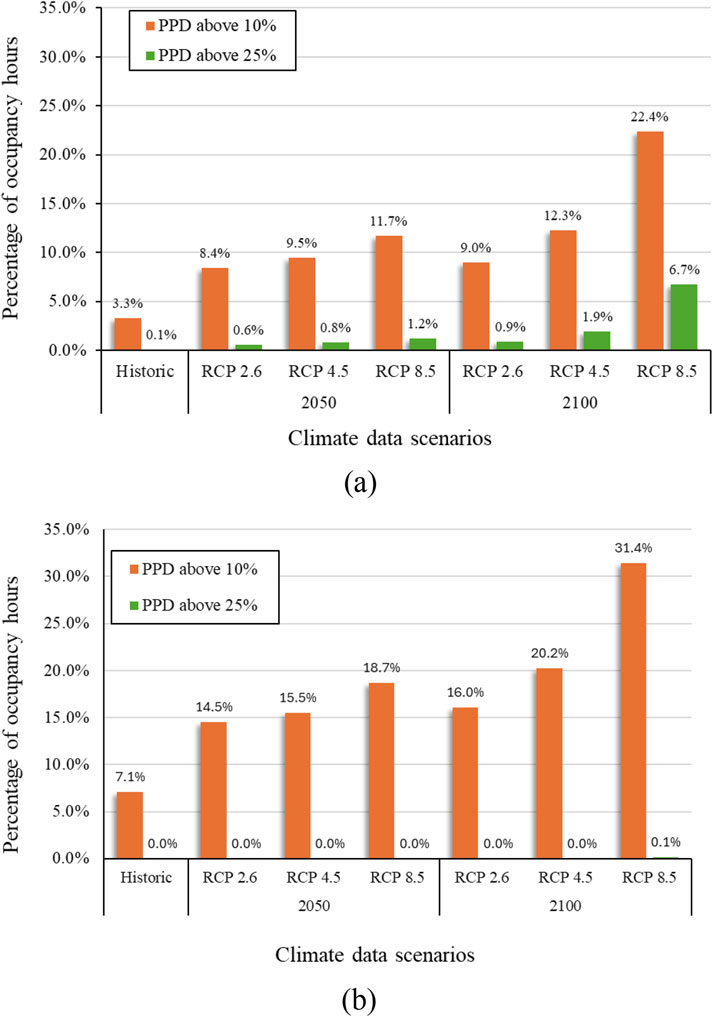
Figure 19. Annual thermal comfort performance of the Climate House under future climate scenarios, expressed as the percentage of occupied hours with PPD > 10% and >25% for (a) HV and (b) MV systems.
Based on the adaptive thermal comfort model according to NS-EN 16798-1 (Norsk Standard, 2019), the thermal indoor climate is satisfactory for all climate scenarios with hybrid ventilation. For the year 2100 with RCP 8.5, the Climate House with HV is only 23 h outside Category II. These results are not depicted in a figure but are derived from simulation data based on the adaptive model.
Figure 20 presents a 3D carpet plot illustrating indoor air quality under HV and MV for the Historic climate. Corresponding plots for future climate scenarios are provided in Supplementary Appendix 2. It is essential to distinguish the upper CO2 concentration limits for each strategy: 950 ppm for HV and 900 ppm for MV. In the plot, the width represents the hour of the day, the length corresponds to the day of the year, and the height indicates CO2 concentration. Notably, the blue region appears to expand in future scenarios, likely due to an increased demand for night ventilation driven by rising outdoor temperatures.
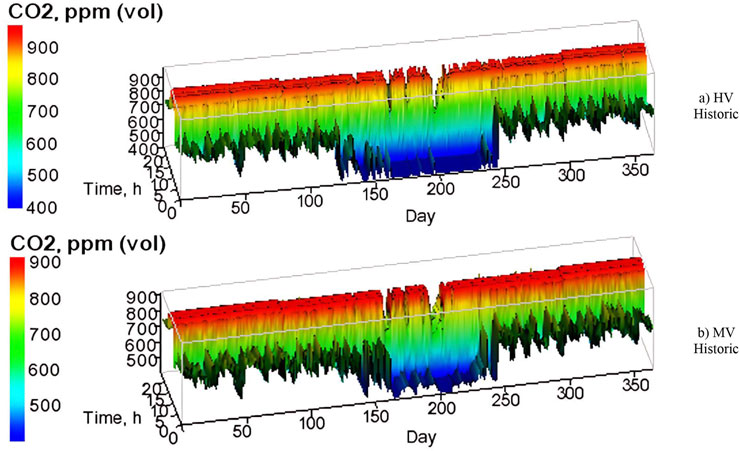
Figure 20. 3D carpet plot for air quality in ppm CO2 with (a) Hybrid ventilation and (b) mechanical ventilation for Historic climate scenario.
The results show that both ventilation strategies demonstrate improved air quality during summer, with this effect becoming more pronounced as temperatures rise, consequently increasing ventilation demand. Climate scenarios RCP 4.5 and RCP 8.5 show lower CO2 concentration (wider blue area) due to higher window opening percentage. Overall, the findings suggest that future climate change is unlikely to negatively impact indoor air quality in cold climate.
Figure 21 presents the simulated energy performance of the Climate House under mechanical ventilation (MV) and hybrid ventilation (HV) across various future climate scenarios. When simulated using historical climate data, HV achieves a 13.1% energy savings compared to MV. While both ventilation strategies contribute to energy reductions, HV demonstrates a more pronounced reduction.
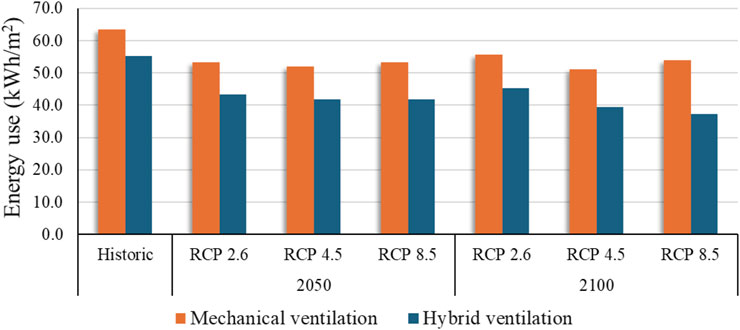
Figure 21. Building energy consumption for the Climate House with MV and HV under various future climate scenarios.
In the near future (2050), the projected energy savings with HV increase to approximately 20% compared to MV, marking a 7% point improvement relative to current conditions. By 2100, the energy savings vary significantly across different climate models, with HV yielding energy reductions of 19%–31%, depending on the scenario.
Rising outdoor temperatures amplify cooling demands. For MV, this results in higher fan power and increased cooling energy requirements. In contrast, HV can often rely on natural ventilation through window openings, reducing the need for mechanical cooling. This explains why energy savings with HV become more substantial as outdoor temperatures rise.
Figure 22 presents the energy consumption patterns for fan operation, cooling, and heating in the climate house with HV across various climate scenarios. The results indicate a clear decline in heating demand over time, accompanied by an increase in cooling requirements. In the historic climate scenario, heating constituted 96% of the building’s total energy use; however, under the RCP 8.5 scenario in 2100, this share is projected to drop to 66%. Despite variations in climate conditions, energy savings across different scenarios remain relatively stable. By 2100, under the RCP 8.5 scenario, energy savings for fan operation and heating improve by 5% and 1.6%, respectively, relative to the current climate, while cooling energy use increases by 5.1%. These findings highlight the HV system’s resilience and efficiency in future climate scenarios. Furthermore, Figure 23 reinforces these results by drawing comparisons with the MV system.
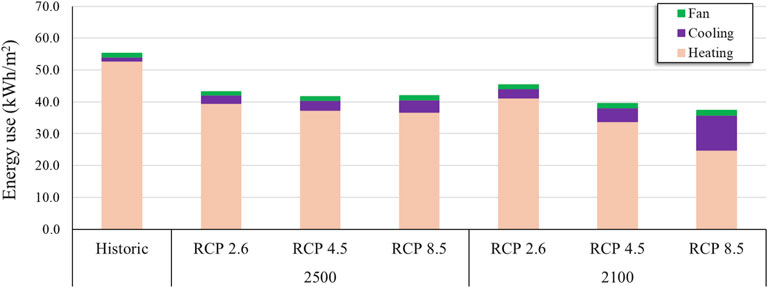
Figure 22. Energy use of the Climate House with HV, divided into energy posts under future climate conditions.
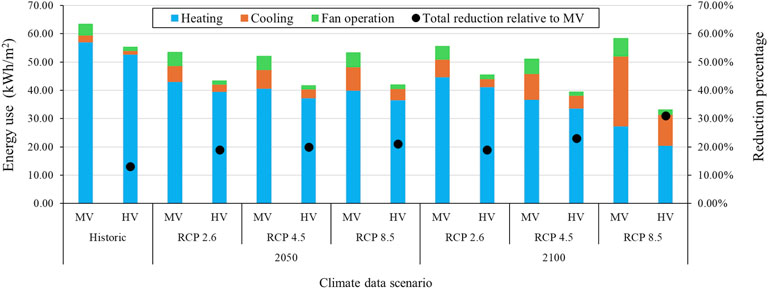
Figure 23. Percentage reduction in energy consumption across various building systems in the Climate House with HV relative to MV.
Figure 23 demonstrates that HV continues to outperform MV in warmer future climates, with increasing energy savings in heating, cooling, and fan operation.
6 Discussion and conclusion
This research evaluates the application of a hybrid ventilation (HV) control system for the Climate House, a nearly zero-energy building (nZEB) located in Oslo, Norway. The current hybrid ventilation strategy relies primarily on natural ventilation, with mechanical ventilation functioning as a supplementary system. However, this approach has shown shortcomings in maintaining thermal comfort and indoor air quality. Simulation results indicate poor thermal comfort, including significant temperature drops during winter and high heating demand.
The proposed hybrid ventilation strategy demonstrates the potential for approximately 13% energy savings compared to a fully mechanical ventilation (MV) system. The most substantial savings are observed in fan operation (70%) and cooling energy use (51%). Heating demand is also reduced by 7.6%, primarily because the hybrid system enables lower indoor temperatures while still maintaining comfort levels.
In contrast to the current system, the proposed HV control prioritizes mechanical ventilation to ensure thermal comfort and indoor air quality, while automated window openings are used as supplementary ventilation, mainly for cooling. The inclusion of heat recovery in the mechanical system minimizes ventilation heat losses, and night ventilation further supports passive cooling. Allowing slightly elevated CO2 levels—within acceptable regulatory thresholds—also contributes to energy savings.
Heating energy reductions are further enhanced by replacing continuous mechanical ventilation heating with pulse ventilation via automated window openings, especially during winter periods when ventilation demand is high due to increased CO2 levels.
The strategy also performs well under future climate scenarios. By 2100, under RCP 8.6, total energy savings may reach 31%. While the system remains effective up to 2050, under RCP 8.5 in 2100 some overheating occurs, with adaptive thermal comfort thresholds exceeded for only 23 occupied hours annually. To maintain performance under extreme climate conditions, adjustments such as extended night ventilation, increased airflow on the hottest days, and refined control settings will be essential.
It is important to acknowledge a key limitation of this study related to model validation. Due to the shared energy metering system between the Climate House and the adjacent Natural History Museum, it was not possible to isolate the Climate House’s specific energy use. This restricted the ability to directly validate simulated energy consumption against measured values. Consequently, the validation approach focused instead on indoor environmental parameters, particularly air temperature and CO2 concentration. While this provides confidence in the model’s ability to replicate indoor conditions, the lack of direct energy use validation introduces some uncertainty regarding the absolute energy savings.
Despite this limitation, the results strongly suggest that the proposed hybrid ventilation control strategy offers a robust pathway to improved energy performance, indoor comfort, and climate resilience in low-energy buildings.
Data availability statement
The raw data supporting the conclusion of this article will be made available by the authors, without undue reservation.
Author contributions
MdR: Writing – original draft, Project administration, Methodology, Supervision, Conceptualization, Writing – review and editing. SS: Formal Analysis, Methodology, Writing – original draft, Data curation, Investigation, Conceptualization, Visualization, Software. MaR: Writing – review and editing, Formal Analysis, Methodology.
Funding
The author(s) declare that no financial support was received for the research and/or publication of this article.
Conflict of interest
Author SS was employed by Multiconsult AS.
The remaining authors declare that the research was conducted in the absence of any commercial or financial relationships that could be construed as a potential conflict of interest.
Generative AI statement
The author(s) declare that no Generative AI was used in the creation of this manuscript.
Publisher’s note
All claims expressed in this article are solely those of the authors and do not necessarily represent those of their affiliated organizations, or those of the publisher, the editors and the reviewers. Any product that may be evaluated in this article, or claim that may be made by its manufacturer, is not guaranteed or endorsed by the publisher.
Supplementary material
The Supplementary Material for this article can be found online at: https://www.frontiersin.org/articles/10.3389/fbuil.2025.1606399/full#supplementary-material
Footnotes
1Setpoint for window opening.
References
Ahmadi, Z. (2023). The impact of window opening as a hybrid ventilation technology on thermal indoor climate and energy use in Klimahuset (in Norwegian), Master thesis. Oslo, Norway: Oslo Metropolitan University.
Algrøy, M. (2014). Energy use and indoor climate in schools and kindergartens with “mixed-mode” ventilation (Norwegian), Master thesis. Trondheim, Norway: NTNU.
Bamdad, K., Matour, S., Izadyar, N., and Omrani, S. (2022). Impact of climate change on energy saving potentials of natural ventilation and ceiling fans in mixed-mode buildings. Build. Environ. 209, 108662. doi:10.1016/J.BUILDENV.2021.108662
Buvik, K. (2003). Environmentally friendly school facilities: five schools associated with the ØkoBygg program. Available online at: http://skoleanlegg.ls.no/.
Cao, X., Dai, X., and Liu, J. (2016). Building energy-consumption status worldwide and the state-of-the-art technologies for zero-energy buildings during the past decade. Energy Build. 128, 198–213. doi:10.1016/J.ENBUILD.2016.06.089
Cedeño Laurent, J. G., MacNaughton, P., Jones, E., Young, A. S., Bliss, M., Flanigan, S., et al. (2021). Associations between acute exposures to PM2.5 and carbon dioxide indoors and cognitive function in office workers: a multicountry longitudinal prospective observational study. Environ. Res. Lett. 16, 094047. doi:10.1088/1748-9326/ac1bd8
Chaudhary, G., Johra, H., Georges, L., and Austbø, B. (2025). Predicting the performance of hybrid ventilation in buildings using a multivariate attention-based biLSTM Encoder-Decoder.
Crawley, D. B., Lawrie, L. K., Winkelmann, F. C., Buhl, W. F., Huang, Y. J., Pedersen, C. O., et al. (2020). Typical meteorological year (TMYx) datasets. Clim. OneBuilding.Org. Available online at: https://climate.onebuilding.org.
Deng, T., Shen, X., Cheng, X., and Liu, J. (2020). Investigation of window-opening behaviour and indoor air quality in dwellings situated in the temperate zone in China. Indoor Built Environ. 30, 938–956. doi:10.1177/1420326X20924746
Fanger, P. O. (1970). Thermal comfort: analysis and applications in environmental engineering. Copenhagen: Danish Technical Press.
Gilani, S., and O’Brien, W. (2021). Natural ventilation usability under climate change in Canada and the United States. Build. Res. and Inf. 49, 367–386. doi:10.1080/09613218.2020.1760775
Grimsbo Øgård, Y. (2014). Ventilative cooling for schools and kindergartens, Master thesis. Trondheim, Norway: NTNU.
Haktorson, I. (2018). “Indoor climate and energy use with balanced ventilation vs. hybrid ventilation in new mass timber buildings,” in Skonnertveien hageby (in Norwegian). Kristiansand, Norway: University of Agder.
Hamdy, M., and Mauro, G. M. (2019). Optimizing hybrid ventilation control strategies toward zero-cooling energy building. Front. Built Environ. 5. doi:10.3389/fbuil.2019.00097
Heiselberg, P. (2025). Annex 35- control strategies for hybrid ventilation in new and retorfitted office buildings (HybVent), 1998–2002.
Hsu, H. C., Chang, C. W., Chen, C. C., and Pan, C. Y. (2024). Natural ventilation: optimizing window opening size for CO2 concentration control and thermal comfort on nonwindward facades. Indoor Air 2024. doi:10.1155/2024/1435400
Javed, S., Ørnes, I. R., Dokka, T. H., Myrup, M., and Holøs, S. B. (2021). Evaluating the use of displacement ventilation for providing space heating in unoccupied periods using laboratory experiments, field tests and numerical simulations. Energies (Basel) 14, 952. doi:10.3390/en14040952
Jylhä, K., Jokisalo, J., Ruosteenoja, K., Pilli-Sihvola, K., Kalamees, T., Seitola, T., et al. (2015). Energy demand for the heating and cooling of residential houses in Finland in a changing climate. Energy Build 99 104–116. doi:10.1016/j.enbuild.2015.04.001
Karlsen, L. R., Nikolaisen, K. F., Hansen, E., Ørnes, I. R., and Marini, A. (2021). RIF industry guidelines for indoor thermal climate - association of Consulting Engineers in Norway (Norwegian).
Kottek, M., Grieser, J., Beck, C., Rudolf, B., and Rubel, F. (2006). World Map of the Köppen-Geiger climate classification updated. Meteorol. Z. 15, 259–263. doi:10.1127/0941-2948/2006/0130
Liu, W., Burak, G. H., and and Ouf, M. M. (2021). Modeling window and thermostat use behavior to inform sequences of operation in mixed-mode ventilation buildings. Sci. Technol. Built Environ. 27, 1204–1220. doi:10.1080/23744731.2021.1936629
Meteotest, M. (2020). Global meteorological database, version 8, meteotest AG. Available online at: https://www.meteonorm.com.
Naili, B., Háber, I., and Kistelegdi, I. (2023). Natural ventilation in high-rise office building – comfort and energy performance. Pollack Period. 18, 52–57. doi:10.1556/606.2023.00839
Norsk Standard (2019). EN 16798-1:2019 Energy performance of buildings - ventilation for buildings - Part 1: indoor environmental input parameters for design and assessment of energy performance of buildings addressing indoor air quality, thermal environment, lighting and acoustics Module M1-6.
Norwegian Labour Inspection Authority (Arbeidstilsynet, in Norwegian) (2023). Indoor Air Qual. Requir. Available online at: https://www.arbeidstilsynet.no/arbeidsmiljo/inneklima/.
Peng, Y., Lei, Y., Tekler, Z. D., Antanuri, N., Lau, S. K., and Chong, A. (2022). Hybrid system controls of natural ventilation and HVAC in mixed-mode buildings: a comprehensive review. Energy Build. 276, 112509. doi:10.1016/J.ENBUILD.2022.112509
Pérez-Lombard, L., Ortiz, J., and Pout, C. (2008). A review on buildings energy consumption information. Energy Build. 40, 394–398. doi:10.1016/J.ENBUILD.2007.03.007
Rabani, M., and Petersen, A. J. (2023). Detailed assessment of hybrid ventilation control system in a mixed-mode building in cold climate. J. Phys. Conf. Ser. IOP Publishing Ltd 2600. 102006. doi:10.1088/1742-6596/2600/10/102006
RESHYVENT Consortium (2005). RESHYVENT: demand controlled hybrid ventilation in residential buildings.
Rode, C. (2025). Annex 68 design and operational strategies for high IAQ in low energy buildings, 2014-2020.
Sánchez-García, D., Rubio-Bellido, C., del Río, J. J. M., and Pérez-Fargallo, A. (2019). Towards the quantification of energy demand and consumption through the adaptive comfort approach in mixed mode office buildings considering climate change. Energy Build. 187, 173–185. doi:10.1016/J.ENBUILD.2019.02.002
Seppanen, O., Fisk, W. J., and Faulkner, D. (2003). Cost-benefit analysis of night-time ventilative cooling in office buildings. Available online at: https://escholarship.org/uc/item/3j82f642.
Standard Norge (2005). NS-EN ISO 7730 – ergonomics of the thermal environment – analytical determination and interpretation of thermal comfort using calculation of the PMV and PPD indices and local thermal comfort criteria.
Stocker, T. F., Qin, D., Plattner, G.-K., Tignor, M. M. B., Allen, S. K., Boschung, J., et al. (2013). “Summary for policymakers,” in Climate change: the physical science basis. Contribution of working group I to the Fifth assessment Report of the (Intergovernmental Panel on Climate Change). Cambridge, United Kingdom: Cambridge University Press.
TEK17 (2017). Technical regulations for planning and execution of construction work. §13-4 thermal indoor climate. Oslo, Norway: Norwegian Ministry of Local Government and Modernisation.
Wang, I., Resch, E., Civitas, S., Stoknes, S., Aasen Vadseth, R., and Hahn, U. (2022). FutureBuilt ZERO-O-Kriterier, regneregler og metode for klimagassberegninger for områder. Available online at: www.futurebuilt.no.
Wang, L., Liu, X., and Brown, H. (2017). Prediction of the impacts of climate change on energy consumption for a medium-size office building with two climate models. Energy Build. 157, 218–226. doi:10.1016/J.ENBUILD.2017.01.007
Keywords: NZEB, hybrid ventilation, mechanical ventilation, future climate, building energy saving, indoor climate
Citation: Rabani M, Sønderland S and Rabani M (2025) Exploring hybrid ventilation in cold climates: energy efficiency, thermal comfort, and future climate adaptation in a nZEB case study in Norway. Front. Built Environ. 11:1606399. doi: 10.3389/fbuil.2025.1606399
Received: 05 April 2025; Accepted: 23 June 2025;
Published: 14 July 2025.
Edited by:
Andrew Wright, De Montfort University, United KingdomReviewed by:
Roberto Stasi, Politecnico di Bari, ItalyCaroline Hoffmann, Fachhochschule Nordwestschweiz, Switzerland
Copyright © 2025 Rabani, Sønderland and Rabani. This is an open-access article distributed under the terms of the Creative Commons Attribution License (CC BY). The use, distribution or reproduction in other forums is permitted, provided the original author(s) and the copyright owner(s) are credited and that the original publication in this journal is cited, in accordance with accepted academic practice. No use, distribution or reproduction is permitted which does not comply with these terms.
*Correspondence: Mehrdad Rabani, bWVocmFiQG9zbG9tZXQubm8=