 Nadiah Abu1*
 Norahayu Othman1
 Nur’ Syahada Ab Razak1
 Nurul Ainaa’ Adilah Rus Bakarurraini1Siti Nurmi Nasir1
 Joanne Ern Chi Soh1Luqman Mazlan2Zairul Azwan Mohd Azman2
 Rahman Jamal1
- 1UKM Medical Molecular Biology Institute, UKM Medical Center, Universiti Kebangsaan Malaysia, Kuala Lumpur, Malaysia
- 2Department of Surgery, UKM Medical Center, Universiti Kebangsaan Malaysia, Kuala Lumpur, Malaysia
Colorectal cancer (CRC) is one of the most widely diagnosed cancers worldwide. It has been shown that the body-mass index (BMI) of the patients could influence the tumor microenvironment, treatment response, and overall survival rates. Nevertheless, the mechanism on how BMI affects the tumorigenesis process, particularly the tumor microenvironment is still elusive. Herein, we postulate that extracellular vesicles (EVs) from CRC patients and non-CRC volunteers with different BMI could affect immune cells differently, in CD8 T cells particularly. We isolated the EVs from the archived serum of CRC patients with high and low BMI, as well as healthy controls with similar BMI status. The EVs were further characterized via electron microscopy, western blot and dynamic light scattering. Then, functional analysis was performed on CD8 T cells including apoptosis, cell proliferation, gene expression profiling and cytokine release upon co-incubation with the different EVs. Our results suggest that CRC-derived EVs were able to regulate the CD8 T cells. In some assays, low BMI EVs were functionally different than high BMI EVs. This study highlights the possible difference in the regulatory mechanism of cancer patients-derived EVs, especially on CD8 T cells.
Introduction
Colorectal cancer (CRC) remains one of the most widely diagnosed cancers worldwide (Bray et al., 2018). Unfortunately, CRC also contributes to a major portion of the number of cancer-associated mortalities (Bray et al., 2018). Several risk factors could lead to the development of CRC such as diet, lifestyle and genetic makeup. One of the other factors influencing the risk of developing CRC is obesity or having a high body mass index (BMI) (Jochem and Leitzmann, 2016; Martinez-Useros and Garcia-Foncillas, 2016). It was shown that individuals with BMI > 25 kg/m2 have a higher risk of developing CRC than individuals with a BMI of < 25 kg/m2 (Murphy et al., 2000). This association is strong and has been shown in multiple cohort studies (Murphy et al., 2000; Jochem and Leitzmann, 2016). Nevertheless, although higher BMI is associated with higher CRC risk, the survival rate of these patients tends to be better than patients with lower BMI (Aparicio et al., 2018; Shahjehan et al., 2018; Tran et al., 2018). Nevertheless, studies show that BMI did not affect any chemotherapy-based side effects or benefit (Meyerhardt et al., 2003; Sinicrope et al., 2013). In terms of immunotherapy, it has been shown that higher BMI subjects respond better to immune checkpoint inhibitors (Cortellini et al., 2019; Wang et al., 2019). Furthermore, a recent study by Berntsson et al. (2019), suggested that the density of different immune cells within CRC tumors differs based on the BMI status. For instance, it was shown that obesity was associated with a lower percentage of PD-L1 + tumors, but a higher percentage of CD8T cells (Berntsson et al., 2019). Obesity or BMI status likely influences the immune landscape of cancer patients. Nevertheless, our understanding of the link between immunity-obesity-cancer is still preliminary. The effects of treatment in CRC can also be divided based on the metastatic potential of the tumors, this is also in relation to the microsatellite stability of the cancers (Picard et al., 2020). Metastasis is one of the major causes of cancer-related deaths and is found in 20% of CRC cases upon diagnosis (Riihimäki et al., 2016). In terms of immunotherapy, it has been shown that CRC patients with microsatellite instability (MSI) benefit better to this treatment than MSS cancers (Picard et al., 2020).
The efficacy of the immune system is multifaceted, and a lot of factors can influence the immune mechanism. It has been put forward that extracellular vesicles (EVs) can affect the activity of various immune cells such as T cells, natural killer cells and dendritic cells (Whiteside, 2017). EVs are membranous vesicles that are released from cells as circulating entities and can be found in various bodily fluids including serum, urine, and saliva (Whiteside, 2017; Othman et al., 2019). EVs can be divided into several subsets such as microvesicles, exosomes and small EVs (Szatanek et al., 2017). The functional role of EVs is diverse, especially in the tumor setting. For instance, EVs have been shown to have pro- and inflammatory roles when it comes to the tumor microenvironment (Dörsam et al., 2018; Othman et al., 2019). More importantly, tumor-derived EVs have been shown to suppress lymphocyte activity, particularly in CD8 T cells (Muller et al., 2016; Ludwig et al., 2017; Maybruck et al., 2017; Dörsam et al., 2018). For instance, a study by Ludwig et al. (2017) has shown that exosomes derived from head and neck cancers were more immunosuppressive than exosomes from healthy subjects. Concerning BMI or obesity, EVs have been shown to be novel regulators especially when it comes to metabolic-related complications (Kim et al., 2018). Therefore, here we postulate that the presence of cancer as well as the difference in BMI may also impact the function of EVs especially in terms of regulating CD8 T cells.
Materials and Methods
Clinical Samples
Serum samples from high BMI-CRC (n = 13) and low BMI-CRC (n = 15) were obtained from UMBI’s biobank. For the healthy, non-CRC controls, serum samples of high BMI-non-CRC (n = 15) and low BMI-non-CRC (n = 15) were obtained from The Malaysian Cohort biobank. Samples were obtained from participants with no history of cancer after the second follow-up phase (post 5 years of the initial phase). Serum samples were obtained from healthy non-CRC individuals as well as individuals who were CRC patients with a BMI that falls within the accepted range (high BMI ≥ 25.0 kg/m2, low BMI ≥ 18.5– ≤ 25.0 kg/m2) since we are using Asian samples (WHO Expert Consultation, 2004; Lim et al., 2017). Blood was also obtained from healthy individuals for lymphocyte isolation. The study was approved by the Research Human Ethics Committee of the Universiti Kebangsaan Malaysia (UKM) (UKM PPI/111/8/JEP-2018-164). All participants gave written informed consent. This study was conducted in concordance with UKM’s standard biosecurity and institutional safety procedures.
Extracellular Vesicle Isolation
Total EVs were isolated from serum samples using the Total Exosome Isolation (from serum) kit (Invitrogen, United States). Briefly, 50 μl of serum was transferred to a new tube and 0.2 volumes of the Total Exosome Isolation reagent was added. The serum/reagent mixture was mixed well by vortexing and the samples were incubated at 4°C for 45 min. Samples were then centrifuged at 11,000 × g for 15 min. The supernatant was then removed and the total EVs were resuspended in 1 × PBS.
Transmission Electron Microscopy (TEM)
Total EVs were diluted to 1:1000 in PBS. Five microliters of diluted EVs were pipetted onto Formvar-carbon coated EM grids and left aside to allow membranes adsorption for 20 min. The vesicles-coat grids were fixed with 0.6% glutaraldehyde for 4 min and washed twice with distilled water for 1 min each. The grids were stained with 2% uranyl acetate at pH 7 for 5 min. Finally, the grids were viewed using a transmission electron microscope. This method has been previously conducted by our lab (Hon et al., 2019).
Zeta-Sizer Analysis
Particle size measurement and zeta potential analysis of EVs were performed using the Zetasizer Nano ZS system (Malvern Instruments, Malvern, United Kingdom). EVs were diluted 1: 100 in sterile PBS to a total volume of 1 mL to be loaded into a disposable cuvette for particle size measurement. Data were acquired and analyzed using Zetasizer Software (V7.03) (Malvern Instruments). We have performed this assay according to our previous protocol (Hon et al., 2019).
Western Blot
Extracellular vesicles lysate was prepared by adding lysis buffer directly to an EV-enriched fraction in PBS and incubated on an orbital shaker at 4°C for 45 min. The mixture was centrifuged, and the supernatant was collected as protein lysate. Protein lysate was quantified using Bradford assay. Fifty μg of proteins were resolved on SDS-polyacrylamide gel electrophoresis (SDS-PAGE) and transferred to membrane. The membrane was blocked with 5% skimmed milk in TBS-T before incubated with primary antibodies at 4°C overnight. Primary antibodies used were mouse monoclonal anti-human TSG101 (Cat# NB200-112 Novus Biologicals, United States. 1:1000 dilution) and anti-human CD9 (Santa Cruz Biotechnology, United States). The membrane was washed with TBS-T before incubated with HRP-conjugated secondary antibodies at room temperature for 1 h. Finally, the blot was washed with TBS-T three times and incubated with Pierce ECL Western Blotting Substrate (Life Technologies, United States) for 10 min. Protein bands were visualized by chemiluminescence using the ChemiDoc MP Imaging System (Bio-Rad, United States).
Peripheral Blood Mononuclear Cells (PBMCs) Isolation
Fresh whole blood was collected from healthy adult individuals in an anticoagulant-treated EDTA collection tube and PBMCs isolated by Ficoll-Paque (GE Healthcare, United States) gradient centrifugation. Cells were washed in 1 × phosphate-buffered saline (PBS), counted and resuspended in RPMI 1640 medium (Nacalai Tesque, Japan), supplemented with 10% of EV-depleted fetal bovine serum (FBS) and 1% penicillin/streptomycin antibiotics. A portion of cells (50, 000 cells) was stained for analysis by flow cytometry, while the remaining cells underwent positive selection for CD8 T cells.
CD8 T Cell Isolation and Activation
The highly purified fraction of CD8 T cells were isolated from PBMC cells using the EasySep Human CD8 T Cell Positive Selection Kit II (Stemcell Technologies, Canada), according to the manufacturer’s protocol. A portion of cells was stained for analysis by flow cytometry, while the remaining cells were aliquoted into a T75 flask for T-cell activation. CD8 + T cells were maintained in complete RPMI medium (10% EV-depleted FBS, 1% penicillin/streptomycin), supplemented with 100 IU/ml of interleukin 2 (IL2) (Stemcell Technologies, Canada) and 25 ul of ImmunoCult Human CD3/CD28 T Cell Activator (Stemcell Technologies, Canada) per 1.0 × 10⁶ cells/ml. Cells were incubated at 37°C and 5% CO2 for 2–3 days.
PBMC Pre-sort and Post-sort Staining and Analysis
To view the different populations of cells in the PBMC suspension and the purified CD8 T cells fraction, cells were resuspended in 1 × PBS and transferred to a 5 ml polystyrene round-bottom tube. Cells were stained, on ice, with antibodies to anti-human CD4 (PE), anti-human CD8a (APC) and anti-human CD3 (FITC) (BioLegend, United States) for 30 min in the dark on a rotary shaker. Signals were detected from 1.0 × 10⁵ cell population using the BD FACSVerse flow cytometer (BD Biosciences, United States). The analysis was performed by gating the lymphocytes, followed by the CD3 expression and then the CD4 and CD8 expression. The analysis was performed using FCSExpress (De Novo Software, United States).
EV Uptake Analysis
To evaluate whether CD8 T cells interacted with EVs, the PKH26 Red Fluorescent Cell Linker Mini Kit (Sigma Aldrich, United States) was utilized to stain the membranes of EVs as per the manufacturer’s protocol. The experiment was performed based on the protocol by Ragni et al. (2017). Briefly, 50 μg of isolated EVs was resuspended in 100 μl Diluent C. Separately, 1.4 μl PKH26 dye was mixed with 300 μl of Diluent C. The two components were combined and gently mixed, and incubated at room temperature for 5 min. The fluorescent labeling reaction was stopped by adding 700 μl of 1% FBS, and the stained EVs were co-cultured with 50,000 CD8 T cells in cell culture medium. Following incubation, cells were harvested and gently centrifuged at 10,000 × g for 5 min. The cells were then resuspended in 1 × PBS and analyzed by flow cytometry. EVs without PKH26 dye was incorporated into CD8 T cells as negative controls.
Establishment of CD8 T Cell Cytokine Profile
Activated CD8 T cells were plated in a 96-well plate (1 × 10⁵ cells/well) in EV-free RPMI. EVs (5 μg/well) isolated from serum high BMI or low BMI CRC or non-CRC patients were added, and co-cultures were incubated for 24 h. Co-cultures containing no EVs (PBS) served as controls. Cell culture supernatant was collected and using the LEGENDplexTM Human CD8/NK Panel (BioLegend, United States), including IL-2, 4, 6, 10, 17A, IFN-γ, TNF-α, soluble Fas, soluble FasL, granzyme A, granzyme B, perforin, and granulysin was quantified by flow cytometry. The analysis was performed via the provided software LEGENDPlex Software v8 (BioLegend, United States).
Microarray
Activated CD8 T cells were plated and co-cultured with EVs in 96-well plates as previously described. Following 24 h incubation, total RNA was extracted from CD8 T cells using the AllPrep DNA/RNA/miRNA Universal Kit (Qiagen, Germany). RNA was quantified using the NanoDrop 2000C spectrophotometer (Thermo Fisher Scientific, United States) and integrity was analyzed using the Agilent 2100 Bioanalyzer (Agilent Technologies, United States). The total RNA was pooled into groups of three for each of the different groups, except for the LowBMI_CRC and control group, where we were only able to perform analysis on pooled groups of 2. Human gene expression microarray was then performed using the Agilent One-Color SurePrint G3 Human Gene Expression v3 Microarray (Agilent Technologies, United States). The feature extraction, gene expression analysis, and gene ontology analysis were performed using the Altanalyze software (Emig et al., 2010). For pathway enrichment analysis, we used the KEGG database (Kanehisa et al., 2016, 2019) on the Webgestalt platform (Liao et al., 2019).
Apoptosis V-FITC Apoptosis Assay
Activated CD8 T cells were plated and co-cultured with EVs in 96-well plates as previously described. Following 24 h incubation, apoptosis of CD8 + T cells was measured by flow cytometry using the FITC Annexin V Apoptosis Detection Kit (BD Pharmingen, United States). The experiment was performed with appropriate controls and was gated accordingly. Apoptotic cells were counted based on the early apoptotic population (AnnexinV-FITC + /PI-) and late apoptotic population (AnnexinV-FITC + /PI +).
CFSE Assay
CD8 T cells were stained with CFSE Dye (Invitrogen, United States) according to the manufacturer’s instructions before co-culturing with the selected EVs. After 3 days of incubation, the cells were subjected to flow cytometry (BD, United States). The analysis of cell proliferation was performed using the ModFit software (Veriti Software House, United States).
CIBERSORT Analysis
We obtained clinical data and gene expression data of CRC patients from the TCGA database1. The samples were divided based on the BMI status, by using the height and weight information obtained from the clinical data. The values from the RNA-Seq data were then entered into CIBERSORT (Newman et al., 2019). The CIBERSORT analysis was performed using the LM22 immune genes as a reference, and other default parameters (Chen et al., 2018). The samples were filtered based on p < 0.05 and we performed the Kruskal–Wallis non-parametric test.
Immune Cell Infiltration Assay
We performed the immune cell infiltration assay using 3D spheroids based on the protocol by Herter et al. (2017) and Courau et al. (2019). Briefly, 3D spheroids of HT-29 cells were generated by seeding 1500 cells/well in a 96 well plate covered with agarose. PBMC from healthy volunteers were obtained and pre-treated with the following group of EVs, Non-CRC-HighBMI (n = 9), Non-CRC-LowBMI (n = 9), CRC-High-BMI (n = 9), and CRC-Low-BMI (n = 9) overnight. The PBMC were then transferred to day 3 spheroids and left to incubate for 24 h. Afterward, the immune cells from the supernatant were harvested and pooled into groups of three for each treatment and were considered as the (= OUT) population. The spheroids were washed with ice-cold PBS and trypsinized. The disintegrated spheroids were also pooled into groups of three for each treatment and were considered as the (= IN) population. Both the OUT and IN population were stained with CD3 and CD8 fluorochrome-conjugated antibodies and subjected to flow cytometry.
Statistical Analysis
All data were presented as mean ± standard deviation (SD). Statistical analysis was performed using GraphPad Prism (version 6) as unpaired t-test or one-way ANOVA. Flow analyses were performed with BD FACSuite Software Application (V1.05.3841) (BD Biosciences, United States) and cytokine profile analyses were performed with LEGENDplex Data Analysis Software (BioLegend, United States). A p-value of ≤ 0.05 was considered statistically significant.
Results
Characterization of EVs
The demographic data of the samples are listed in Table 1. The EVs isolated from the serum of the samples were round and spherical as shown in the transmission electron microscopy images in Figure 1A. Besides electron microscopy, we also performed measurements via dynamic light scattering (DLS) as shown in Figure 1B. Table 2 depicts the mean and mode diameter of representative EVs within each of the groups. According to Table 2, the LowBMI-Non-CRC EVs had the highest mean and mode diameters (340.4 ± 24.52 and 281.86 ± 28.49 nm, respectively), whereas the LowBMI-CRC EVs had the lowest diameters (214.4 ± 12.55 and 98.49 ± 10.19 nm). Interestingly, there were opposite patterns of size between the CRC and the Non-CRC group if depending on the BMI status. Moreover, we also performed immunoblotting on the isolated EVs to detect specific markers, as evidenced in Figure 1C, all tested EVs expressed the EV-based markers TSG101 and CD9.
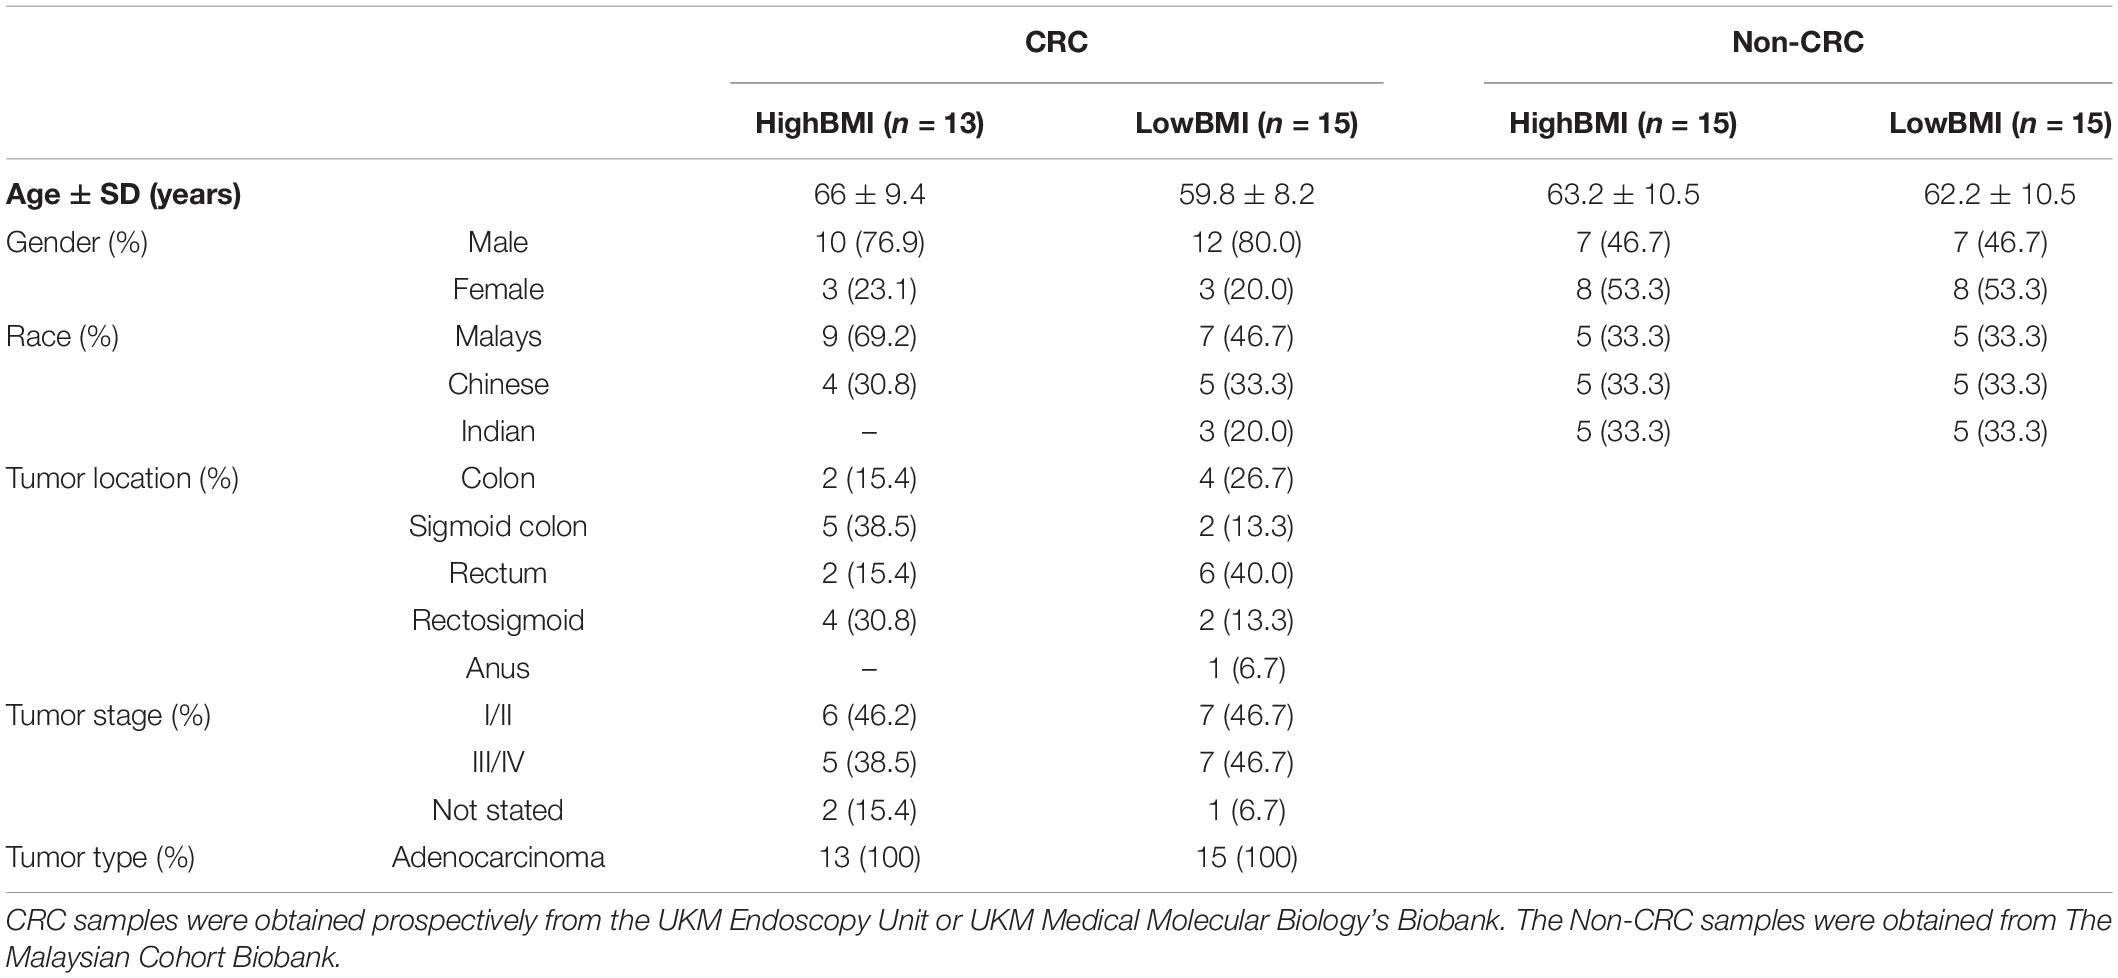
Table 1. Summary of the demographic profile of all samples included in the study.
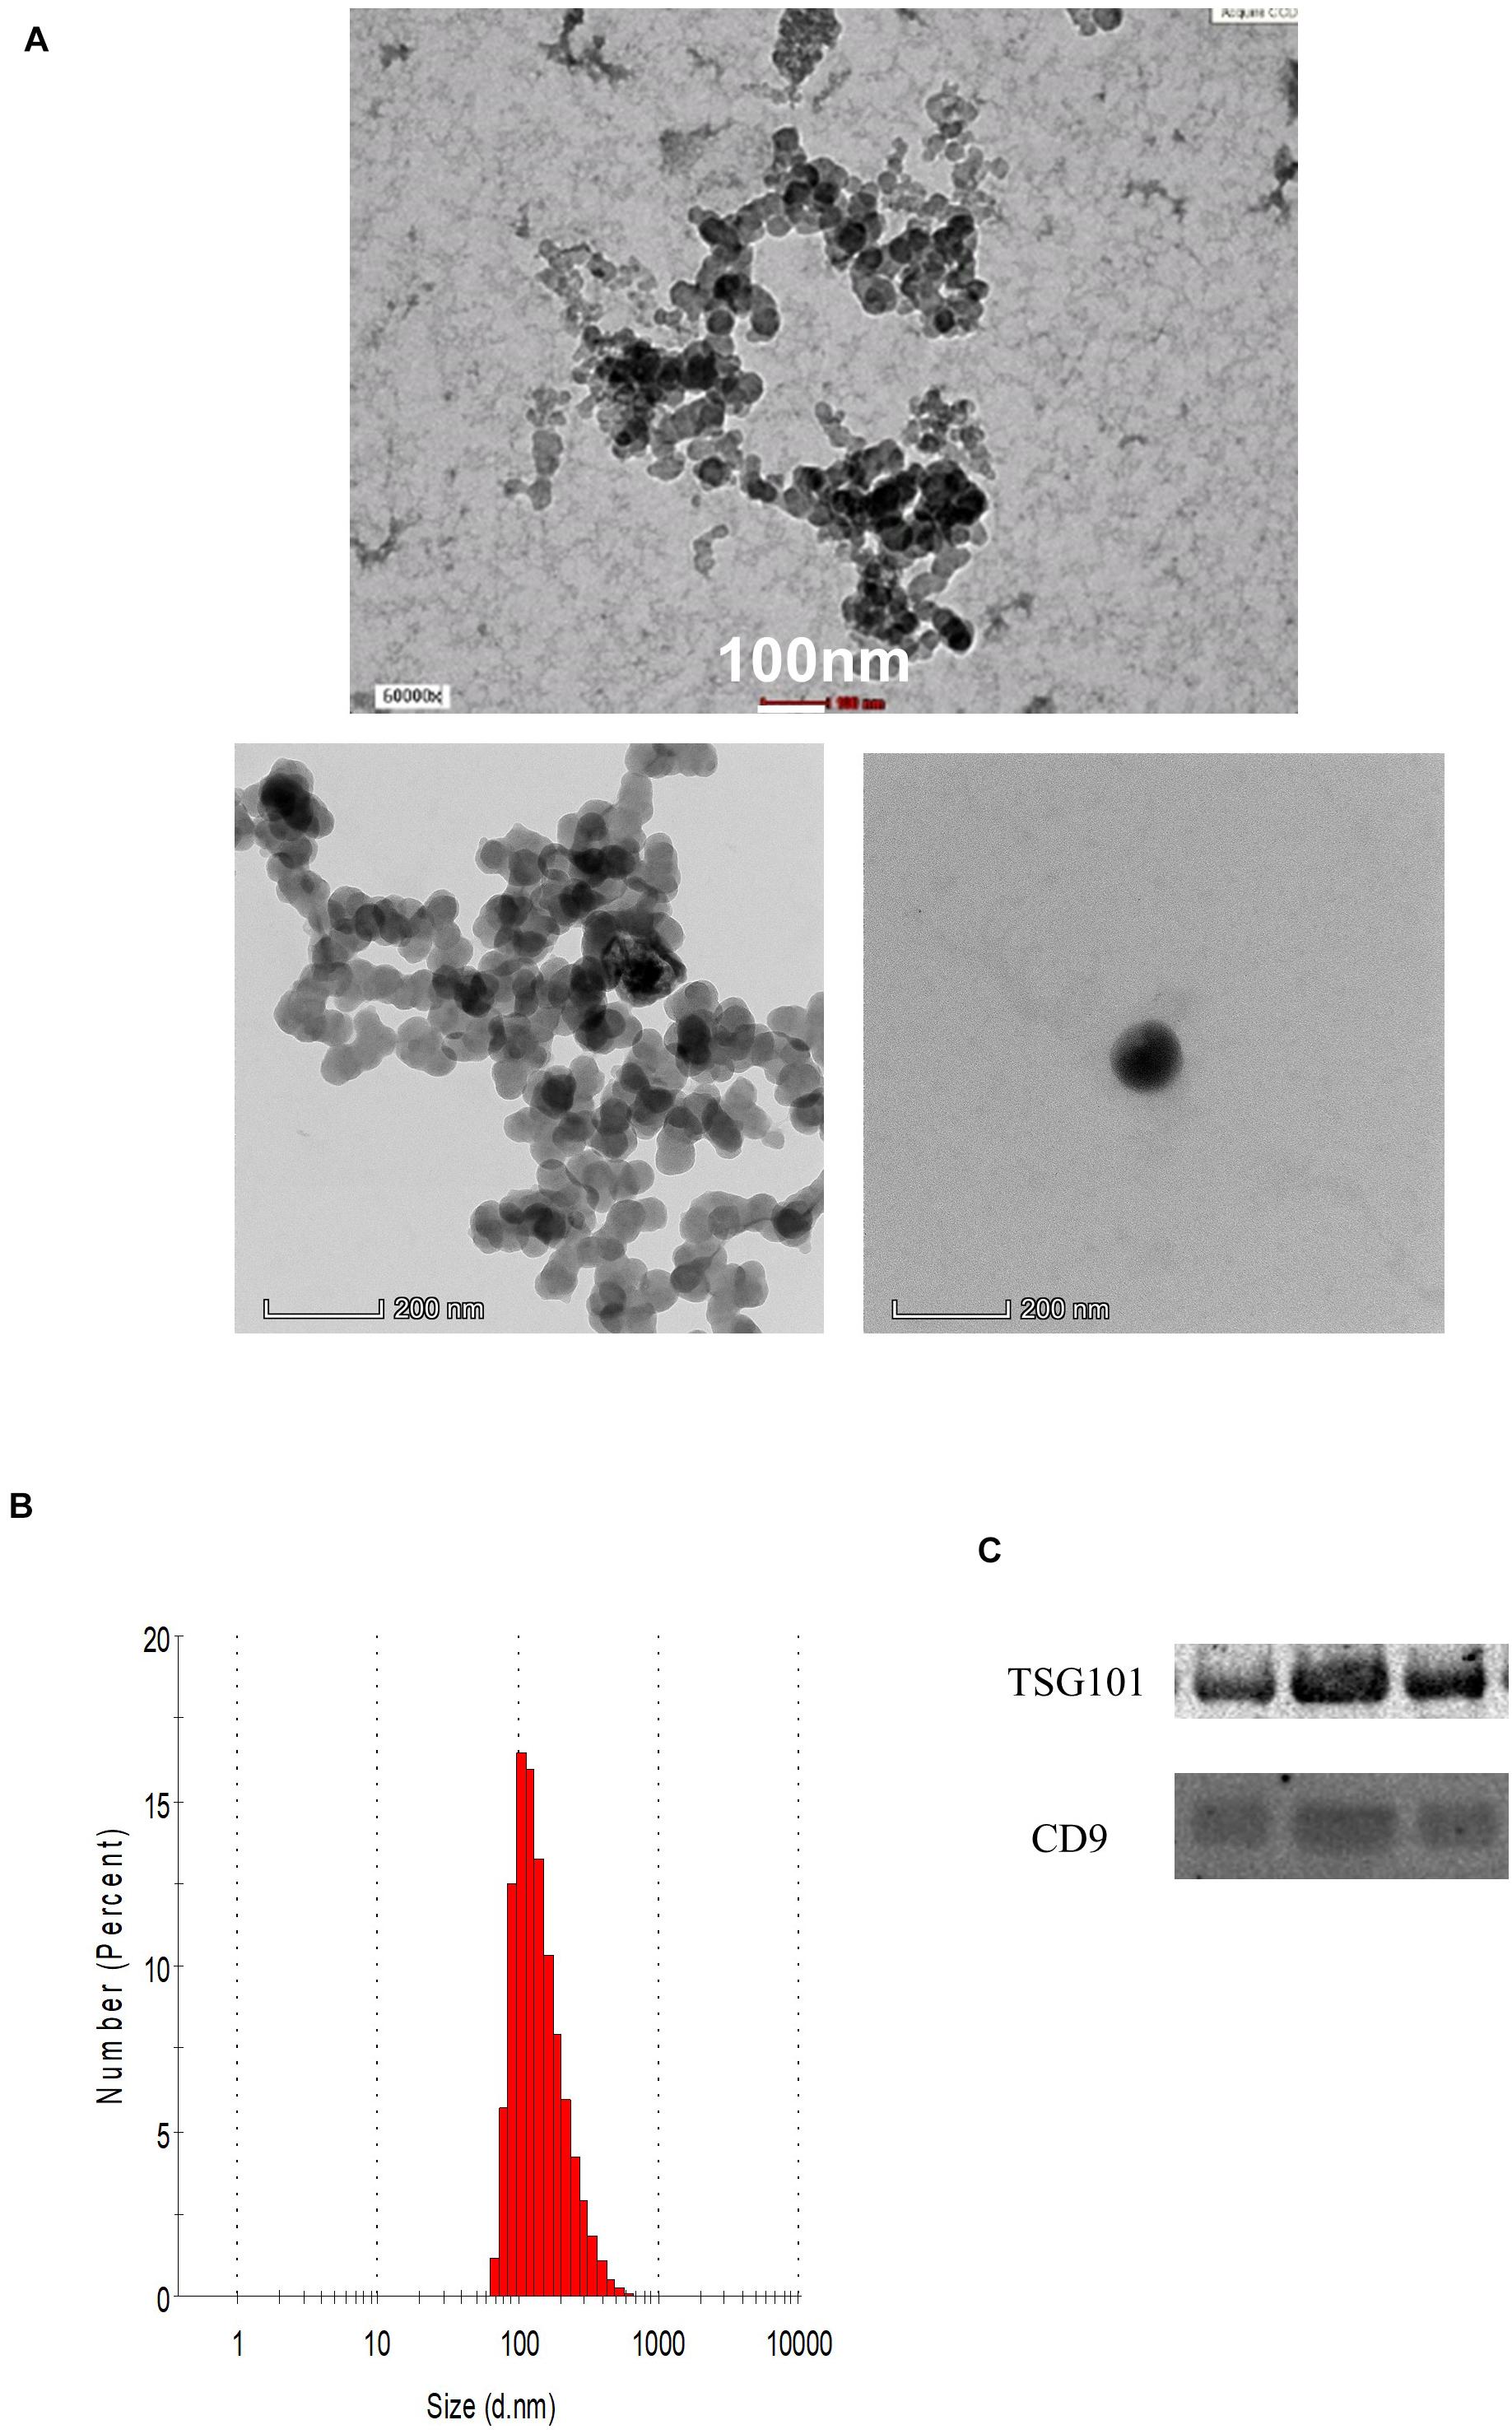
Figure 1. (A) Representative transmission electron microscopy images of the enriched population. (B) Representative histogram of the dynamic light scattering (DLS) measurement of the EVs. (C) Western blot analysis of representative CRC EVs targeting TSG101 and CD9 proteins.

Table 2. DLS measurements of the isolated EVs (n = 3) in four groups, both mean and mode diameters were analyzed.
EVs Regulated the Protein-Coding and Non-coding RNAs in Activated T Cells
We performed gene expression analysis in the CD8 + T cells after co-culturing with EVs to observe whether there were any changes at the transcriptomic level (Figure 2). Based on our analysis, there were no significant differentially expressed genes based on the adjusted p-value < 0.05. However, there were around 122 dysregulated probes between the HighBMI-non-CRC and LowBMI-non-CRC groups based on the raw p-value (<0.05), fold change > 2 and < −2 (Table 3). Nevertheless, there were no significantly enriched pathways detected from this list of genes. Of note, in both comparisons between HighBMI_non-CRC vs. Control, and LowBMI_non-CRC vs. Control the CCL22 gene was the most upregulated gene. We proceeded with the comparison between HighBMI-CRC and LowBMI-CRC, where no genes were significantly dysregulated based on the adj p-value < 0.05. Nevertheless, based on the raw p-value (<0.05), the LPHN2 gene was the most upregulated gene when comparing between HighBMI_CRC vs. LowBMI_CRC as shown in Table 4.
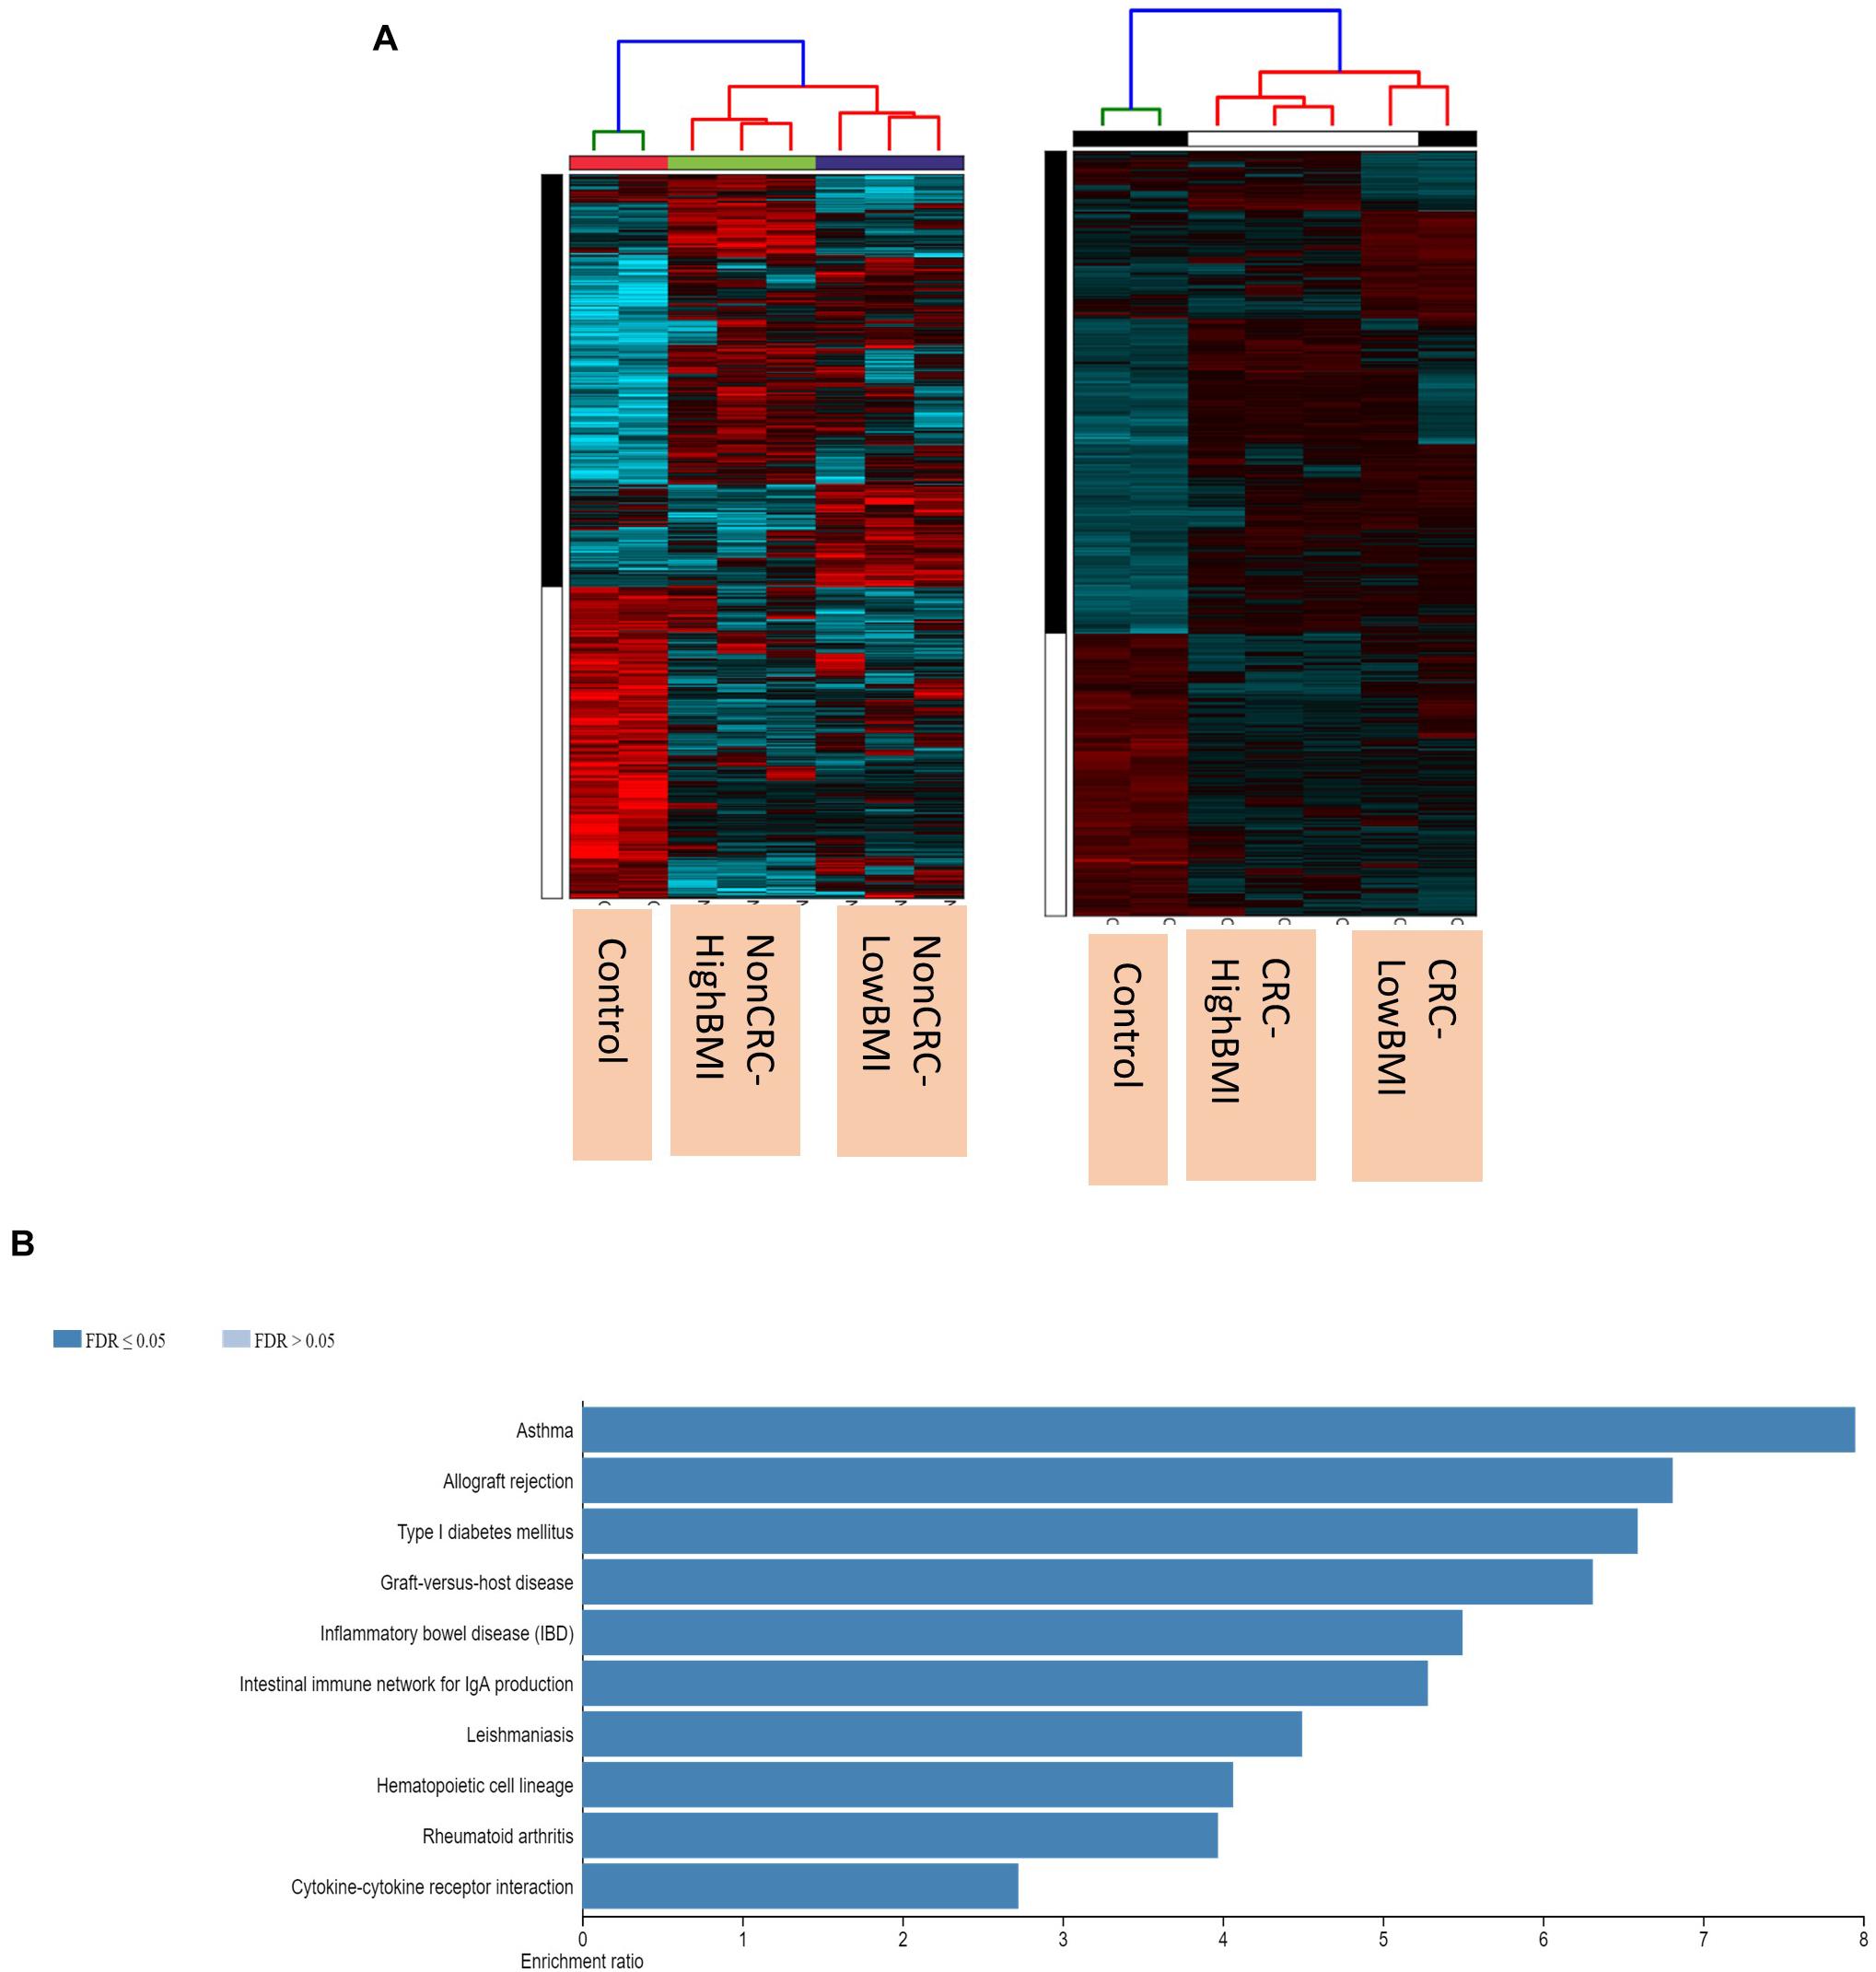
Figure 2. (A) Heatmap and clustering of the expression of the Non-CRC and CRC EVs-treated T cells. (B) Enriched pathways of the set of genes that were differentially expressed in T cells treated with CRC and Non-CRC EVs.
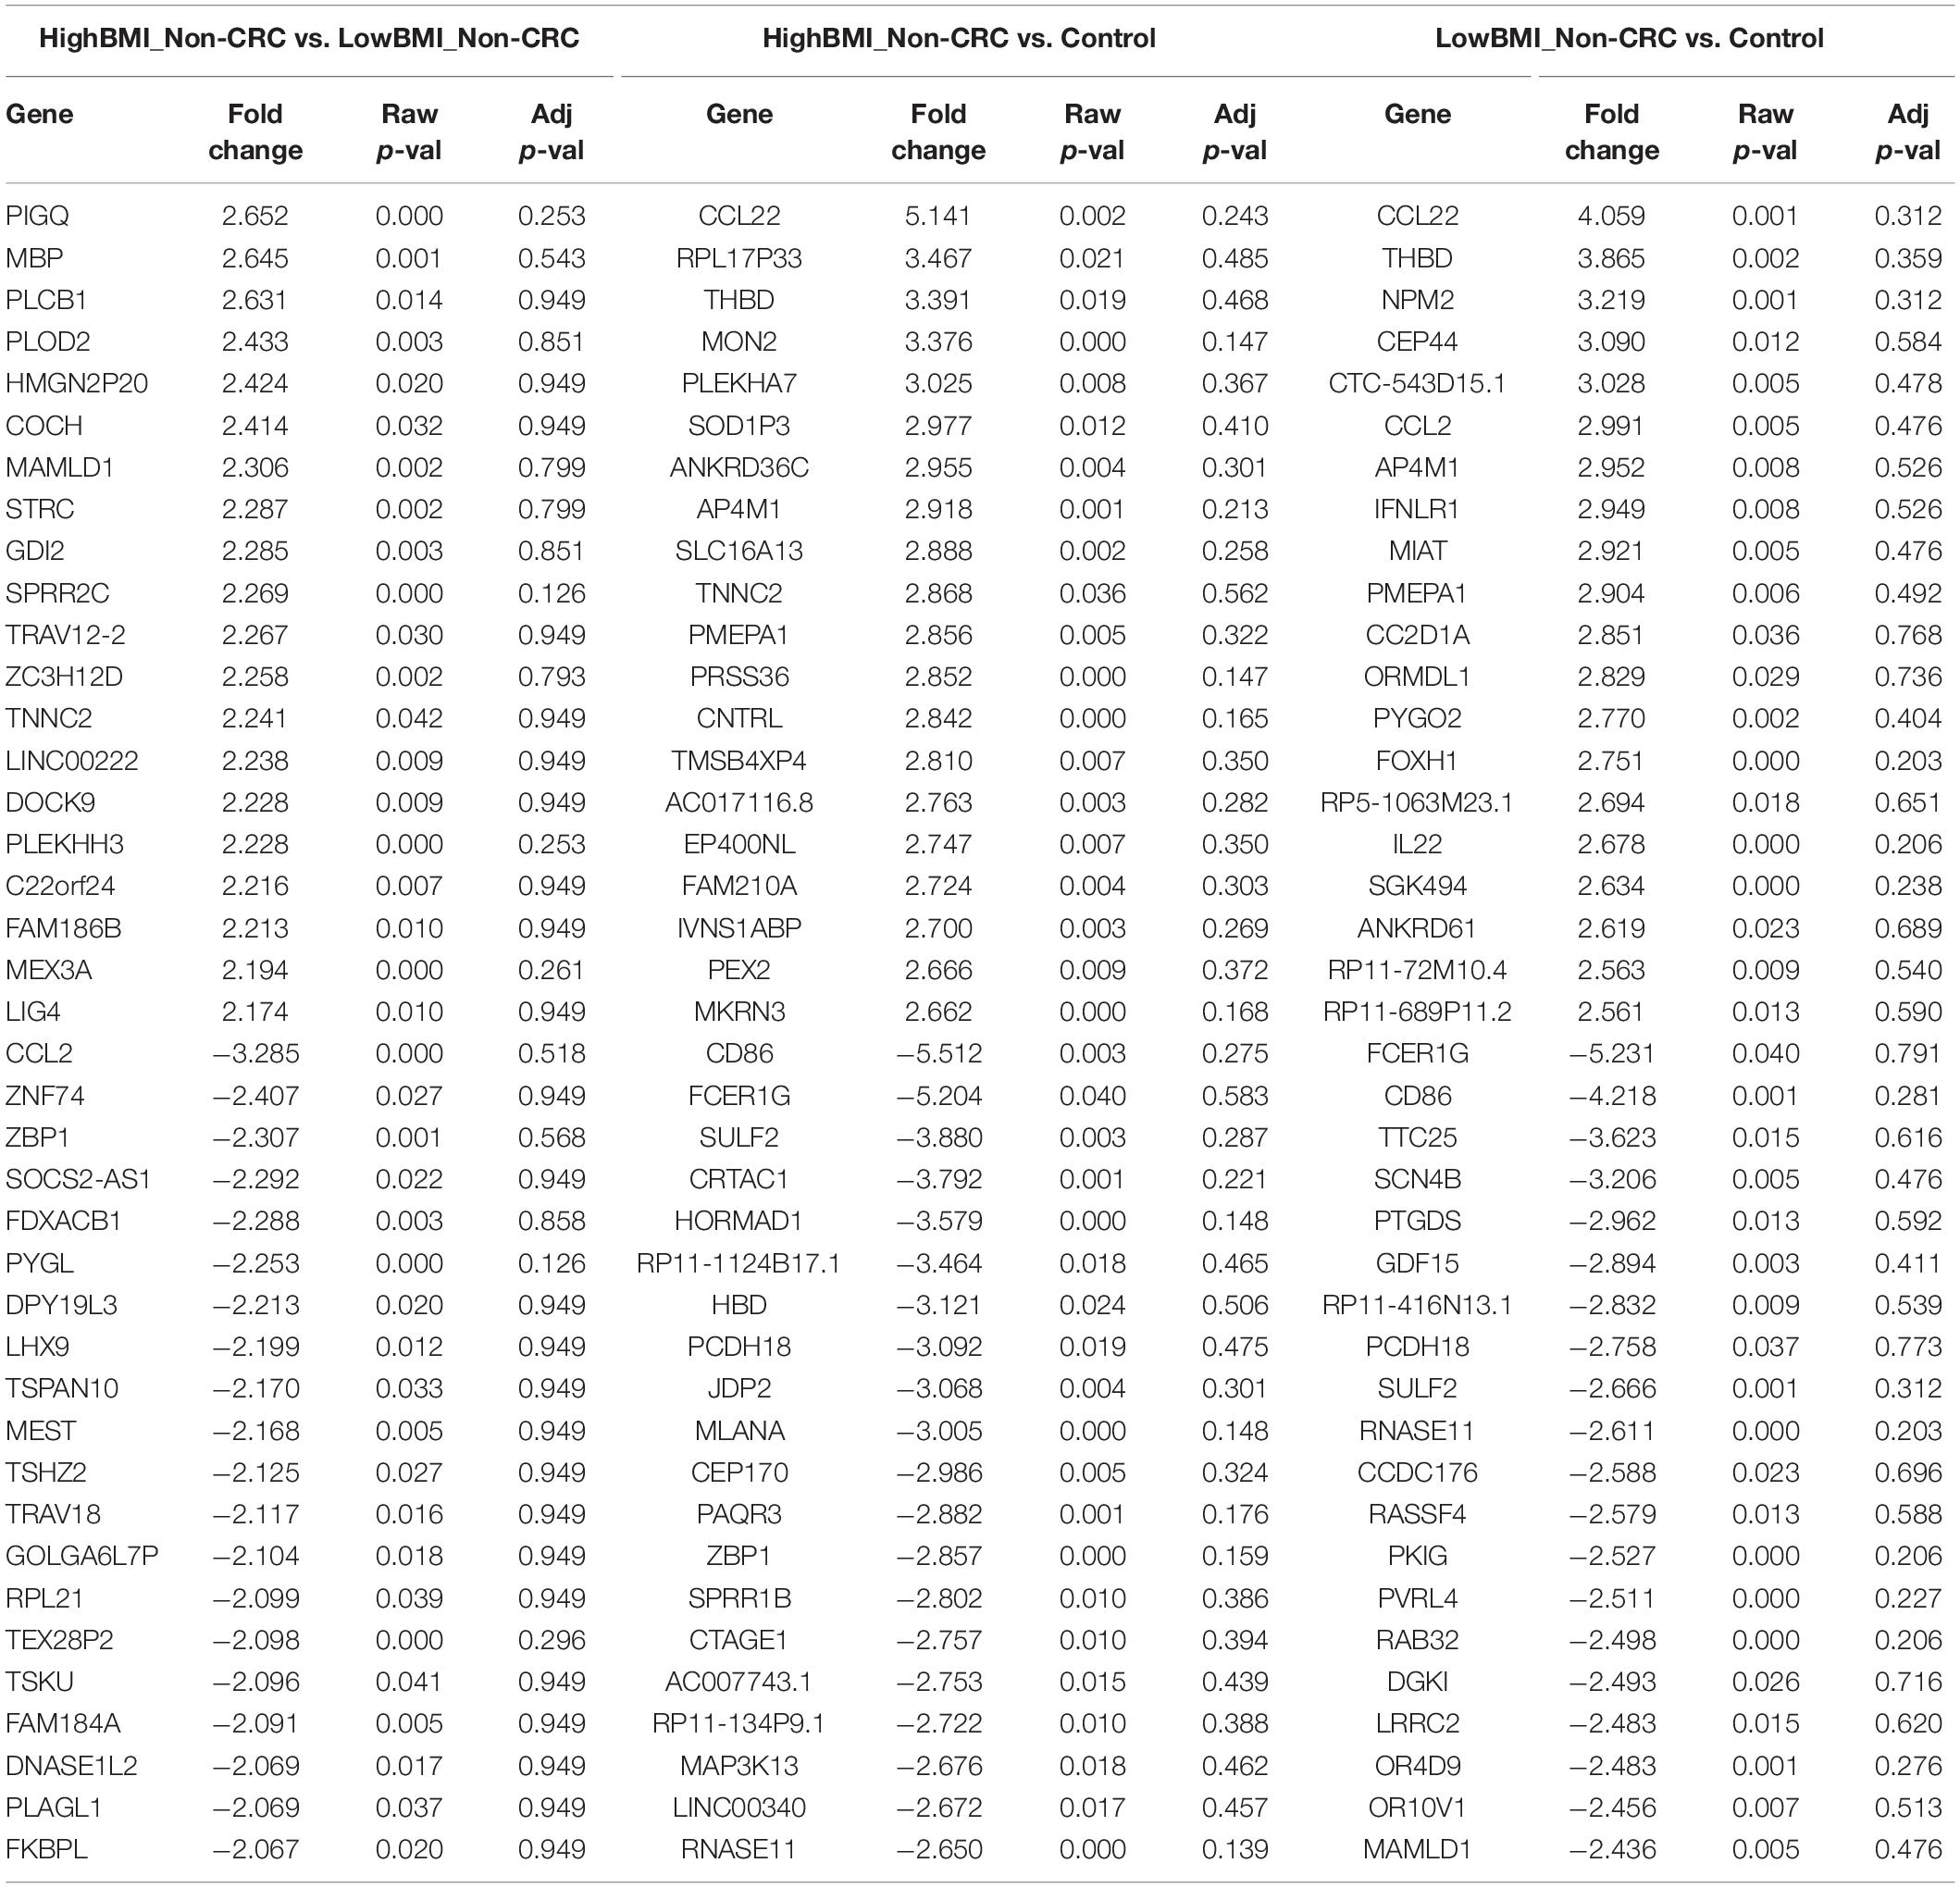
Table 3. Top 20 up- and down-regulated genes in CD8 T cells treated with EVs from HighBMI_Non-CRC, LowBMI_Non-CRC, and PBS (control).
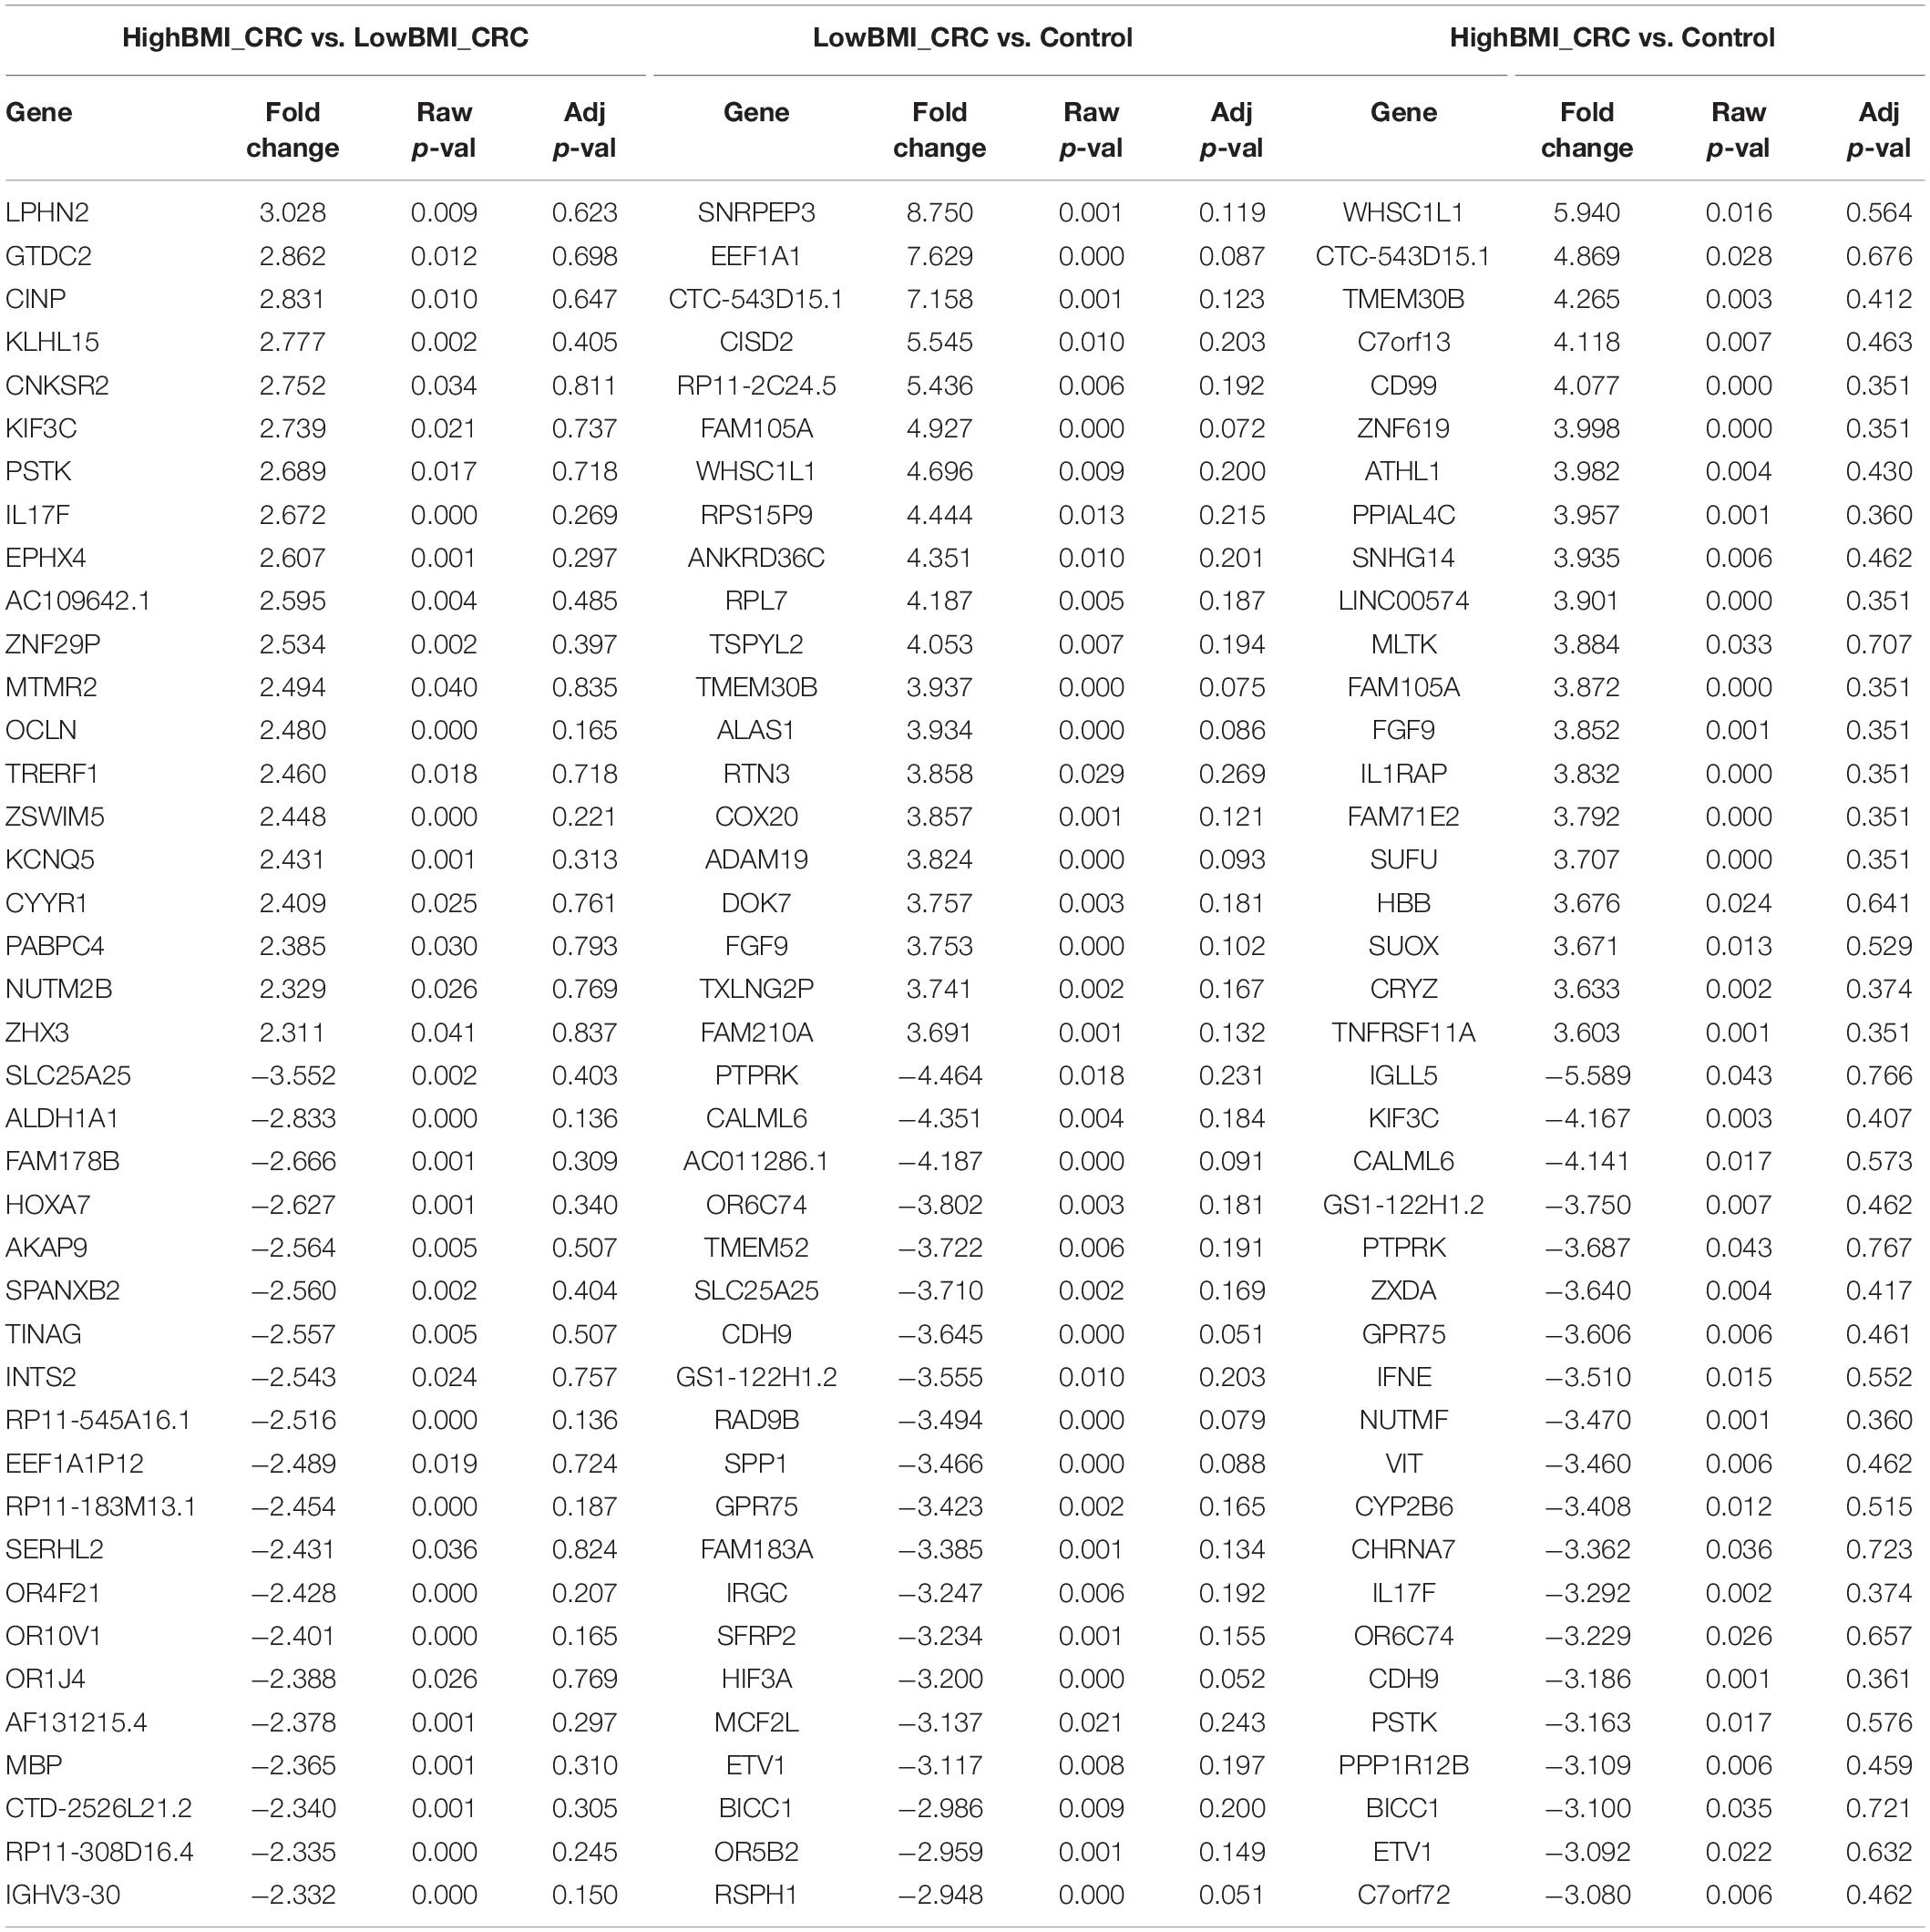
Table 4. Top 20 up- and down-regulated genes in CD8 T cells treated with EVs from HighBMI_CRC, LowBMI_CRC, and PBS (control).
Interestingly, when comparing between CRC and Non-CRC, there were over 2000 probes that were significantly regulated (adj p-value < 0.05) (Table 5). Some of the most enriched pathways (FDR < 0.05) that were identified from this set of genes include cytokine-cytokine receptor interaction, inflammatory bowel disease and intestinal immune network for IgA production (Figure 3B). Besides regulating the protein-coding RNA, the EVs were also able to alter the expression of non-coding RNAs (ncRNAs) in the T cells as well. For instance, LINC00222 was upregulated in HighBMI_Non-CRC as compared to LowBMI_Non-CRC (raw p-value < 0.05, fold change > 2). Interestingly, some of the identified lncRNAs were upregulated in the CRC-treated T cells as compared to the non-CRC groups such as MIAT, MEG3, and LINC00426. Whereas certain lncRNAs were downregulated, such as PVT1 and LINC00520. Nevertheless, careful interpretation of this data is needed as the T cells used were different between the CRC and non-CRC EVs and this could contribute to the high differences.
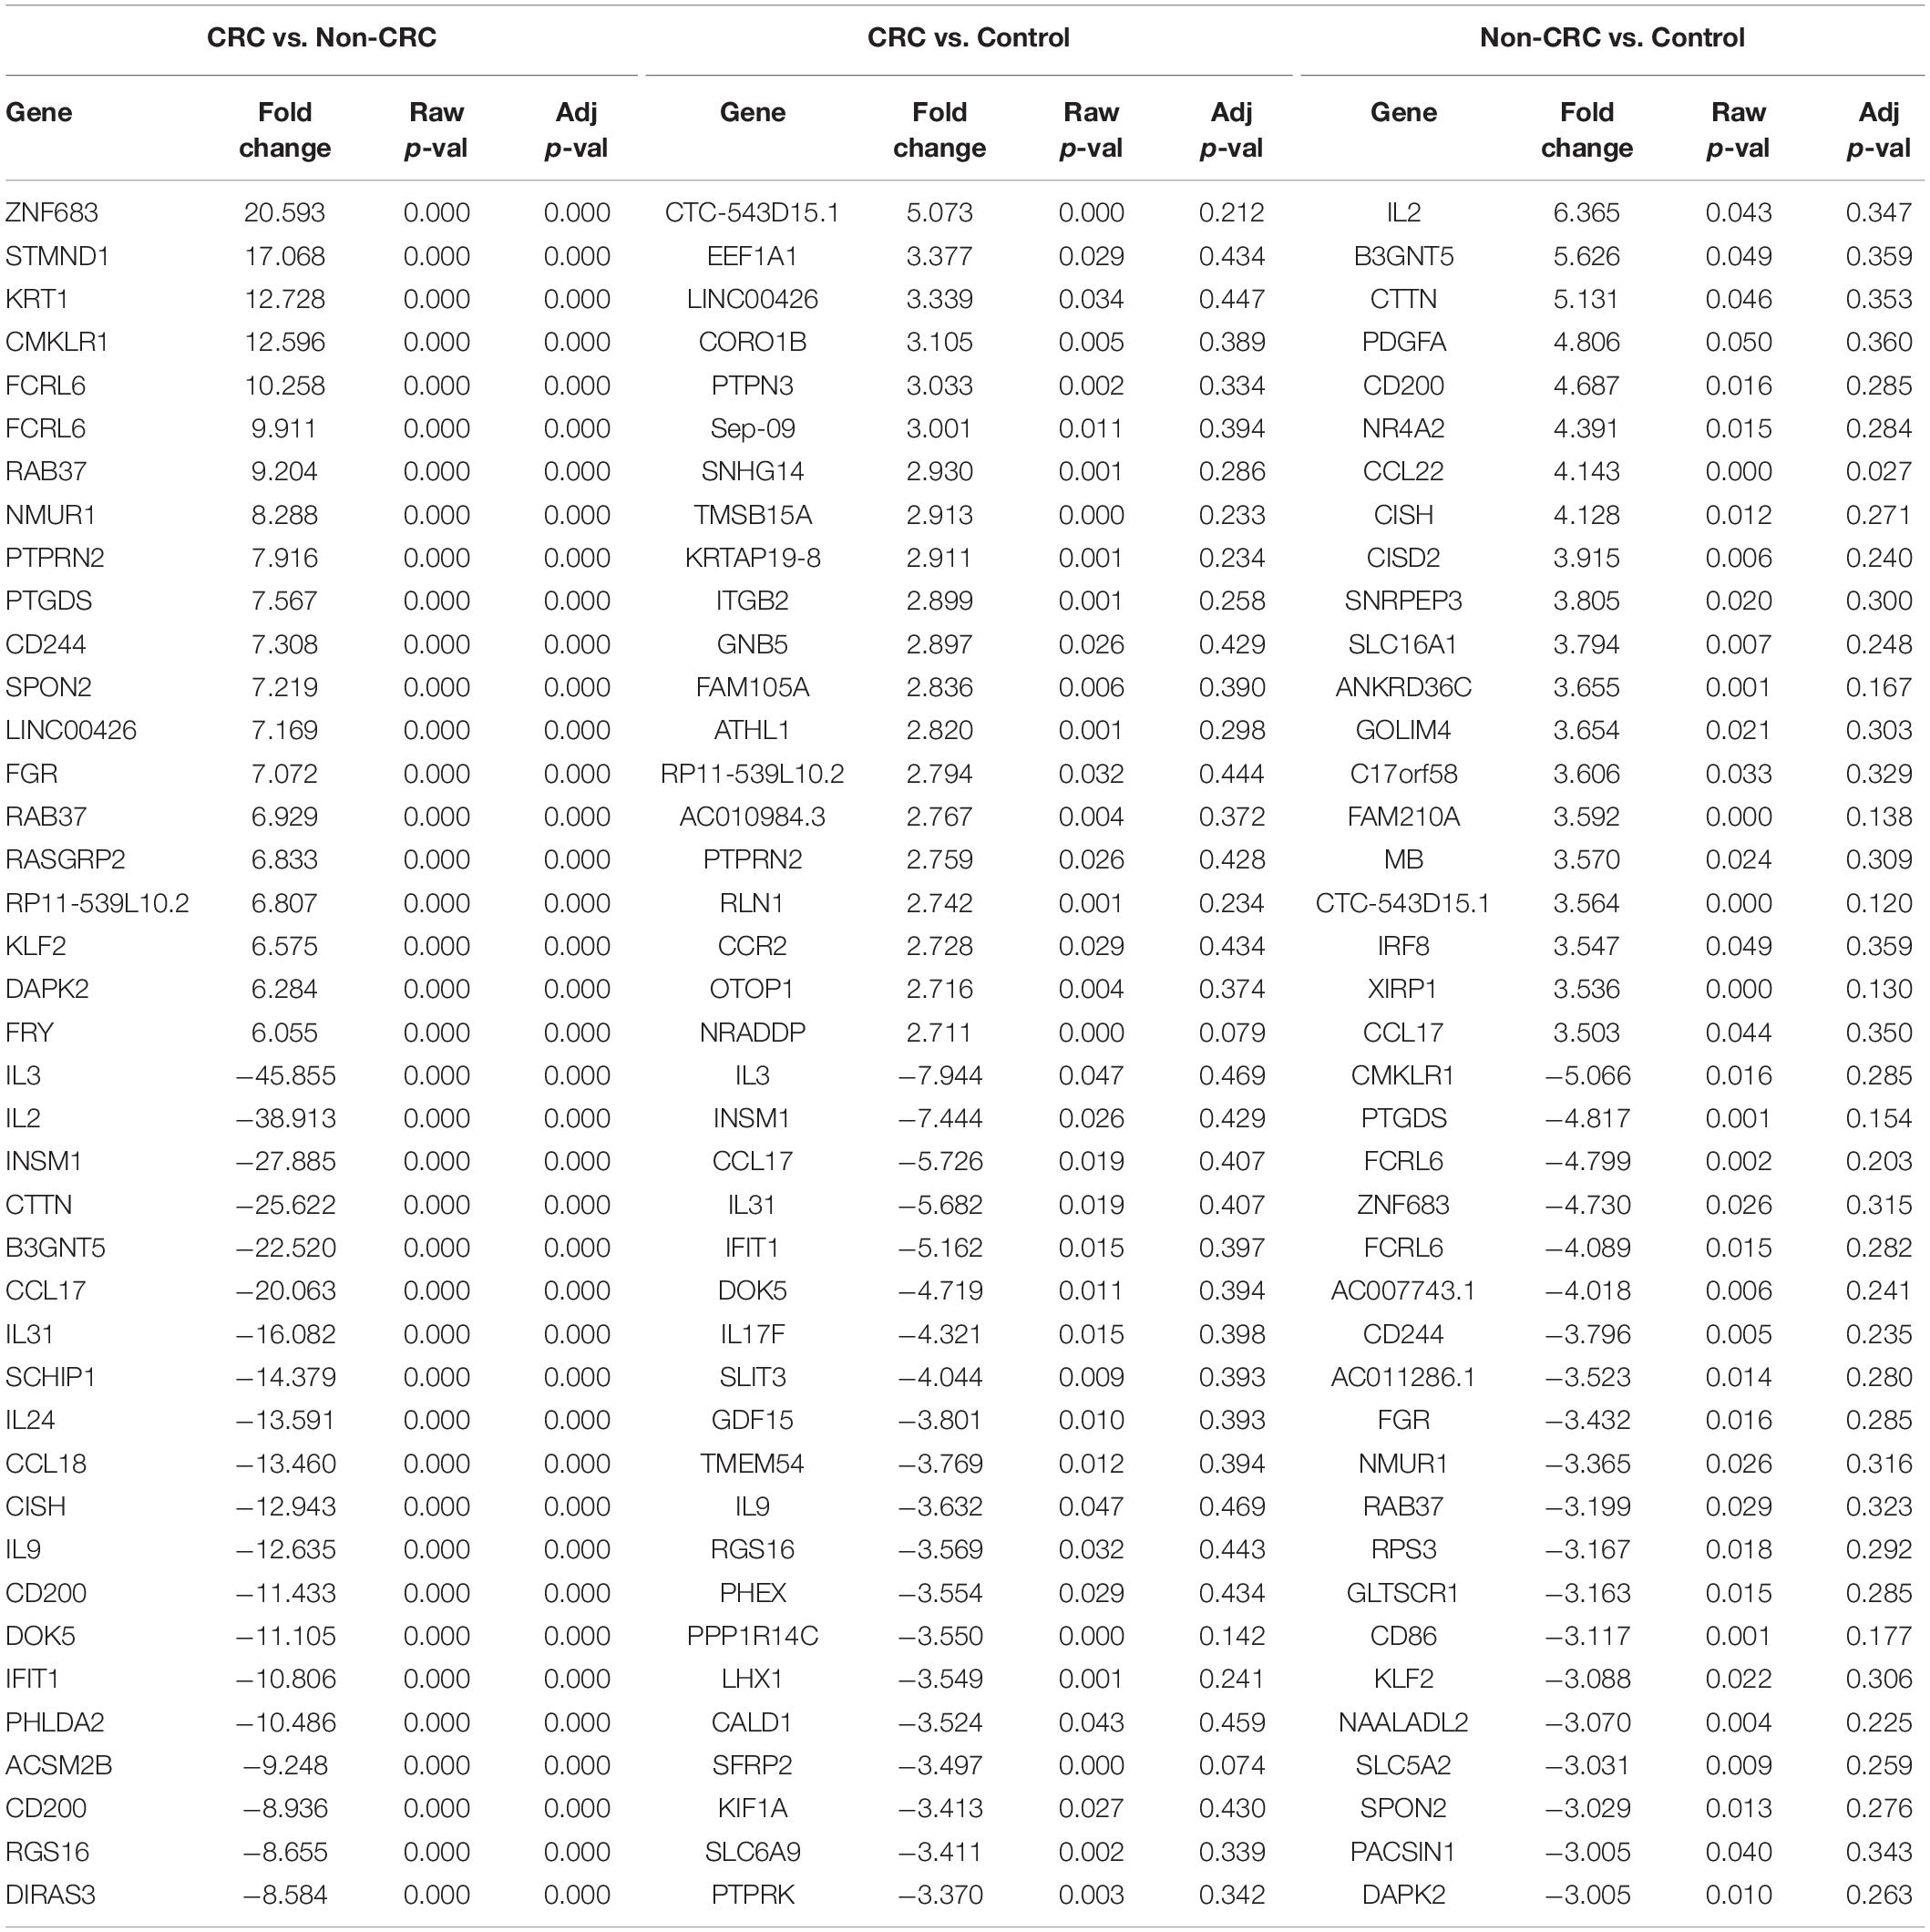
Table 5. Top 20 up- and down-regulated genes in CD8 T cells treated with EVs from Non-CRC, CRC (regardless of BMI), and PBS (control).
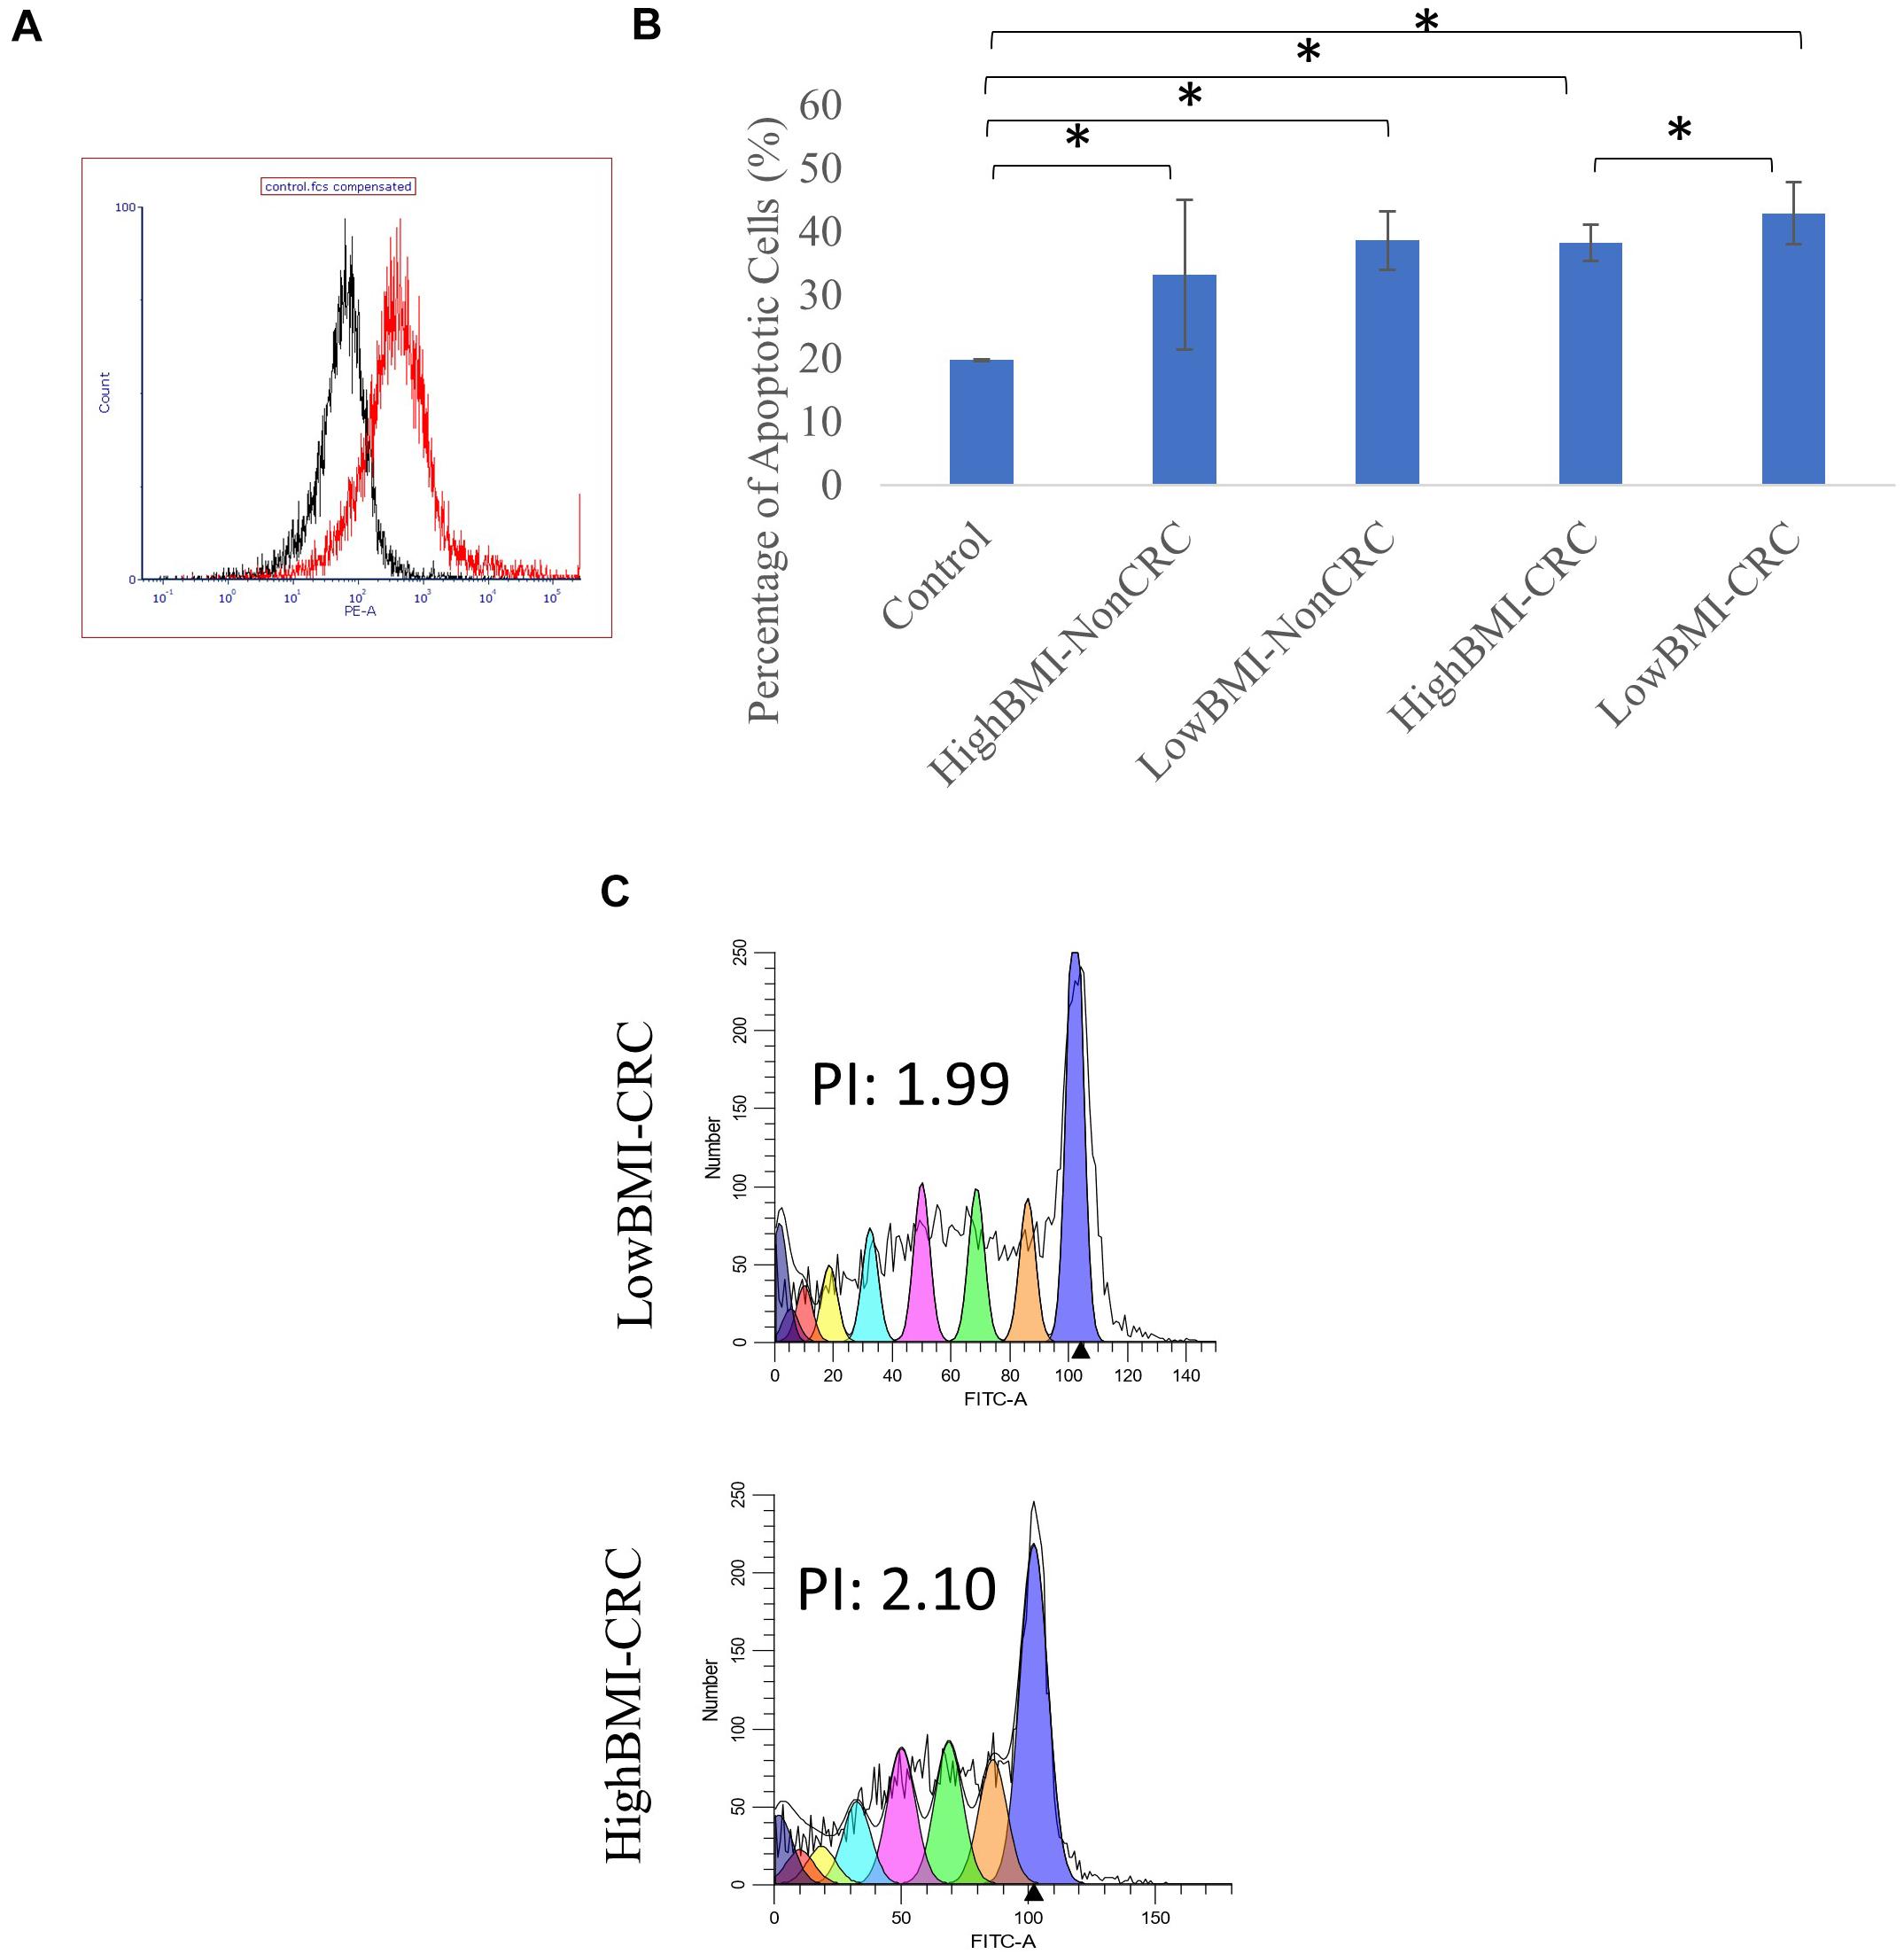
Figure 3. (A) Uptake of PKH26 dye by the EVs as evaluated by flow cytometry analysis. (B) Normalized fold change of the apoptotic rate in the CD8T cells upon co-incubation with different groups of EVs; HighBMI-Non-CRC, LowBMI-non-CRC, HighBMI-CRC, and LowBMI-non-CRC. (C) Representative CFSE analysis in the CD8T cells co-cultured with CRC-EVs as evaluated by flow cytometry, HighBMI-CRC (n = 4), LowBMI-CRC (n = 4). PI, proliferation index. * indicates statistical significance at p < 0.05.
CRC-LowBMI EVs Stimulate an Increase in CD8 T Cell Apoptosis and Regulated the Cytokine Profile
Prior to determining the biological function of EVs in CD8 T cells, the uptake of EVs by CD8 T cells was first assessed. Flow cytometric analysis of the PKH26 dye uptake demonstrated that the EVs interacted with the T cells (Figure 3A). A study by Muller et al. (2017), demonstrated that Treg cells did not internalize tumor-derived exosomes, but rather interacted via cell surface signaling. It was shown that through this interaction, exosomes were able to induce apoptosis in T cells (Muller et al., 2016, 2017). Therefore, we proceeded with the apoptosis analysis. Using the Annexin V-FITC apoptotic assay, cell death in CD8 T cells was evaluated following co-culture with EVs as depicted in Figure 3B. It was determined that CD8 T cells co-cultured with LowBMI-CRC EVs had an increased cell death (42.89%) as compared to the other groups. There was a significant difference (p < 0.05) in cell death between the LowBMI-CRC and HighBMI-CRC EVs. However, no significant changes were observed in CD8 T cells co-cultured with non-CRC EVs. Additionally, there was also no significant difference in cell death when comparing between CRC and non-CRC EVs. Nevertheless, regardless of the disease or BMI status, the EVs managed to induce cell death as compared to the untreated CD8 T cells. Since there were differences in terms of apoptosis in the T cells treated with CRC EVs, we wanted to see whether the same effect could be seen in the cell proliferation CFSE assay. As shown in Figure 3C, the LowBMI-CRC EVs had a lower proliferation index than the HighBMI-CRC EVs, though no significance was observed.
The level of several related cytokines in CD8 T cells co-cultured with EVs from high BMI or low BMI CRC and non-CRC patients were quantified (Figure 4). For IL-17A, elevated expression of this cytokine was observed in the T cells incubated with Non-CRC EVs, significance (p < 0.05) was observed between the HighBMI-non-CRC and HighBMI-CRC (p = 0.023), as well as for the overall Non-CRC against CRC (p = 0.007). Similarly, this observation was also seen in the release of perforin, granzyme A, IL-10 and granulysin. For perforin, there was a significant difference between the HighBMI-non-CRC and HighBMI-CRC (p = 0.0019). Interestingly for perforin, the level of release was higher in the HighBMI-Non-CRC than the LowBMI-Non-CRC group (p = 0.001). For granulysin, only the highBMI group was different between the Non-CRC and CRC groups (p = 0.039). Moreover, for IL-10 and granzyme A, the difference of expression was observed between the HighBMI and LowBMI in CRC and Non-CRC EVs respectively (granzyme A: p = 0.005 and p = 0.03, IL-10: p = 0.01 and p = 0.03 respectively) As for IFN-G, T cells incubated with CRC-EVs had a higher release of this cytokine as compared to the non-CRC-EVs (p = 0.01). The same pattern of expression was also found in the release of granzyme B (p = 0.001). Subsequently, for the release of Fas, the highBMI-CRC had a higher release than the lowBMI-CRC group (p = 0.001).
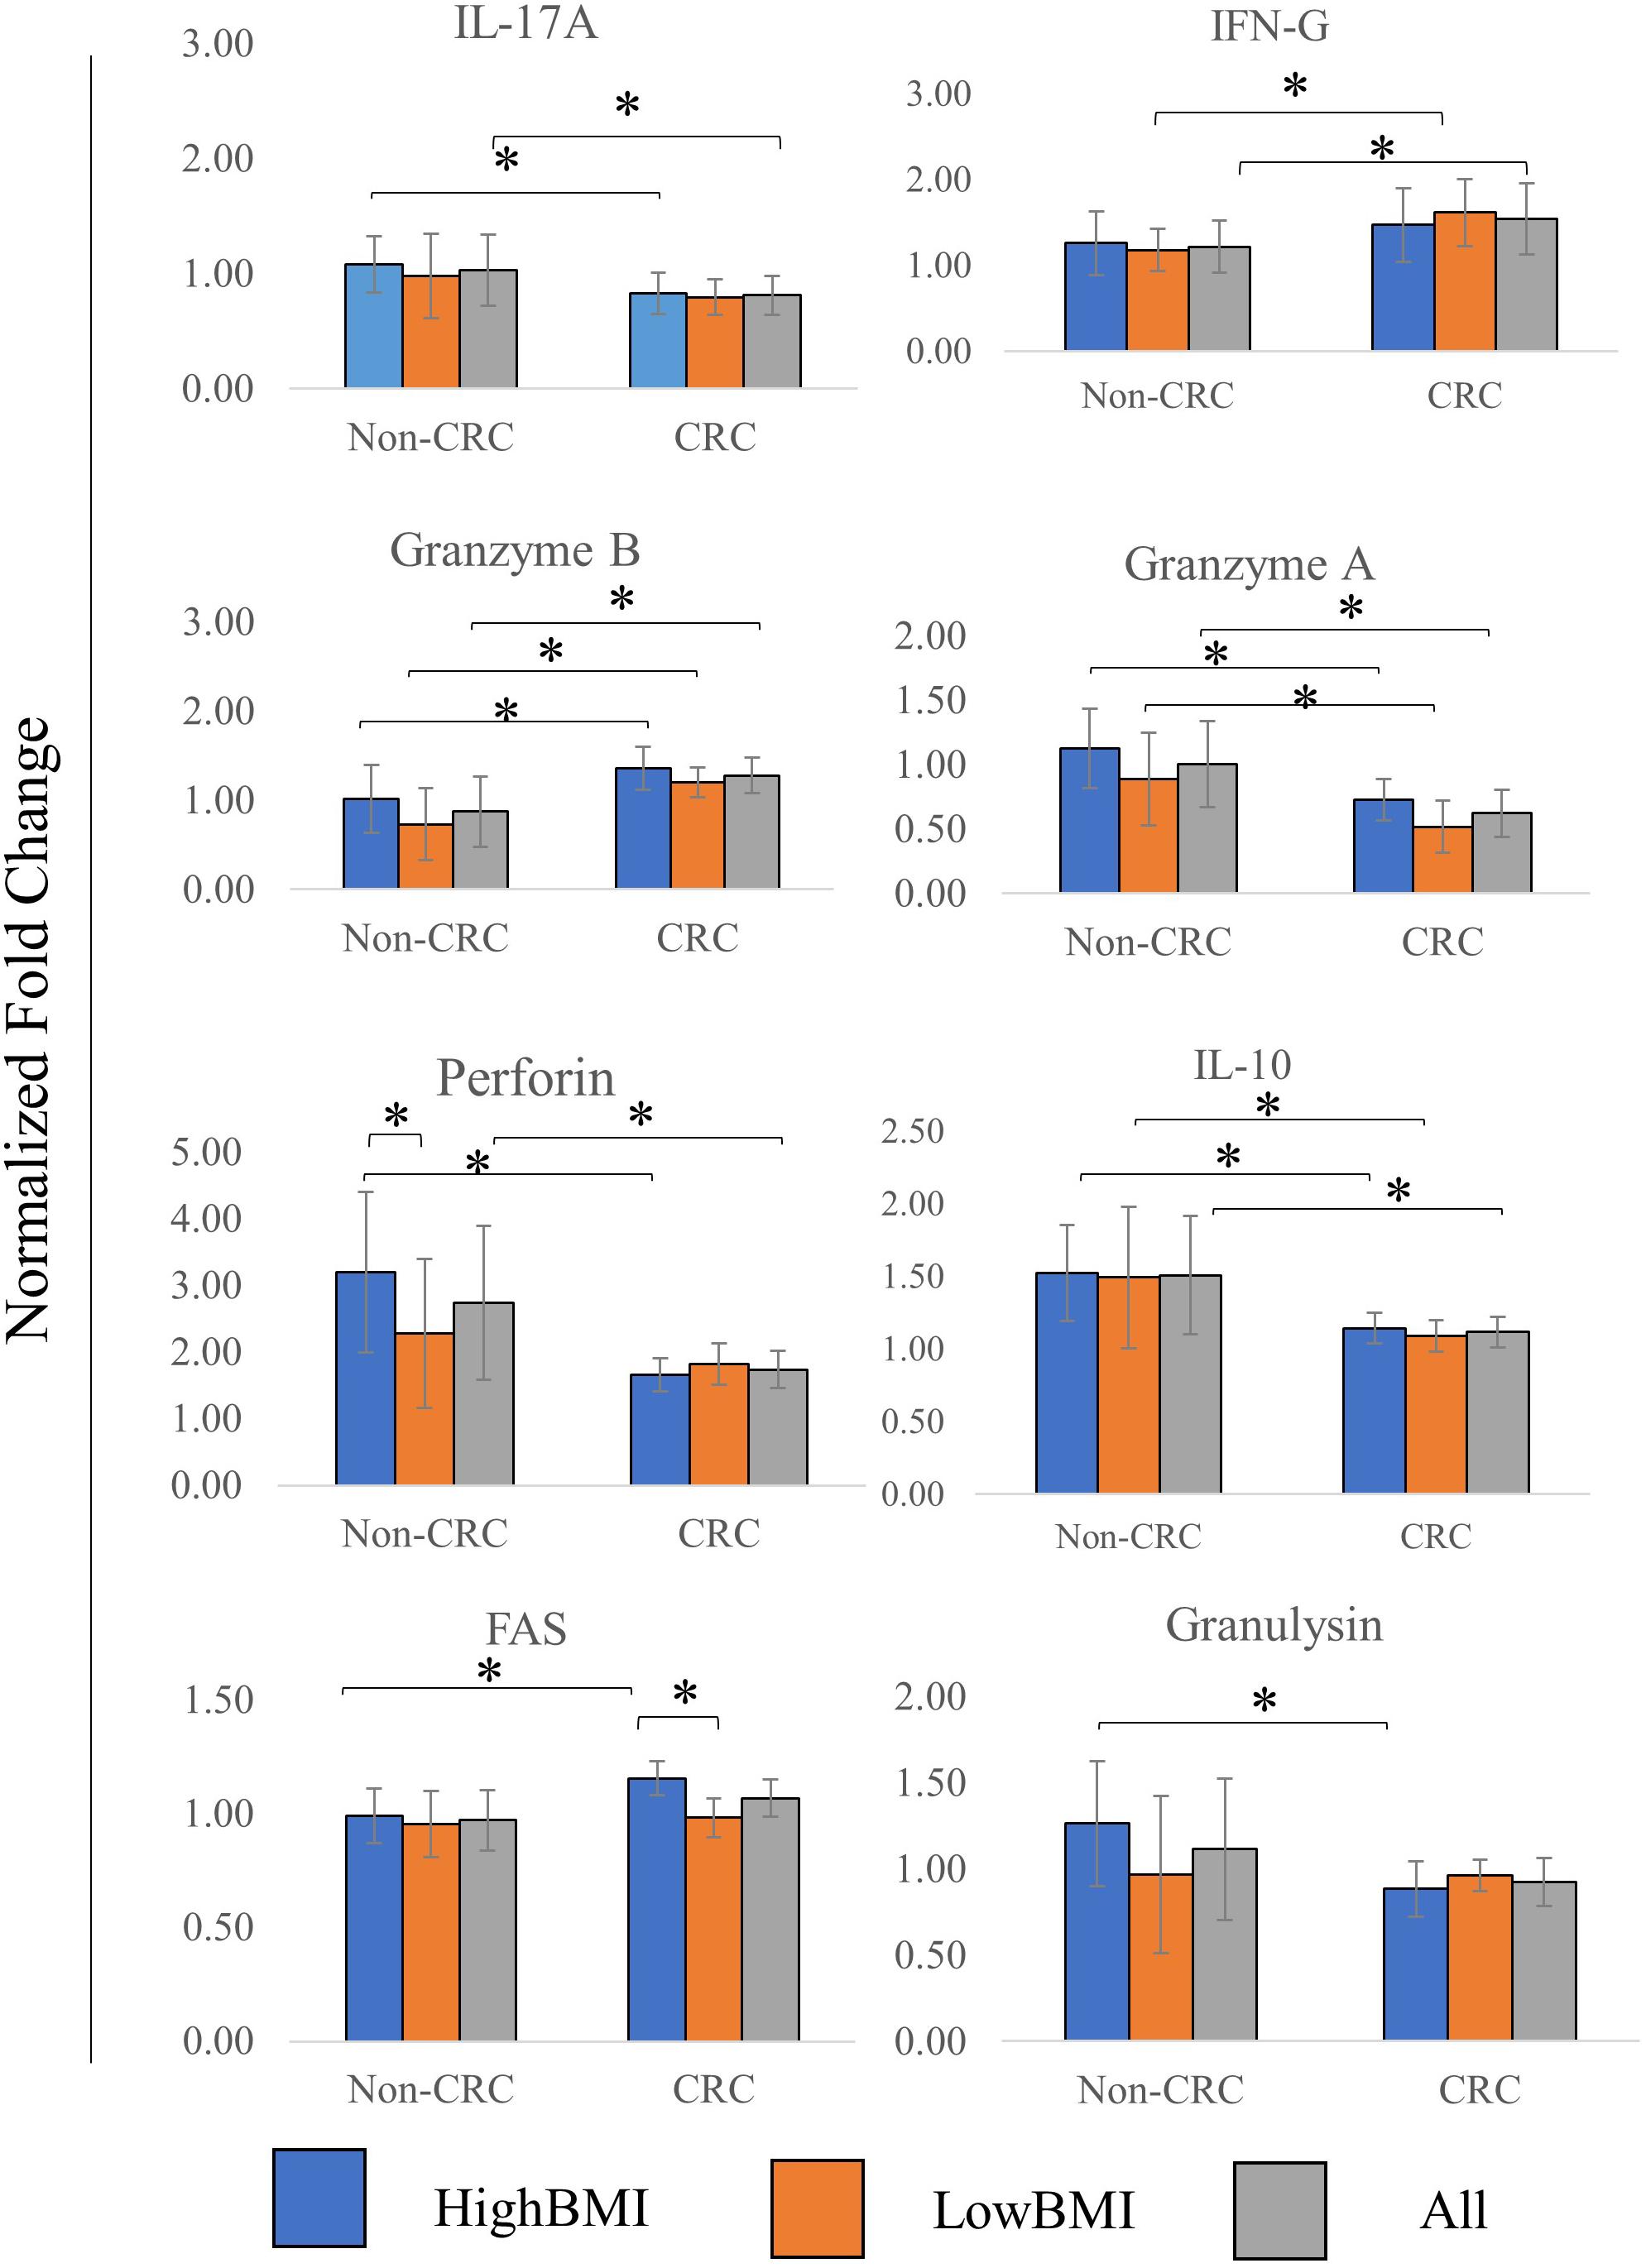
Figure 4. Normalized fold change ± SD of the secreted cytokines analyzed using multiparametric flow cytometry for each group. Experimental values were normalized against cytokines released from untreated T cells. The “All” group is the combination of CRC and Non-CRC regardless of BMI status (n = 8, for each group). ANOVA analysis was performed for each of the cytokines and statistical significance was set at p < 0.05. * indicates statistical significance at p < 0.05.
It is worth noting that in our transcriptomic analysis, the gene expression levels of several cytokines were also significantly regulated (adj p < 0.05 and fold change > 2). Although there seems to be no difference between the different BMI status, we observed an interesting pattern when comparing CRC and non-CRC EVs. For instance, the mRNA expression of both IL-2 and IL-3 were significantly downregulated in the T cells treated with CRC EVs as compared to the non-CRC EVs (Table 5). Other cytokines such as IL-9 and IL-31 were also downregulated in T cells treated with CRC EVs.
T Cell Infiltration of CD8 T Cells Was Regulated Upon Treatment With EVs
We performed an analysis of the composition of immune cells within the RNA-Seq data using the TCGA cohort. Upon segregation of the samples based on the BMI status, we entered the gene expression data into CIBERSORT. Based on the analysis, there were no significant differences in terms of the composition of immune cells between three sets of BMI (>30, 29.99–25, and 25–18.5 kg/m2). Nevertheless, although no significant difference was observed, we did see an elevated level of abundance in the CD8 T cell population (1.44 fold change against the 25–28.5 kg/m2 group), and macrophage M1 population (1.13 fold change against the 25–18.5 kg/m2 group) in the > 30 kg/m2 group (Figure 5A). Concomitantly, there was a reduction in the activated natural killer cells populations (0.25 fold change against the 25–18.5 kg/m2 group) in the highest BMI group. To further analyze whether the EVs isolated from the samples were able to affect the ability of T cells infiltration, we performed the 3D spheroid infiltration After 24 h of treatment with the EVs (Figure 5B), the percentage of T cells infiltrating the HT-29 spheroids was measured. As shown in Figure 5B, CD8 T cells treated with LowBMI-Non-CRC EVs had the highest percentage of infiltration as compared to the other EVs, although no statistical significance was observed. Additionally, there were also no significant differences between the HighBMI-CRC and LowBMI-CRC group.
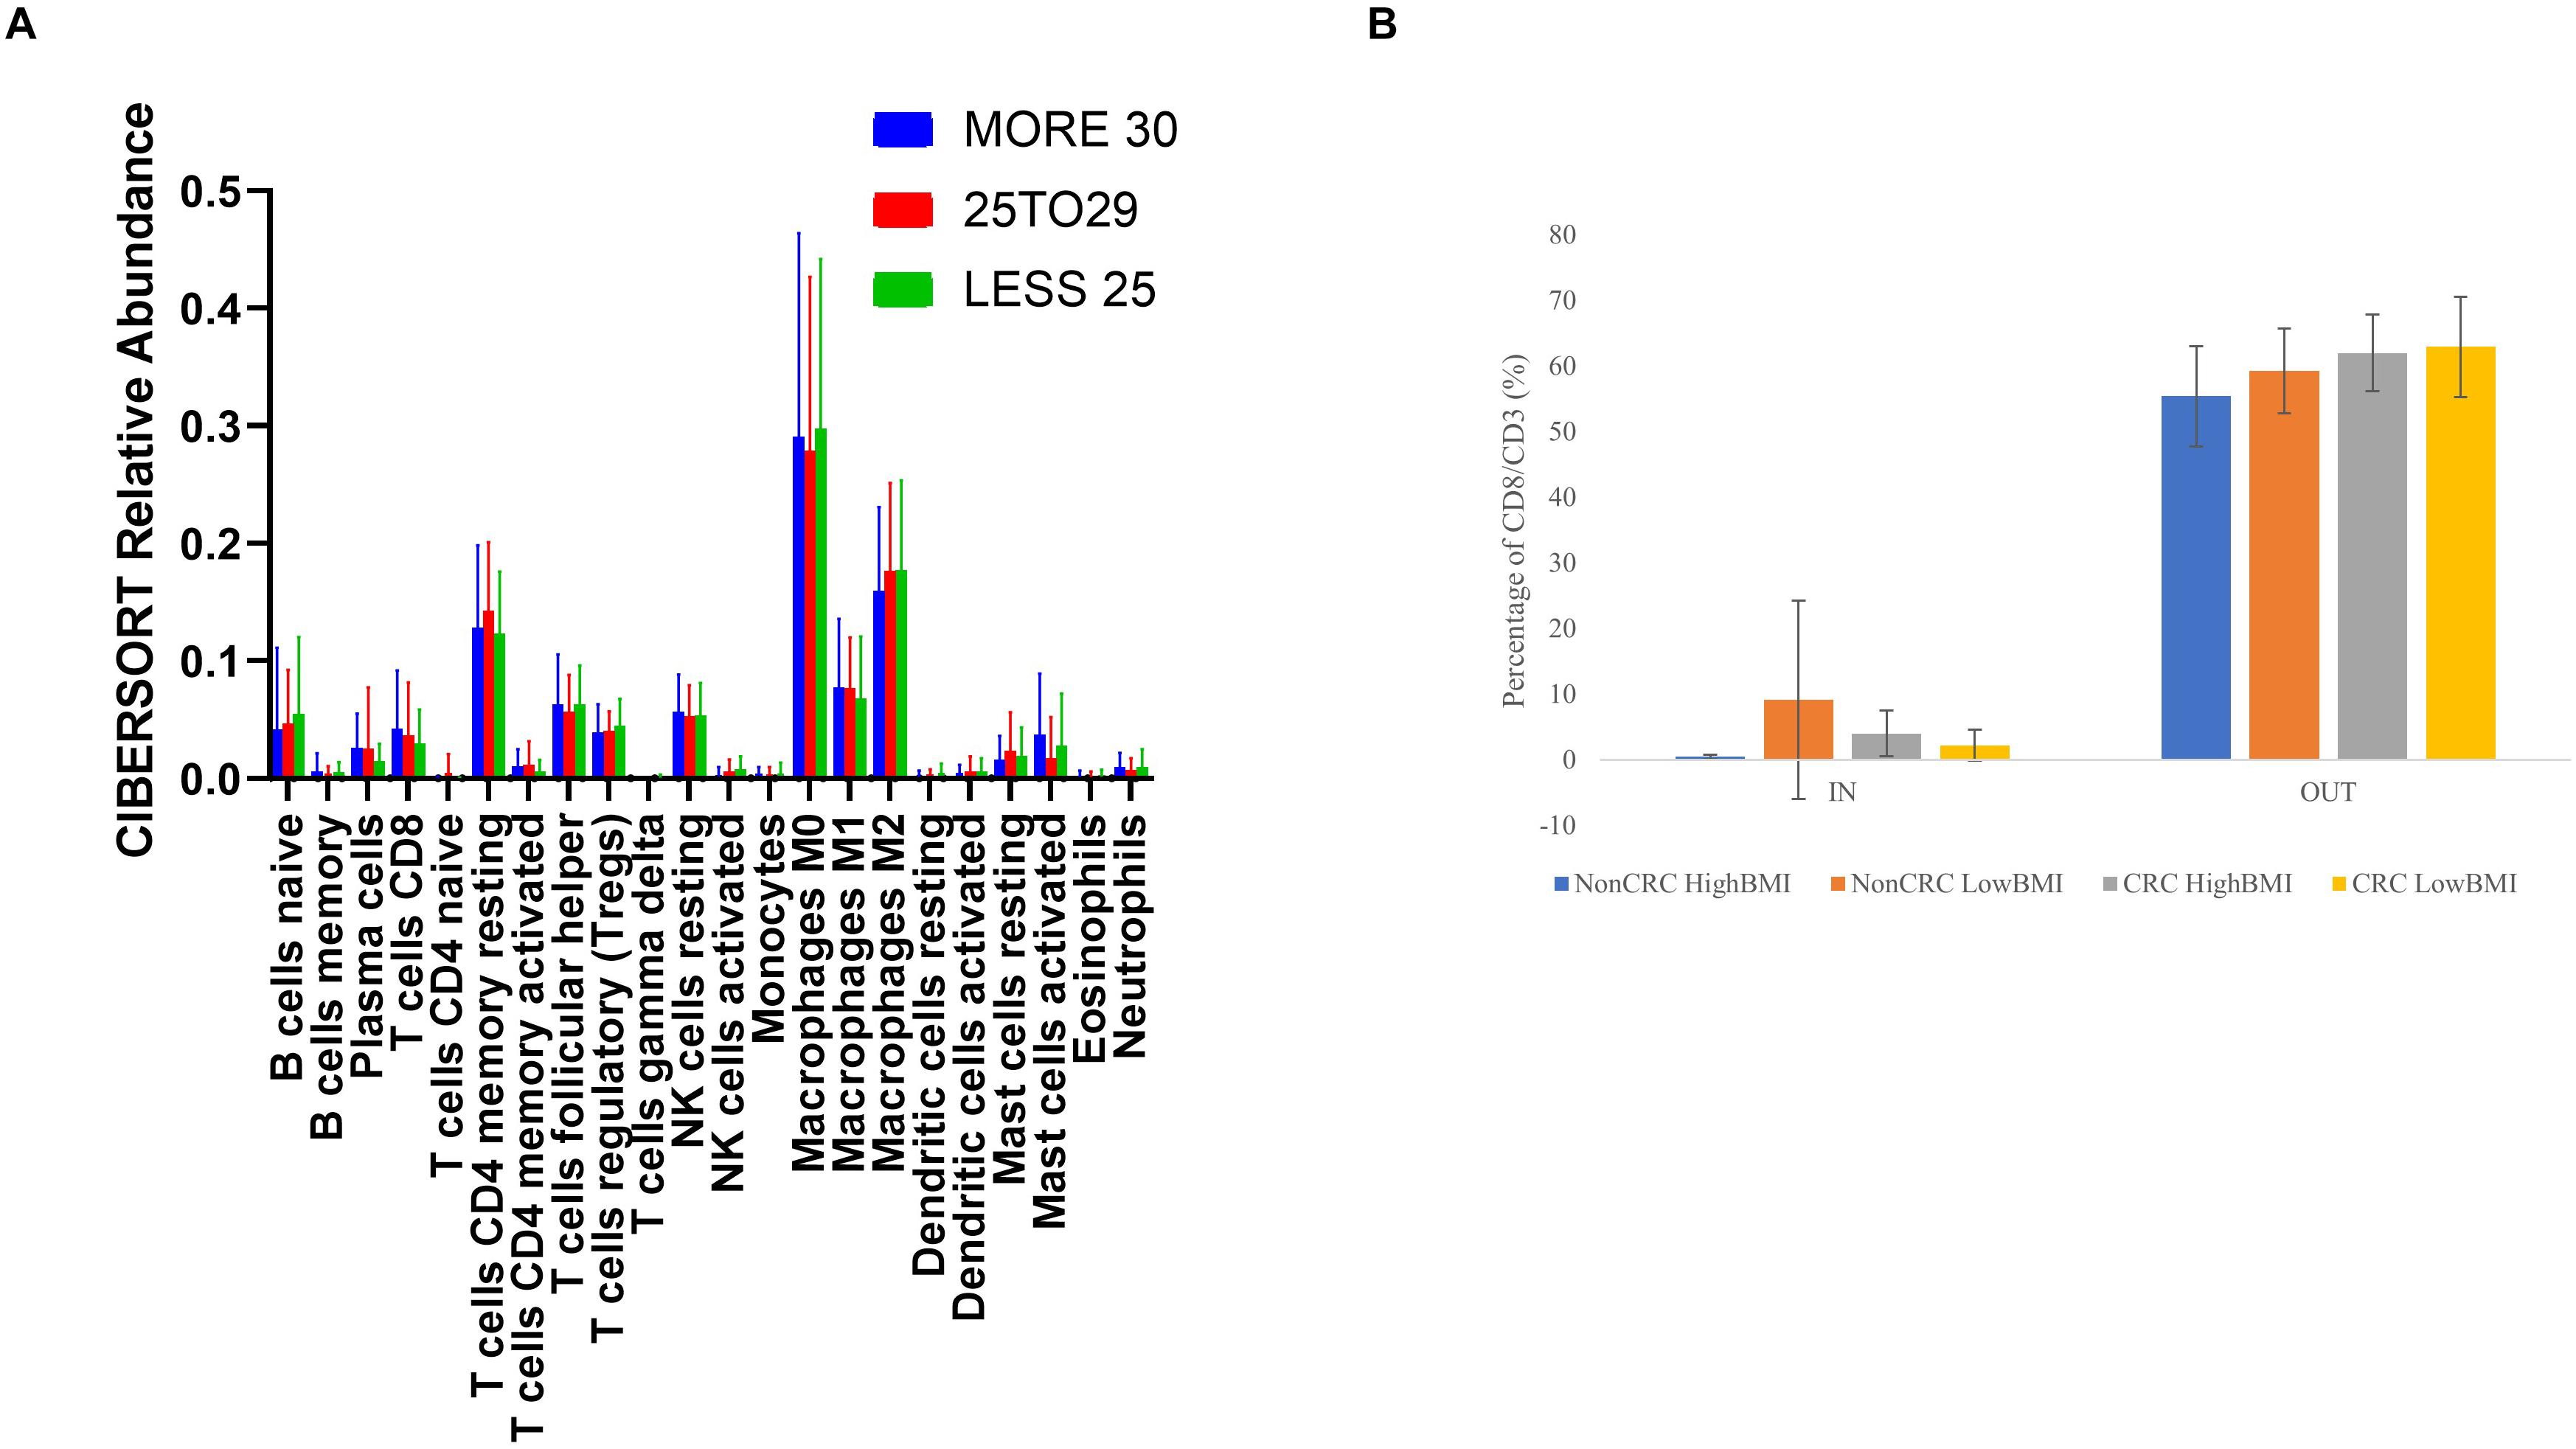
Figure 5. (A) Mean ± SD fractions of tumor-infiltrating immune cells based on different BMI status from the TCGA cohort using CIBERSORT analysis HighBMI: > 30 kg/m2, Normal BMI: 29.9–25 kg/m2, LowBMI:25–18.5 kg/m2. (B) Percentage of T cells in the IN and OUT population of the assay.
Discussion
The “obesity paradox” is an intriguing concept in linking adiposity and cancer prognosis (Park et al., 2018; Ujvari et al., 2019). Interestingly, there seems to be a link between obesity and the tumor microenvironment, particularly the immune parameters and mechanisms, especially in CD8 T cells (Turbitt et al., 2020). The strong association between BMI and immune response has been well-established, particularly in immunotherapy-based treatments (Ilavská et al., 2012; Canter et al., 2018). The release of soluble factors such as cytokines or hormones has been known to be regulated by the presence of obesity/adiposity or high BMI (Schmidt et al., 2015; Del Cornò et al., 2016). Nevertheless, with regard to EVs, no studies have been conducted to delineate the effects of BMI, much less CRC-related BMI toward the tumor microenvironment. Indeed, our study has shown that there may be subtle differing effects of the BMI and the presence of cancer on the functional roles of EV, especially in mediating response to CD8 T cells.
Extracellular vesicles are defined as membrane encapsulated vesicles that are released from the cells and into the bodily fluids. In the EV subset, exosomes are known to be sized between 30 and 150 nm, whereas microvesicles are sized between 100 and 1000 nm (Doyle and Wang, 2019). Our isolated EVs are sized on average roughly between 201.86 and 364.94 nm as measured using DLS method. Other methods of measurement, for instance using nanoparticle tracking analysis, should also be conducted to further confirm the size of the isolated EVs, however this instrument is not available to us at the time of the study (Doyle and Wang, 2019). Interestingly, in the isolated EVs within the non-CRC group, the lowBMI EVs had a larger size, this was opposite than what was found in the CRC group where the highBMI EVs were larger. In a study by Enjeti et al. (2017), it was shown that the BMI status and lipid profile may affect the released microvesicles in terms of marker and functional effects.
The functional roles of EVs in the tumor microenvironment have been previously established in several cancers, such as melanoma (Sharma et al., 2020), head and neck cancer (Ludwig et al., 2017; Maybruck et al., 2017), pancreatic cancer (Fan et al., 2018), and breast cancer (Wen et al., 2016). In relation to CD8 T cells, several recent studies have shown that EVs from cancer patients as well as from cancer cell lines were able to suppress CD8 T cells by inducing apoptosis and reducing cell proliferation (Muller et al., 2016; Ludwig et al., 2017; Sharma et al., 2020). For instance, a study by Maybruck et al. (2017) showed that tumor-derived exosomes suppressed CD8 T cells. Our results indicate that low BMI-CRC EVs induced more apoptosis in CD8 T cells than the high BMI-CRC EVs, however, no significance was observed in the non-CRC groups. We wanted to see whether this same effect could also be seen in terms of proliferation, so we performed the CFSE based assay. As expected, the number of proliferating cells in T cells co-incubated with low BMI-CRC EVs was also reduced although no significance was observed. Studies have shown that EVs carrying Fas/FasL were able to mediate apoptosis in immune cells (Abusamra et al., 2005). In this study, there was a difference in the apoptotic rate of the CD8 T cells, but we have not confirmed the mechanism of apoptosis. Apart from that, the detection of soluble Fas (sFas) was indeed higher in highBMI-CRC group. It was previously shown that the release of sFas could inhibit fas-mediated apoptosis (Cheng et al., 1994; Cascino et al., 1995; Volpe et al., 2016). Therefore, we postulate that the EVs could stimulate the release of higher sFas in highBMI-CRC group, and subsequently lead to a lower percentage of cell death than lowBMI-CRC group. Nevertheless, further confirmation of this proposed mechanism is needed.
Multiple studies have shown that obesity or patients with high adiposity often have T cell dysfunction either in terms of T cell metabolism, T cell exhaustion, or overall T cell reactivity (Aguilar and Murphy, 2018; Wang et al., 2019). The presence of chronic inflammation as a result of obesity have exacerbated the production of inflammation-related cytokines (Schmidt et al., 2015). As evidenced by our results, the release of several cytokines differed between the different groups. IL-17A, IL-10, Granzyme A, Perforin and Granulysin, for instance, were generally higher in the non-CRC EVs-treated CD8T cells. However, the levels of other effectors such as IFN-G and Granzyme B were regulated differently. Interestingly, it has been shown that the release of IFN-G from CD8 T cells increases its cytotoxic activity and thus reducing tumorigenesis (Bhat et al., 2017; Ni and Lu, 2018). Nevertheless, recent studies have shown that IFN-G possessed dual roles in regulating cancer. Apart from being involved in immunosurveillance, IFN-G was shown to promote tumorigenesis via immunoevasion (Mojic et al., 2017; Ni and Lu, 2018). Although various factors could influence the release of IFN-G, it is interesting to note that the EVs from CRC patients were able to elicit higher amounts of IFN-G than the non-CRC EVs. Interestingly, when comparing CRC and Non-CRC-treated T cells, the RNA level of IL-2 and IL-3 were significantly regulated. IL-2 has been shown to be able to regulate the activity of CD8 T cells in terms of memory and activation (Mallard et al., 2004; Kalia and Sarkar, 2018; Maimela et al., 2019).
Besides the apoptotic effects, the tumor-infiltrating abilities of the T cells were also investigated using a modified 3D spheroid model (Courau et al., 2019). Prior to that, we wanted to get an overview of the immune cell composition with regards to the BMI status using bulk RNA-Seq data. Based on our CIBERSORT analysis using TCGA data, although no significance was observed, there was an elevated level of CD8 T cells in the higher BMI group. In a study by Hanyuda et al. (2016), they found that there were no significant association between CRC risk and BMI based on the density of T cells, including CD8 T cells. Therefore, we wanted to see whether the EVs isolated from these different groups could affect the ability of lymphocytes in infiltrating tumor spheroids. Interestingly, lymphocytes treated with CRC-HighBMI EVs were able to penetrate the tumor spheroids at higher concentrations than the CRC-LowBMI EVs, albeit no significance was observed. Interestingly, in the non-CRC groups, the low BMI group had higher infiltration than the high BMI EVs. This also shows that non-CRC EVs could be more effective at inducing lymphocyte infiltration than CRC EVs, and interestingly, the effects of BMI were opposite in the two groups. This indicates that the “BMI effect” may also be dependent on the health status of the subjects. However, this preliminary results still need further confirmation in a more translational model.
Based on our transcriptomic analysis, there were differences in the regulation of lncRNAs between CRC and non-CRC EV-treated T cells. Although the information on the regulation of lncRNA within the CD8 T cells transcriptomic profile is still limited, it has been shown that lncRNAs are able to function as immunomodulators (Zhou et al., 2019). For instance, in a recent study, it was discovered that the lncRNA Morrbid was able to regulate CD8 T cell survival upon viral infection (Kotzin et al., 2019). In a different study, Ji et al. (2018), showed that lnc-tim3 was able to regulate CD8 T cell exhaustion in hepatocellular carcinoma. In this study, we discovered that upon co-incubation with different EVs, the regulation of lncRNA within the T cells was also affected but no further in-depth analysis was conducted. Collectively, there is still a lot of uncharted territories when it comes to lncRNA regulation in CD8T cells and more future studies are needed to fully elucidate its role especially in tumor-related immunity.
Conclusion
For this study, we used BMI as a measurement to differentiate overweight and lean patients. Nevertheless, it has been shown that the percentage of adipose tissue is a more accurate determinant in categorizing obesity (Martinez-Useros and Garcia-Foncillas, 2016; Caan et al., 2018). This is the limitation of our study, the only information available to us at the time of collection for the CRC samples is the height and weight of the patients before obtaining the samples. Further correlation between adiposity and tumor immunity could strengthen the outcome of this study. Apart from the BMI factor, the status of microsatellite stability also plays an important role in terms of treatment selection and overall prognosis (Boland and Goel, 2010). Moreover, it has been shown that patients with microsatellite stable (MSS) cancers do not benefit from immunotherapy as microsatellite instable (MSI) cancers (Emambux et al., 2018). In fact, in a recent study, it was shown that the dynamics of the T-cells phenotype differ between MSS and MSI cancers (Di et al., 2020). Future studies should be conducted to correlate the status of microsatellite stability with the functional effects of EVs.
On top of that, based on the distribution of our samples, most of the CRC samples were derived from male patients, thus creating a gender imbalance in the overall population. A study by Enjeti et al. (2017), has shown that there were no significant differences in the level of microvesicles between males and females, however, there were functional differences in terms of procoagulant activity. We are aware of this limitation, and this should be further considered for future downstream analysis and careful interpretation of this data. Apart from that, the CRC samples were obtained from patients with different stages of CRC. This could also affect the interpretation of this data. Furthermore, we isolated the total pre-enriched fraction of EVs from the serum instead of focusing on either small EVs or marker-specific EVs such as CD63 + or CD81 + population. We wanted to see whether as a whole population of EVs could affect the activity of the lymphocytes, although there could be a specific population within the EVs that contribute to the immune function. Further purification or isolation of specific sub-group of EVs such as small EVs could also enhance our understanding of the mechanism of EVs-mediated immunity. On top of that, we isolated the EVs from the systemic circulation using blood derived from the patients. We are unable to determine which cells do the EVs originated from. This should be further elucidated in future experiments to determine precisely which cells contribute toward the immunomodulating EVs. Overall, the results we presented here are a “proof of concept” that BMI could be a factor in influencing the roles of EVs and this may eventually lead to the suppression of tumor immunity. Nevertheless, further in-depth analysis is needed to concretely establish the relationship between BMI, cancer and immune suppression. On top of that, further studies on the role of EVs toward other immune cells such as CD4 and natural killer cells, and how they regulate the effector roles of these cells should also be investigated.
Data Availability Statement
The datasets presented in this study can be found in online repositories. The names of the repository/repositories and accession number(s) can be found below: “https://www.ncbi.nlm.nih.gov/, GSE152508 and https://www.ncbi.nlm.nih.gov/geo/query/acc.cgi?acc=GSE152508.”
Ethics Statement
The studies involving human participants were reviewed and approved by Universiti Kebangsaan Malaysia’s Ethical Committee on Human Research. The patients/participants provided their written informed consent to participate in this study.
Author Contributions
NA, NO, NR, and NB: formal analysis. NA: funding acquisition. NO, NR, NB, SN, and JC: investigation. NA, NO, and SN: methodology. LM, ZA, and RJ: resources. NA and RJ: supervision. NA and NO: writing – original draft. RJ: writing – review and editing. All authors contributed to the article and approved the submitted version.
Funding
This project was supported by the Universiti Kebangsaan Malaysia with the grant number (GGPM-2017-096).
Conflict of Interest
The authors declare that the research was conducted in the absence of any commercial or financial relationships that could be construed as a potential conflict of interest.
Acknowledgments
We would also like to acknowledge the Malaysian Cohort Project for providing the samples needed for this project. In addition to that, we would like to acknowledge the UMBI Biobank Team for assisting us in sample collection. Lastly, we would like to acknowledge the help received from Unit Elektron Mikroskopi, Hospital Tuanku Canselor Mukhriz as well as the i-CRIM morphology lab for assistance on the transmission electron microscopy and zeta-sizer analysis experiment. Furthermore, some of the results shown here are in whole or part based upon data generated by the TCGA Research Network: https://www.cancer.gov/tcga.
Footnotes
References
Abusamra, A. J., Zhong, Z., Zheng, X., Li, M., Ichim, T. E., Chin, J. L., et al. (2005). Tumor exosomes expressing Fas ligand mediate CD8+ T-cell apoptosis. Blood Cells Mol. Dis. 35, 169–173. doi: 10.1016/j.bcmd.2005.07.001
Aguilar, E. G., and Murphy, W. J. (2018). Obesity induced T cell dysfunction and implications for cancer immunotherapy. Curr. Opin. Immunol. 51, 181–186. doi: 10.1016/j.coi.2018.03.012
Aparicio, T., Ducreux, M., Faroux, R., Barbier, E., Manfredi, S., Lecomte, T., et al. (2018). Overweight is associated to a better prognosis in metastatic colorectal cancer: a pooled analysis of FFCD trials. Eur. J. Cancer 98, 1–9. doi: 10.1016/j.ejca.2018.03.031
Berntsson, J., Eberhard, J., Nodin, B., Leandersson, K., Larsson, A. H., and Jirström, K. (2019). Pre-diagnostic anthropometry, sex, and risk of colorectal cancer according to tumor immune cell composition. Oncoimmunology 8:e1664275. doi: 10.1080/2162402X.2019.1664275
Bhat, P., Leggatt, G., Waterhouse, N., and Frazer, I. H. (2017). Interferon-γ derived from cytotoxic lymphocytes directly enhances their motility and cytotoxicity. Cell Death Dis. 8:e2836. doi: 10.1038/cddis.2017.67
Boland, C. R., and Goel, A. (2010). Microsatellite instability in colorectal cancer. Gastroenterology 138, 2073–2087.e3. doi: 10.1053/j.gastro.2009.12.064
Bray, F., Ferlay, J., Soerjomataram, I., Siegel, R. L., Torre, L. A., and Jemal, A. (2018). Global cancer statistics 2018: GLOBOCAN estimates of incidence and mortality worldwide for 36 cancers in 185 countries. CA Cancer J. Clin. 68, 394–424. doi: 10.3322/caac.21492
Caan, B. J., Cespedes Feliciano, E. M., and Kroenke, C. H. (2018). The importance of body composition in explaining the overweight paradox in cancer-counterpoint. Cancer Res. 78, 1906–1912. doi: 10.1158/0008-5472.CAN-17-3287
Canter, R. J., Aguilar, E., Wang, Z., Le, C., Khuat, L., Dunai, C., et al. (2018). Obesity results in higher PD-1-mediated T-cell suppression but greater T-cell effector functions following blockade. J. Clin. Oncol. 36, 65–65. doi: 10.1200/JCO.2018.36.5_suppl.65
Cascino, I., Fiucci, G., Papoff, G., and Ruberti, G. (1995). Three functional soluble forms of the human apoptosis-inducing Fas molecule are produced by alternative splicing. J. Immunol. 154, 2706–2713.
Chen, B., Khodadoust, M. S., Liu, C. L., Newman, A. M., and Alizadeh, A. A. (2018). Profiling tumor infiltrating immune cells with CIBERSORT. Methods Mol. Biol. 1711, 243–259. doi: 10.1007/978-1-4939-7493-1_12
Cheng, J., Zhou, T., Liu, C., Shapiro, J., Brauer, M., Kiefer, M., et al. (1994). Protection from Fas-mediated apoptosis by a soluble form of the Fas molecule. Science 263, 1759–1762. doi: 10.1126/science.7510905
Cortellini, M., Bersanelli, S. Buti, Cannita, K., Santini, D., Perrone, F., Giusti, R., et al. (2019). A multicenter study of body mass index in cancer patients treated with anti-PD-1/PD-L1 immune checkpoint inhibitors: when overweight becomes favorable. J. Immunother. Cancer 7:57. doi: 10.1186/s40425-019-0527-y
Courau, T., Bonnereau, J., Chicoteau, J., Bottois, H., Remark, R., Assante Miranda, L., et al. (2019). Cocultures of human colorectal tumor spheroids with immune cells reveal the therapeutic potential of MICA/B and NKG2A targeting for cancer treatment. J. Immunother. Cancer 7:74. doi: 10.1186/s40425-019-0553-9
Del Cornò, M., D’Archivio, M., Conti, L., Scazzocchio, B., Varì, R., Donninelli, G., et al. (2016). Visceral fat adipocytes from obese and colorectal cancer subjects exhibit distinct secretory and ω6 polyunsaturated fatty acid profiles and deliver immunosuppressive signals to innate immunity cells. Oncotarget 7, 63093–63105. doi: 10.18632/oncotarget.10998
Di, J., Liu, M., Fan, Y., Gao, P., Wang, Z., Jiang, B., et al. (2020). Phenotype molding of T cells in colorectal cancer by single-cell analysis. Intern. J. Cancer 146, 2281–2295. doi: 10.1002/ijc.32856
Dörsam, B., Reiners, K. S., and von Strandmann, E. P. (2018). Cancer-derived extracellular vesicles: friend and foe of tumour immunosurveillance. Philos. Trans. R. Soc. Lond. B Biol. Sci. 373:20160481. doi: 10.1098/rstb.2016.0481
Doyle, L. M., and Wang, M. Z. (2019). Overview of extracellular vesicles, their origin, composition, purpose, and methods for exosome isolation and analysis. Cells 8:727. doi: 10.3390/cells8070727
Emambux, S., Tachon, G., Junca, A., and Tougeron, D. (2018). Results and challenges of immune checkpoint inhibitors in colorectal cancer. Cell 18, 561–573. doi: 10.1080/14712598.2018.1445222
Emig, D., Salomonis, N., Baumbach, J., Lengauer, T., Conklin, B. R., and Albrecht, M. (2010). AltAnalyze and domaingraph: analyzing and visualizing exon expression data. Nucleic Acids Res. 38, W755–W762. doi: 10.1093/nar/gkq405
Enjeti, A. K., Ariyarajah, A., D’Crus, A., Seldon, M., and Lincz, L. F. (2017). Circulating microvesicle number, function and small RNA content vary with age, gender, smoking status, lipid and hormone profiles. Thromb. Res. 156, 65–72. doi: 10.1016/j.thromres.2017.04.019
Fan, J., Wei, Q., Koay, E. J., Liu, Y., Ning, B., Bernard, P. W., et al. (2018). Chemoresistance transmission via exosome-mediated EphA2 transfer in pancreatic cancer. Theranostics 8, 5986–5994. doi: 10.7150/thno.26650
Hanyuda, A., Ogino, S., Qian, Z. R., Nishihara, R., Song, M., Mima, K., et al. (2016). Body mass index and risk of colorectal cancer according to tumor lymphocytic infiltrate. Intern. J. Cancer 139, 854–868. doi: 10.1002/ijc.30122
Herter, S., Morra, L., Schlenker, R., Sulcova, J., Fahrni, L., Waldhauer, I., et al. (2017). A novel three-dimensional heterotypic spheroid model for the assessment of the activity of cancer immunotherapy agents. Cancer Immunol. Immunother. 66, 129–140. doi: 10.1007/s00262-016-1927-1
Hon, K. W., Ab-Mutalib, N. S., Abdullah, N. M. A., Jamal, R., and Abu, N. (2019). Extracellular Vesicle-derived circular RNAs confers chemoresistance in colorectal cancer. Sci. Rep. 9:16497. doi: 10.1038/s41598-019-53063-y
Ilavská, S., Horváthová, M., Szabová, M., Nemessányi, T., Jahnová, E., Tulinská, J., et al. (2012). Association between the human immune response and body mass index. Hum. Immunol. 73, 480–485. doi: 10.1016/j.humimm.2012.02.023
Ji, J., Yin, Y., Ju, H., Xu, X., Liu, W., Fu, Q., et al. (2018). Long non-coding RNA Lnc-Tim3 exacerbates CD8 T cell exhaustion via binding to Tim-3 and inducing nuclear translocation of Bat3 in HCC. Cell Death Dis. 9, 478–478. doi: 10.1038/s41419-018-0528-7
Jochem, C., and Leitzmann, M. (2016). Obesity and colorectal cancer. recent results in cancer research. Fortschritte Krebsforsch. Prog. Recherch. Cancer 208, 17–41. doi: 10.1007/978-3-319-42542-9_2
Kalia, V., and Sarkar, S. (2018). Regulation of effector and memory CD8 T cell differentiation by IL-2—A balancing act. Front. Immunol. 9:2987. doi: 10.3389/fimmu.2018.02987
Kanehisa, M., Furumichi, M., Tanabe, M., Sato, Y., and Morishima, K. (2016). KEGG: new perspectives on genomes, pathways, diseases and drugs. Nucleic Acids Res. 45, D353–D361. doi: 10.1093/nar/gkw1092
Kanehisa, M., Sato, Y., Furumichi, M., Morishima, K., and Tanabe, M. (2019). New approach for understanding genome variations in KEGG. Nucleic Acids Res. 47, D590–D595. doi: 10.1093/nar/gky962
Kim, A., Shah, A. S., and Nakamura, T. (2018). Extracellular vesicles: a potential novel regulator of obesity and its associated complications. Children 5:152. doi: 10.3390/children5110152
Kotzin, J. J., Iseka, F., Wright, J., Basavappa, M. G., Clark, M. L., Ali, M.-A., et al. (2019). The long noncoding RNA Morrbid regulates CD8 T cells in response to viral infection. Proc. Natl. Acad. Sci. U.S.A. 116, 11916–11925. doi: 10.1073/pnas.1819457116
Liao, Y., Wang, J., Jaehnig, E. J., Shi, Z., and Zhang, B. (2019). WebGestalt 2019: gene set analysis toolkit with revamped UIs and APIs. Nucleic Acids Res. 47, W199–W205. doi: 10.1093/nar/gkz401
Lim, J. U., Li, J. H., Kim, J. S., Hwang, Y. I., Kim, T., Lim, S. Y., et al. (2017). Comparison of World Health Organization and Asia-Pacific body mass index classifications in COPD patients. Int. J. Chron. Obstruct. Pulmon. Dis. 12, 2465–2475. doi: 10.2147/COPD.S141295
Ludwig, S., Floros, T., Theodoraki, M. N., Hong, C. S., Jackson, E. K., Lang, S., et al. (2017). Suppression of lymphocyte functions by plasma exosomes correlates with disease activity in patients with head and neck cancer. Clin. Cancer Res. 23, 4843–4854. doi: 10.1158/1078-0432.CCR-16-2819
Maimela, N. R., Liu, S., and Zhang, Y. (2019). Fates of CD8+ T cells in tumor microenvironment. Comput. Struct. Biotechnol. J. 17, 1–13. doi: 10.1016/j.csbj.2018.11.004
Mallard, E., Vernel-Pauillac, F., Velu, T., Lehmann, F., Abastado, J.-P., Salcedo, M., et al. (2004). IL-2 production by virus- and tumor-specific human CD8 T cells is determined by their fine specificity. J. Immunol. 172, 3963–3970. doi: 10.4049/jimmunol.172.6.3963
Martinez-Useros, J., and Garcia-Foncillas, J. (2016). Obesity and colorectal cancer: molecular features of adipose tissue. J. Transl. Med. 14:21. doi: 10.1186/s12967-016-0772-5
Maybruck, B. T., Pfannenstiel, L. W., Diaz-Montero, M., and Gastman, B. R. (2017). Tumor-derived exosomes induce CD8+ T cell suppressors. J. Immunother. Cancer 5:65. doi: 10.1186/s40425-017-0269-7
Meyerhardt, J. A., Catalano, P. J., Haller, D. G., Mayer, R. J., Benson, A. B. III, Macdonald, J. S., et al. (2003). Influence of body mass index on outcomes and treatment-related toxicity in patients with colon carcinoma. Cancer 98, 484–495. doi: 10.1002/cncr.11544
Mojic, M., Takeda, K., and Hayakawa, Y. (2017). The dark side of IFN-γ: its role in promoting cancer immunoevasion. Int. J. Mol. Sci. 19:89. doi: 10.3390/ijms19010089
Muller, L., Mitsuhashi, M., Simms, P., Gooding, W. E., and Whiteside, T. L. (2016). Tumor-derived exosomes regulate expression of immune function-related genes in human T cell subsets. Sci. Rep. 6:20254. doi: 10.1038/srep20254
Muller, L., Simms, P., Hong, C.-S., Nishimura, M. I., Jackson, E. K., Watkins, S. C., et al. (2017). Human tumor-derived exosomes (TEX) regulate Treg functions via cell surface signaling rather than uptake mechanisms. Oncoimmunology 6:e1261243. doi: 10.1080/2162402X.2016.1261243
Murphy, T. K., Calle, E. E., Rodriguez, C., Kahn, H. S., and Thun, M. J. (2000). Body mass index and colon cancer mortality in a large prospective study. Am. J. Epidemiol. 152, 847–854. doi: 10.1093/aje/152.9.847
Newman, A. M., Steen, C. B., Liu, C. L., Gentles, A. J., Chaudhuri, A. A., Scherer, F., et al. (2019). Determining cell type abundance and expression from bulk tissues with digital cytometry. Nat. Biotechnol. 37, 773–782. doi: 10.1038/s41587-019-0114-2
Ni, L., and Lu, J. (2018). Interferon gamma in cancer immunotherapy. Cancer Med. 7, 4509–4516. doi: 10.1002/cam4.1700
Othman, N., Jamal, R., and Abu, N. (2019). Cancer-derived exosomes as effectors of key inflammation-related players. Front. Immunol. 10:2103. doi: 10.3389/fimmu.2019.02103
Park, Y., Peterson, L. L., and Colditz, G. A. (2018). The plausibility of obesity paradox in cancer-point. Cancer Res. 78, 1898–1903. doi: 10.1158/0008-5472.CAN-17-3043
Picard, E., Verschoor, C. P., Ma, G. W., and Pawelec, G. (2020). Relationships between immune landscapes, genetic subtypes and responses to immunotherapy in colorectal cancer. Front. Immunol. 11:369. doi: 10.3389/fimmu.2020.00369
Ragni, E., Banfi, F., Barilani, M., Cherubini, A., Parazzi, V., Larghi, P., et al. (2017). Extracellular vesicle-shuttled mRNA in mesenchymal stem cell communication. Stem Cells 35, 1093–1105. doi: 10.1002/stem.2557
Riihimäki, M., Hemminki, A., Sundquist, J., and Hemminki, K. (2016). Patterns of metastasis in colon and rectal cancer. Sci. Rep. 6:29765. doi: 10.1038/srep29765
Schmidt, F. M., Weschenfelder, J., Sander, C., Minkwitz, J., Thormann, J., Chittka, T., et al. (2015). Inflammatory cytokines in general and central obesity and modulating effects of physical activity. PLoS One 10:e0121971. doi: 10.1371/journal.pone.0121971
Shahjehan, F., Merchea, A., Cochuyt, J. J., Li, Z., Colibaseanu, D. T., and Kasi, P. M. (2018). Body mass index and long-term outcomes in patients with colorectal cancer. Front. Oncol. 8:620. doi: 10.3389/fimmu.2020.00620
Sharma, P., Diergaarde, B., Ferrone, S., Kirkwood, J. M., and Whiteside, T. L. (2020). Melanoma cell-derived exosomes in plasma of melanoma patients suppress functions of immune effector cells. Sci. Rep. 10:92. doi: 10.1038/s41598-019-56542-4
Sinicrope, F. A., Foster, N. R., Yothers, G., Benson, A., Seitz, J. F., Labianca, R., et al. (2013). Body mass index at diagnosis and survival among colon cancer patients enrolled in clinical trials of adjuvant chemotherapy. Cancer 119, 1528–1536. doi: 10.1002/cncr.27938
Szatanek, R., Baj-Krzyworzeka, M., Zimoch, J., Lekka, M., Siedlar, M., and Baran, J. (2017). The methods of choice for extracellular vesicles (EVs) characterization. Int. J. Mol. Sci. 18:1153. doi: 10.3390/ijms18061153
Tran, C. G., Hill, E. E., Jensen, B., Stark, A. C., Flannery, M., Berg, D. J., et al. (2018). Survival benefit of obesity in stage IV colorectal cancer: better tolerability of chemotherapy? J. Clin. Oncol. 36:e15629. doi: 10.1200/JCO.2018.36.15_suppl.e15629
Turbitt, W. J., Buchta Rosean, C., Weber, K. S., and Norian, L. A. (2020). Obesity and CD8 T cell metabolism: implications for anti-tumor immunity and cancer immunotherapy outcomes. Immunol. Rev. 295, 203–219. doi: 10.1111/imr.12849
Ujvari, B., Jacqueline, C., Misse, D., Amar, V., Fitzpatrick, J. C., Jennings, G., et al. (2019). Obesity paradox in cancer: is bigger really better? Evol. Appl. 12, 1092–1095. doi: 10.1111/eva.12790
Volpe, E., Sambucci, M., Battistini, L., and Borsellino, G. (2016). Fas–Fas Ligand: checkpoint of T cell functions in multiple sclerosis. Front. Immunol. 7:382. doi: 10.3389/fimmu.2016.00382
Wang, Z., Aguilar, E. G., Luna, J. I., and Dunai, C. (2019). Paradoxical effects of obesity on T cell function during tumor progression and PD-1 checkpoint blockade. Nat. Med. 25, 141–151. doi: 10.1038/s41591-018-0221-5
Wen, S. W., Sceneay, J., Lima, L. G., Wong, C. S. F., Becker, M., Krumeich, S., et al. (2016). The biodistribution and immune suppressive effects of breast cancer–derived exosomes. Cancer Res. 76:6816. doi: 10.1158/0008-5472.CAN-16-0868
Whiteside, T. L. (2017). Exosomes carrying immunoinhibitory proteins and their role in cancer. Clin. Exper. Immunol. 189, 259–267. doi: 10.1111/cei.12974
WHO Expert Consultation (2004). Appropriate body-mass index for Asian populations and its implications for policy and intervention strategies. Lancet 363, 157–163. doi: 10.1016/S0140-6736(03)15268-3
Keywords: obesity, lymphocytes, microvesicles, anti-tumor immunity, long non-coding RNA
Citation: Abu N, Othman N, Ab Razak NS, Bakarurraini NAAR, Nasir SN, Soh JEC, Mazlan L, Azman ZAM and Jamal R (2020) Extracellular Vesicles Derived From Colorectal Cancer Affects CD8 T Cells: An Analysis Based on Body Mass Index. Front. Cell Dev. Biol. 8:564648. doi: 10.3389/fcell.2020.564648
Received: 22 May 2020; Accepted: 24 August 2020;
Published: 26 November 2020.
Edited by:
Lasse Dahl Ejby Jensen, Linköping University, SwedenReviewed by:
Santos Mañes, Consejo Superior de Investigaciones Científicas (CSIC), SpainVanessa Morais Freitas, University of São Paulo, Brazil
Copyright © 2020 Abu, Othman, Ab Razak, Bakarurraini, Nasir, Soh, Mazlan, Azman and Jamal. This is an open-access article distributed under the terms of the Creative Commons Attribution License (CC BY). The use, distribution or reproduction in other forums is permitted, provided the original author(s) and the copyright owner(s) are credited and that the original publication in this journal is cited, in accordance with accepted academic practice. No use, distribution or reproduction is permitted which does not comply with these terms.
*Correspondence: Nadiah Abu, nadiah.abu@ppukm.ukm.edu.my