 Maximilian Biermann
 Rubén M. Montañés
 Fredrik Normann
 Filip Johnsson
- Division of Energy Technology, Department of Space, Earth, and Environment, Chalmers University of Technology, Gothenburg, Sweden
This work investigates the effects of carbon allocation on the emission intensities of low-carbon products cogenerated in facilities that co‐process biogenic and fossil feedstocks and apply the carbon capture utilization and storage technology. Thus, these plants simultaneously sequester CO2 and synthesize fuels or chemicals. We consider an integrated steel mill that injects biomass into the blast furnace, captures CO2 for storage, and ferments CO into ethanol from the blast furnace gas. We examine two schemes to allocate the CO2 emissions avoided [due to the renewable feedstock share (biomass) and CO2 capture and storage (CCS)] to the products of steel, ethanol, and electricity (generated through the combustion of steel mill waste gases): 1) allocation by (carbon) mass, which represents actual carbon flows, and 2) a free-choice attribution that maximizes the renewable content allocated to electricity and ethanol. With respect to the chosen assumptions on process performance and heat integration, we find that allocation by mass favors steel and is unlikely to yield an ethanol product that fulfills the Renewable Energy Directive (RED) biofuel criterion (65% emission reduction relative to a fossil comparator), even when using renewable electricity and applying CCS to the blast furnace gas prior to CO conversion into ethanol and electricity. In contrast, attribution fulfills the criterion and yields bioethanol for electricity grid intensities <180 gCO2/kWhel without CCS and yields bioethanol for grid intensities up to 800 gCO2/kWhel with CCS. The overall emissions savings are up to 27 and 47% in the near-term and long-term future, respectively. The choice of the allocation scheme greatly affects the emissions intensities of cogenerated products. Thus, the set of valid allocation schemes determines the extent of flexibility that manufacturers have in producing low-carbon products, which is relevant for industries whose product target sectors that value emissions differently. We recommend that policymakers consider the emerging relevance of co‐processing in nonrefining facilities. Provided there is no double-accounting of emissions, policies should contain a reasonable degree of freedom in the allocation of emissions savings to low-carbon products, so as to promote the sale of these savings, thereby making investments in mitigation technologies more attractive to stakeholders.
Introduction
To limit the global temperature increase to 1.5°C, global net anthropogenic CO2 emissions will have to fall rapidly over the coming decades and—depending on the trajectory, approach zero by year 2050 (Masson-Delmotte et al., 2018). This is in line with the European Green Deal (European Commission, 2019c) proposed by the European Commission (EC), which aims for a climate-neutral EU by year 2050. To reach climate neutrality, a series of mitigation options, such as material and energy efficiencies, carbon capture utilization and/or storage (CCUS), and the use of renewable energy sources such as wind, solar, and biomass, must be deployed across all sectors, including the base materials industry (Energy Transition Commission, 2018; Agora Energiewende and Wuppertal Institut, 2019). All emission-intensive sectors will experience dramatic changes, including increased sector-coupling and implementation of solutions that involve alignment with circular economy principles (ArcelorMittal, 2020). Within some sectors, several mitigation options are available. In the steel industry, for example, a portfolio of the abovementioned mitigation technologies is available today, but it must be evaluated also against the prospect of breakthrough technologies, such as electrowinning hydrogen direct reduction (Vogl et al., 2018), relying on renewable electricity. Steel mills located in countries with an ample supply of renewable energy will experience favorable conditions to implement such breakthrough technologies or direct reduction with natural gas as an intermediate step (Vogl and Åhman, 2019). Although a first large-scale demonstration of hydrogen direct reduction steel is expected in year 2026 (SSAB, 2019), fossil-based processes will continue to emit until a complete transition to such carbon direct avoidance technologies becomes commercially available and feasible for countries in central Europe with electricity systems that are still reliant on fossil fuels. There is also competition between sectors for renewable biomass and electricity. Given the urgency of climate change and that many of the existing industrial processes will not be immediately made carbon-neutral via breakthrough technologies or shutdown, there is a need to implement a combination of already available technologies for partial mitigation, for example, fuel shifting to biomass and the application of CCS (Biermann et al., 2018; Berghout et al., 2019; Mandova et al., 2019).
When multi-product industrial facilities apply partial mitigation measures, the allocation of emissions or emission savings to the different products becomes important. Schemes for funding or subsidizing mitigation options must be sufficiently precise and robust to reach the desired target, to ensure that emissions savings are only accounted for once (i.e., in one sector), and that there is accounting for all the emissions in affected sectors. Importantly, the principles by which emission savings are allocated to the products determine which low-carbon products are formed and can be sold on existing or emerging markets. An example of this is the renewable content when co‐processing renewable, for example, biogenic, and fossil feedstocks in refineries, which is currently allocated to the formed fuel products by various allocation principles applied in the so-called voluntary schemes that are approved by the EC (European Commission, 2020) and adhere to the current Renewable Energy Directive (RED II) (European Parliament and Council of the European Union, 2018a). RED II and associated regulations state that the overall quantity of renewables must reflect the energy balance and efficiency of the co‐processing (Annex I, Part 1, paragraph 3(c) (ii) of Directive (EU) 2015/652) but leave the definition of valid allocation principles for co‐processing to a so-called “Delegated Act,” which is to be implemented in December 2021 (Hawighorst, 2019). Although discrepancies exist in terms of verifiability, accuracy, and cost (van Dyk et al., 2019), most of these allocation principles lead to a proportional allocation of renewable content to all the products of a refinery (Schimmel et al., 2018). However, companies will have an interest in having flexibility in the allocation to selected, high-revenue products when possible from the technical point of view (Schimmel et al., 2018).
The described current co‐processing regulations are tailored to refinery operations. However, other industries that have nonfuel main products and are also engaging in fuel production should be considered when defining the set of valid allocation principles. A representative example of this is the “TORefying wood with Ethanol as a Renewable Output” (Torero) project for the co‐processing of fossil and biogenic feedstocks in the blast furnace (Torero Consortium, 2017), with subsequent fuel synthesis from the steel mill gases (Steelanol Consortium, 2015). The injection of biomass into the blast furnace has been extensively studied (Mousa et al., 2016; Suopajärvi et al., 2017, Suopajärvi et al., 2018), as has been the application of CCS to steel mill gases (Ho et al., 2013; IEAGHG, 2013; Ramírez-Santos et al., 2018; Sundqvist et al., 2018). Although studies of the life cycle emissions of fuel from steel mill gases have been performed (Ou et al., 2013; Handler et al., 2016), quantification of the renewable content of cogenerated fuel and steel product due to a preceding biomass injection according to the abovementioned allocation principles is unprecedented and explored in detail in this study. The theoretical potential of achieving net-zero emissions in the European steel industry through a strategy of biomass introduction at multiple locations in the blast furnace route combined with CCS has been described by Mandova et al. (2019). Tanzer et al. (2020) have compared all the major primary steel production routes to estimate the bioenergy with carbon capture and storage (BECCS) potential and concluded that supply chain emissions for biomass, and CO2 capture throughout steel and bioenergy production, as well as rigorous monitoring of CO2 storage, are all required to achieve CO2-negative steel. Toktarova et al. (2020) have investigated mitigation pathways toward zero carbon emissions, comparing hydrogen direct reduction and top-gas recycling blast furnaces with biochar injection and CCS in a Swedish context. Yet, their study does not use any detailed energy and mass balances but evaluates techno-economic pathways from data on the annual energy consumption for steel production. However, there is a lack of a more detailed process evaluation of the near-term potential for emissions reductions considering practical and technical limitations of biochar injection and CCS, also in combination with carbon utilization, which we seek to address with this article.
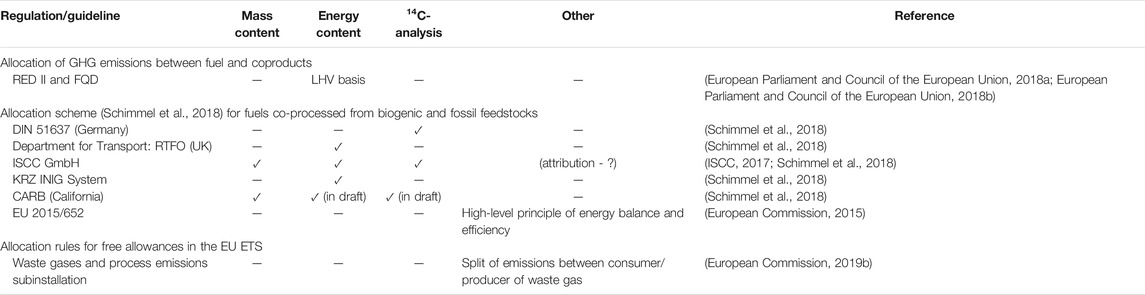
TABLE 1. Regulations and guidelines relevant to this work and the applicable allocation schemes/methodologies that they incorporate. This list is not exhaustive and is based solely on a literature search.
Therefore, this work assesses the implications of different carbon allocation principles for the generation of low-carbon products. The work evaluates the potential for reducing CO2 emissions and the emissions intensities of the products, in a European setting, by implementing CCS and/or bio-substitution of pulverized coal injection (Bio-PCI) at an integrated steel mill that produces a transport fuel or electricity in addition to steel. More specifically, the present work assesses the following:
• The technical (level of bio-substitution) and regulatory (allocation in co‐processing) conditions under which ethanol produced from steel mill off-gases, subsequent to biochar injection into the blast furnace, can be regarded as bioethanol in accordance with current EU regulations;
• The CO2 emissions reduction achievable by CCS and the ethanol synthesis from blast furnace gas as an example of CCUS considering both the near-term feasibility and the theoretical potential for future developments; and
• The energy and emissions intensities of steel, ethanol, and electricity produced in an integrated steel mill that applies CCS and/or Bio-PCI and ethanol synthesis, given selected carbon allocation schemes.
The remainder of this article is organized as follows. The selected mitigation technologies are briefly reviewed in Chapter 2, followed by an overview of relevant EU regulations and guidelines in Chapter 3. Chapter 4 describes the system investigated and the principles of allocation of avoided emissions due to renewable content (due to Bio-PCI) and due to CCS to the final products of steel, ethanol, or electricity. The results in Chapter 5 focus on the impacts of allocation on the flow pathways of carbon, as well as the emissions intensities of the final products. In addition, both the near-term and potential future reductions in emissions brought about by the combined application of the selected mitigation technologies are quantified. Chapter 6 discusses the technical challenges for deep mitigation and the value for producers (in creating low-carbon products) that is generated by the potential flexible allocation of biogenic inputs and avoided CO2 emissions.
NEAR‐TERM MITIGATION TECHNOLOGIES
Integrated steel mills that apply the best-available technology in Europe have achieved carbon intensity levels that are close to technical and theoretical limits (Kirschen et al., 2011). Thus, further reductions will require significant investments in new technologies, as well as a shift toward using renewable fuels. This article focuses on CCS (represented by amine absorption of CO2) and fuel switching from coal to biomass (represented by Bio-PCI), as well as the synthesis of ethanol via fermentation from blast furnace gases. Ethanol is chosen as product since it represents a valuable low-carbon product that is already traded globally at high volumes. However, the discussion in this article should be applicable also to other hydrocarbon products. It is reasonable to assume that these technologies can be implemented within 5 years (FEED, detailed engineering, construction, and commissioning), as both postcombustion capture and the use of biomass have been proven to be feasible, albeit not demonstrated at scale in the steel industry.
Pulverized Biochar Injection
Coke is the primary fuel and reducing agent in blast furnaces, and its replacement comes with both technical and economic challenges. Usually, pulverized coal is injected to reduce significantly the amount of coke, leading to an increase in energy efficiency. However, top-fed coke cannot be replaced completely, given its essential mechanical function in supporting the burden material (Suopajärvi 2018). Replacing pulverized coal injection is the easiest way to introduce biomass (Wang et al., 2015) into an integrated steel mill, and 23%–28% emissions can be mitigated by fully substituting pulverized coal in the blast furnace (Ng et al., 2010; Mathieson et al., 2011; Wang et al., 2015). The most extensively studied biogenic feedstock for iron-making is woody biomass (Suopajärvi et al., 2013). However, the properties of raw biomass differ from those of coal (Shankar Tumuluru et al., 2011) to such an extent that pretreatment is required. Wang and colleagues have estimated the maximum replacement rate potential of coal in a blast furnace with pretreated woody biomass for three pretreatment processes involving wood pellets, torrefied wood, and charcoal (Wang et al., 2015). The low energy density of biomass is explained by its high content oxygen, which, in turns, increases the need for O2-enrichment of the blast, so as to maintain the race-away adiabatic flame temperature in the blast furnace. According to a previous report (Wang et al., 2015), charcoal from pyrolysis can fully replace, while torrefied wood and wood pellets can replace pulverized coal by 22.8% and 20.0%, respectively. The four main technical limitations associated with biomass injection in a blast furnace (BF) are lower calorific value of the biomass, porosity, broader distribution of particle size for injection, and higher levels of alkalis in some biomass products (Suopajärvi 2018). According to a previous study (Ng et al., 2010), charcoal injection affects only weakly the operating conditions of the furnace, and the desirable chemical compositions of the slag and hot metal can be maintained by adjusting the fluxing rate.
Wiklund et al. (2017) have concluded that slow pyrolysis is the most promising pretreatment technology from a techno-economic perspective. Technical and economic constraints may still be linked to logistic challenges within the supply chain (biomass availability) or quality aspects of the produced iron when increasing significantly Bio-PCI injection (Wang et al., 2015; Suopajärvi et al., 2017). This needs to be tested in blast furnaces on a case-by-case basis. Increasing the biomass feed could increase the price of biomass, especially if other industries are interested in also using more biomass. Thus, the economic feasibility of using biomass as a reducing agent in blast furnaces may be affected (Wang et al., 2015).
CO2 Capture From Steel Mill Gases
CCS implies the capture of CO2 from flue gases [stacks of combined heat and power (CHP) plants, hot stoves, lime kilns, sinter plants, and coke ovens] or from the blast furnace gas (BFG) prior to its combustion in other steel units or in the CHP plant. Captured CO2 is compressed or liquefied for transport to a designated geologic storage site (often located offshore beneath the seabed). The most extensively studied and most suitable system for retrofitting (Gardarsdottir et al., 2019; Voldsund et al., 2019) is end-of-pipe capture, often achieved through the chemical absorption of CO2 using aqueous amine solutions. Amine absorption is commercially available and has been evaluated as the most mature CO2 capture technology, at a technology readiness level (TRL) of 9 (Bui et al., 2018; IChemE Energy Centre, 2018). Gas separation via amine absorption typically implies energy penalties of ∼3–4 GJ/tCO2-captured for solvent regeneration (heat) and ∼0.3–0.6 GJ/tCO2-captured for compression/liquefaction of CO2 (power). Many studies have evaluated CCS from steel mill off-gases (Kuramochi et al., 2012; Arasto et al., 2013; Ho et al., 2013; IEAGHG, 2013; Tsupari et al., 2013; Cormos, 2016; Biermann et al., 2019; Martinez Castilla et al., 2019). In summary, those studies have reported CO2 avoidance levels of 50%–80% if the CO2 is captured from the largest direct emissions point onsite and depending on the number of flue gas stacks included. Applying amine absorption to the BFG alone could reduce emissions by 19%–39% (Kuramochi et al., 2012; Ho et al., 2013; Biermann et al., 2019). Other technologies undergoing development include the sorption-enhanced Water-Gas Shift technology (Gazzani et al., 2015; ECN, 2019) with a TRL of 3–6 (Gazzani et al., 2015; Axelson et al., 2018), and Top-Gas-Recycling Blast Furnace (Meijer et al., 2009; Birat, 2020), which involves the recirculation of the BFG as a reducing gas. The choice of BFG over flue gases as the source of CO2 for partial capture is advantageous in the techno-economic sense due to the higher CO2 partial pressures (Sundqvist et al., 2018; Biermann et al., 2019) and the absence of oxygen (Dreillard et al., 2017) in the BFG. Near-term efforts will focus on partial CO2 capture from one or a few stacks, to minimize the absolute and specific (per tCO2-captured) costs by avoiding the high integration costs linked to having several stacks and to utilize excess heat as a low-cost heat source (Ali et al., 2018; Biermann et al., 2018, 2019). As of June 2020, globally, one CCUS project involving steel mill off-gases utilizes 0.8 MtCO2 annually for enhanced oil recovery in Abu Dhabi (Global CCS Institute, 2019), and one CCS project (“3D”) is in early development in France (Dreillard et al., 2017; Birat, 2020; CORDIS, 2020) with a potential capacity of ∼1.5 MtCO2 to be stored annually.
Fermentation of Steel Mill Waste Gases to Ethanol
Bioethanol from sugar crops dominates global biofuel production (>60% share) and is used as drop-in fuel at lower blend levels (5%–-22%) (World Bioenergy Association, 2019) in combination with gasoline. To meet the Paris Agreement, the IEA recommends, inter alia, the commercialization of advanced biofuels from, for example, lignocellulosic biomass (IEA, 2019). Ethanol produced from lignocellulosic biomass via enzymatic hydrolysis and fermentation (Robak and Balcerek, 2018) requires expensive pretreatment and leaves the lignin fraction unconverted (Liew et al., 2016). Alternatively, the entirety of the biomass can be gasified followed by either catalytic Fischer–Tropsch (FT) synthesis or fermentation by acetogenic bacteria. Although associated with slower conversion rates and limited substrate solubility, syngas fermentation occurs at ambient conditions, is more flexible in terms of the substrate’s H2:CO ratio, and has a higher conversion rate and product selectivity than FT processes (Liew et al., 2016). After fermentation, the ethanol is separated from water by distillation and dehydration (Pardo-planas et al., 2017), or via extraction (Phillips et al., 2017). The energy intensity of the distillation is in the range of 5–12 MJ/kgEtOH for concentrations of ethanol in the fermenter effluent of 6–2 wt.% (Molitor et al., 2016).
Steel mill gases that contain fossil-derived CO and H2 are attractive for ongoing carbon capture and utilization (CCU) projects to form ammonia, methanol, polymers, and polyaclohols (“Carbon2Chem”; Federal Ministry of Education and Research of Germany, 2016), methanol for transport (“FReSME”; CORDIS, 2016), polyurethane for isolation (“Carbon4Pur”; CORDIS, 2017), and ethanol for transport (“Steelanol”; Steelanol Consortium, 2015). All steel mill gases can be used for syngas fermentation (Handler et al., 2016; Molitor et al., 2016). However, the basic oxygen furnace gas has the highest CO content, followed by the BFG. Life cycle assessments of ethanol fermented from steel mill gas have found a 40%–60% and 56%–70% reduction in greenhouse gas (GHG) emissions compared to conventional gasoline for on-road vehicles in Chinese (Ou et al., 2013) and US (Handler et al., 2016) contexts, respectively. In comparison, converting 100% biogenic feedstocks to ethanol by gasification and subsequent fermentation could lead to reductions in GHG emissions of 92%-98% compared to gasoline for on-road vehicles depending on feedstock (Handler et al., 2016). Syngas fermentation is being commercialized, mainly by LanzaTech. The first large-scale plant producing 46,000 tEtOH/year from steel mill gases was commissioned in 2018 (LanzaTech, 2018). The planned capacity of Steelanol (also LanzaTech) is 63,000 tEtOH/year, to be commissioned in 2022 (Steelanol Consortium, 2015).
OVERVIEW OVER ALLOCATION AND REGULATIONS APPLIED IN EU
Allocation is here defined as the partitioning of input or output flows of a process or a product system between the product system under study and one or more other product systems (ISO, 2006). Allocation should be dictated by the physical and quantitative relationships between inputs/outputs and the co-products, such as mass or energy content of product/intermediate streams, and energy or exergy consumption. Alternatively, the allocation can be based on the economic value of the products. Concerning a conventional, fossil-based, integrated steel mill, allocation methods have been studied to determine the CO2 intensity of the electricity produced from the steel mill off-gases (Messagie et al., 2013), as well as to determine the emissions intensities of the blast furnace products of pig iron and slag (World Steel Association, 2014). A life cycle assessment of the carbon footprint of captured CO2 for CCU purposes found that allocation based on a physical relationship between the amounts of captured CO2 and the main product perform as well as substitution, although such allocation is superior in terms of obtaining product-specific emissions to allocation based on the mass or economic value of CO2 and the main product (Müller et al., 2020).
Table 1 lists the EU regulations and guidelines applicable to the allocation schemes relevant to this work. Concerning fuel production processes, in general, the Renewable Energy Directive (RED II, Directive 2018/2001) (European Parliament and Council of the European Union, 2018a) and the Fuel Quality Directive (FQD, Directive 98/70/EC) (European Parliament and Council of the European Union, 2018b) mandate that the GHG emissions be divided between the fuel or its intermediate product and the coproducts in proportion to their energy contents (determined by the lower heating value, LHV).
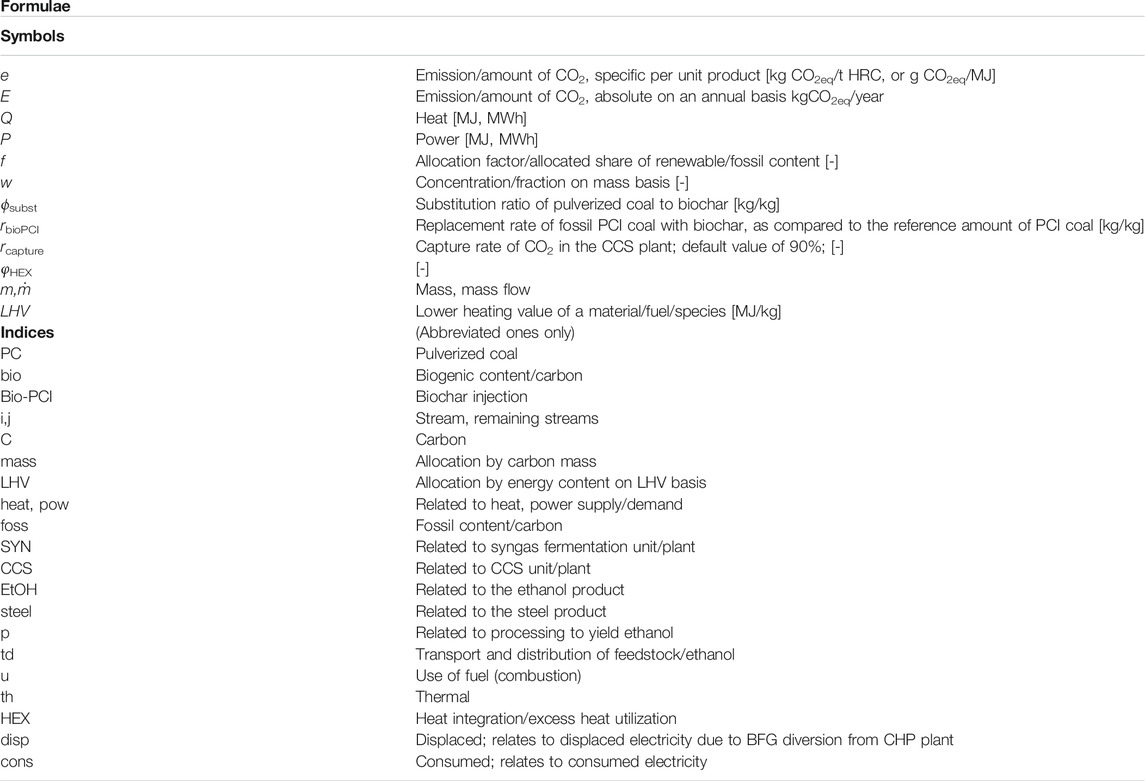
Formulae.
Allocation for co‐processing of biogenic and fossil feedstocks
The voluntary schemes applied in the EU (cf.Table 1) base the allocation of a biogenic feedstock to a certain process and to the corresponding biogenic products on one of the following:
(1) The energy content of cogenerated products;
(2) A (carbon) mass balance; and
(3) A C14-analysis, that is, an actual physical measurement downstream of the co‐processing unit.
Thus, the level of biogenic output and the allocation to the cogenerated products may vary depending on the adopted approach. Flexible allocations (e.g., economically motivated) outside these approaches have been described as incompatible with a previous draft of RED II (which was not implemented) (Schimmel et al., 2018). The guidelines issued by the certification company ISCC (ISCC, 2017) refer implicitly to such flexible allocation: the determined sustainable bio-output can be attributed to the respective products. If 12C- or 14C-analyses [a] are conducted for a specific product, only the determined bio-content of this product can be sold as such. Flexible allocation is beneficial to fuel-/chemical-producing companies for economic reasons because products that generate high levels of revenue on the market can be favored (Schimmel et al., 2018). As a compromise, Schimmel and colleagues have suggested allocating different shares of biogenic carbon within products (“within-product” allocation). This means, for example, the sale of an amount y of a fuel with 0% biogenic content and the sale of an amount x of the same fuel with 100% biogenic content, with x and y being limited by the total share of biogenic carbon that is allocated to each fuel produced in the same unit (Schimmel et al., 2018).
Free allowances for electricity and heat produced from steel mill waste gases
In the EU Emissions Trading System (EU ETS), sectors other than power generation are gradually transitioning to 100% auctioning, although they continue to receive free allowances (EUAs) to prevent carbon leakage. Relevant to this work is the free allocation of EUAs for the production and consumption of waste gases, as laid out in the guidance document (European Commission, 2019b). In this system, a consumer of waste gas (e.g., a CHP plant operated on blast furnace off-gases) that produces electricity does not receive any free EUAs and must therefore pay for the CO2 emissions from electricity production. Importantly, not all of the carbon in the waste gas that leaves the electricity generation unit is allocated to electricity. Instead, the carbon is split so that the inert CO2 in the waste gas, which merely passes through the electricity generation unit, is an emission that is allocated to the producer of the waste gas (e.g., steel mill units and BF/BOF). Only those species (hydrocarbons and CO) that have a heating value for the electricity generation unit and are converted to CO2 are allocated to electricity as an emission. In contrast, free allowances are received for the share of the waste gases that is consumed to produce heat and that is sold to produce a nonbenchmarked product or sold to a consumer outside of the EU ETS (e.g., district heating) (European Commission, 2019a).
Production of Biofuels
In the EU, the GHG emissions of biofuels for transport are regulated by the RED II and the FQD. Biofuels that do not meet the sustainability and GHG saving criteria are counted as fossil fuels. Biofuels from waste and residues other than those from, inter alia, agricultural and forestry sources must only meet the GHG-saving criteria. The sustainability criteria (art. 29 §2-7) consider, inter alia, restrictions on the usage of land areas with high biodiversity or high-carbon stock (wetlands and peatland) for agricultural biomass, and consider sustainability and land use, land-use change, and forestry (LULUCF) criteria for forestry biomass. For transport biofuels, a GHG emissions-saving criterion is defined as 65% relative to a fossil comparator emitting 94 gCO2eq/MJ. Biomass is regarded as CO2-neutral when combusted, that is, the CO2 released originates from the atmosphere and has accumulated during the growth phase of the biomass, that is, assuming the net growth in carbon stock is equal to, or larger than, the outtake over a sufficiently long time, such as the case in Sweden. The biogenic carbon balance should include the upstream/life cycle GHG emissions, such as those encountered during cultivation, extraction, and processing, and during the transport and distribution of feedstock and products. Potential savings from CCS or CCU can be claimed according to the accounting methodology (Annex V, RED II), as described in Supplementary Material Section 1. Of importance is the role of electricity in producing alternative fuels. Concerning the production of renewable fuels of nonbiologic origin, RED II foresees that the electricity used is of renewable origin (for details, see paragraph 90 and article 27.3), whereas the Joint Research Centre suggests to use the average GHG intensity of electricity supplied in a member state or in the EU (Joint Research Centre, 2016). Similarly, for transport fuels, biofuels, and bioliquids, the GHG intensity of imported electricity can represent either a defined region or a source not connected to the grid (RED II, Annex V, C.1).
Method
This theoretical work builds upon well-documented mass and energy balances of a model of a typical European integrated steel mill validated against real process data (IEAGHG). Changes to these concerning energy demand and carbon (mass) flows with the integration of mitigation technologies are quantified by simple spreadsheet calculations based on published information about these technologies (see Investigated Systems and Cases of Applied CO2-Mitigation Technologies). Examined technologies are Bio-PCI using biochar from the slow pyrolysis of wood waste type B collected from construction and demolition sites, ethanol synthesis from BFG via syngas fermentation of mainly CO and H2, and CCS from BFG using amine absorption. Note that commercial stakeholders, including technology providers, might claim process performances exceeding those assumed here for the syngas fermentation and for amine-based CO2 capture. The changes in carbon mass flows and energy balances are calculated for four configurations of the integrated steel mill:
C1: Reference mill with excess electricity production;
C2: Bio-PCI and electricity production;
C3: Bio-PCI and ethanol production; and
C4: Bio-PCI, ethanol production, and CCS.
These four technical configurations are examined concerning the emission intensity of their products depending on allocation schemes of avoided emissions due to shares of biogenic carbon and due to CCS (see Investigated Systems and Cases of Applied CO2-Mitigation Technologies, Allocation and Attribution Schemes in Co-Processing, andCO2Emission Intensities of Low-Carbon Products and Avoided CO2Emissions). A sensitivity analysis on the resulting emission intensities is conducted with respect to indirect emissions from imported grid electricity and the extent of possible heat integration between the processes. In addition, the potential reduction in emissions of configuration C4 (Bio-PCI, ethanol, and CCS) is assessed for varying the extent of biochar injection and CO2 capture from the BFG to represent both a near-term implementation and the potential future development.
Investigated Systems and Cases of Applied CO2-Mitigation Technologies
Figure 1 presents an overview of the studied integrated steel mill and associated product systems, comprising the steel product system, the electricity grid system, and the transport fuel system. The allocation of avoided emissions due to shares of renewable carbon in the process streams and due to CCS is studied in the subsystem downstream of the blast furnace (indicated by the blue line in Figure 1), here termed the carbon allocation system (CAS). Process streams receive biogenic and/or fossil carbon via a selected allocation scheme (presented in Allocation and attribution schemes in co-processing), in line with the voluntary schemes for co‐processing applied in the EU (cf.Table 1 and Allocation for Co-Processing of Biogenic and Fossil Feedstocks), and move it through process units until the carbon is either emitted or captured as CO2 or ends up physically in a product (steel and ethanol). All the carbon in the streams, captured CO2, and emissions leaving the CAS are allocated to the formed products (ethanol, steel, and electricity) such that all the direct CO2 emissions of the steel mill are considered. In principle, the carbon flowing into each process unit that is emitted as CO2, captured for storage, or ends up in the product is allocated to the product that is processed within that unit. While this is trivial for most units, it is nontrivial for CO2 capture from intermediate streams associated with several products (which require the allocation of avoided emissions, see Allocation and attribution schemes in co-processing) or for units that consume steel mill waste gases, for which we adopt a methodology in line with the EU ETS emissions split (see Allocation and Attribution Schemes in Co-Processing). The direct emissions of the CAS are augmented by the indirect emissions that arise from the three product systems with the implementation of mitigation technologies, as compared to a reference mill. For this, an expanded system is defined (indicated by the red line in Figure 1), here termed the total emissions system (TES). This is instead of adopting the terminology of scope 1, 2, and 3 emissions, which is nontrivial for a circular, non–end product such as steel. Indirect emissions consider changes to the electricity grid’s emissions that occur due to the import or export of electricity. The transport fuel system considers the transport and distribution of wood waste and ethanol, as well as the (fossil) emissions arising from combustion in a vehicle. Thus, TES quantifies the overall reduction of CO2 emissions, as well as the CO2 emission (equivalents) intensity for each product (see Allocation and Attribution Schemes in Co-Processing). Importantly, no reduction in the emission of carbon molecules to the atmosphere is counted double, which means that it can only be ascribed to one of the three product systems. The calculation of the emission intensity of the transport fuel (ethanol) and the criteria for biofuels are based on the RED II accounting methodology and emissions saving targets for biofuels used for transport (cf.Production of Biofuels and Supplementary Material Section 1).

FIGURE 1. Overview of the systems considered in the present study. An integrated steel mill with major process units (white boxes), its carbon-rich streams (black and grey), and its products, which are supplied to three product systems (thick arrows). The considered mitigation technologies of CCS, biochar injection (Bio-PCI) and syngas fermentation (SYNFERM) are highlighted in color. The CAS and TES are used for the study of carbon allocation schemes and emissions accounting, respectively. Abbreviations: BFG, blast furnace gas; BOF(G), basic oxygen furnace (gas); CAS, carbon allocation system; CHP, combined heat and power plant; COG, coke oven gas; TES, total emissions system.
Reference Integrated Steel Mill
To represent a typical European integrated steel mill, a reference mill with a production capacity of 4 Mt hot-rolled coil (HRC) per year and direct fossil emissions of 8,377 kt CO2 per year (2,094 kg CO2/t HRC) is studied. The mass flows are adopted from the IEAGHG CCS study (IEAGHG, 2013). Figure 2 shows the carbon balance over the studied CAS subsystem (Figure 1) in the reference steel mill, with the underlying material flows listed in Supplementary Table S1. Approximately 30% of the carbon input into the CAS is PCI-coal, and around 87% of the carbon leaves the CAS in the form of CO2 emissions, whereas only ∼0.2% remains in the solid phase in the steel product. The remaining carbon is sent to other steel mill units (sinter plant and coking plant). The energy balance of the steel mill shown in Figure 3 is modified from (IEAGHG, 2013) to model an excess electricity generation of 10%, as compared to the required electricity for steel mill operations. In addition, export of excess heat to industrial or municipal district heating is assumed in order to reflect more accurately a typical steel mill, since the IEAGHG study assumed a steel mill with no energy export. In the reference mill, the CHP plant receives its thermal inputs from BFG (63%), BOFG (18%), COG (2%), and NG (18%) and operates with electric and total efficiencies of 32.2% and 80.2%, respectively.
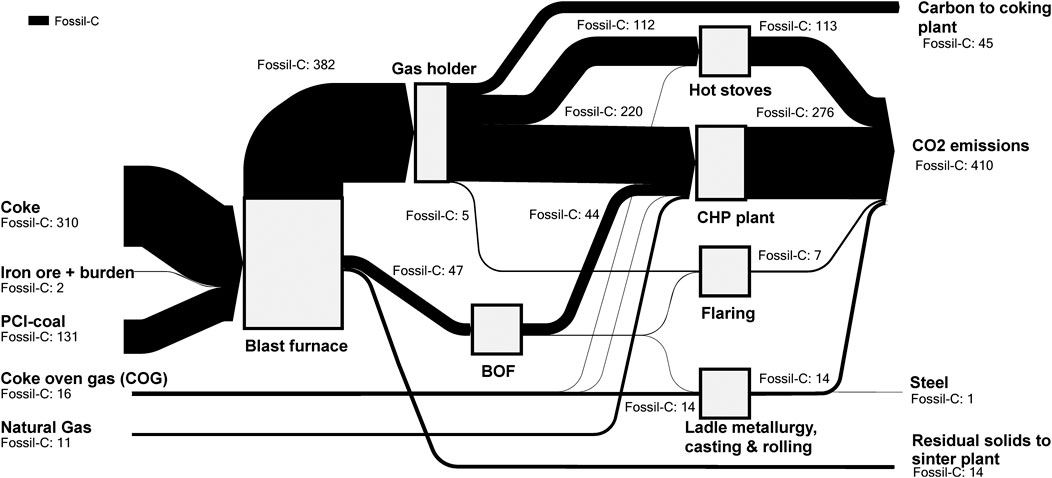
FIGURE 2. Carbon balance of the reference integrated steel mill excluding units upstream of the blast furnace (coke ovens, lime kiln, sinter plant) according to the blue system boundary in Figure 1. The mass balances are derived from previous paper (IEAGHG, 2013). The values shown are presented in kilograms of carbon per ton of hot-rolled coil (HRC).
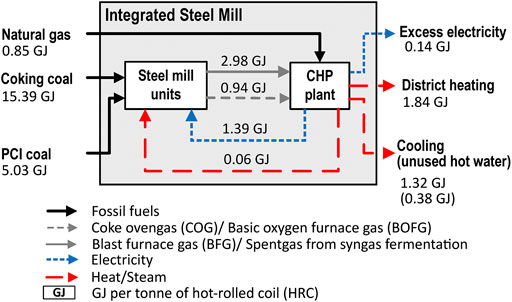
FIGURE 3. Energy flows for the reference steel mill with a production of 4 Mt HRC per year; adapted from (IEAGHG, 2013; Lulekraft, 2018). The values shown are per ton of HRC.
Pulverized Biochar Injection (Bio-PCI)
Pretreated biomass enters the blast furnace in the form of biochar (the upgrading process is outside the scope of the present work), as indicated in Figure 1. The biochar resembles woody biomass that is upgraded via slow pyrolysis with a carbon content of ∼80 wt.%wet. The slow pyrolysis process is chosen due to its techno-economic performance (Wiklund et al., 2017) and the possibility to apply high replacement rates (up to 100%) of the fossil-based PCI. According to Wang et al. (2015), a greater mass of biomass must be injected in relation to the reference PCI-coal to achieve the same level of blast furnace operation. The amount of additional biochar is determined by the substitution ratio ϕsubst. [see Eq. 1], which is adopted from the publication of Wang et al. (2015) and applied to the reductants specified in this work (see Supplementary Table S2). The biochar used here, ϕsubst. is 0.9067. The share rbio‐PCI of pulverized coal that is replaced by biochar [see Eq. 2] is set to 10% to resemble a replacement rate that is deemed to be practically feasible for an initial near-term implementation. Other items that are injected, such as coke and oxygen, as well as the gas distribution between the steel units are kept constant when introducing biochar. Thus, the total amount of BFG generated increases slightly. Changes in the composition of the BFG are neglected, since they are assumed to be negligible.
Syngas Fermentation
A simplified syngas fermentation process is assumed (Figure 4). The size of the plant (production rate of ethanol) is chosen to match the biomass input into the blast furnace so that the input of biogenic carbon matches the output of carbon in ethanol (independent of the biomass share). The feed gas is assumed to be BFG. This choice allows one to study the effects of a combined implementation of CCS and ethanol production from the same intermediate stream, the BFG. The key assumptions made for the syngas fermentation plant are listed in Supplementary Table S3. The electricity consumption is 3.7 MJ/kgEtOH (Piccolo and Bezzo, 2009). The BFG conversion rate is determined according to the reactions defined by others (Piccolo and Bezzo, 2009), and assumed conversion rates for CO and H2 of 80% and 40%, respectively, are similar to the values reported previously (Pardo-planas et al., 2017). The fractional conversions and the reactions implemented are listed in Supplementary Table S4. The steam demand for the distillation is determined as 10.3 MJ/kgEtOH, which is similar to values (9.8–12.0 MJ/kgEtOH) reported previously (Piccolo and Bezzo, 2009; Molitor et al., 2016; Pardo-planas et al., 2017). The spent gas from the fermentation is sent back to the CHP plant.
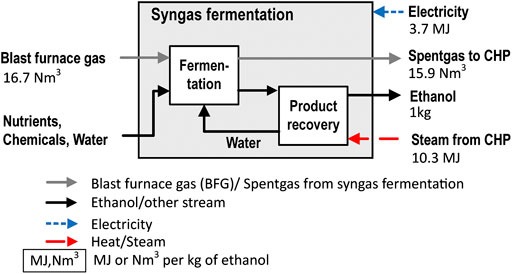
FIGURE 4. Mass and energy balance of the syngas fermentation process using the BFG as the feed. The input and output gas flows are valid for a steel mill configuration without CO2 capture from the BFG upstream of the syngas fermentation.
Amine Absorption of CO2
The CO2 capture process uses an amine solvent, that is, aqueous 30 wt.% monoethanolamine (MEA) to reflect the most commonly applied capture technology. The chosen feed gas is the BFG because its techno-economic performance is superior to those of other CO2 sources at a steel mill viable for near-term implementation (Biermann et al., 2019). The capture unit is placed after the BFG cleaning unit and before the BFG holder. Thereafter, the gas is distributed to the hot stoves, coking plant, and CHP plant, or it is flared in case of excessive amounts. The heat requirement, based on a previous work (Sundqvist et al., 2018), together with the power consumption, including compression at 7 bar for ship transportation (Deng et al., 2019), and the BFG composition are listed for various capture rates in Supplementary Table S5. As a default value, a capture rate of 90% is assumed, which is within the range of capture rates associated with the lowest investment cost per captured ton of CO2 (Rao and Rubin, 2006; Biermann et al., 2018). Extension of the capture rate to 99% is carried out to explore the maximal mitigation that can be achieved with CCS and Bio-PCI.
Allocation and Attribution Schemes in Co‐processing
We apply the common definition of allocation as described in Overview Over Allocation and Regulations Applied in EU. Thus, the biogenic content is allocated to any formed (intermediate) coproduct in the process or intermediate process into which the biomass was introduced with respect to consistent physical principles (e.g., the carbon (mass) or energy content of the product). In addition, we define “attribution” as a free-choice allocation of biogenic content to any (intermediate) coproduct formed in the process or intermediate process into which the biomass was introduced. In this context, CO2 is explicitly not automatically regarded as a loss/waste of biogenic carbon, but instead as a potential product.
For the steel mill, the differences in the allocation schemes are of great importance to the blast furnace, as illustrated for these four selected schemes (Figure 5):
• The allocation by mass of carbon (top-left panel in Figure 5) gives each effluent stream of the blast furnace the same share of biogenic carbon fbio,BF,mass corresponding to the mass fraction of total carbon wC,i,total in that stream. In all of the carbon-containing effluent streams, each carbon-containing species (including CO2) is assigned the same share of biogenic carbon fbio,BF,mass, as described by Eq. 3. This share is determined by the weighted ratio of the biogenic and fossil inputs into the process according to Eq. 4. For the calculation of fbio,BF,mass, the pretreated biochar (Bio-PCI) is considered as a biogenic input, whereas the remaining PCI-coal and the coke are fossil inputs.
• For the allocation by energy content (top-right panel in Figure 5), the share of biogenic carbon/content in the inputs to the blast furnace is based on an energetic weighting factor fbio,BF,LHV according to Eq. 5. The biogenic output of the blast furnace, which is the total output amount (mass) multiplied by fbio,BF,LHV is allocated to the effluent streams based on the ratio of their energy content, that is, the mass flow multiplied by the LHV. The share of biogenic content wbio,i,LHV in each effluent stream is calculated accordingly, as in Eq. 6. This allocation scheme based on energy content implies a 100% allocation of biogenic content to CO (88%) and H2 (12%) in the BFG, since pig iron, the blast furnace slag, and the CO2 in the BFG have an LHV value of zero. Note that the fossil carbon is allocated in a corresponding manner, that is, it does not necessarily follow the actual mass flows of carbon, as compared to the allocation by mass. An example of this is the dissolved carbon in pig iron.
• The third allocation scheme is termed physical partitioning (bottom-left panel in Figure 5). It allocates (biogenic) carbon to the energy consumed for the formation of the coproducts, that is, the effluent streams of the blast furnace. Adapting exemplary values from Supplementary Table S6 (World Steel Association, 2014) implies that 61.7% of the biogenic carbon is allocated to the hot metal (HM) (10,032 MJ/t HM); 33.91% is allocated to the BFG, which contains the remaining unconsumed energy (5,472 MJ/t HM); and 3.92% is allocated to the blast furnace slag (632 MJ/t HM).
• The fourth scheme involves attribution (bottom-right panel in Figure 5), which maximizes the allocation of biogenic carbon to CO in the BFG. Thus, no biogenic carbon is attributed to the slag, pig iron, or CO2 in the BFG.
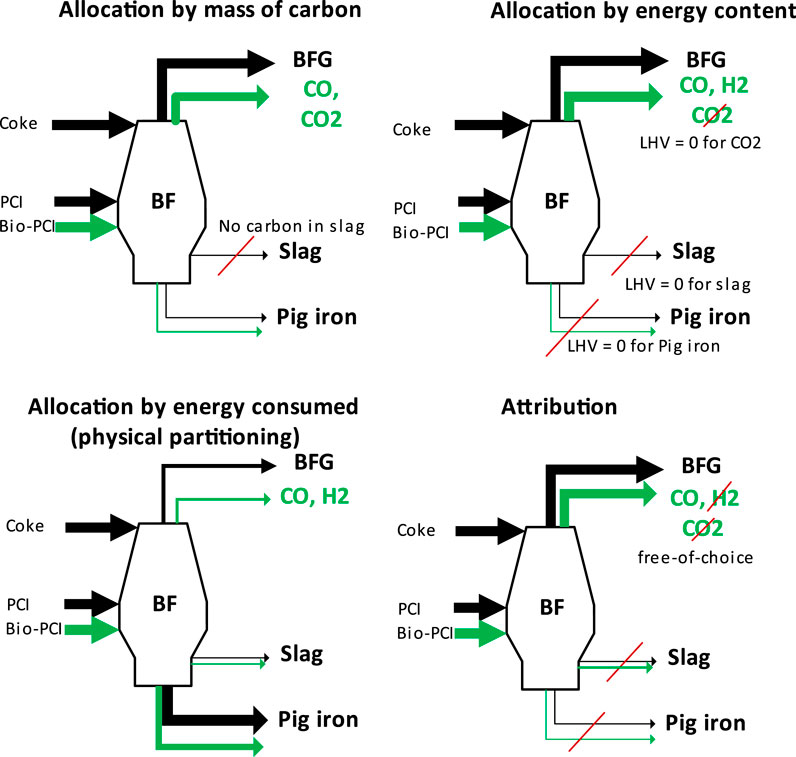
FIGURE 5. Allocation of biogenic carbon/content to blast furnace effluent streams. The biogenic share of each effluent stream varies for each carbon allocation scheme. Carbon allocation by mass (top-left panel), by energy content (top-right panel), and by physical partitioning (bottom-left panel) versus free-choice carbon attribution (bottom-right panel). The attribution example is arbitrary and may resemble the choice to favor energy-related products from BFG in terms of its associated production emissions. The black arrows indicate fossil carbon flows, and the green arrows indicate biogenic carbon flows.
Here, we investigate in greater detail the two schemes that represent the two extremes of the range of the above allocation schemes: 1) carbon allocation based on mass via a carbon mass balance and 2) an attribution scheme that favors energy-related products from BFG according to Figure 5. The carbon allocation by mass distributes biogenic carbon evenly according to the actual carbon flows in the steel mill. In this way, each stream that diverges to other purposes on the way from Bio-PCI to the ethanol product can be viewed as a “loss” of biogenic carbon to the atmosphere, thereby reducing the emission intensity of the steel, rather than raising the biogenic content of the ethanol. These diverging carbon flows are illustrated qualitatively in Figure 6. In contrast, the attribution scheme allows the following choices as to the pathway from Bio-PCI to the ethanol and thus can maximize the biogenic content of the BFG for ethanol or electricity production:
• In the blast furnace, all biogenic carbon is attributed to CO in the BFG. To allow for comparison with the allocation by mass, the biogenic input to the blast furnace is determined by fbio,BF,mass according to Eq. 3.
• In the gasholder, all the Bio-CO is attributed to the BFG going to the syngas fermentation plant, such that none of it is attributed to the CHP plant or other steel units.
• In the syngas fermentation plant, all the Bio-CO is attributed to the carbon in the produced ethanol. The CO and H2 that are not converted and remain in the spent gas (together with CO2) are therefore fossil-derived. Note that due to conversion losses, any other allocation scheme would have allocated some biogenic CO/CO2 to the spent gas.
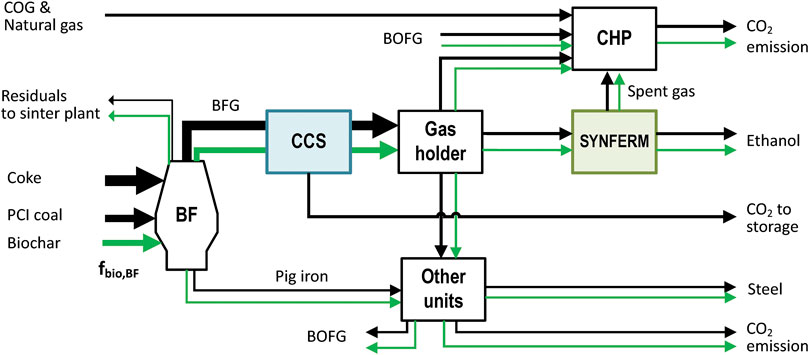
FIGURE 6. Carbon flow pathways downstream of the blast furnace (CAS) when injecting biochar. The green arrows indicate the possible allocation/attribution of biogenic carbon to the respective process stream. The black arrows represent fossil carbon. Other units comprise steel mill units in the CAS, hot stoves, basic oxygen furnaces, gas flaring, ladle, and rolling and casting.
In addition to the biogenic content, avoided CO2 emissions due to CO2 capture from the BFG are allocated, since the BFG is an effluent of the steel production process and a feed to the syngas fermentation, and is, thus, associated with the production of steel and ethanol (see also Supplementary Material Section 1). We propose that the allocation of avoided CO2 ECCS,avoided to ethanol ECCS,ethanol and steel ECCS,steel be determined by the same set of allocation schemes as presented for the allocation of (biogenic) carbon. In this way, the selected allocation scheme governs the share of the CO2-lean stream (effluent gas of the CCS plant) that each product or product system receives downstream of the CCS plant [see Eq. 7]. Thus, the CO2 avoided from CCS ECCS,avoided is allocated to the products according to the ratio of the received CO2-lean stream in terms of carbon mass content, energy content, or consumed energy or according to the attribution. The CO2 avoided through CCS operation is calculated by Eq. 8 and considers the emissions for powering the CCS plant (see Allocation and Attribution Schemes in Co-Processing), and for the transport and storage of the CO2, which are deemed to be low and are not considered in this work. Furthermore, we assume that fossil CO2 is prioritized for capture on a stream basis, which means that no biogenic carbon is allocated to the captured CO2 unless all of the fossil CO2 from a stream is captured. The biogenic share of CO2 in a stream fed to a CCS plant needs to be higher than the rate of captured rcapture and stored CO2, according to Eq. 9. Since the aspect of negative emissions is not the focus of the present work, only fossil CO2 is captured in the default settings (10% replacement of PCI with biomass, 90% CO2 capture from BFG), unless stated otherwise.
CO2 Emission Intensities of Low-Carbon Products and Avoided CO2 Emissions
The products considered in this work are steel, (bio)ethanol, and electricity. Other commodities typically produced in steel mills, such as benzoles, sulfur, argon, and crude tar, are not considered as they are not directly affected by either Bio-PCI or CCS operation. The blast furnace and BOF slags are considered waste products and, thus, have no CO2 emission intensity. The following paragraphs describe the allocations of carbon and direct and indirect CO2 emissions to each product—steel, electricity, and ethanol.
The direct emissions of the steel products are calculated according to Eq. 10. The introduction of biogenic carbon into the blast furnace leads to a reduction in the level of fossil emissions compared to the reference steel plant (2,094 kgCO2/t HRC), corresponding to the levels of (biogenic and fossil) carbon converted to ethanol and (biogenic and fossil) carbon allocated to excess electricity. Furthermore, the biogenic carbon, which ends up in the steel product or is emitted as CO2 via the steel mill units (i.e., biogenic carbon not allocated to the biofuel or electricity), is subtracted from the direct carbon emissions of the steel mill. The avoided CO2 due to CCS that is allocated to the steel product [cf.Eq. 7] also reduces the direct emissions. New indirect emissions from imported electricity and other upstream/downstream emissions related to changes in fossil inputs are allocated to the mitigation technologies and not to the steel production (see last paragraph in this section). Changes to upstream (e.g., less PCI-coal) or downstream (in the steel product system) emissions due to the implementation of mitigation technologies are deemed to be negligible and are not considered.
with the following definitions:
esteel Direct emissions steel; equal to the steel product emissions in this work; in kgCO2/t HRC.
eREF Reference mill direct emissions; in kgCO2/t HRC.
(ffoss,EtOH+fbio,EtOH) · mC,EtOH Biogenic and fossil carbon allocated to ethanol; in kg of C.
(ffoss,pow+fbio,pow) · mC,pow,export Biogenic and fossil carbon allocated to exported electricity; in kg of C.
fbio · mC,steelunits Biogenic carbon allocated to steel mill units; in kg of C.
eCCS,steel Avoided CO2 emissions from CCS operation allocated to the steel product; in kgCO2/t HRC.
We base the allocation of emissions to exported electricity and heat produced from waste gases on the EU ETS guidance document (European Commission, 2019b) (see Free Allowances for Electricity and Heat Produced from Steel Mill WasteGases). The CO and H2 in the BFG are oxidized in the CHP plant, and the resulting CO2 emissions are allocated to the electricity. The CO2 in the BFG is allocated to the waste gas producer, the blast furnace, and, thus, the steel product. These considerations yield an emission intensity of 546 gCO2/kWh electricity for the reference steel mill (1,705 GWh/year). Since most of the electricity is consumed internally in the steel mill, only the exported excess electricity (157 GWh) leaving the steel mill carries this CO2 burden. Respective EUAs have to be purchased from the market. Note that district heating supply is assumed to take place to non-ETS sectors, such as space heating for buildings, which means that free EUAs are received. Since they are not paid for, these emissions are not assigned an economic value. Therefore, we assume that they remain with the steel mill (steel product) and are not allocated to the heat supplied to a district heating system.
Regarding the ethanol emission intensity, we adopt the accounting methodology for transport biofuels from Annex V of RED II, though we simplify Eqs. 1–11 by eliminating those terms that are not applicable to waste biomass (i.e., eec, el, and esca), since life cycle GHG emissions are not considered for waste up to the point of collection (Joint Research Centre, 2016; European Parliament and Council of the European Union, 2018a). The term eCCR is omitted because no CO2 is captured for the synthesis of other products or exported for utilization. The remaining terms in Eq. 11 refer to the processing emissions ep,SYN, transport and distribution emissions etd, avoided emissions due to CCS allocated to ethanol eCCS,EtOH, and emissions from the use of the fossil share of the ethanol ffoss,EtOH · eu. Note that ep,SYN represents the processing of emissions from 1) fossil fuel combustion to cover the part of the heat demand of the syngas fermentation plant that exceeds the usable excess heat from the steel mill, 2) imported electricity to cover the electricity consumed by the syngas fermentation plant PSYN,cons, and 3) imported electricity due to the diversion of BFG from the CHP to the syngas fermentation plant PSYN,disp—the so-called counterfactual or displaced electricity demand. Diverting a share of the BFG from the power plant to produce a fuel instead will cause a shortfall in the electricity required for the steel mill, and this shortfall is assumed to be alleviated by imports from the grid (Joint Research Centre, 2016). The respective grid emissions are, therefore, allocated to the ethanol product. We assume that the loss of exported excess electricity in the reference steel mill is not included in this, since it is not the energy required to run the steel mill. Note that the spent gas leaving the syngas fermentation plant is directed back to the CHP plant; any CO in that stream is used for the electricity and heating purposes of both mitigation technologies, thereby reducing the amount of imported energy. CO2 in the spent gas is assumed to originate from the blast furnace and is, therefore, allocated to the waste gas producer (steel mill). This simplified allocation is congruent to the EU ETS method for electricity and heat generation from waste gases.
with the following definitions:
eEtOH Emission intensity of the produced (bio)ethanol
ep,SYN Processing emissions from fossil fuel combustion for heating (if no excess heat is available), imported electricity for syngas fermentation operation, and displaced electricity (BFG diversion from CHP)
etd Transport and distribution emissions for wood waste and the distribution of ethanol; 2.3 gCO2 eq/MJ based on RED default values.
eCCS,EtOH Avoided CO2 emissions from CCS operation allocated to the ethanol product.
ffoss,EtOH Allocated fossil share in the produced ethanol
eu Emissions from use of fuel; 71.54 gCO2/MJ; 0 gCO2/MJ for biogenic share.
The mitigation technologies require supplies of heat and electricity. We assume that heat is generated onsite in the existing CHP plant or in a CHP plant with similar performance profile, whereas electricity is bought from the grid when cogenerated electricity does not suffice to cover the demand. Modifying the CHP plant operation mode can maximize heat/steam production at a temperature of 130°C with electric and total efficiencies of 27.3% and 95.8%, respectively. The delivery of heat to district heating is maintained in all of the C1–C4 configurations. In case the switch in the CHP mode is insufficient, extra natural gas (NG) combustion is assumed and the respective direct emissions are allocated to the mitigation technologies corresponding to their heat demands, according to Eq. 12. In case power is imported, the emissions corresponding to the grid emission intensity are allocated to the mitigation technologies based on their ratios of power demand, according to Eq. 13. In case both CCS and syngas fermentation are implemented, the factors from Eqs. 12, 13 are used to calculate the emissions ECCS,heat+pow and ESYN,heat+pow in Eqs. 14, 15 for powering the CCS and syngas fermentation plant, respectively. To assess the sensitivity of heat integration, the fraction of the required heat that can be made available from excess heat via heat integration is defined in Eq. 16 and varied between 0 and 1. The assumption of extra NG import is maintained when φHEX is <1.
where the following parameters are applied:
cfoss Emission intensity of NG combustion. A value of 65.9 gCO2eq/MJ, including production and distribution, is used; EU mix (Guintoli et al., 2017).
cpow,grid Emission intensity of electricity imported from the grid. The default value of 295.6 gCO2/kWh corresponds to the Year 2016 EU-28 average (European Environment Agency, 2018) Sensitivity analysis: 0–790 gCO2/kWh, representing “extreme” cases of renewable electricity or coal condensation.
fheat,CCS/SYN Allocation factor for emissions related to the heat demand of the mitigation technologies.
fpow,CCS/SYN Allocation factor for emissions related to the power demand of the mitigation technologies.
QCCS/SYN Heat demand of a mitigation technology
PCCS Power demand of the CCS plant
PSYN,cons + PSYN,disp Power demand of the syngas fermentation plant due to consumption and displaced electricity demand (BFG diversion)
Qfoss,th Thermal fuel input to the CHP plant from extra NG
Pimport Imported power (total demand for steel, syngas fermentation, and CCS minus cogenerated electricity).
Qexcess heat Heat demand of the mitigation technologies (combined) that can be covered through heat integration.
Results
The first two Results sections present the carbon flows and product emissions intensities achievable with near-term mitigation technologies, that is, the replacement of 10% of the PCI with pyrolyzed biochar and corresponding ethanol production of 111.7 ktEtOH/year (27.9 kgEtOH/t HRC) or electricity generation of 157 GWh/year (39.3 kWh/t HRC) and 90% CO2 capture from the BFG. The third section presents the results for long-term mitigation.
Effects of Carbon Allocation on the Flow Pathways of Biogenic Carbon
Figure 7 shows the flow of biogenic carbon for allocation by mass and attribution for a steel mill with ethanol production (C3) and for a steel mill with ethanol production and CCS (C4). Since the pulverized coal makes up around one-third of the fossil input to the blast furnace, the share of biogenic carbon is relatively small (3.2% of the total inlet) when replacing 10% of the PCI with biochar.
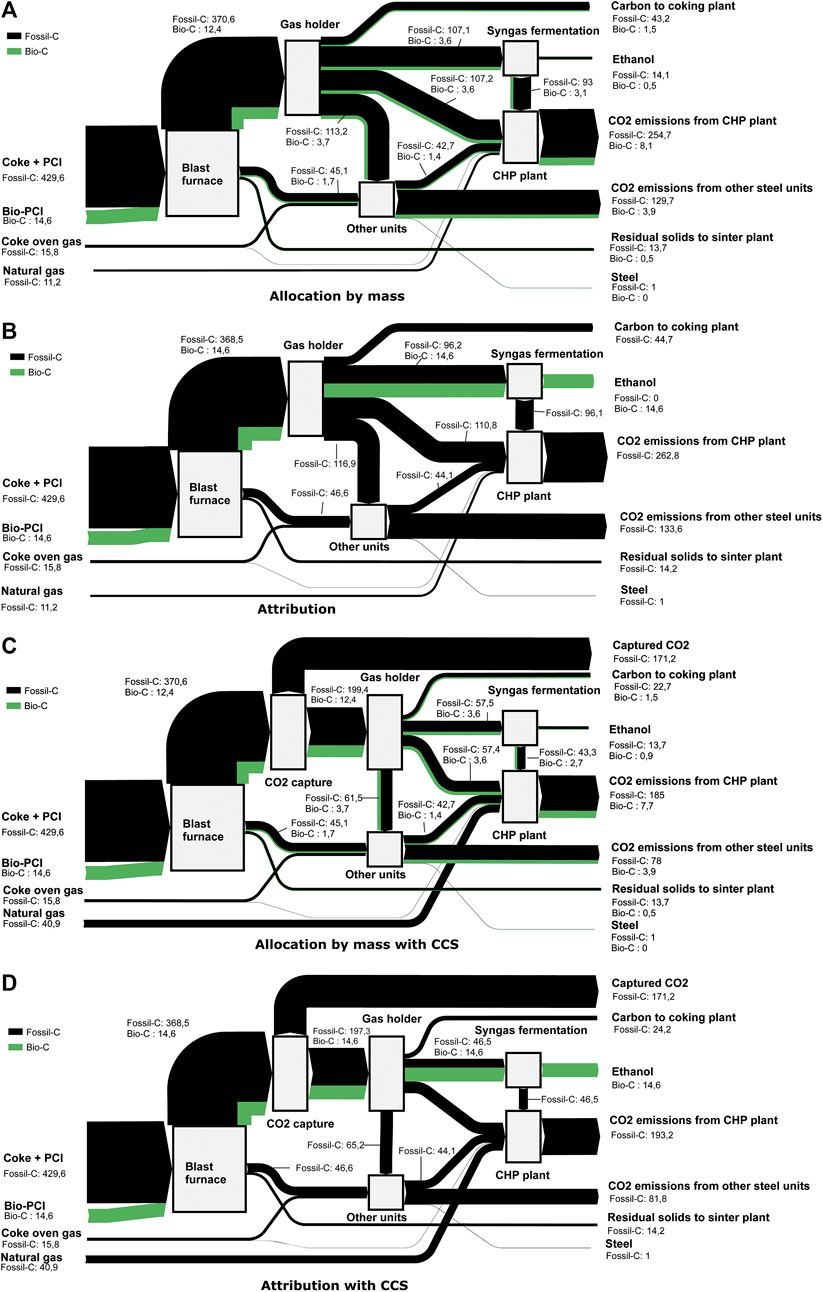
FIGURE 7. Flow of biogenic carbon (green) throughout a mill with (A–D) ethanol production (C3) and (C, D) CCS (C4). The allocation between streams is given by (A, C) allocation by mass and (B, D) attribution. The green arrows are enhanced for visualization purposes (5:1) relative to the black arrows (fossil carbon). The values given are kg of carbon per ton HRC.
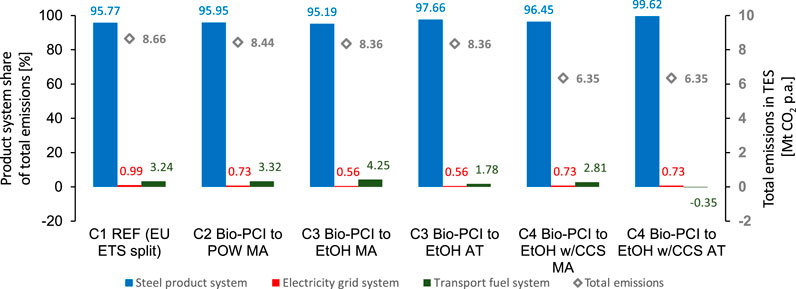
FIGURE 8. Total emissions in TES and their distribution into the three product systems for the studied steel mill configurations C1–C4 depending on allocation by mass (MA) or attribution (AT). The grid intensity is 295.6 gCO2/kWh (EU average). EtOH, ethanol production via fermentation of blast furnace gas; POW, electricity export; REF, reference mill with electricity export.
Without CCS, allocation by mass gives the same biogenic share in the ethanol as in the blast furnace input. The remaining share of biogenic carbon is either emitted as CO2 (96.5%) in the steel mill units or contained in the final steel product (0.2%). For the attribution scheme, the total amount of injected biogenic carbon (14.6 kgC/t HRC) is attributed to the ethanol product—the unconverted feed to the syngas fermentation is counted as fossil-derived and emitted through the CHP plant.
With CCS, the biogenic share of the CO2-lean BFG downstream of the capture unit is increased to 5.9% and 6.9% for mass-based allocation and attribution, respectively. This is because only fossil-derived CO2 is assumed to be captured. The enhanced biogenic share of the CO2-lean BFG leads to an increased share of biogenic carbon in the produced ethanol for the mass allocation scheme with CCS. For the attribution, the share of biogenic carbon attributed to the ethanol product is unaffected by CCS.
Emissions Intensities of the Cogenerated Products and Total Emissions Reductions
The overall emissions in TES (cf.Figure 1) are illustrated (diamond symbols) in Figure 8, together with the share of these emissions that each product system receives. The injection of biochar reduces the overall emissions by 2.5 and 3.5% in C2 and C3, respectively, when producing either electricity or ethanol. The application of CCS (C4) reduces emissions by 26.6%. The distribution of emissions varies as a function of the steel mill configuration and the carbon allocation scheme, although the steel product emissions clearly dominate due to the large differences in product volume. Note that the carbon allocation scheme does not affect the total emissions. The following three paragraphs consider each product system in detail.
The CO2 emission intensities of the steel product when applying mitigation technologies [cf.Eq. 10] are shown in Figure 9. The emission intensity of steel produced in the reference mill (2,073 kgCO2/t HRC) is reduced in all configurations, C2–C4, when biochar is introduced. Allocation by mass provides a large share of biogenic carbon to the steel product, ca. 50 kgCO2/t HRC, which is more than the emission reduction achieved by cogenerating electricity in the reference case (C1). Attribution allocates all the biogenic carbon to ethanol and, thus, renders higher carbon emissions to the steel than allocation by mass. The cogeneration of ethanol (fossil + biogenic) has a similar effect on the steel-related emissions as the introduction of biochar (see C3 configuration with free attribution). The cogeneration of electricity (C2, mass allocation) is less-beneficial than cogeneration of ethanol with respect to the emissions from the steel product. As expected, CCS (C4) has the strongest impact on the emission intensity of steel, reducing it by 24%–26%. Note that allocation of the CO2 emissions avoided (due to CCS) follows the allocation by mass principle also for the C4 configuration with free attribution. Thus, 93% of the avoided CO2 emissions from CCS are allocated to steel.
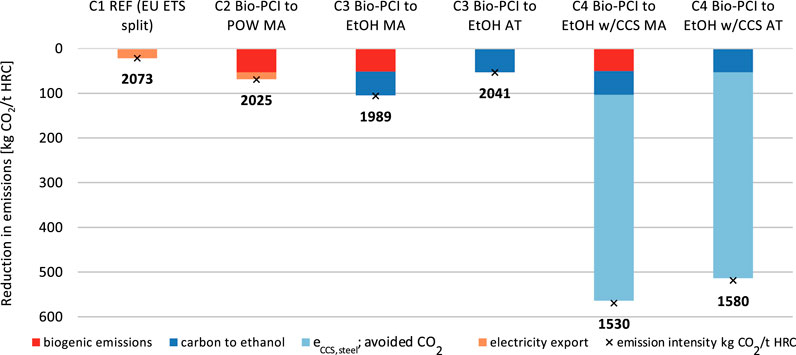
FIGURE 9. Emissions compared to the reference mill and the resulting emission intensity (×) of the steel product, depending on the steel mill configuration and allocation scheme, that is, allocation by carbon mass balance (MA) and free attribution (AT), which maximizes the amount to biogenic carbon assigned to the ethanol production. The allocation of CO2 avoided (CCS) is 93:7 (steel:ethanol) based on mass allocation. The grid intensity is 295.6 gCO2/kWh (EU average).
The CO2 emission intensities of the produced ethanol, as calculated from Eq. 11, are illustrated in Figure 10. The C1 and C2 configurations do not produce ethanol, and the emission intensity of the transport product system is the same as that of the fossil comparator, 94 gCO2eq/MJ. In C3, the cogenerated ethanol has a higher emission intensity than the fossil comparator with mass-based allocation. Free attribution reduces the emission intensity, although the biofuel target is not met. Note that a large share of the ethanol emission intensity is related to the electricity demand caused by the diversion of BFG to the syngas fermentation plant (displaced electricity). If these emissions were allocated to the steel product instead, leading to an increase of 27 kgCO2/t HRC; C3 with mass allocation would perform better than the fossil comparator, and C3 with free attribution would fulfill the biofuel criterion, that is, 65% emission savings compared to the fossil comparator.
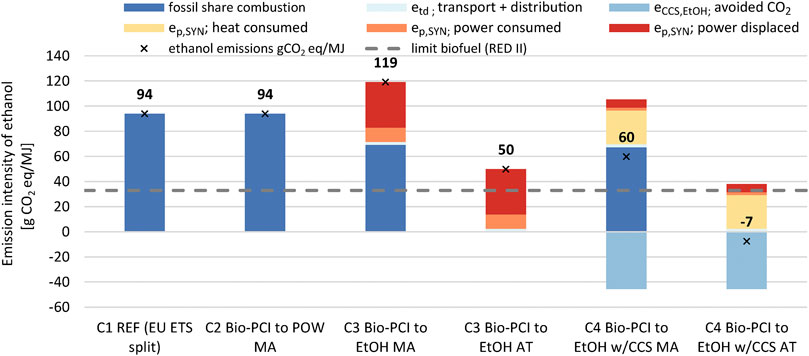
FIGURE 10. Emissions intensities of the ethanol product depending on the steel mill configuration and allocation principles: allocation by carbon mass balance and free attribution maximizing the biogenic carbon to ethanol production. The allocation of CO2 avoided (CCS) is 93:7 (steel:ethanol) based on mass allocation. The grid intensity is 295.6 gCO2/kWh (EU average).
Configuration C4, with syngas fermentation and CCS, requires the importation of NG to cover the heat demand (“eP,SYN heat consumed” in Figure 10). Since the heat is generated in the CHP plant, cogeneration of electricity increases, and this reduces the amount of emissions from the imported and displaced electricity. Despite this, the CO2 avoided from CCS allocated to ethanol does not compensate for the fossil share of the ethanol when allocating based on mass. With free attribution, however, CCS may lead to negative emissions in the transport product system. The value of -7 gCO2eq/MJ in Figure 10 is based on a CO2-avoided allocation of 93:7 between steel and ethanol (allocation by mass). The emission intensities would be +56 gCO2eq/MJ and - 624 gCO2eq/MJ for the extreme (steel:ethanol) ratios of 100:0 and 0:100, respectively. This attribution of avoided emissions to a product beyond the zero-line (0 gCO2eq/MJ) is unnecessary and should be avoided, unless the associated negative emissions can somehow be valorized by a robust, consumer-based, offsetting mechanism.
The absolute CO2 emissions in the electricity grid system change when implementing mitigation technologies, as shown in Figure 11. For C1 and C2, electricity is exported, whereas for C3 and C4, electricity is imported. The indirect CO2 emissions from the imported electricity are passed through to the cogenerated products (indicated by the bars cancelling out each other). The indirect emissions derived from the electricity required for CCS are considered in the CO2 avoidance calculation. In C3 and C4, only the electricity previously exported from the steel mill (C1 and C2) must be generated elsewhere, causing emissions corresponding to the grid intensity (assuming that the existing capacities of power-generating facilities suffice). Since the default grid intensity (EU average of 295.6 gCO2/kWh) is lower than the emissions intensities of the electricity in C1 and C2 (546 gCO2/kWh and 384 gCO2/kWh, respectively), C3 and C4 cause net lower emissions than C1 and C2. For grid intensities higher than the generated electricity’s intensities in C1 and C2, the configurations C3 and C4 cause an increase in emissions in the electricity grid system.
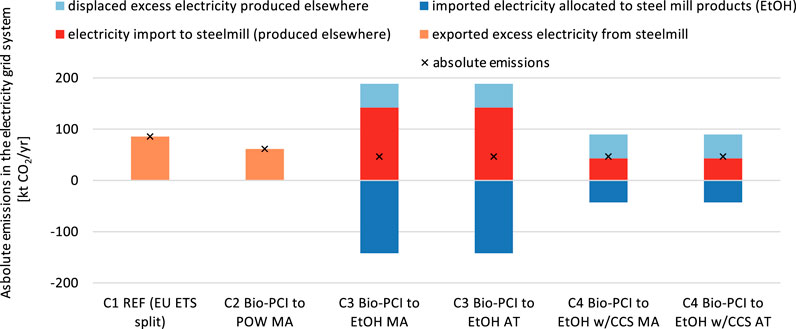
FIGURE 11. Absolute emissions in the electricity grid system due to interaction with the steel mill (4 Mt HRC per year) depending on the steel mill configuration and allocation principles: allocation by carbon mass balance and free attribution maximizing the biogenic carbon to ethanol production. The allocation of CO2 avoided (CCS) is 93:7 (steel:ethanol) based on mass allocation. The grid intensity is 295.6 gCO2/kWh (EU average).
Sensitivity of the Emission Intensity of Ethanol Toward the Emission Intensity of Electricity
Figure 12 shows the emission intensity of ethanol depending on grid intensities in the range of 0–788 gCO2/kWh for configurations C3 (Figure 12A) and C4 (Figure 12B). The dashed lines indicate the ethanol intensity when displaced electricity is allocated to the steel product, rather than to ethanol. The emission intensity of ethanol in C3 is more sensitive to the grid intensity than C4. C3 has a lower intensity than the fossil comparator for grid intensities of <140 gCO2/kWh and <580 gCO2/kWh with mass allocation and free attribution, respectively. For attribution, the biofuel criterion is met for grid intensities of <180 gCO2/kWh and <788 gCO2/kWh, if the displaced electricity is allocated to steel. The C4 configuration performs better than the fossil comparator for all grid intensities. With the attribution of biogenic carbon, the biofuel criterion is met for all grid intensities. However, with mass allocation, the criterion cannot be reached even with carbon-free electricity due to the large fossil share in the ethanol and the heating of the syngas fermentation plant with NG. The C4 configuration with mass allocation could reach the biofuel criterion with low-carbon intensity heat, for example, excess heat or heating with zero-carbon electricity (electric boiler and heat pump).
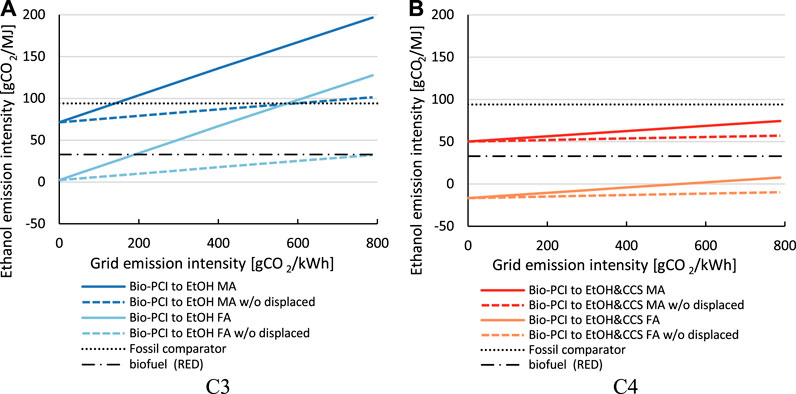
FIGURE 12. CO2 emission intensities of produced ethanol depending on the CO2 emission intensity of imported electricity for Bio-PCI to ethanol configurations without CCS (A) and with CCS (B). The dashed lines represent the emission intensity of ethanol if the displaced emissions from electricity import due to the diversion of BFG to the syngas fermentation are instead allocated to steel.
Effect of Heat Integration on Product Emission Intensities
Figure 13 shows the CO2 emission intensities of steel and ethanol as a function of the share of heat made available from heat integration, as defined by fHEX in Eq. 16 for the C3 and C4 configurations. Note that the filled symbols represent the default value for fHEX based on today’s potential for extra hot-water delivery. For C3, there is enough excess heat available (320 GWh/year), while C4 can only cover 27.8% of the heat demand by maximizing heat generation (663 GWh/year). In general, the total emissions in the three product systems with increased heat integration are reduced relative to the reference system (8.65 MtCO2 annually) and are within the ranges of 96.6%–97.4% and 68.8%–75.1% for C3 and C4, respectively. Since NG also generates electricity in the CHP plant, the level of electricity importation increases with increased heat integration. The CO2 emission intensities of the products show different characteristics in C3 and C4 when varying the value of fHEX:
• For the C3 configuration, the extra emissions at low levels of integration are allocated to the syngas fermentation plant [cf.Eqs. 12–15], since it causes the additional energy demand. This increases the emission intensity of ethanol when NG is required. The emission intensity of the steel product is unaffected.
• For the C4 configuration, the extra fossil-related emissions at low levels of integration are allocated to both the syngas fermentation plant and CCS plant. Since the demand for heat is dominated by the CCS plant (fheat,CCS:fheat,SYN = 87:13) and, conversely, the demand for electricity is dominated by the syngas fermentation plant (fpow,CCS:fpow,SYN = 39:61), the processing emissions for ethanol production due to power importation dominate those due to heat supply. Relative to C3, this leads to a slight increase in the emission intensity of ethanol with heat integration. Since avoided CO2 (CCS plant) is allocated to the steel product as well, the steel product intensity increases by up to 7% points with fossil fuel import.
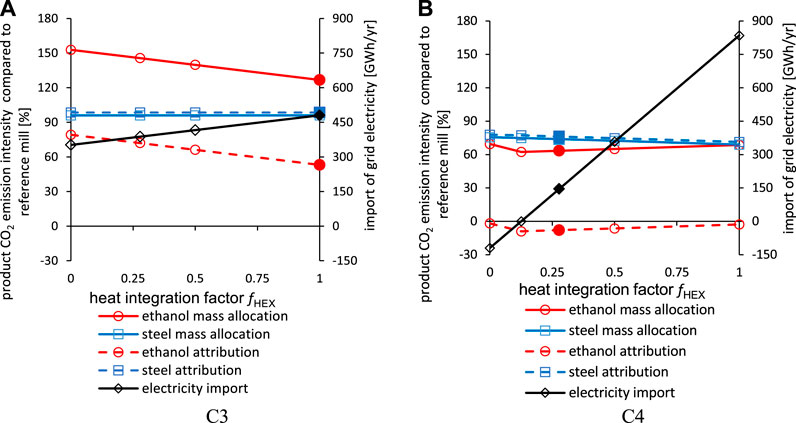
FIGURE 13. CO2 emission intensities of steel and ethanol depending on the extent of heat integration for a steel mill in Bio-PCI to ethanol configuration without CCS (A) and with CCS (B). The filled symbols represent the default assumptions for heat integration with the reference steel mill CHP and a grid intensity of 295.6 gCO2/kWh (EU average).
Future Potential for Emission Reductions
To assess the future potential for emissions reductions, the extent of the mitigation is increased by setting the capture rate to 99%, the grid intensity to 0 gCO2/kWh, and the replacement rate of PCI with biochar rbioPCI to 100% (corresponds to 724,000 t/yr biochar). With a yield of 35 wt.% (Wang et al., 2015) for biochar production, this amount of biochar would require >2 million tons of wood waste. The maximum rbioPCI leads to a share of 31.8% (by mass) of biogenic carbon in the input to the blast furnace. Ethanol production corresponding to the biogenic carbon input is not possible because the flow of BFG to the steel units would be insufficient. Therefore, only about 20% of the injected biogenic carbon may be converted to ethanol, yielding 226,000 tons of ethanol annually.
The impact of intensified mitigation on the total emissions and the product carbon and energy intensities is shown in Figure 14. The following observations can be made:
• The total emissions are reduced compared to the reference mill at the expense of extra energy consumption (Figure 14A). The largest total emission savings are achieved for C4 (47%), followed by C3 (24%) and C2 (21%), relative to the reference mill (C1); however, the emission reduction per invested extra energy is highest for C2 with approximately 10 tCO2/MWh, followed by C3 and C4 with 1 tCO2/MWh and 0.8 tCO2/MWh, respectively. This is explained by the high energy demands for syngas fermentation and CCS in C3 and C4. Note that the extra energy demand in C2 (cogeneration of electricity) is related to the injection of biochar instead of fossil pulverized coal.
• The energy intensity of the steel product is highly dependent upon the use of the BFG (Figure 14B). The cogeneration of ethanol from the BFG (C3) leads to lower energy intensity than the reference mill and the cogeneration of electricity (C2). The energy demand of CCS (C4) increases the energy intensity of the steel product relative to the other configurations, although the lowest emission intensity of 1,080 kgCO2/t HRC is achieved in C4.
• The emission intensity of the produced ethanol increases with rbioPCI increases in NG and electricity imports, which are caused by higher consumption of BFG to cogenerate ethanol. This increase in rbioPCI process emissions is compensated for in C4 with allocation by mass, as increases in rbioPCI and the capture rater rcapture lead to an increased share of biogenic carbon in the ethanol, thereby lowering the overall emission intensity of ethanol with rbioPCI. For C4 with attribution, the share of biogenic carbon in the ethanol is always 100%, such that an increase only increases the import of external energy, and thereby, increases the processing emissions. The energy intensity of produced ethanol, that is, the ratio of energy in the product to the energy demand (energy in the BFG feed + steam + factual power consumption), is 0.496 MJ/MJ. This value is the same for all replacement rates rbioPCI, since the underlying, assumed specific energy demand and conversion rates are maintained (cf.Figure 4 and Table S3).
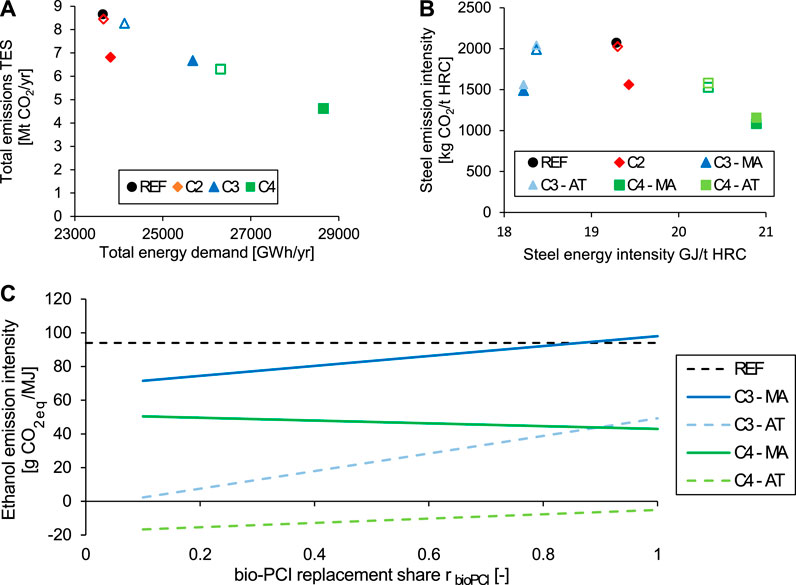
FIGURE 14. Impacts of intensified mitigation technologies on the total emissions in TES for an integrated steel mill of 4 Mt HRC per year (A), and the corresponding CO2 emission intensities of steel (B) and ethanol (C). The nonfilled symbols represent the default settings, that is, 90% CO2 capture from BFG and 10% Bio-PCI; the filled symbols represent 99% CO2 capture from BFG and 100% Bio-PCI. AT, attribution; C2, configuration with Bio-PCI and electricity export; C3, configuration with Bio-PCI and ethanol production; C4, configuration with ethanol production and CCS; MA, mass allocation; REF, reference (C1). The grid intensity is 0 gCO2/kWh.
Discussion
Technical Challenges for Deep Emission Reduction and Thermodynamic Considerations for Off-Gas Conversion
Deep mitigation in steelmaking via biomass introduction is intrinsically linked to overcoming the challenges associated with implementing Bio-PCI. Biomass-upgrading processes are typically on a scale of 20–100 kt biomass (Koppejan et al., 2012; Ronsse, 2013; Suopajärvi et al., 2013) and would require upscaling or parallel trains to 2,000 kt to replace all the fossil PCI-coal at a single site. Furthermore, the sourcing of the type B wood waste at this scale exceeds the regional or even national potential availability (total wood waste in EU ∼55 Mt, all types) (Borzecka, 2018), implying an increase in transborder wood waste flows (current total <2000 kt type B in EU) (Junginger et al., 2018) or the use of other sources of waste biomass. Even low-value wood waste might experience an increase in price with high-demand buyers entering the market. In addition, at higher shares of biomass (up to 100% PCI replacement), the requirements (e.g., related to the amounts of impurities) imposed on the injected biochar are likely to increase (depending on the upgrading technology) and require modifications to the blast furnace design (e.g., BFG recirculation).
The CCS technology faces fewer scale-up issues, since the absorption technology is already commercially operated at similar scales, for example, the Gorgon CCS project (Global CCS Institute, 2019), and is possible to operate at capture rates >99% (Feron et al., 2019), despite increases in energy and solvent consumption. However, implementation at smaller and more diluted sources/stacks will increase the mitigation cost considerably.
The synthesis of ethanol (or other chemicals) from the BFG is technically feasible, although the efficiencies of such syntheses may be improved. The economic feasibility will depend on the how the product is valued relative to other energy products. The typical conversion of steel mill gases into electricity occurs with 30%–42% efficiency and generates revenue from the sale of electricity not used in the steel mill. A shift to fuel synthesis may be thermodynamically favorable, owing to higher efficiencies, for example, 50% (MJ product/MJ syngas + heat + power) for ethanol (this work) and 50%–75% for methanol synthesis (Lundgren et al., 2013; Schittkowski et al., 2018). However, three important aspects must be considered when comparing these efficiencies: 1) the switch to fuel synthesis makes the mill a net importer of electricity; 2) cogeneration of heat (district heating or process heat) in a power plant can provide a total efficiency of >>90%; and 3) electricity has a higher efficiency and, thus, a greater mitigation effect when used for road-based passenger vehicles with electric drivelines (than internal combustion engines) in the form of synthesized chemicals or fuels for transport.
Governance of Carbon Allocation for Flexible Participation in Markets for Low-Carbon Products
As illustrated here, the scheme for the allocation of biogenic carbon and avoided CO2 emissions influences the CO2 emission intensities of cogenerated products. A key task for the regulatory bodies is to decide on the degree of flexibility that will be granted to producers in allocating biogenic shares or emission savings due to CCS to cogenerated products. A bullet point list of aspects to consider for policymakers is provided in Supplementary Material Section 3. Adhering to the currently applied voluntary allocation schemes (administrative schemes applying allocation by mass, energy content, or physical measurement) is understandable, since they achieve comparable results and reflect the current spirit of RED II (Schimmel et al., 2018) in the sense that the actual thermochemical processes are represented more or less accurately, especially in refineries. Concerning cogenerated ethanol from steel mill gases, the adherence to allocation by mass will most likely not facilitate the production of ethanol that meets the biofuel criterion (65% emission reduction relative to a fossil comparator), [cf.Figures 10, 12]. This is because most of the lowered emissions are allocated to the steel product. In this case, the carbon mitigation is harder to monetize, since markets for low-carbon steel currently do not exist. In contrast, the attribution scheme will maximize the value of the carbon mitigation but will not represent the actual biogenic content of a product (if measured, so to speak).
Attribution and also “within-product” allocation (see Allocation for Co-Processing of Biogenic and Fossil Feedstocks), which is used to channel emission savings to the sale of climate-positive, consumer-demanded products that finance investments in CCS in the pulp industry via buyers’ coalitions (Klement et al., 2020), could allow companies to adjust in a flexible manner, their mixes of low-carbon products sold to markets that currently value emissions and their mitigation differently. For example, emitting CO2 from processes that are exposed to global competition is basically for free (EUAs at the EU level and nationally are often exempted from CO2 taxation schemes), whereas locally or regionally used energy products are the targets of numerous funding schemes, for example, green electricity certificates (Sweden) and tax credits for blends of biofuel (US), or fines for below-standard blends of biofuels (Sweden). Thus, the flexibility conferred by free-choice attribution or within-product allocation may help emerging (sector-coupling) technologies to become implemented and help generate low-carbon products that fulfill the criteria for green public procurement and quotas on low-carbon materials (Agora Energiewende and Wuppertal Institut, 2019) or that could be sold with a small surcharge to the consumer, thereby offsetting the high investment costs of low-carbon processing (Rootzén and Johnsson, 2016).
Aside from economic motivation, support of this kind of attribution comes from the notion that the gasification of biomass could be executed in a designated stand-alone plant, which would generate ethanol with a 100% biogenic carbon content. The use of existing equipment, such as the blast furnace and heat integration using excess heat, allows for synergies, namely, lower emissions from producing steel and a fuel product with lower emissions than a comparable fossil fuel (cf.Figures 9, 10). Furthermore, the flexibility conferred by attribution is likely more important to process industry that mainly produces nonfuel products at bulk scale and wants to incorporate biofuel schemes on a small scale, since just the difference in scale will lead to low biogenic shares in the produced fuel if the current voluntary schemes designed for refineries are applied. The major risk here is that attribution may be perceived as a stepladder for greenwashing, since products that are advertised as “green” may be linked to the continued consumption of fossil fuels. Decisions taken by the regulatory bodies regarding a set of valid allocation schemes are, therefore, ultimately political decisions, and they should reflect the value of the low-carbon products for society in mitigating CO2 emissions.
Conclusions
To achieve drastic reductions in emissions from current production processes, a series of mitigation technologies implemented over time is needed. To motivate the implementation, funding schemes are needed in several sectors that create markets for low-carbon products. This work discusses the effects of carbon allocation on the emissions intensities of low-carbon products generated in facilities that co-process biogenic and fossil feedstocks using the example of an integrated steel mill (blast furnace route). The potential for CO2 mitigation is investigated for biochar injection into the blast furnace (Bio-PCI), carbon capture and storage (CCS), and microbial fermentation of steel mill off-gases to produce ethanol. The emissions intensities of cogenerated low-carbon products are discussed for the allocation of biogenic inputs and avoided CO2 emissions between the cogenerated steel, ethanol, and electricity. We present four allocation schemes, two of which are investigated in detail: allocation by carbon mass, representing the actual carbon flows, and a free-choice attribution, which maximizes the share of biogenic carbon in the ethanol (presently, the most-valued, low-carbon product).
Concerning the technical potential for emissions reductions in a reference integrated steel mill in Europe (4 Mt HRC and 8,377 ktCO2 per year), we conclude the following:
• Replacement of 10% of fossil PCI with biochar, which is possible without affecting the blast furnace operation, would lead to emission reductions of 2.5–3.5% for any product (e.g., electricity or ethanol) made from the CO and H2 in the BFG. The addition of CO2 capture (90%) from the BFG with subsequent CO2 storage would reduce emissions significantly (by 27% relative to the base case).
• Theoretical replacement of 100% of the fossil PCI with biochar and a 99% capture rate from the BFG would lead to ∼21–24% and ∼47% emissions reduction without and with CCS, respectively. Upscaling the biomass upgrading processes and sourcing are the most serious challenges, aside from blast furnace operation with large shares of biomass.
• Cogeneration of ethanol has a one order of magnitude lower CO2 avoidance per extra energy demand (∼1 tCO2/MWh) than the cogeneration of electricity (∼10 tCO2/MWh).
• The emission intensity of cogenerated ethanol depends on the allocated biogenic share, heat integration potential, biomass replacement rate, and CO2 intensity of the electricity imported.
Regarding the allocation schemes for co-processing, we conclude the following:
• The allocation scheme is important to the implementation of mitigation technologies, and the mass allocation and attribution schemes allocate the biogenic inputs to the products in diametrically opposite fashions.
• The allocation by mass will not yield an ethanol product from the BFG that is classified as bioethanol according to RED (65% reduction in emissions intensity of the transport fuel), even with the use of renewable electricity (0 gCO2/kWh) and CCS. This is valid in the near-term and assumes the use of NG for heat supply. The attribution scheme, however, will fulfill the requirement even up to an electricity CO2 intensity of 180 gCO2/kWh (without CCS).
• The main product, steel, receives mostly biogenic carbon from the allocation by mass. However, its specific emission intensity is less severely affected by the allocation schemes due to the limited injection of biomass relative to the production volume — 4 Mt steel versus 0.1 Mt ethanol. Furthermore, indirect emissions from imported electricity are allocated to the ethanol in all the schemes.
• Regulations related to the co-processing of biogenic and fossil feedstocks for the allocation of biogenic input to products will become relevant to more industries as they extend their product portfolios and engage with other sectors.
Data Availability Statement
All datasets presented in this study are included in the article/Supplementary Material.
Author Contributions
MB has contributed to conceptualization, literature research, methodology development, calculation, formal analysis, visualization, writing (original draft preparation and editing). RM has contributed to conceptualization, literature research, writing (original draft preparation, review and editing). FN has contributed to conceptualization, formal analysis, writing (review and editing), project administration. FJ has contributed to writing (review and editing), project administration, and funding acquisition. All authors have read and agreed to the published version of the manuscript.
Funding
This scientific publication is a result of the TORERO project. TORERO has received funding from the European Union’s Horizon 2020 - Research and Innovation Framework Programme (H2020-EU.3.3.3. - Alternative fuels and mobile energy sources). Project ID: 745810.
Conflict of Interest
The authors declare that the research was conducted in the absence of any commercial or financial relationships that could be construed as a potential conflict of interest.
Acknowledgments
The authors thank Alberto Alamia, formerly Chalmers University, and Wim van der Stricht, ArcelorMittal, Belgium, Ghent, for discussions and inputs. The authors thank Vincent Collins for proofreading. This work is based entirely on literature research. No results/underlying assumptions reflect information from or intellectual property of the stakeholders and participants in the Torero and Steelanol projects. Process assumptions made here do not reflect processes licensed by project partners. The work does not claim to reflect up-to-date regulations/developments, and the statements concerning RED compliancy (biofuel criterion) are made regarding the chosen methodology and process assumptions.
Supplementary Material
The Supplementary Material for this article can be found online at: https://www.frontiersin.org/articles/10.3389/fceng.2020.596279/full#supplementary-material
Glossary
BFG: Blast furnace gas
COG: Coke oven gas
BOF: Basic oxygen furnace
BOFG: Basic oxygen furnace gas
CHP: Combined heat and power
EtOH: Ethanol
HRC: Hot-rolled coil (final steel product)Hot metal (intermediate product of the blast furnace)Bio-PCI
PCI: Pulverized coal injection (common fossil blast furnace injectant)
CCS, CCU, CCUS: Carbon capture, utilization and/or storage
CAS: Carbon allocation system (system defined in this work)
TES: Total emissions system (system defined in this work)
MEA: Monoethanolamine (solvent for CO2 absorption)
TRL: Technology readiness level
EUA: EU Allowance
EU: ETS credit corresponding to one ton CO2eq.
FT: Fischer-Tropsch
RED II: Renewable Energy Directive (EU Directive 2018/2001)
FQD: Fuel Quality Directive (EU Directive 98/70/EC)
LHV: Lower heating value
GHG: Greenhouse gas
ETS: Emission trading system
C1–C4: Cases/Configurations of the studied integrated steel mill
References
Agora Energiewende, and Wuppertal Institut (2019). Climate-neutral industry (executive summary): key technologies and policy options for steel, chemicals and cement. Berlin. Available at:https://www.agora-energiewende.de/fileadmin2/Projekte/2018/Dekarbonisierung_Industrie/168_A-EW_Climate-neutral-industry_EN_ExecSum_WEB.pdf.
Ali, H., Eldrup, N. H., Normann, F., Andersson, V., Skagestad, R., Mathisen, A., et al. (2018). Cost estimation of heat recovery networks for utilization of industrial excess heat for carbon dioxide absorption. Int. J. Greenh. Gas Control 74, 219–228. doi:10.1016/j.ijggc.2018.05.003
Arasto, A., Tsupari, E., Kärki, J., Pisilä, E., and Sorsamäki, L. (2013). Post-combustion capture of CO2 at an integrated steel mill–part I: technical concept analysis. Int. J. Greenh. Gas Control 16, 271–277. doi:10.1016/j.ijggc.2012.08.018
ArcelorMittal, (2020). Climate Action in Europe-our carbon emissions reduction roadmap: 30% by 2030 and carbon neutral by 2050. Luxembourg. Available at:https://corporate-media.arcelormittal.com/media/b4wh4cd0/climate-action-in-europe.pdf.
Axelson, M., Robson, I., Wyns, T., and Khandekar, G. (2018). Breaking through-industrial low-CO2 technologies on the Horizon. Institute for European Studies, Vrije Universiteit Brussel. Available at:www.ies.be/Breaking-Through_Report_13072018.
Berghout, N., Meerman, H., van den Broek, M., and Faaij, A. (2019). Assessing deployment pathways for greenhouse gas emissions reductions in an industrial plant–a case study for a complex oil refinery. Appl. Energy 236, 354–378. doi:10.1016/j.apenergy.2018.11.074
Biermann, M., Ali, H., Sundqvist, M., Larsson, M., Normann, F., and Johnsson, F. (2019). Excess heat-driven carbon capture at an integrated steel mill–considerations for capture cost optimization. Int. J. Greenh. Gas Control 91, 102833. doi:10.1016/j.ijggc.2019.102833
Biermann, M., Normann, F., Johnsson, F., and Skagestad, R. (2018). Partial carbon capture by absorption cycle for reduced specific capture cost. Ind. Eng. Chem. Res. 57, acs.iecr.8b02074. doi:10.1021/acs.iecr.8b02074
Birat, J.-P. (2020). Society, materials, and the environment: the case of steel. Metals (Basel). 10, 331. doi:10.3390/met10030331
Borzecka, M. (2018). European wood waste statistics report for recipient and model regions. Available at:www.ies.be/Breaking-Through_Report_13072018.
Bui, M., Adjiman, C. S., Bardow, A., Anthony, E. J., Boston, A., Brown, S., et al. (2018). Carbon capture and storage (CCS): the way forward. Energy Environ. Sci. 11, 1062–1176. doi:10.1039/c7ee02342a
CORDIS (2017). Carbon4Pur-turning industrial waste gases (mixed CO/CO2 streams) into intermediates for polyurethane plastics for rigid foams/building insulation and coatings. Available at: https://cordis.europa.eu/project/id/768919 (Accessed July 1, 2020).
CORDIS (2020). DMX demonstration in Dunkirk. Available at: https://cordis.europa.eu/project/id/838031 (Accessed July 10, 2020).
CORDIS (2016). FReSMe-from residual steel gases to methanol. Available at: https://cordis.europa.eu/project/id/727504 (Accessed July 1, 2020).
Cormos, C.-C. (2016). Evaluation of reactive absorption and adsorption systems for post-combustion CO2 capture applied to iron and steel industry. Appl. Therm. Eng. 105, 56–64. doi:10.1016/j.applthermaleng.2016.05.149
Deng, H., Roussanaly, S., and Skaugen, G. (2019). Techno-economic analyses of CO2 liquefaction: impact of product pressure and impurities. Int. J. Refrig. 103, 301–315. doi:10.1016/j.ijrefrig.2019.04.011
Dreillard, M., Broutin, P., Briot, P., Huard, T., and Lettat, A. (2017). Application of the DMXTM CO2 capture process in steel industry. Energy Procedia 114, 2573–2589. doi:10.1016/j.egypro.2017.03.1415
ECN (2019). Process intensification: SEWGS case. Available at:https://www.ecn.nl/news/item/process-intensification-sewgs-case/ (Accessed April 19, 2019 ).
Energy Transition Commission (2018). Mission Possible: reaching net-zero carbon emissions from harder-to-abate sectors by mid-century. Available at: http://www.energy-transitions.org/sites/default/files/ETC_MissionPossible_FullReport.pdf.
European Commission (2015). Council Directive (EU) 2015/652 of 20 April 2015 laying down calculation methods and reporting requirements pursuant to Directive 98/70/EC of the European Parliament and of the Council relating to the quality of petrol and diesel fuels. 1–42. Available at:https://eur-lex.europa.eu/legal-content/EN/TXT/PDF/?uri=CELEX:32015L0652&from=EN.
European Commission (2019a). Guidance Document n°6 on the harmonized free allocation methodology for the EU-ETS post 2012-cross-Boundary Heat Flows. 1–47. Available at: https://ec.europa.eu/clima/sites/clima/files/ets/allowances/docs/gd6_cross_boundary_heat_flows_en.pdf Date of access: 2019-07-31.
European Commission (2019b). Guidance Document no 8 on the harmonised free allocation methodology for the EU ETS post 2020-waste gases and process emissions sub-installation. Available at:https://ec.europa.eu/clima/sites/clima/files/ets/allowances/docs/p4_gd8_waste_gases_process_emissions_en.pdf.
European Commission (2019c). The European green deal. Available at: https://eur-lex.europa.eu/legal-content/EN/TXT/?qid=1596443911913&uri=CELEX:52019DC0640#document2.
European Commission (2020). Voluntary schemes. Available at:https://ec.europa.eu/energy/topics/renewable-energy/biofuels/voluntary-schemes_en (Accessed July 8, 2020).
European Environment Agency (2018). Electricity generation-CO2 emission intensity European Union. Available at:https://www.eea.europa.eu/data-and-maps/daviz/sds/co2-emission-intensity-from-electricity-generation-2/@@view (Accessed August 3, 2020)
European Parliament and Council of the European Union (2018a). Directive (EU) 2018/2001 of the European Parliament and of the Council of 11 December 2018 on the promotion of the use of energy from renewable sources. Off. J. Eur. Union 2018. Available at:http://data.europa.eu/eli/dir/2018/2001/oj.
European Parliament and Council of the European Union (2018b). DIRECTIVE 98/70/EC OF THE EUROPEAN PARLIAMENT AND OF THE COUNCIL of 13 October 1998 relating to the quality of petrol and diesel fuels and amending Council Directive 93/12/EEC. Off. J. Eur. Union. Available at:https://ec.europa.eu/clima/policies/transport/fuel_en#tab-0-1.
Federal Ministry of Education and Research of Germany (2016). Carbon2Chem. Available at:https://www.fona.de/en/measures/funding-measures/carbon2chem-project.php (Accessed July 1, 2020).
Feron, P., Cousins, A., Jiang, K., Zhai, R., Shwe Hla, S., Thiruvenkatachari, R., et al. (2019). Towards zero emissions from fossil fuel power stations. Int. J. Greenh. Gas Control 87, 188–202. doi:10.1016/j.ijggc.2019.05.018
Gardarsdottir, S. O., De Lena, E., Romano, M., Roussanaly, S., Voldsund, M., Pérez-Calvo, J. F., et al. (2019). Comparison of technologies for CO2 capture from cement production—part 2: cost analysis. Energies 12, 542. doi:10.3390/en12030542
Gazzani, M., Romano, M. C., and Manzolini, G. (2015). CO2 capture in integrated steelworks by commercial-ready technologies and SEWGS process. Int. J. Greenh. Gas Control 41, 249–267. doi:10.1016/j.ijggc.2015.07.012
Guintoli, J., Agostini, A., Edwards, R., and Marelli, L. (2017). Solid and gaseous bioenergy pathways: input values and GHG emissions. Calculated according to the methodology set in COM(2016) 767 (EUR 27215). 226. Available at:.
Handler, R. M., Shonnard, D. R., Griffing, E. M., Lai, A., and Palou-Rivera, I. (2016). Life cycle assessments of ethanol production via gas fermentation: anticipated greenhouse gas emissions for cellulosic and waste gas feedstocks. Ind. Eng. Chem. Res. 55, 3253–3261. doi:10.1021/acs.iecr.5b03215
Hawighorst, P. (2019). Challenges for RED II sustainability certification from a certification scheme’s point of view. Available at:.
Ho, M. T., Bustamante, A., and Wiley, D. E. (2013). Comparison of CO2 capture economics for iron and steel mills. Int. J. Greenh. Gas Control 19, 145–159. doi:10.1016/j.ijggc.2013.08.003
IChemE Energy Centre (2018). A chemical engineering perspective on the challenges and opportunities of delivering carbon capture and storage at commercial scale.
IEAGHG (2013). 2013/04 Iron and Steel CCS study (Techno-economics integrated steel mill). Available at: https://www.google.com/search?q=2013%2F04+Iron+and+Steel+CCS+study+(Techno-economics+integrated+steel+mill)&rlz=1C1GCEU_en-GBIN857IN857&oq=2013%2F04+Iron+and+Steel+CCS+study+{Techno-economics+integrated+steel+mill)&aqs=chrome.69i57.1031j0j4&sourceid=chrome&ie=UTF-8
ISCC (2017). ISCC 203-01 guidance for the certification of Co-processing. 1–9. Available at: https://www.iscc-system.org/wp-content/uploads/2017/02/ISCC-Guidance-Document-203-01_Co-processing-requirements.pdf (Accessed 31 July, 2019).
ISO (2006). ISO 14044:2006(en) Environmental management—life cycle assessment—requirements and guidelines. Available at: https://www.iso.org/obp/ui/#iso:std:iso:14044:ed-1:v1:en (Accessed 31 July, 2019).
Joint Research Centre (2016). Data requirements and principles for calculating the life cycle GHG intensity of novel transport fuels and invitation to submit data. 2, 1–10.
Junginger, M., Järvinen, M., Olsson, O., Hennig, C., and Dadhich, P. (2018). Transboundary flows of woody biomass waste streams in Europe. Available at:.http://task40.ieabioenergy.com/wp-content/uploads/2019/01/IEA-Bioenergy-2019.-Wood-waste-trade-study-FINAL.pdf.
Kirschen, M., Badr, K., and Pfeifer, H. (2011). Influence of direct reduced iron on the energy balance of the electric arc furnace in steel industry. Energy 36, 6146–6155. doi:10.1016/j.energy.2011.07.050
Klement, J., Rootzén, S., Normann, F., and Johnsson, F. (2020). Incentivising BECCS in the pulp and paper industry ‐ a supply chain analysis. Submitted for Publication 32, 1–54.
Koppejan, J., Sokhansanj, S., Melin, S., and Madrali, S. (2012). Status overview of torrefaction technologies. IEA Bioenergy Task 32, 1–54.
Kuramochi, T., Ramírez, A., Turkenburg, W., and Faaij, A. (2012). Comparative assessment of CO2 capture technologies for carbon-intensive industrial processes. Prog. Energy Combust. Sci. 38, 87–112. doi:10.1016/j.pecs.2011.05.001
LanzaTech, (2018). World’s first commercial waste gas to ethanol plant starts up. Available at:https://www.lanzatech.com/2018/06/08/worlds-first-commercial-waste-gas-ethanol-plant-starts/. (Accessed July 1, 2020).
Liew, F., Martin, M. E., Tappel, R. C., and Heijstra, B. D. (2016). Gas fermentation—a flexible platform for commercial scale production of low-carbon-fuels and chemicals from waste and renewable feedstocks. Front Microbiol. 11, 694. doi:10.3389/fmicb.2016.00694
Lulekraft, A. B. (2018). LuleKraft-annual production. Available at:http://lulekraft.se/verksamheten/aarsproduktion.aspx (Accessed March 4, 2018).
Lundgren, J., Ekbom, T., Hulteberg, C., Larsson, M., Grip, C.-E., Nilsson, L., et al. (2013). Methanol production from steel-work off-gases and biomass based synthesis gas. Appl. Energy 112, 431–439. doi:10.1016/j.apenergy.2013.03.010
Müller, L. J., Kätelhön, A., Bringezu, S., McCoy, S., Suh, S., Edwards, R., et al. (2020). The carbon footprint of the carbon feedstock CO2. Energy Environ. Sci. 13, 2979–2992. doi:10.1039/D0EE01530J
Mandova, H., Patrizio, P., Leduc, S., Kjärstad, J., Wang, C., Wetterlund, E., et al. (2019). Achieving carbon-neutral iron and steelmaking in Europe through the deployment of bioenergy with carbon capture and storage. J. Clean. Prod. 218, 118–129. doi:10.1016/j.jclepro.2019.01.247
Martinez Castilla, G., Biermann, M., Montañés, R. M., Normann, F., and Johnsson, F. (2019). Integrating carbon capture into an industrial combined-heat-and-power plant: performance with hourly and seasonal load changes. Int. J. Greenh. Gas Control 82, 192–203. doi:10.1016/j.ijggc.2019.01.015
Masson-Delmotte, V., Zhai, P., Pörtner, H. O., Roberts, D., Skea, J., et al. (2018). “IPCC, 2018: summary for policymakers.” in Global warming of 1.5°C: an IPCC Special Report on the impacts of global warming of 1.5°C above pre-industrial levels and related global greenhouse gas emission pathways, in the context of strengthening the global. Geneva, Switzerland, (World Meteorological Organization).
Mathieson, J. G., Rogers, H., Somerville, M. A., Jahanshahi, S., and Ridgeway, P. (2011). “Potential for the use of biomass in the iron and steel industry.”in Chemeca 2011: Engineering a Better World, New South Wales, Australia, 18-21 September 2011, 1065–1076. Available at:http://search.informit.org/browsePublication;isbn=9780858259676;res=IELENG;subject=Zoology.
Meijer, K., Denys, M., Lasar, J., Birat, J.-P., Still, G., and Overmaat, B. (2009). ULCOS: ultra-low CO2 steelmaking. Ironmak. Steelmak. 36, 249–251. doi:10.1179/174328109X439298
Messagie, M., Boureima, F., Mertens, J., Sanfelix, J., Macharis, C., and Mierlo, J. (2013). The influence of allocation on the carbon footprint of electricity production from waste gas, a case study for blast furnace gas. Energies 6, 1217–1232. doi:10.3390/en6031217
Molitor, B., Richter, H., Martin, M. E., Jensen, R. O., Juminaga, A., Mihalcea, C., et al. (2016). Bioresource Technology Carbon recovery by fermentation of CO-rich off gases–turning steel mills into biorefineries. Bioresour. Technol. 215, 386–396. doi:10.1016/j.biortech.2016.03.094
Mousa, E., Wang, C., Riesbeck, J., and Larsson, M. (2016). Biomass applications in iron and steel industry: an overview of challenges and opportunities. Renew. Sustain. Energy Rev. 65, 1247–1266. doi:10.1016/j.rser.2016.07.061
Ng, K. W., Giroux, L., and MacPhee, T., and Todoschuk, T. (2010). “Direct injection of biofuel in blast furnace ironmaking.”in Iron & steel technology conference; AISTech 2010, AISTECH -CONFERENCE PROCEEDINGS, Warrendale, PA (Association for Iron and Steel Technology). 643–652. Available at:https://www.tib.eu/de/suchen/id/BLCP%3ACN076471986 (Accessed 31 July, 2019).
Ou, X., Zhang, X., Zhang, Q., and Zhang, X. (2013). Life-cycle analysis of energy use and greenhouse gas emissions of gas-to-liquid fuel pathway from steel mill off-gas in China by the LanzaTech process. Front. Energy 7, 263–270. doi:10.1007/s11708-013-0263-9
Pardo-planas, O., Atiyeh, H. K., Phillips, J. R., Aichele, C. P., and Mohammad, S. (2017). Bioresource Technology Process simulation of ethanol production from biomass gasi fi cation and syngas fermentation. Bioresour. Technol. 245, 925–932. doi:10.1016/j.biortech.2017.08.193
Phillips, J. R., Huhnke, R. L., and Atiyeh, H. K. (2017). Syngas fermentation: a microbial conversion process of gaseous substrates to various products. Fermentation 3, 1–6. doi:10.3390/fermentation3020028
Piccolo, C., and Bezzo, F. (2009). A techno-economic comparison between two technologies for bioethanol production from lignocellulose. Biomass and Bioenergy 33, 478–491. doi:10.1016/j.biombioe.2008.08.008
Ramírez-Santos, Á. A., Castel, C., and Favre, E. (2018). A review of gas separation technologies within emission reduction programs in the iron and steel sector: current application and development perspectives. Sep. Purif. Technol. 194, 425–442. doi:10.1016/j.seppur.2017.11.063
Rao, A. B., and Rubin, E. S. (2006). Identifying cost-effective CO2 control levels for amine-based CO2 capture systems. Ind. Eng. Chem. Res. 45, 2421–2429. doi:10.1021/ie050603p
Robak, K., and Balcerek, M. (2018). Review of second generation bioethanol production from residual biomass. Food Technol. Biotechnol. 56, 174–187. doi:10.17113/ftb.56.02.18.542
Ronsse, F. (2013). “Commercial biochar production and its certification.”in Interreg IVB Proj. Biochar Clim. Sav. soils, Groningen, Netherlands. Available at:http://archive.northsearegion.eu/files/repository/20140811101209_02_FrederikRonsse-Commercialbiocharproductionanditscertification.pdf (Accessed July 10, 2020).
Rootzén, J., and Johnsson, F. (2016). Paying the full price of steel–perspectives on the cost of reducing carbon dioxide emissions from the steel industry. Energy Pol. 98, 459–469. doi:10.1016/j.enpol.2016.09.021
Schimmel, M., Toop, G., Alberici, S., and Koper, M. (2018). Determining the renewability of co-processed fuels. 1–34. Available at:https://ec.europa.eu/energy/sites/ener/files/documents/co-processing_final_report_090418.pdf.
Schittkowski, J., Ruland, H., Laudenschleger, D., Girod, K., Kähler, K., Kaluza, S., et al. (2018). Methanol synthesis from steel mill exhaust gases: challenges for the industrial Cu/ZnO/Al2O3 catalyst. Chemie Ing. Tech. 90, 1419–1429. doi:10.1002/cite.201800017
Shankar Tumuluru, J., Sokhansanj, S., Hess, J. R., Wright, C. T., and Boardman, R. D. (2011). REVIEW: a review on biomass torrefaction process and product properties for energy applications. Ind. Biotechnol. 7, 384–401. doi:10.1089/ind.2011.7.384
SSAB, (2019). SSAB to be first with fossil-free steel with HYBRIT technology. Available at:https://www.ssab.com/company/sustainability/sustainable-operations/hybrit (Accessed July 7, 2020).
Steelanol Consortium, (2015). Steelanol - fueling a sustainable future. Available at:http://www.steelanol.eu/en (Accessed April 20, 2020).
Sundqvist, M., Biermann, M., Normann, F., Larsson, M., and Nilsson, L. (2018). Evaluation of low and high level integration options for carbon capture at an integrated iron and steel mill. Int. J. Greenh. Gas Control 77, 27–36. doi:10.1016/j.ijggc.2018.07.008
Suopajärvi, H., Kemppainen, A., Haapakangas, J., and Fabritius, T. (2017). Extensive review of the opportunities to use biomass-based fuels in iron and steelmaking processes. J. Clean. Prod. 148, 709–734. doi:10.1016/j.jclepro.2017.02.029
Suopajärvi, H., Pongrácz, E., and Fabritius, T. (2013). The potential of using biomass-based reducing agents in the blast furnace: a review of thermochemical conversion technologies and assessments related to sustainability. Renew. Sustain. Energy Rev. 25, 511–528. doi:10.1016/j.rser.2013.05.005
Suopajärvi, H., Umeki, K., Mousa, E., Hedayati, A., Romar, H., Kemppainen, A., et al. (2018). Use of biomass in integrated steelmaking–status quo, future needs and comparison to other low-CO2 steel production technologies. Appl. Energy 213, 384–407. doi:10.1016/j.apenergy.2018.01.060
Tanzer, S. E., Blok, K., and Ramírez, A. (2020). Can bioenergy with carbon capture and storage result in carbon negative steel? Int. J. Greenh. Gas Control 100, 103104. doi:10.1016/j.ijggc.2020.103104
Toktarova, A., Karlsson, I., Rootzén, J., Göransson, L., Odenberger, M., and Johnsson, F. (2020). Pathways for low-carbon transition of the steel industry—a Swedish case study. Energies 13, 3840. doi:10.3390/en13153840
Torero Consortium, (2017). Torero project - fueling a sustainable future. Available at:http://www.torero.eu/ (Accessed April 20, 2020).
Tsupari, E., Kärki, J., Arasto, A., and Pisilä, E. (2013). Post-combustion capture of CO2 at an integrated steel mill–part II: economic feasibility. Int. J. Greenh. Gas Control 16, 278–286. doi:10.1016/j.ijggc.2012.08.017
van Dyk, S., Su, J., Mcmillan, J. D., and Saddler, J. (2019). Potential synergies of drop-in biofuel production with further co-processing at oil refineries. Biofuels Bioprod. Biorefining 13, 760–775. doi:10.1002/bbb.1974
Vogl, V., Åhman, M., and Nilsson, L. J. (2018). Assessment of hydrogen direct reduction for fossil-free steelmaking. J. Clean. Prod. 203, 736–745. doi:10.1016/j.jclepro.2018.08.279
Vogl, V., and Åhman, M. (2019). “What is green steel?-towards a strategic decision tool for decarbonising EU steel.” in METEC-ESTAD conference, Düsseldorf, June 24–28, 2019. Available at:https://lup.lub.lu.se/search/publication/89d45b6d-b432-49ac-864f-33f93be3290b.
Voldsund, M., Gardarsdottir, S., De Lena, E., Pérez-Calvo, J.-F., Jamali, A., Berstad, D., et al. (2019). Comparison of technologies for CO2 capture from cement production—part 1: technical evaluation. Energies 12, 559. doi:10.3390/en12030559
Wang, C., Mellin, P., Lövgren, J., Nilsson, L., Yang, W., Salman, H., et al. (2015). Biomass as blast furnace injectant – considering availability, pretreatment and deployment in the Swedish steel industry. Energy Convers. Manag. 102, 217–226. doi:10.1016/j.enconman.2015.04.013
Wiklund, C. M., Helle, M., Kohl, T., Järvinen, M., and Saxén, H. (2017). Feasibility study of woody-biomass use in a steel plant through process integration. J. Clean. Prod. 142, 4127–4141. doi:10.1016/j.jclepro.2016.09.210
World Steel Association (2014). A methodology to determine the LCI of steel industry co-products. 1–38. Available at:https://www.worldsteel.org/steel-by-topic/life-cycle-thinking/methodology-for-slag-LCI-calculation-.html.
Keywords: low-carbon products, allocation, integrated steel mill, co-processing, carbon capture utilization and storage, pulverized coal injection, syngas fermentation, biofuels
Citation: Biermann M, Montañés RM, Normann F and Johnsson F (2020) Carbon Allocation in Multi-Product Steel Mills That Co‐process Biogenic and Fossil Feedstocks and Adopt Carbon Capture Utilization and Storage Technologies. Front. Chem. Eng. 2:596279. doi: 10.3389/fceng.2020.596279
Received: 18 August 2020; Accepted: 08 October 2020;
Published: 09 December 2020.
Edited by:
Juliana Monteiro, Netherlands Organisation for Applied Scientific Research, NetherlandsReviewed by:
Qingchun Yang, Hefei University of Technology, ChinaJuan Gabriel Segovia Hernandez, University of Guanajuato, Mexico
Copyright © 2020 Biermann, Montañés, Normann and Johnsson. This is an open-access article distributed under the terms of the Creative Commons Attribution License (CC BY). The use, distribution or reproduction in other forums is permitted, provided the original author(s) and the copyright owner(s) are credited and that the original publication in this journal is cited, in accordance with accepted academic practice. No use, distribution or reproduction is permitted which does not comply with these terms.
*Correspondence: Maximilian Biermann, bWF4LmJpZXJtYW5uQGNoYWxtZXJzLnNl