 Luz A. Zavala-Sanchez
 Françoise Maugé
 Xavier Portier
 Laetitia Oliviero
- 1Laboratoire Catalyse et Spectrochimie, Normandie Université, ENSICAEN, UNICAEN, Caen, France
- 2Centre De Recherche Sur Les Ions, Les Matériaux et La Photonique, CEA, UMR CNRS 6252, Normandie Université, ENSICAEN, UNICAEN, CNRS, Caen, France
MS2 morphology is strongly influenced by several parameters including the addition of a chelating agent and sulfidation temperature. In this work, we report the use of citric acid as chelating agent in order to prepare a series of WS2/Al2O3 catalysts that were submitted to sulfidation at several temperatures. The effect of these two parameters in the morphology of the slabs was explored by means of CO adsorption at low temperature followed by IR spectroscopy (IR/CO) and later confirmed by High-Resolution Scanning Transmission Electron Microscopy coupled with High Angular Annular Dark Field detector (HR STEM - HAADF). This allowed to depict the morphology of WS2 slabs by means of calculating the M-edge/S-edge site ratio. The use of citric acid in the preparation stage favors the increase of S-edge site concentration whereas it keeps that of M-edge sites: according to IR/CO, with an increasing amount of citric acid, the WS2 morphology progressively changes from a slightly truncated triangle exhibiting predominantly M edges to a hexagon with both M edge and S edge. In addition, HR STEM-HAADF demonstrated that the addition of citric acid in the impregnation step of W catalysts considerably reduces the size of WS2 nanoparticles increasing their dispersion degree. The morphology of the WS2 plates on the activated WS2/Al2O3 catalyst with a typical sulfidation temperature range (573–673 K) was detected to be a truncated triangle exposing both the M-edge and the S-edge. Furthermore, the IR/CO results indicate that the degree of truncation (ratio of S-edge/M-edge) of WS2 slabs gradually rises with the increasing sulfidation temperature. However, the most determining factor for a modification of the morphology of the slabs turns out to be the presence of citric acid as a chelating agent and not the sulfidation temperature. This change in morphology (i.e., change of S-edge/M-edge ratio) is a key factor for catalytic performance, since the M-edge and the S-edge show different reactivity in hydrodesulfurization (HDS) reactions. Notably, it was also found that the addition of citric acid not only improves the catalytic activity but also the stability of the catalysts, giving the best performance in concentrations higher than (CA/W = 1).
Introduction
In order to keep pace with the more severe environmental legislations as well as the decrease of light oil resources, heavy crude oils have to be refined into ultra-low sulfur content transportation fuel. Hydrodesulfurization (HDS) is a fundamental process in refineries where transition metal disulfides (TMS) supported on high surface supports as gamma alumina (γ-Al2O3) are used as catalysts. Taking into consideration that in many cases the petroleum resources employed by the refining industry have a high concentration of sulfur, more suitable technologies must be developed. Particularly looking for an improvement of the hydrogenation selectivity will play a critical role in future HDS processing. Due to their unique physicochemical properties, the key ingredient in an HDS catalyst are the two-dimensional (2D) metal disulfide (MS2) nanostructures (slabs). (Xu et al., 2017). These materials have revealed major benefits for energy-related technologies with diverse applications in several fields of research. (Lei et al., 2018).
The type and number of edges exposed under different synthesis conditions are of critical importance for the catalytic performance of MS2, since the catalytic reaction generally takes place at these sites on the edges of MS2 slabs and that the basal planes are catalytically inert to HDS reaction. (Jaramillo et al., 2007; Chen et al., 2015a). In MS2 slabs there are mainly two types of edges: the edge with metal atom ends (M-edge) and the edge with sulfur atom ends (S-edge). In MoS2 for instance, previous studies have evidenced that M-edge and S-edge sites present different intrinsic activities in the HDS reaction. In widely studied Mo based catalysts (MoS2, CoMoS and NiMoS), it has been found that the S-edge is more active than the M-edge and that the formation of the promoted phase CoMoS is favored. (Okamoto et al., 2009; Chen et al., 2014a; Chen et al., 2014b). W based catalysts are mostly assumed to have the same behavior, in some way, as the widely studied HDS Mo based catalyst. Despite W-based catalysts provide an interesting improvement in the catalytic activity, especially in aromatic hydrogenation reactions as the conversion of alkyl-dibenzothiophenes (alkyl- DBTs) for deep HDS, (Santolalla-Vargas et al., 2015; Suárez-Toriello et al., 2015; Alphazan et al., 2016; Zavala-Sanchez, 2019), the WS2 phase and its Ni and Co. promoted counterparts have been poorly described, particularly at the molecular level. (Kabe et al., 1997; Füchtbauer et al., 2013; Zavala-Sanchez et al., 2020a).
For instance, it has been documented that the morphology of MoS2 slabs is modified according to the choice of catalyst support. This indicates that the support-slab interaction has a determining role regarding the morphology of the MoS2 slabs. (Walton et al., 2013; Dominguez Garcia et al., 2020). In this way, it can be anticipated that provoking a change in the active phase-support interactivity could guide to a different preference of growth of the M-edge and the S-edge during sulfidation and, therefore, produce a morphology change of the slabs. The addition of chelating agents has an effective role in increasing the degree of dispersion of the active phases of TMS. (Cattaneo et al., 1999; Al-Dalama and Stanislaus, 2006; Zavala-Sanchez et al., 2021). This, by interacting with the metallic precursor ions and the OH groups present in the support surface. Citing the case of non-promoted Mo catalysts, morphological variations were observed indirectly by the IR/CO method and also by means of STEM HAADF when including citric acid (CA) into the preparation during the impregnation. (Chen et al., 2014a; Zavala-Sanchez et al., 2019b). The results of these two techniques evidenced that, the S-edge/M-edge ratio was closer to the value of one when CA was present. However, for W systems no comparable study has been reported before. Another critical parameter for HDT catalysts is sulfidation temperature. this parameter has strong influence on the active phase structure and catalytic yield of Mo based catalysts. For example, it was found in the MoS2 slabs supported on Al2O3, the morphology consisted of a truncated triangle exposing both the M edge and the S edge, this within the classic sulfidation temperature interval (573–673 K). By means of IR/CO it was detected that the degree of truncation (S edge/M edge ratio) of the MoS2 slabs increased progressively with increasing sulfidation temperature. (Chen et al., 2014b). Nevertheless, this evolution over sulfidation temperatures has not been reported for unpromoted WS2 slabs. Recently, in W-based catalysts whose catalytic activity was reported outstanding, their enhanced activities were related to be a consequence of an evolution in the 2D hexagonal morphology of WS2 particles. (Alphazan et al., 2014; Girleanu et al., 2014). However, there are still open doubts about how the morphology of W slabs prepared in the presence of a chelating agent, such as citric acid, will evolve. As a well-recognized technique, low-temperature CO adsorption followed by infrared spectroscopy (IR/CO) has been successfully applied to probe the edges sites of MS2 (Mo or W) slabs on MS2/Al2O3 catalysts. (Chen et al., 2014a; Chen et al., 2015b; Chen et al., 2017; Zavala-Sanchez et al., 2019a; Dominguez Garcia et al., 2020; Zavala-Sanchez et al., 2020b). with IR spectroscopy, an indirect detection of the shape of a large number of sulfided slabs can be achieved. It has been observed by IR/CO that there are clearly two different CO adsorption bands located at ∼2,121 and ∼2065 cm−1 on WS2 edges. Coupled studies between experimental and theoretical results enabled to assign the ν(CO) bands at 2,121 and 2066 cm−1 to CO adsorption on M-edge and S-edge of WS2 phase, respectively. The molar attenuation coefficients for CO adsorbed on the two exposed edges were determined through a meticulous analysis of CO spectra. The average values of ƐCO/M-edge and ƐCO/S-edge are ƐCO/M-edge = 12 ± 2 μmol−1·cm and ƐCO/S-edge = 23 ± 6 μmol−1·cm. (Zavala-Sanchez et al., 2020a).
In this paper, we report the effect of citric acid (CA) used as a chelating agent and the effect of sulfidation temperature on the activity and structure of W supported catalysts. This work seeks to account for the favorable role of the citric acid at a molecular level. The objective of our research is to study WS2 morphology change of a large number of particles with sulfidation temperature. This, by providing experimental evidence of the morphology variation on an industrial based hydrotreatment catalyst such as WS2/Al2O3 catalyst. The formation of WS2 sites after catalyst sulfidation was in situ monitored by CO adsorption. The enhanced thiophene HDS activity on W catalysts prepared with CA is related to the improved amount of WS2 edge sites, as proved by CO adsorption followed by IR spectroscopy.
Experimental Section
Catalyst Preparation
W/Al2O3 sample catalysts analyzed in this work were prepared by the a single-pot method of pore volume impregnation in the presence or absence of citric acid (CA). First, the impregnation solutions were prepared with or without citric acid (CA, C6H8O7·H2O, PROLABO) and ammonium metatungstate ((NH4)6H2W12O40·xH2O Aldrich). Pretreated commercial γ-Al2O3 (Sasol, specific surface area of 252 m2g−1 and pore volume of 0.84 cm3g−1) was selected as catalyst support (sieved between 200 and 400 μm, precalcined in air at 723 K for 2 h). The W (CA/W = x) solutions (the pH was 0.01 for CA/W = 2) were added to the Al2O3, followed by strong stirring during 1 h and later matured for 2 h at room temperature. Finally, the catalysts were introduced in a rotatory furnace and dried at 383 K (3 K min−1) for 16 h. It is emphasized that these catalysts were not calcined prior to the sulfidation in order to keep the species formed during the impregnation step. All catalysts samples were prepared with a constant amount of W (20 wt. %W) content corresponding to 3.3 W atoms nm−2.
Thiophene Hydrodesulfurization Test
All the thiophene hydrodesulfurization (HDS) tests were performed in a differential glass reactor (diameter of 9 mm). It can be considered that the specific velocity corresponds to the initial velocity since the catalytic bed was very thin (mass of catalyst corresponds approximately to 50 mg without the use of a diluent agent). Catalysts were sulfided before the thiophene HDS test at different temperatures (573–773 K) with a heating ramp of 3 K min−1 at 0.1 MPa for 2 h under a 30 ml min−1 flow of 10% H2S/H2. Later, thiophene HDS test was carried through at 623 K and 0.1 MPa with an equivalent mass of 50 mg of sulfided catalyst. Thiophene (Alfa Aesar, 99%, extra pure) was introduced into the reactor by passing 70 ml min−1 of H2 flow through a saturator kept at 291 K and mixed with a flow of 20 ml min−1 of 10% H2S/H2 in order to maintain the steady state of the catalyst. The partial pressures of thiophene, H2, and H2S in the mixture were 8, 90.2, and 1.8 kPa, respectively. The HDS reaction outlet gas was analyzed with a Varian 3,900 chromatograph provided with a Varian Factor 4 (VF-1MS) capillary column (15 m, 0.25 mm, 0.25 µm) and a flame ionization (FID) detector. To maintain a differential reactor regime, the thiophene conversion was controlled to be less than 10%. Using the following formula, the reaction rate (rs) (mol h−1 kg−1) was calculated:
where x is the thiophene conversion (%), F is the molar flow rate of thiophene (mol h−1), and mcat is the mass of the catalyst after sulfidation, respectively. After the catalytic test, the spent catalysts were recovered to obtain their precise weight.
Low-Temperature CO Adsorption Followed by Infrared Spectroscopy (IR/CO)
All catalysts series were characterized in situ by low-temperature (∼100 K) CO adsorption followed by IR spectroscopy (IR/CO). The IRCO experimental method followed in this work has been the same as that has been described in previous work by our group. CO adsorption was carried out at low temperature to avoid as much as possible any reaction of the CO with the catalyst surface. The oxidic catalyst was pressed into a supported wafer (∼10 mg precisely weighted, for a disc of 2.01 cm2) and inserted into a quartz IR cell with CaF2 windows. Prior to adsorption experiments, the sample was in situ sulfided in the IR cell at environmental pressure (0.1 MPa). For this purpose, the catalyst was sulfided with a mixture of gases consisting of 10% H2S/H2 (30 ml min−1) at 673 K (the H2S/H2 flow introduced from room temperature) during 2 h, with a heating rate of 3 K min−1. After the sulfidation step, the cell was flushed with Ar in order to displace the remaining H2S and then proceed to evacuated down to p < 1 × 10⁻⁴ Pa until the catalyst reached room temperature. IR/CO at low temperature (100 K) was performed introducing calibrated CO pressures. These small amounts of CO were successively introduced into the IR cell and lastly an equilibrium pressure of 133 Pa of CO was maintained. After each CO introduction, FTIR spectra were recorded with 256 scans and a resolution of 4 cm−1 using a Nicolet Nexus FTIR spectrometer equipped with an MCT detector (FTIR = Fourier transform infrared; MCT = mercury−cadmium−tellurium). All spectra were normalized to a disk of 10 mg. The experiments were duplicated and the calculated experimental uncertainty is estimated to 5%. The bands of the adsorbed CO species were obtained by subtracting the reference spectrum (spectrum recorded after sulfidation and before CO introduction). For quantitative analysis, spectra corresponding to catalyst at full coverage in CO were decomposed using OMNIC program and pseudo-Voigt function. The center and full width at half height (FWHH) of each peak were allowed to vary in a small range (±3 cm−1). The molar attenuation coefficient of CO adsorbed on M-edge (εM-edge) and S-edge (εS-edge) were determined using the same IR cell by introducing small doses of CO onto the sulfided W/Al2O3 catalyst at liquid nitrogen temperature (100 K). These catalysts were prepared with different metal loadings and the full details can be found in previous work of this group. (Zavala-Sanchez et al., 2020a). The reported values for (εM-edge) and (εS-edge) are 11.9 ± 2.0 μmol−1 cm and 23.1 ± 6.0 μmol−1 cm, respectively.
Microscopy Observation by HRTEM and HR STEM-HAADF
For the microscopy study, the catalysts in oxidic state were first sulfided at 673 K (heating rate of 3 K min−1) at a pressure value of 0.1 MPa for 2 h under a 30 ml min−1 flow of 10% H2S/H2. later, to limit the detrimental exposure to air, the sulfided catalysts were unloaded in a glovebox under argon flow from the sulfidation reactor and poured into absolute ethanol. Few drops of the catalyst suspension were deposited on a copper grid (300-mesh) with holey carbon film. The images of sulfided catalysts shown in this work have been taken using a double corrected JEOL ARM 200F cold FEG microscope operated at 200 kV. As a first step, parameters as length and stacking degree of the sulfide slabs were determined by measuring around 265 slabs per sample from the HRTEM images. The image treatment was carried out with help of the commercial software GMS3 from GATAN (DIGITALMICROGRAPH). The average length (L̅) and the average stacking degree (N̅) were calculated according to the references (Zavala-Sanchez et al., 2019b; Zavala-Sanchez et al., 2020b). The nanostructure and morphology of the WS2 slabs were explored by high resolution scanning transmission electron microscopy (HR STEM) using a high angle annular dark field (HAADF) detector. All of the STEM images presented in this manuscript were acquired in HAADF mode. The images acquisition time was approximately 30 s with 1,024 pixels × 1,024 pixels resolution. During this image recording the stability of the particles was not affected, which means that the particles are sufficiently stable to the electron beam.
Results
Effect of the Addition of CA in the Hydrodesulfurization Catalytic Activity of the Sulfided W/Al2O3 Catalysts
The values of the catalytic activity in thiophene HDS reaction of sulfided W (CA/W = x)/Al2O3 catalysts are presented in Figure 1. The HDS rate is the lowest on sulfided W (CA/W = 0)/Al2O3 catalysts and increases with the addition of citric acid was observed. The highest HDS rate was obtained when the (CA/W = 2) ratio was used. This result is comparable to what was earlier reported for Mo system. (Chen et al., 2014c).
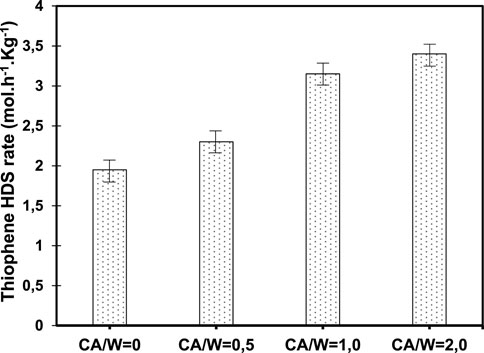
FIGURE 1. Thiophene HDS activity of W/Al2O3 catalysts (sulfided at 673 K) versus CA/W ratio.
When observing in detail the catalytic evolution over time (Figure 2), it can be appreciated that the sample prepared without CA showed a loss of catalytic activity over time. Later, when the ratio of citric acid (CA/W = 0.5) was increased, it seems to affect positively the catalytic stability and activity, but still appears to be insufficient to preserve a constant thiophene HDS rate. Nevertheless, when the CA ratio was increased to the values of (CA/W = 1) and (CA/W = 2), the catalysts exhibit a better stability in terms of catalytic activity.
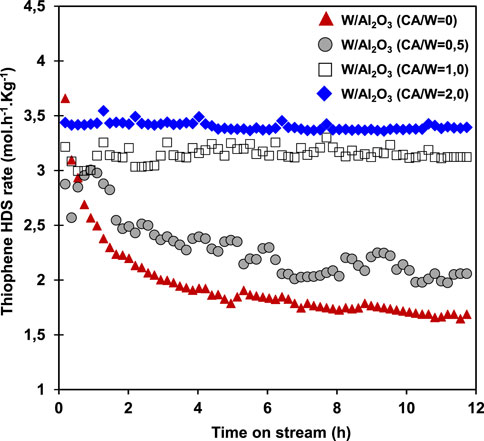
FIGURE 2. Variations of catalytic behavior according to CA content. Stability over time of the HDS rate of the W (CA/W = x)/Al2O3 series of catalysts.
Effect of the Sulfidation Temperature in the Activity of the Sulfided W/Al2O3 Catalysts
The W (CA/W = x)/Al2O3 catalysts, sulfided at different temperatures were tested in thiophene HDS reaction for (Figure 3). Overall, the lowest catalytic performance was observed after sulfidation at 573 K while the highest after sulfidation at 673 K. It is noticeable that an increase in the CA/W ratio raises the rate of reaction whatever the sulfidation temperatures. Once again, it is observed that there was some improvement when adding the (CA/W = 0.5), however, it is observed that the effect of increasing the catalytic activity is more noticeable in those catalysts prepared with citric acid in higher concentrations (CA/W = 1.0 and 2.0). Beyond increasing the sulfidation temperature, the effect of improved catalytic activity is triggered by the action of the CA as chelating agent. A low concentration of citric acid has an improving effect in the thiophene HDS rate, but since it does not provide adequate catalytic stability, this amount is insufficient to provide desired performance.
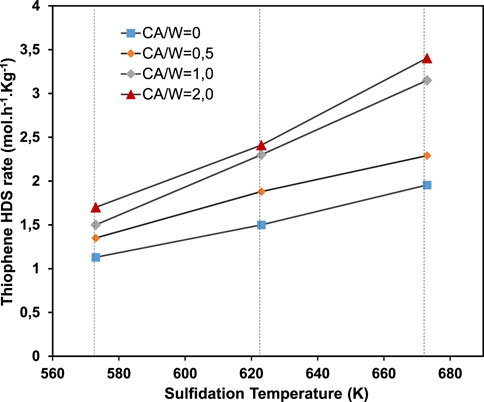
FIGURE 3. Thiophene HDS activity of W(CA/M = x)/Al2O3 catalysts versus the sulfidation temperature.
The Effect of Citric Acid Addition on the Morphology of WS2/Al2O3 Revealed by Infrared Spectra of CO Adsorption
Based on the evidence of the significant change in catalytic activity due to the addition of citric acid, the morphology of WS2 slabs was investigated in detail. For this, the series of catalysts W(CA/W = x)/Al2O3 were sulfurized in-situ at 673 K and analyzed by IR/CO. The IR spectra of CO adsorption (100 K, 133 Pa CO at equilibrium) on these catalysts are compared in Figure 4. Regardless of the amount of citric acid used in the impregnation stage, four υ(CO) bands located at 2,183, 2,160, 2,141, 2,121 and 2065 cm−1 were detected on these catalysts. These bands are attributed to CO adsorption on Lewis acid sites, OH groups of Al2O3 support, physisorbed CO, and M-edge and S-edge of WS2 phase, respectively. (Zavala-Sanchez et al., 2020a). Comparing the spectra of the catalysts prepared without CA and W(CA/W = 0.5)/Al2O3 catalyst, a shift to lower wavenumber of ∼3 cm−1 of the band attributed to CO adsorption on Lewis acid sites was recorded, meanwhile the rest of the bands remained in the same position with negligible variation. Conversely, some clear variations in the intensity of υ(CO) bands on WS2 phase were detected. In the W(CA/W = 0.5)/Al2O3 catalyst the 2,121 cm−1 band suffered a slight decrease in intensity meanwhile the one at 2065 cm−1 increased.
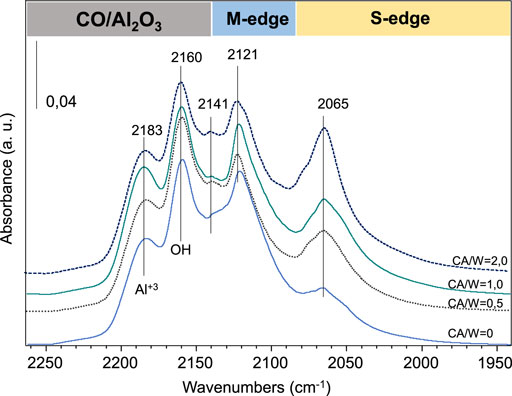
FIGURE 4. IR spectra of CO adsorption (100 K, 133 Pa at equilibrium) on W (CA/W = x)/Al2O3 catalysts sulfided with 10%H2S/H2 at 673 K and 0.1 MPa.
With the progressive addition of CA, the υ(CO) band intensity of S-edge (band ∼2065 cm−1) stepwise increased while that of M-edge (band ∼2,110 cm−1) is maintained practically the same with minimal variation. When using a CA ratio (CA/W = 2), the υ(CO) band intensity of the S-edge reached a maximum, with a comparable value to the one of the M-edge. These results are evidence that the addition of citric acid favors the growth of the S-edge on WS2 slabs in accordance with what was reported for MoS2. However, contrary to what was detected for MoS2, addition of citric acid does not decrease the M-edge contribution. The concentrations of M-edge and S-edge on this series of sulfide W(CA/W = x)/Al2O3 catalysts were calculated via spectral decomposition and are grouped in Figure 5. On sulfided W(CA/M = 0)/Al2O3 catalyst, about 75% of the total probed edges corresponded to M-edge. Similar behavior has been observed in MoS2 under typical HDS conditions, where predominantly M-edge (∼80%) formation is observed. (Schweiger et al., 2002; Chen et al., 2014c).
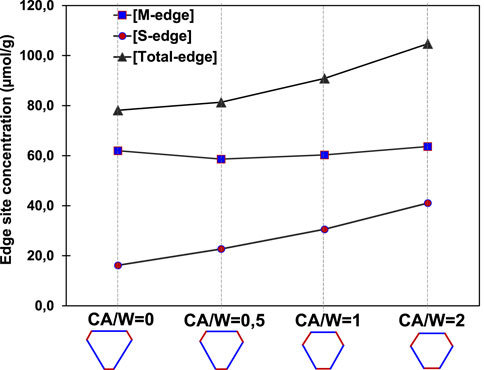
FIGURE 5. M-edge, S-edge and total edge sites concentrations determined from low temperature CO adsorption on sulfided W(CA/W = x)/Al2O3 catalysts. Below the graphic is presented the slab morphology according to the M-edge/S-edge ratio.
Upon the addition of citric acid, the S-edge concentration stepwise increased reaching almost double value when the CA/W ratio is equal to 2. Meanwhile, the M-edge concentration remained in a steady value with fluctuations of less than 6%. With the increase of S-edge, the total edge site (M-edge + S-edge) concentration raised, reaching a maximum with the W(CA/A = 2)/Al2O3 catalyst. The fact that the concentration of M-edge remains with little change and that the one the S-edge increases with addition of citric acid, suggests an improved formation of active sites and a better dispersion degree of the WS2 slabs, as previously reported on Mo catalysts.
Considering the global M-edge/S-edge ratio and detected by IR/CO, the schematic representation of the mean WS2 morphology in this series of catalyst was depicted in the lower part of Figure 5. The degree of truncation of WS2 slabs is greater with the addition of citric acid and therefore, the morphology of the WS2 slabs is progressively changed from a slightly truncated triangle with mostly M-edge to an almost perfect hexagon with both M-edge and S-edge. Both the change in dispersion degree and in morphology can be explained by a decreased interaction between the support and the active phase. First, considering what is known for MoS2, the interaction can be modeled by the linkages between M atoms and surface OH groups (M–O–Al). The amount of surface OH groups can be reduced through reaction with CA limiting the MS2–Al2O3 interaction during the MS2 phase formation. Moreover, formation of citrate complex with W could also modify the W-support interaction in similar way as was reported for Mo catalysts. (Chen et al., 2014a). The reduction of WS2–Al2O3 interaction leads to a modification of the relative free energy of M-edge and S-edge and as a consequence, modifies the WS2 morphology. In the specific case of W catalyst, the formation of W-CA complex could also have limited the formation of WSxOy oxides and thus increase the sulfidation degree of W.
Effect of CA Addition on the Morphology of WS2/Al2O3 Revealed by Electron Microscopy by HRTEM and STEM HAADF
The W(CA/W = 0)/Al2O3 and W(CA/W = 2)/Al2O3 catalysts were characterized by electron microscopy in HRTEM and in HR-STEM HAADF modes. The study aims to characterize the modification upon CA addition of sulfide phase morphology in terms of size, stacking and shape of the sulfide slabs. Figures 6A,B, shows HRTEM images of W(CA/W = 0)/Al2O3 and W(CA/W = 2)/Al2O3 catalysts. Analysis of ∼265 slabs was performed in order to get the distributions in length and stacking of the sulfide slabs. It should be mentioned that the local contrast of each zone of the HRTEM images was adjusted in order to observe slabs of about 1 nm. It can be concluded that the addition of citric acid leads to an appreciable decrease of the average slab length (2.7 ± 0.1 nm to 1.9 ± 0.1 nm). On the other hand, it was also detected a relevant variation in the average stacking number, passing from 2.60 ± 0.04 for W(CA/W = 0)/Al2O3 to 2.10 ± 0.05 for W(CA/W = 2)/Al2O3. This modification in stacking with CA addition was not observed in the case of Mo catalysts.
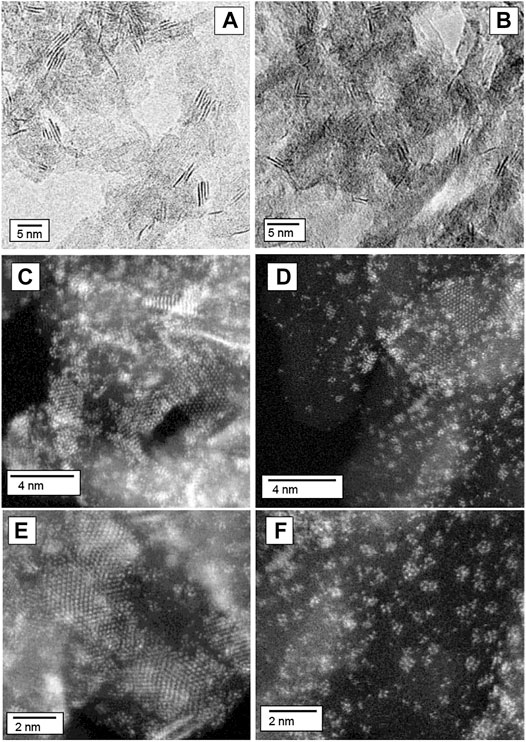
FIGURE 6. HR-TEM images of WS2 particles of W(CA/W = 0)/Al2O3 and W(CA/W = 2)/Al2O3 (A,B) and HR STEM-HAADF images of W(CA/W = 0)/Al2O3 (C,E) and W(CA/M = 2)/Al2O3 (D,F).
To analyze the morphology of the sulfided particles, STEM-HAADF analysis was carried out on the W catalysts prepared in absence (Figures 6C,E) or in presence of CA (Figures 6D,F)., The W(CA/W = 0)/Al2O3 sample consists of WS2 plates distributed all over the alumina support. In some regions of the images, higher contrast is observed, attributed to a metal density increase due to agglomerated or stacked slabs. Conversely, the particles observed in the W(CA/W = 2)/Al2O3 sample are characterized by their considerable small size in comparison with the case of W(CA/M = 0)/Al2O3. Furthermore, clusters of a few atoms and even single atoms are observed in all the studied domain. We have detected a similar phenomenon in MoS2/Al2O3 and CoMoS/Al2O3 prepared with CA as chelating agent. (Zavala-Sanchez et al., 2019b; Zavala-Sanchez et al., 2021). Such clusters and single atoms were also observed in the images of sulfided W(CA/W = 0)/Al2O3 sample but in much lesser extent.
Thus, both the HRTEM and HR STEM-HAADF modes demonstrated that addition of CA in the impregnation step significantly decreases the WS2 slab size. This is in accordance with the increase in edge site concentration upon CA addition determined by IR/CO.
Effect of Sulfidation Temperature on the Morphology of WS2/Al2O3 Revealed by Infrared Spectra of CO Adsorption
The W(CA/W = 0)/Al2O3 and W(CA/W = 1)/Al2O3 catalysts were in situ sulfided with 10% H2S/H2 at different temperatures (573, 623, and 673 K) and then characterized by IR/CO. The obtained IR spectra of CO adsorption (133 Pa at equilibrium, 100 K) are shown in Figure 7, for a catalyst prepared without CA and, in Figure 8 for a sample prepared with CA. When sulfiding the W(CA/W = 0)/Al2O3 and W(CA/W = 1)/Al2O3 catalysts at different temperatures, the υ(CO) bands described in the previous section are also observed with variations in intensity and some variations in position. Once again in both catalysts, a fairly strong υ(CO) band around 2,110 cm−1 (ascribed to CO at the M edge of the WS2 phase), an emergent shoulder located at ∼2066 cm−1 (ascribed to CO at the S edge of the WS2 phase), and two other bands located at ∼2,185 and ∼2,160 cm −1 (ascribed to CO on Al2O3 support). (Mueller et al., 1993; Travert et al., 2001; Travert et al., 2006; Chen et al., 2015a; Zavala-Sanchez et al., 2020a).
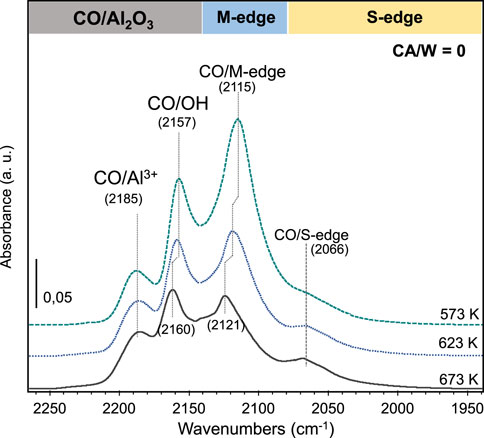
FIGURE 7. IR spectra of CO adsorbed (133 Pa at equilibrium, 100 K) on W/Al2O3 catalyst sulfided with 10% H2S/H2 at different temperatures.
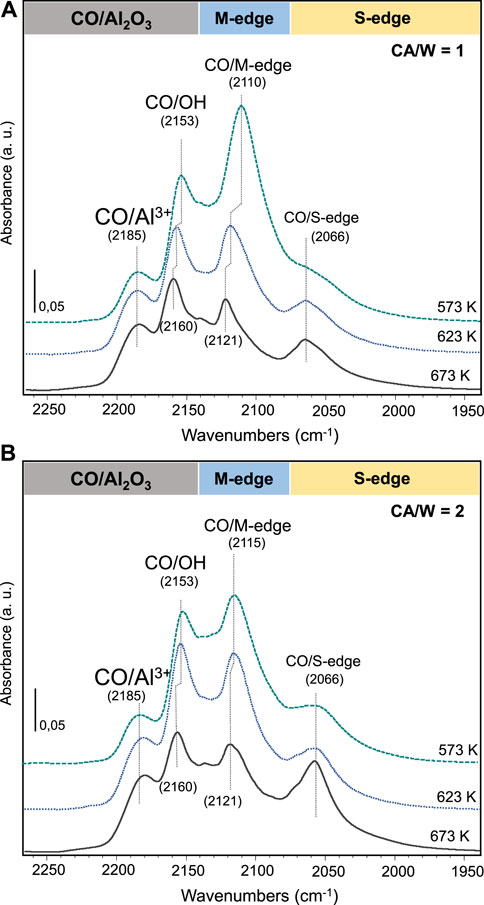
FIGURE 8. IR spectra of CO adsorbed (133 Pa at equilibrium, 100 K) on (A) W/Al2O3 CA = 1 and (B) W/Al2O3 CA = 2 catalyst sulfided with 10% H2S/H2 at different temperatures.
In both analyzed catalysts, two important aspects were detected with the increase in sulfidation temperature: 1) the υ(CO) bands corresponding to the OH and to M-edge suffered a progressive shift to higher wavenumbers, being this more noticeable for the υ(CO) of the M-edge (∼7 cm−1). The υ(CO) band position results from the effect of sigma donation from CO to TMS and Pi back-donation from TMS to CO. The sigma donation shifts the vibration frequency to higher wavenumbers, while the Pi back-donation shifts it to lower wavenumbers. (Hadjiivanov and Vayssilov, 2002). The shift to higher wavenumber of the υ(CO/M-edge) is thus indicative of a decrease of electron density on M-edge sites. 2) with increasing sulfidation temperature, the υ(CO/M edge) band stepwise decreases, while the υ(CO/S edge) band gains intensity.
This result is a strong indication of WS2 morphology change with sulfidation temperature on these two catalysts. Reviewing in more detail the spectra of W(CA = 1)/Al2O3 catalyst at different sulfidation T (Figure 8), first, it can be seen that the υ(CO) band on M-edge (∼2,110 cm−1) was once again detected with high intensity and similar width than the υ(CO) band observed for W(CA = 0)/Al2O3 catalyst. Meanwhile, the υ(CO) band on the S-edge (band at 2066 cm−1) appeared slightly more defined than the ill-defined shoulder of the W(CA = 0)/Al2O3 catalyst.
The obtained IR spectra at different sulfidation temperatures were further decomposed, and the calculated concentration of M-edge and S-edge sites as well as the M-edge/S-edge ratio are plotted versus the sulfidation temperature in Figure 9 for W(CA = 0)/Al2O3 and W(CA = 1)/Al2O3 catalysts. On both catalysts, 1) the concentration of M-edge detected by IR/CO catalyst decreases with increasing sulfidation temperature 2) the concentration of the M-edge is greater than that of the S-edge. 3) the concentration ratio of S-edge/M-edge is steadily increased with sulfidation temperature. Such effects are more pronounced for the W(CA = 1)/Al2O3 catalyst than on W(CA = 0)/Al2O3 catalyst. Therefore, the S-edge/M-edge ratio on the W(CA = 1)/Al2O3 is about twice than that on the W(CA = 0)/Al2O3 catalyst.
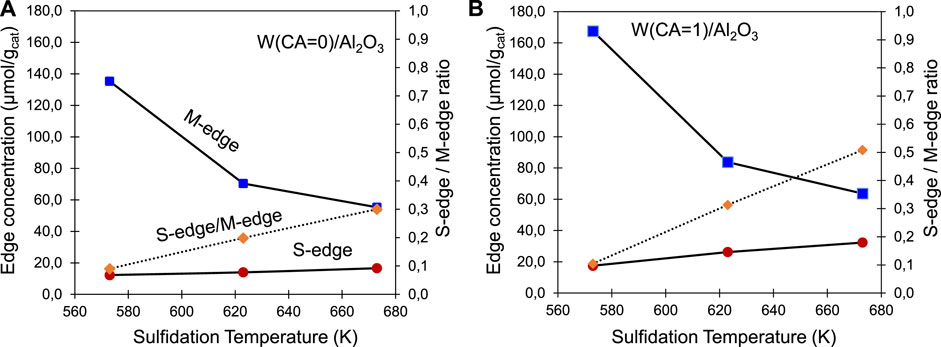
FIGURE 9. M-edge and S-edge site concentration detected by low-temperature CO adsorption (solid line) and the ratio of S-edge/M-edge (dashed line) on (A) W(CA = 0)/Al2O3 and (B) W(CA = 1)/Al2O3 catalyst sulfided at different temperatures.
Knowing that increased sulfidation temperature leads to the increase of slab length and stacking, (Chen et al., 2014b), the decrease in M-edge site concentration with increasing sulfidation temperature could be linked to the decrease in WS2 dispersion.
Structure-Activity Relationship for WS2/Al2O3
For the catalyst series prepared with increasing amount of CA, the increase in total edge site concentration (due to the increase in S-edge sites) corresponds well with the increase in thiophene HDS activity. However, for the series prepared varying the sulfidation temperature, the increase in HDS activity does not correspond to the decrease of the total edge site concentration. Thus, the global edge site concentration does not allow to explain the catalytic activity. One can note that with addition of CA or increase in sulfidation temperature, the S-edge site concentration is increased as well as the thiophen HDS activity. This would mean that the S-edge sites are more active than the M-edge sites and that they contribute more significantly to the HDS activity. Accordingly, for the series prepared with CA, intrinsic activity expressed as Turn Over Frequency (TOF) was calculated for each edge site considering that the global activity could be mathematically expressed by a simple relation such as:
Where
Conclusion
Low temperature CO adsorption followed by IR spectroscopy (IR/CO) was used to evidence the change in WS2 morphology with addition of a chelating agent and the increase in sulfidation temperature. In a classical HDS sulfidation temperature range (573–673 K), it was shown that on the W(CA/W = 0)/Al2O3 and W(CA/W = 1)/Al2O3 catalysts the concentration of M-edge decreases with increasing sulfidation temperature while that of S-edge increases leading to an increase of the S- edge/M-edge ratio. The IR/CO results also show that the ratio of the S- edge/M-edge increases even more dramatically with CA addition, revealing that the WS2 slab shape get closer to a perfect hexagon. Thus, it can be concluded that the WS2 morphology is more influenced by the WS2−Al2O3 interactions than by the sulfidation temperature. Addition of CA leads also to a global increase of the edge site concentration as shown by IR/CO. And this was confirmed by HR STEM-HAADF, which demonstrates that addition of CA in the impregnation step heavily reduces the size of WS2 nano-slabs.
The change in slab morphology allows to explain the increase in thiophene HDS activity observed after CA addition and sulfidation temperature increase. On the CA series, the TOF values for each edge could be calculated and it appears that the S-edge site is 70% more active than the M-edge sites in thiophene HDS reaction.
Data Availability Statement
The raw data supporting the conclusions of this article will be made available by the authors, without undue reservation.
Author Contributions
LZ-S: Investigation, Visualization, Writing-Original draft preparation, XP: Investigation, Methodology, Writing- Review, supervision, FM: Writing- Review, supervision, LO: Methodology, Writing-Review and Editing, Funding acquisition, supervision.
Funding
The authors are grateful for the METSA (Ref #2020B161) financial support.
Conflict of Interest
The authors declare that the research was conducted in the absence of any commercial or financial relationships that could be construed as a potential conflict of interest.
Publisher’s Note
All claims expressed in this article are solely those of the authors and do not necessarily represent those of their affiliated organizations, or those of the publisher, the editors and the reviewers. Any product that may be evaluated in this article, or claim that may be made by its manufacturer, is not guaranteed or endorsed by the publisher.
References
Al-Dalama, K., and Stanislaus, A. (2006). A Comparative Study of the Influence of Chelating Agents on the Hydrodesulfurization (HDS) Activity of Alumina and Silica−Alumina-Supported CoMo Catalysts. Energy Fuels 20, 1777–1783. doi:10.1021/ef060125a
Alphazan, T., Bonduelle-Skrzypczak, A., Legens, C., Gay, A.-S., Boudene, Z., Girleanu, M., et al. (2014). Highly Active Nonpromoted Hydrotreating Catalysts through the Controlled Growth of a Supported Hexagonal WS2 Phase. ACS Catal. 4 (12), 4320–4331. doi:10.1021/cs501311m
Alphazan, T., Bonduelle-Skrzypczak, A., Legens, C., Boudene, Z., Taleb, A.-L., Gay, A.-S., et al. (2016). Improved Promoter Effect in NiWS Catalysts through a Molecular Approach and an Optimized Ni Edge Decoration. J. Catal. 340, 60–65. doi:10.1016/j.jcat.2016.05.004
Cattaneo, R., Shido, T., and Prins, R. (1999). The Relationship between the Structure of NiMo/SiO2 Catalyst Precursors Prepared in the Presence of Chelating Ligands and the Hydrodesulfurization Activity of the Final Sulfided Catalysts. J. Catal. 185 (1), 199–212. doi:10.1006/jcat.1999.2492
Chen, J., Maugé, F., El Fallah, J., and Oliviero, L. (2014). IR Spectroscopy Evidence of MoS 2 Morphology Change by Citric Acid Addition on MoS 2/Al 2 O 3 Catalysts - A Step Forward to Differentiate the Reactivity of M-Edge and S-Edge. J. Catal. 320, 170–179. doi:10.1016/j.jcat.2014.10.005
Chen, J., Labruyere, V., Maugé, F., Quoineaud, A.-A., Hugon, A., and Oliviero, L. (2014). IR Spectroscopic Evidence for MoS2 Morphology Change with Sulfidation Temperature on MoS2/Al2O3 Catalyst. J. Phys. Chem. C 118 (51), 30039–30044. doi:10.1021/jp510470g
Chen, J., Maugé, F., El Fallah, J., and Oliviero, L. (2014). IR Spectroscopy Evidence of MoS 2 Morphology Change by Citric Acid Addition on MoS 2/Al 2 O 3 Catalysts - A Step Forward to Differentiate the Reactivity of M-Edge and S-Edge. J. Catal. 320 (320), 170–179. doi:10.1016/j.jcat.2014.10.005
Chen, J., Oliviero, L., Portier, X., and Maugé, F. (2015). On the Morphology of MoS2 Slabs on MoS2/Al2O3 Catalysts: the Influence of Mo Loading. RSC Adv. 5 (99), 81038–81044. doi:10.1039/C5RA14768A
Chen, J., Dominguez Garcia, E., Oliviero, L., and Maugé, F. (2015). How the CO Molar Extinction Coefficient Influences the Quantification of Active Sites from CO Adsorption Followed by IR Spectroscopy? A Case Study on MoS 2/Al 2 O 3 Catalysts Prepared with Citric Acid. J. Catal. 332, 77–82. doi:10.1016/j.jcat.2015.09.005
Chen, J., Mi, J., Li, K., Wang, X., Dominguez Garcia, E., Cao, Y., et al. (2017). Role of Citric Acid in Preparing Highly Active CoMo/Al2O3 Catalyst: From Aqueous Impregnation Solution to Active Site Formation. Ind. Eng. Chem. Res. 56, 14172–14181. doi:10.1021/acs.iecr.7b02877
Dominguez Garcia, E., Chen, J., Oliviero, E., Oliviero, L., and Maugé, F. (2020). New Insight into the Support Effect on HDS Catalysts: Evidence for the Role of Mo-Support Interaction on the MoS2 Slab Morphology. Appl. Catal. B: Environ. 260, 117975. doi:10.1016/j.apcatb.2019.117975
Füchtbauer, H. G., Tuxen, A. K., Moses, P. G., Topsøe, H., Besenbacher, F., and Lauritsen, J. V. (2013). Morphology and Atomic-Scale Structure of Single-Layer WS2 Nanoclusters. Phys. Chem. Chem. Phys. 15, 15971. doi:10.1039/c3cp51758f
Girleanu, M., Alphazan, T., Boudene, Z., Bonduelle-Skrzypczak, A., Legens, C., Gay, A.-S., et al. (2014). Magnifying the Morphology Change Induced by a Nickel Promoter in Tungsten(IV) Sulfide Industrial Hydrocracking Catalyst: A HAADF-STEM and DFT Study. ChemCatChem 6 (6), 1594–1598. doi:10.1002/cctc.201402115
Hadjiivanov, K. I., and Vayssilov, G. N. (2002). Characterization of Oxide Surfaces and Zeolites by Carbon Monoxide as an IR Probe Molecule. Adv. Catal. 47, 307–511. doi:10.1016/S0360-0564(02)47008-3
Jaramillo, T. F., Jørgensen, K. P., Bonde, J., Nielsen, J. H., Horch, S., and Chorkendorff, I. (2007). Identification of Active Edge Sites for Electrochemical H 2 Evolution from MoS 2 Nanocatalysts. Science 317 (5834), 100–102. doi:10.1126/science.1141483
Kabe, T., Akamatsu, K., Ishihara, A., Otsuki, S., Godo, M., Zhang, Q., et al. (1997). Deep Hydrodesulfurization of Light Gas Oil. 1. Kinetics and Mechanisms of Dibenzothiophene Hydrodesulfurization. Ind. Eng. Chem. Res. 36, 5146–5152. doi:10.1021/ie970297i
Lei, Z., Zhan, J., Tang, L., Zhang, Y., and Wang, Y. (2018). Recent Development of Metallic (1T) Phase of Molybdenum Disulfide for Energy Conversion and Storage. Adv. Energ. Mater. 8 (19), 1703482–1703529. doi:10.1002/aenm.201703482
Mueller, B., Van Langeveld, A. D., Moulijn, J. A., and Knoezinger, H. (1993). Characterization of Sulfided Molybdenum/alumina Catalysts by Temperature-Programmed Reduction and Low-Temperature Fourier Transform Infrared Spectroscopy of Adsorbed Carbon Monoxide. J. Phys. Chem. 97, 9028–9033. doi:10.1021/j100137a031
Okamoto, Y., Hioka, K., Arakawa, K., Fujikawa, T., Ebihara, T., and Kubota, T. (2009). Effect of Sulfidation Atmosphere on the Hydrodesulfurization Activity of SiO2-Supported Co-mo Sulfide Catalysts: Local Structure and Intrinsic Activity of the Active Sites. J. Catal. 268 (1), 49–59. doi:10.1016/j.jcat.2009.08.017
Santolalla-Vargas, C. E., Suárez Toriello, V. A., De los Reyes, J. A., Cromwell, D. K., Pawelec, B., and Fierro, J. L. G. (2015). Effects of pH and Chelating Agent on the NiWS Phase Formation in NiW/γ-Al2O3 HDS Catalysts. Mater. Chem. Phys. 166, 105–115. doi:10.1016/j.matchemphys.2015.09.033
Schweiger, H., Raybaud, P., Kresse, G., Toulhoat, H., and Toulhoat, H. (2002). Shape and Edge Sites Modifications of MoS2 Catalytic Nanoparticles Induced by Working Conditions: A Theoretical Study. J. Catal. 207, 76–87. doi:10.1006/jcat.2002.3508
Suárez-Toriello, V. A., Santolalla-Vargas, C. E., De Los Reyes, J. A., Vázquez-Zavala, A., Vrinat, M., and Geantet, C. (2015). Influence of the Solution PH in Impregnation with Citric Acid and Activity of Ni/W/Al2O3 Catalysts. J. Mol. Catal. A: Chem. 404-405, 36–46. doi:10.1016/j.molcata.2015.04.005
Travert, A., Dujardin, C., Maugé, F., Cristol, S., Paul, J. F., Payen, E., et al. (2001). Parallel between Infrared Characterisation and Ab Initio Calculations of CO Adsorption on Sulphided Mo Catalysts. Catal. Today 70, 255–269. doi:10.1016/s0920-5861(01)00422-9
Travert, A., Dujardin, C., Maugé, F., Veilly, E., Cristol, S., Paul, J.-F., et al. (2006). CO Adsorption on CoMo and NiMo Sulfide Catalysts: A Combined IR and DFT Study. J. Phys. Chem. B 110, 1261–1270. doi:10.1021/jp0536549
Walton, A. S., Lauritsen, J. V., Topsøe, H., and Besenbacher, F. (2013). MoS2 Nanoparticle Morphologies in Hydrodesulfurization Catalysis Studied by Scanning Tunneling Microscopy. J. Catal. 308, 306–318. doi:10.1016/j.jcat.2013.08.017
Xu, J., Zhang, J., Zhang, W., and Lee, C.-S. (2017). Interlayer Nanoarchitectonics of Two-Dimensional Transition-Metal Dichalcogenides Nanosheets for Energy Storage and Conversion Applications. Adv. Energ. Mater. 7, 1700571–1700630. doi:10.1002/aenm.201700571
Zavala-Sanchez, L., Khalil, I., Oliviero, L., and Paul, J. (2019a). Structural Sites Investigation and Quantification of WS2/Al2O3 Catalysts : Coupling between IR/CO and DFT Calculations for a Deep Insight into Edge Sites. Chem. Cat Chem. 12, 1–36. doi:10.1002/cctc.201902053
Zavala-Sanchez, L., Portier, X., Maugé, F., and Oliviero, L. (2019b). High-resolution STEM-HAADF Microscopy on a γ-Al2O3 Supported MoS2 Catalyst-Proof of the Changes in Dispersion and Morphology of the Slabs with the Addition of Citric Acid. Nanotechnology 31 (3), 035706. doi:10.1088/1361-6528/ab483c
Zavala-Sanchez, L., Khalil, I., Oliviero, L., Paul, J. F., and Maugé, F. (2020a). Structure and Quantification of Edge Sites of WS 2/Al 2 O 3 Catalysts Coupling IR/CO Spectroscopy and DFT Calculations. ChemCatChem 12 (7), 2066–2076. doi:10.1002/cctc.201902053
Zavala-Sanchez, L., Portier, X., Maugé, F., and Oliviero, L. (2020b). Promoter Location on NiW/Al2O3 Sulfide Catalysts: Parallel Study by IR/CO Spectroscopy and High-Resolution STEM-HAADF Microscopy. ACS Catal. 10 (11), 6568–6578. doi:10.1021/acscatal.0c01092
Zavala-Sanchez, L., Portier, X., Maugé, F., and Oliviero, L. (2021). Formation and Stability of CoMoS Nanoclusters by the Addition of Citric Acid: A Study by High Resolution STEM-HAADF Microscopy. Catal. Today 377, 127–134. doi:10.1016/j.cattod.2020.10.039
Keywords: citric acid, hydrotreating catalysts, WS2, CO adsorption, infrared (IR), hydrodesulfurization, quantification sites, turn over frequency (TOF)
Citation: Zavala-Sanchez LA, Maugé F, Portier X and Oliviero L (2022) Infrared Spectroscopic Evidence of WS2 Morphology Change With Citric Acid Addition and Sulfidation Temperature. Front. Chem. Eng. 3:792368. doi: 10.3389/fceng.2021.792368
Received: 10 October 2021; Accepted: 20 December 2021;
Published: 18 January 2022.
Edited by:
Jose Escobar, Mexican Institute of Petroleum, MexicoReviewed by:
Oleg Klimov, Boreskov Institute of Catalysis, RussiaAida Gutierrez-Alejandre, National Autonomous University of Mexico, Mexico
Copyright © 2022 Zavala-Sanchez, Maugé, Portier and Oliviero. This is an open-access article distributed under the terms of the Creative Commons Attribution License (CC BY). The use, distribution or reproduction in other forums is permitted, provided the original author(s) and the copyright owner(s) are credited and that the original publication in this journal is cited, in accordance with accepted academic practice. No use, distribution or reproduction is permitted which does not comply with these terms.
*Correspondence: Laetitia Oliviero, bGFldGl0aWEub2xpdmllcm9AZW5zaWNhZW4uZnI=
†ORCID: Laetitia Oliviero, orcid.org/0000-0002-7931-439X