 Johannes Tiefenthaler
 Marco Mazzotti*
- Separation Processes Laboratory, Intitute of Energy and Process Engineering, Department of Mechanical and Process Engineering, ETH Zurich, Zurich, Switzerland
In a climate neutral world, the life cycle greenhouse gas (GHG) emissions of precipitated calcium carbonate (PCC) have to be reduced towards net-zero. Mineral carbonation processes allow to do so by replacing the carbon rich calcium source limestone by carbon free industrial mineral wastes. Various processes have been investigated in literature. They exhibit the benefit of little to no feedstock related emissions and high energy savings due to the avoidance of the CaCO3 calcination step. However, the nature of the process changes significantly, which requires a fundamental understanding of the new mechanisms controlling the process of CO2 absorption and CaCO3 precipitation. Within this work, a CO2 rich gas is contacted with a calcium rich aqueous feed in a continuous reactive crystallizor. The CO2 selectively absorbs and precipitates as either vaterite or calcite. The effect of the liquid and gas feed flow rates, of the feed stoichiometric ratio and of the residence time on key performance indicators, such as the CO2 capture efficiency the CaCO3 precipitation efficiency and the features of the final product, is studied experimentally. As expected, these feed characteristics determine the effective stoichiometric ratio of reactants in the liquid phase,
1 Introduction
Today, the production of precipitated calcium carbonate (PCC), for use in products such as cleansing agents, paper or plastics, causes carbon dioxide emissions. Most of these emissions are inherent to the process, since the raw material limestone, CaCO3, is calcinated at about 1,000°C to decompose it into calcium oxide, CaO, and carbon dioxide, CO2. While CO2 from limestone, about two thirds of the total, together with that resulting from the combustion of the fuel needed for calcination, about one third (Anantharaman et al., 2017), is usually released to the atmosphere, CaO is then reacted with water in the lime slaking process to form calcium hydroxide, Ca(OH)2. Finally, a slurry of Ca(OH)2 in water is carbonated with CO2, in an amount exactly equal to that released during calcination, to form the final product, PCC. If the CO2 for carbonation were sourced from the calcination flue gas itself, that part of the direct emissions would be avoided. However, since conventional products utilizing PCC are incinerated at their end of life, this CO2 gets released again to the atmosphere (see the detailed life cycle analysis, LCA, presented in Mattila et al. (2014), and Mattila and Zevenhoven (2014a)). An option that has been proposed recently is the substitution of limestone as the calcium source with one that does not contain geogenic carbon. Such an approach would allow evolving the PCC production from a linear approach, to a circular approach that can reduce GHG emissions, save natural resources, and comply with the requirements that the future sustainable, carbon-neutral world prescribes.
There is plenty of literature about lab-scale processes, which utilize industrial mineral wastes to produce carbon neutral or even carbon negative PCC (see for a review (Sanna et al., 2014). Most promising approaches consist of indirect, two-step mineral carbonation processes. In step one, calcium is selectively extracted from an alkaline precursor material by a solvent. The residual of the precursor is removed by filtration. The filtrate, rich in calcium, is contacted with CO2 in a second step where the PCC precipitates from the solution. Compared to the conventional lime slurry carbonation process described above, such processes use additives that enhance the solubility of the Ca containing minerals but at the same time lead to major disadvantages, for the reasons detailed below.
A constant liquid phase composition is critical to the quality of PCC, since this yields a constant supersaturation level, hence a constant driving force for crystal nucleation and growth, i.e., the processes controlling final particle size, shape and morphology (see Gullichsen et al. (2000)), for how these three features determine when PCC fulfills the requirements for industrial and commercial applications).
Conventional carbonation processes are operated in the batch mode. A constant liquid phase composition, hence a constant supersaturation, is maintained thanks to the interplay between dissolution of Ca(OH)2 suspended in water and precipitation of PCC through reaction with the bubbling CO2. The aqueous solution is rich in calcium ions thanks to the relatively high solubility of Ca(OH)2 and in carbonate ions thanks to the speciation of CO2; they are consumed by the precipitation of CaCO3, which exhibits a very low solubility. The buffering effect just described lets the process operate at constant liquid phase composition until all Ca(OH)2 is consumed. Note that calcium carbonate can precipitate as the metastable polymorphs vaterite and aragonite, or as the stable polymorph calcite.
Two-step processes, which utilize industrial wastes as a calcium source, tend to operate at calcium feed concentrations in the precipitation step an order of magnitude higher than in the case described above. This is necessary to maximize the cyclic capacity of the process and it is achieved by introducing additives that increase the solubility of the calcium containing minerals present, e.g., Ca(OH)2, which is of high interest, since it is present in large amounts in the most abundant industrial mineral waste, i.e., demolition concrete. The consequence is that carbonation takes place in an aqueous solution rich in calcium ions, but without the buffering effect of suspended Ca(OH)2. Such batch processes undergo a change in liquid phase composition as the carbonation progresses, thus leading to poor particle properties. Literature reviews about current process routes and effects of synthesis conditions on the particle properties have been conducted by Chang et al. (2017b) and Jimoh et al. (2018).
In order to exploit the benefits of both approaches, i.e., constant supersaturation and high calcium loading, a continuous carbonation process may be implemented, which is the subject and the novelty of this work. The design of such a process requires a thorough understanding of the thermodynamics and the kinetics involved. In this paper, we explore the design space of a continuous carbonation process through an experimental study.
2 Experimental
2.1 Materials
The synthetic feed stock was prepared from ultrapure de-ionized water (Millipore, 18.2 M Ω cm), calcium hydroxide (Sigma-Aldrich, ≥ 96%) as calcium source and ammonium nitrate (Sigma-Aldrich, ≥ 99%). As CO2 source, synthetic gas mixtures (relative error ±1%) of 25 and 85% CO2 in N2 (Pangas AG, Switzerland) were used. The experiments were seeded with calcium carbonate seeds with a mean diameter of 27 μm. The seeds were synthetized in the lab and contained calcite, vaterite and aragonite phases.
2.2 Experimental Set-Up
A simplified flowsheet of the setup built for continuous calcium carbonate precipitation experiments is shown in Figure 1. An 850 ml, double walled glass, stirred (using a four bladed overhead stirrer, operated using a IKA, EUROSTAR, 40 digital electric engine, and rotated at 30–2000 RPM) crystallizer was used, which is thermostatted using a Huber CC 230 thermostat. To keep the reactor gas tight, the shaft of the stirrer was greased and inserted into a glass bearing sleeve (Möller AG), which was cooled with ice from the outside to maintain the viscous texture of the grease. A peristaltic pump (Watson-Marlow 502S) transferred the feed solution continuously from the storage tank into the reactor. The pump was calibrated a-priori and delivered flow rates of 10–50 g solution per minute. The suspension was discharged through periodically occurring pulses of 100–150 ml by means of a release valve installed at the bottom of the reactor. The suspension was transferred to a pressure filtration device (BHS Sonthofen, Taschenmessgerät PLF), where it was filtrated with compressed air at 6 bar. The particles were collected on paper filters (Macherey-Nagel, MN 625). The particle size was measured with a laser diffraction device (Sympatec, Helos BR). The particle morphology was determined by XRD (Bruker, D2 Phaser). Images of the particles were taken by SEM (Hitachi, S-4800). The mass of the filtrate and the dry mass of the particles were measured on a balance. The gas was fed into the reactor using a mass flow controller (F-201-CV, Bronkhorst High-Tech BV). A sparger (sintered metal, pores <10 μm), installed at the bottom of the reactor created very small gas bubbles which rose through the suspension towards the reactor’s gas overhead. A reflux condenser, connected to the cooling water circuit (cooling water temperature of about 15°C) reduced the water loss and dried the gas before it entered a gas mass flow meter (F-111-C, Bronkhorst High-Tech BV) and a mass spectrometer (ThermoStar GSD 301 C, Pfeiffer Vacuum Schweiz AG). The system pressure was kept at 1.25 bar using a back pressure regulator (LFO, Equilibar, United States), in combination with a pressure gauge. This slight overpressure facilitated the withdrawal of the suspension.
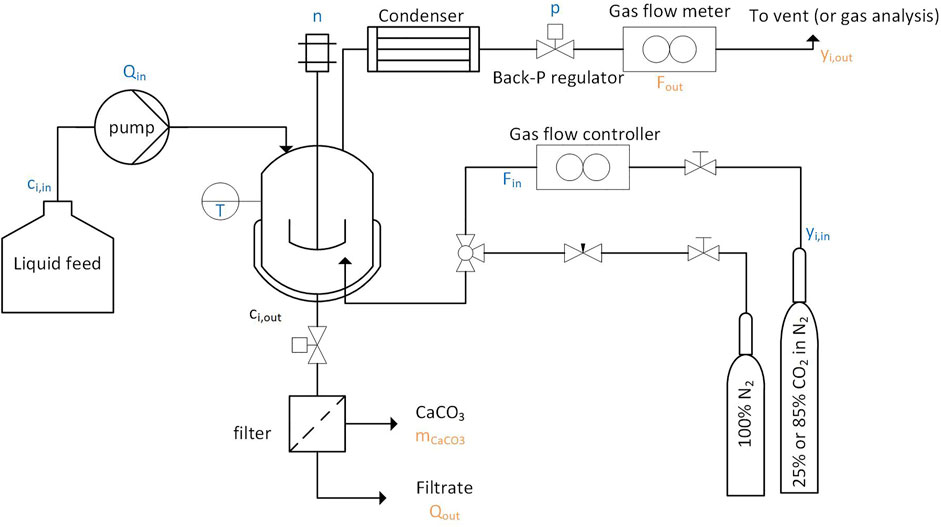
FIGURE 1. In the simplified flow sheet, the letters in blue specify the operating and feed conditions, while the organ letters specify the downstream data measured throughout the experiment.
2.3 Methods and Analytics
Prior to each experiment, the aqueous solutions with apparent calcium concentrations
At time zero, the peristaltic pump started feeding the feed solution at a rate
2.4 Experimental Planning
In the experimental campaign, the effect of varying feed conditions pertaining to both the gas and the liquid stream on the process outcome was investigated. Operating parameters are grouped in two categories, whereby the second consists of combined quantities that are called key operating parameters because of their importance.
2.4.1 Operating Parameters
The system’s operating conditions are determined by the temperature T, pressure P, gas inlet composition
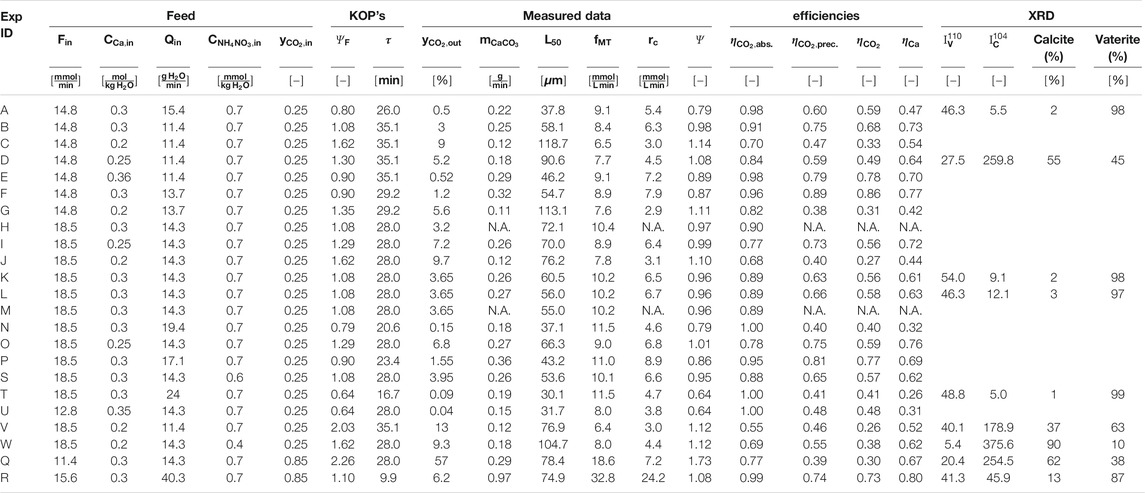
TABLE 1. The feed conditions, KOP as well as the downstream data and the process efficiencies are listed in the table below. All experiments listed were performed at 250 rpm, 25°C and a system pressure of 1.25 bars. Experiment m was conducted at a stirring rate of 350 rpm.
2.4.2 Key Operating Parameters
Calcium carbonate precipitates according to the following reaction:
thus the reactants participate in the reaction with a stoichiometric ratio of one-to-one. The stoichiometric ratio in the feed to the reactor,
While thermodynamics defines theoretical limits for crystal nucleation and growth, kinetics determines how close the system approaches such limits, as a function of the residence time
In the course of the experimental campaign, a wide range of operating conditions was screened in order to develop an understanding of how these influence the rate of CO2 absorption, the rate of CaCO3 crystal nucleation and growth, and the particles’ size and shape. To this aim, the values of
2.5 Raw Data Treatment
In this section, we describe how the measured raw data is converted into more useful process data, from which process performances are calculated.
2.5.1 Measurements
During the experiments, the gas outlet flow rate
2.5.2 Calculations
From the measured data, the volume specific CO2 absorption rate
Since the experiments are conducted with a binary CO2—N2 gas mixture, the exiting gas stream is assumed to be dry, and N2 is assumed to not absorb in the solution, hence the N2 material balance is:
Finally, the rate of CO2 absorption can be calculated from (Eqs 2-4, 2-5) as:
The volume specific rate of PCC precipitation
2.5.3. Process Efficiencies
The CO2 absorption efficiency
The product of the feed stoichiometry
The efficiency of the precipitation of CO2 from the aqueous solution,
Finally, the CO2 mineralization efficiency of the process with respect to CO2,
whilst the overall efficiency of the process with respect to calcium,
Note that
These key performance indicators (KPIs) will be used to make a comparative assessment of the continuous precipitation process and of the effect of the operating conditions.
3 Results
We have conducted the twenty-three experiments listed in Table 1 according to the procedure described below. Afterwards, we analyze and discuss reproducibility first, then the effect of the operating parameters on
3.1 Phenomenology of Experiments
Figure 2 illustrates the transient and steady state behavior observed during three typical continuous precipitation experiments. Initially, the reactor is filled with a calcium ion rich solution in which CaCO3 seed crystals are suspended, which is put in contact with a gas stream consisting of carbon dioxide and nitrogen, 25/75 v/v, and with a liquid stream. Part of the gas is not absorbed, and leaves the crystallizer with a flow rate and a CO2 mole fraction that are plotted as function of time in Figures 2A,B. The difference between the CO2 feed mole fraction, i.e., 0.25, and the values plotted indicates that CO2 is indeed absorbed preferentially. Steady state is reached after between 30 and 60 min, while the gas phase goes from an initial CO2 concentration of 0.5%, to about 4% (standard deviation 0.13%) (Figure 2B). Due to the fact that the liquid feed is continuous while the liquid outlet flow is pulsating, a cyclic steady state with period of 8 min is attained, as it can be observed both in the gas outlet flow rate (Figure 2A) and in the outlet CO2 concentration (Figure 2B). Based on its definition (Eq. 2-6), the volume specific CO2 absorption rate decreases when both the gas outlet flow rate and CO2 concentration increase, as observed in Figures 2A,B and Figure 2B in the first 30 min of the experiment. This is a consequence of the fact that the initial solution is CO2 free and calcium rich. The final steady state conditions, particulary the steady state gas outlet flow rate and the CO2 concentration in the gas and in the solution, correspond to those where the CO2 absorption rate and the calcium carbonate precipitation balance each other.
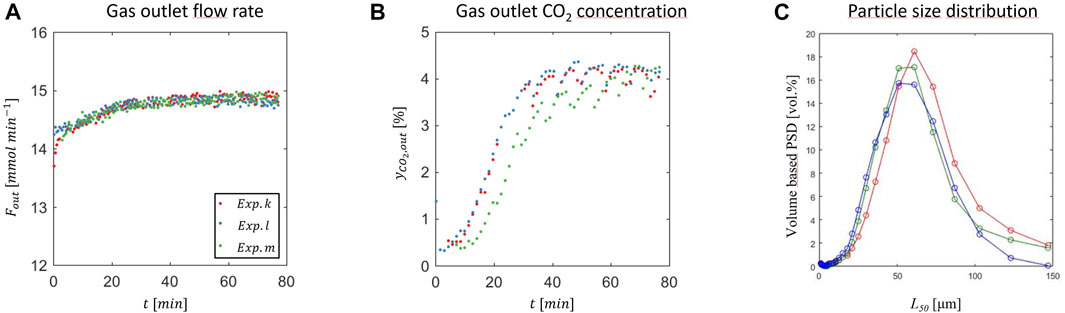
FIGURE 2. Precipitation of CaCO3 at 25°C, 25% CO2 in N2, 1.25 bar,
When it absorbs, CO2 speciates into bicarbonate and carbonate ions, thus generating supersaturation with respect to the formation of calcium carbonate in a solution that contains calcium ions in different forms. The mechanism of formation of PCC is still highly debated, though certainly complex and multi-step in nature, i.e., going through formation of amorphous calcium carbonate first that transforms then into a crystalline form. Which polymorph forms, either vaterite, aragonite or calcite (in increasing order of stability at ambient conditions) also depends on other factors beyond the absorption of CO2 (Plummer and Busenberg 1982; Declet et al., 2016, Chang et al., 2017a). After precipitation, crystals are collected by filtration, dried in an oven, and characterized. Figure 2C shows the volume based particle size distributions in terms of particle diameter. In this case, most of the particles are in the range from 10 to 120 μm, with an average particle size of 57 μm (standard deviation 2.6 μm). Moreover, the precipitation rate in the presented experiments is 0.26 g per minute with a standard deviation of 0.0005 g per minute. This paper focuses on the steady state behavior of the carbonation reactor—therefore the transient phase will not be shown for any further experiments.
3.2 Dynamic and Steady-State Reproducibility
Experiments k and l correspond to two repetitions of the same experiment; as shown in Figures 2, 3, process parameters, both during the transient and at steady state, and product crystals’s properties, including the fact that they consist of agglomerates of spherical vaterite, are reproducible.
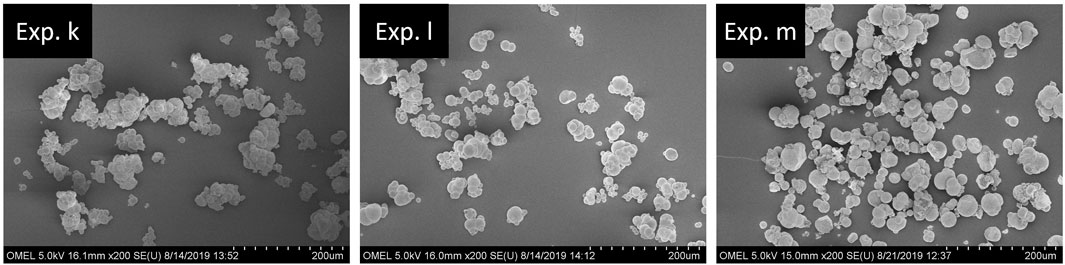
FIGURE 3. SEM images of the particles collected from reproducibility experiments are shown.
A third one, namely experiment m, has been carried at identical conditions except for the ammonium nitrate concentration,
3.3 Effect of the Inlet Operating Conditions
Figure 4 illustrates the effect of changing the features of the two inlet streams on the process outcome, in terms of rate of CO2 absorbed, i.e., evaluated through the value of the CO2 outlet concentration in the gas phase leaving the reactor,
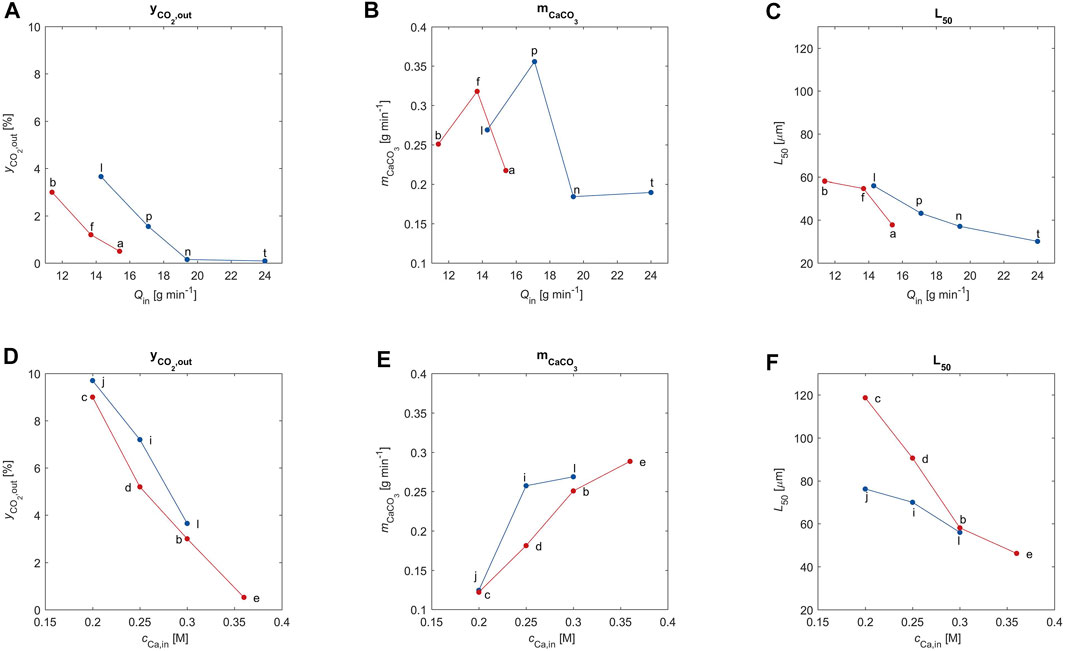
FIGURE 4. The CO2 outlet concentration, the CaCO3 outlet flow rate and the volume weighted average particle size are plotted as a function of the liquid feed rate (subplot A–C) and as a function of the calcium feed concentration (subplot D–F). The letters correspond to the experimental ID of the data point according to Table 1.
Figures 4A,D clearly show that indeed the outlet CO2 concentration decreases to almost zero when the alkalinity of the solution increases; the CO2, which is missing with respect to that in the feed, has been absorbed (see the column labeled
When it is due to an increase in calcium concentration in the feed, the increase in alkalinity causes an increase in amount of PCC formed (Figure 4E). However, increasing the liquid feed flow rate,
The average crystal size decreases monotonically with increasing alkalinity, as observed in Figures 4C,F. This is a combined effect of the reduced residence time for increasing values of
Finally, the effect of the inlet gas flow rate (red: 14.8 mmol min−1; blue: 18.5 mmol min−1) illustrated by the six plots of Figure 4 is less remarkable than that of the properties of the liquid stream, possibly also because all these experiments have been carried out with the same gas composition.
3.4 Effect of the Key Operating Parameters
The effect of the relative quantity
3.4.1 Role of the Stoichiometric Ratio in the Feed
In the precipitation reactor utilized in this study, the two reactants are fed in the liquid and in the gas phase, while the reaction leading to the precipitation of calcium carbonate takes place only in the solution. Such precipitation depends on the composition in solution, which in turn is affected by how much carbon dioxide is absorbed rather than by how much of it is fed to the reactor.
Such important feature of the continuous process studied here is illustrated in Figure 5A, where the CO2 absorption efficiency,
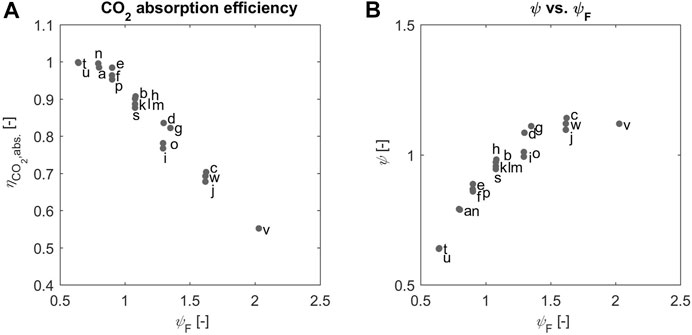
FIGURE 5. (A) The absorption efficiency and (B) the effective ratio of reactants is plotted over
Such considerations can be translated into the value of the effective stoichiometric ratio in solution, which is calculated from
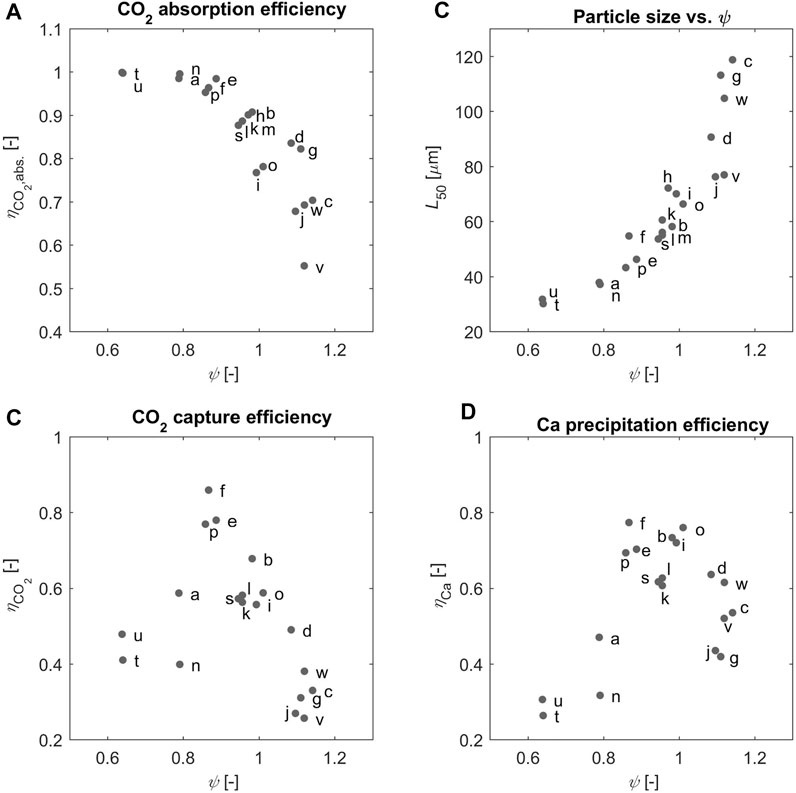
FIGURE 6. (A) The absorption efficiency (B) the
We believe that the experimental evidence about the KPIs of the process must be analyzed in light of the value of the effective stoichiometric ratio, which reflects the ratio of the amounts of the reactants that are present at the location of the reaction of interest. Accordingly, we expect that the region where both
3.4.2 Role of the Effective Stoichiometric Ratio in Solution
Using the effective stoichiometric ratio of the reactants in solution,
The role of
Moreover, the average product particle size,
Among which are additives (reference), pH (reference), temperature (reference) CO2 partial pressure (reference.
Finally, the composition of the solution, and particularly the ratio
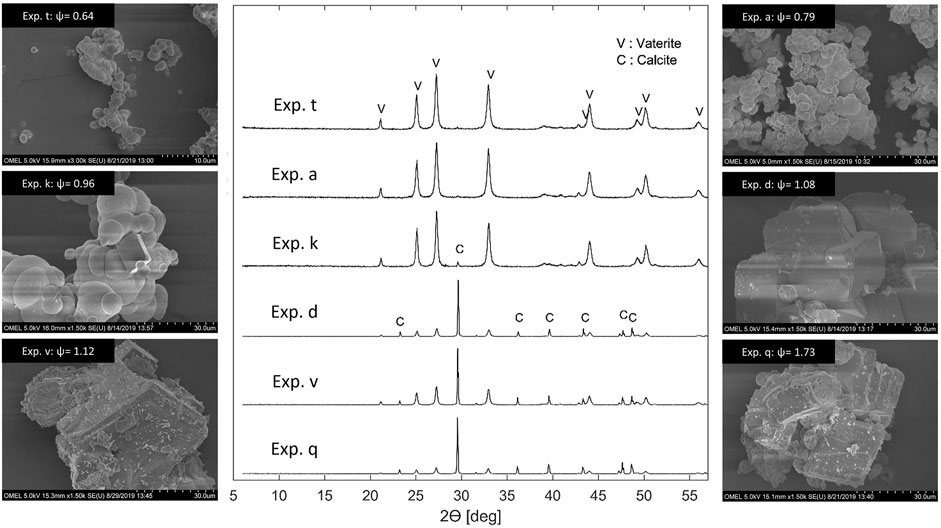
FIGURE 7. Selected XRD patterns and SEM images of precipitation experiments are plotted as a function of
Both XRD patterns and SEM microphotographs give a strong indication that vaterite forms at low
Note that a continuous carbonation experiment reported in the literature (Mattila and Zevenhoven 2014b) confirmed the trend illustrated in Figure 7. They operated their continuous precipitation reactor with an aqueous NH4Cl solvent at an
3.4.3 Role of the CO2 Partial Pressure
The experiments r and q have been conducted at elevated CO2 partial pressure. Despite the limited data available, a few observations have been made. First, it is estonishing that at
4 Concluding Remarks
In this work, we have operated a continuous crystallizer for the precipitation of calcium carbonate obtained via reaction of carbon dioxide, fed through an inlet gas stream and absorbed thereafter by the reacting solution, with calcium hydroxide, fed via an inlet solution. An experimental campaign has been performed, whereby crystallization has been conducted at constant temperature and pressure, but varying gas composition, and – most importantly – gas and liquid feed rate, and composition. The continuous reactive crystallization process has been operated successfully, and its operating conditions could be tuned so as to empirically optimize the key performance parameters of the process.
We have observed that—as expected—the absorption of CO2 from the inlet gas stream to the solution plays a critical role, because it is the concentration of CO2 in solution, and not just in the gas, that—together with calcium concentration hence pH—controls the conditions at which precipitation occurs. The key operating parameter here is—at constant inlet gas composition—the effective stoichiometric ratio of reactants in solution. Through the extensive experimental campaign it was possible to demonstrate that high levels of CO2 capture efficiency and of calcium precipitation efficiency can be obtained. Interestingly such high levels occur at the conditions when the effective stoichiometric ratio in solution is close to one.
It was also possible to show that such ratio also controls the key features characterizing the product crystals. More specifically, on the one hand it was observed that at values of such parameter below 1, calcium carbonate precipitates as high purity vaterite (>97%) , whereas a mix of vaterite and calcite crystals is collected at values above one. The latter one accounts for 13% up to 90% in mass. On the other hand, the final average particle size increases strongly with the effective stoichiometric ratio in solution, though what we could measure was the size of the agglomerates rather than that of the primary particles. These observations are in line with the literature (Jung et al., 2000), though literature data refer generally to rather different processes and contexts.
The experimental measurements reported here represent very encouraging results. These will be followed by a simulation-based study of the same process, which will provide the basis for its model-based optimization aimed at exploring its application potential.
Data Availability Statement
The original contributions presented in the study are included in the article/Supplementary Material, further inquiries can be directed to the corresponding author.
Author Contributions
JT was responsible for the content and the writing of the publication. MM was involved in many detailed discussions about the content of the manuscript, reviewing and editing it.
Funding
This research was partially funded by the Swiss Competence Centre for Energy Research—Efficiency Industrial Processes and partially by ETH Zurich.
Conflict of Interest
JT, student in the Separation Processes Laboratory at ETH Zurich and Co-founder, member of the board and shareholder of the ETH-Spinoff neustark, which aims at scaling up and commercializing the presented technology. MM: Professor of the Separation Processes Laboratory at ETH Zurich and member of the advisory board of the ETH-Spinoff Neustark.
Publisher’s Note
All claims expressed in this article are solely those of the authors and do not necessarily represent those of their affiliated organizations, or those of the publisher, the editors, and the reviewers. Any product that may be evaluated in this article, or claim that may be made by its manufacturer, is not guaranteed or endorsed by the publisher.
Acknowledgments
We would like to acknowledge Daniel Trottmann for building the experimental setup, Markus Huber for the support with the analytics and Nazgol Razzaghi for a (not published) preliminary experimental study. Moreover, we would like to thank Yago Nel Vila Gracia for his contribution to the experimental campaign.
References
Anantharaman, R., David, B., Giovann, C., Lena, D., Manuele, G., Helmut, H., et al. (2017). CEMCAP Framework for Comparative Techno-Economic Analysis of CO2 Capture from Cement Plants. Energ. Proced. 114, 6175–6180. doi:10.1016/j.egypro.2017.03.1755
Chang, R., Choi, D., Kim, M. H., and Park, Y. (2017a). Tuning crystal Polymorphisms and Structural Investigation of Precipitated Calcium Carbonates for CO2 Mineralization. ACS Sustain. Chem. Eng. 5 (2), 1659–1667. doi:10.1021/acssuschemeng.6b02411
Chang, R., Kim, S., Lee, S., Choi, S., Kim, M., and Park, Y. (2017b). Calcium Carbonate Precipitation for CO2 Storage and Utilization: a Review of the Carbonate Crystallization and Polymorphism. Front. Energ. Res. 5, 17. doi:10.3389/fenrg.2017.00017
Declet, A., Reyes, E., and Suárez, O. (2016). Calcium Carbonate Precipitation: a Review of the Carbonate Crystallization Process and Applications in Bioinspired Composites. Rev. Adv. Mater. Sci. 44 (1), 87–107.
Feng, B., Yong, A. K., and An, H. (2007). Effect of Various Factors on the Particle Size of Calcium Carbonate Formed in a Precipitation Process. Mater. Sci. Eng. A 445-446, 170–179. doi:10.1016/j.msea.2006.09.010
Gullichsen, J., Paulapuro, H., and Lehtinen, E. (2000). Papermaking Science and Technology, Book 11: Pigment Coating and Surface Sizing of Paper. Jyväskylä: Fapet Oy.
Han, Y. S., Hadiko, G., Fuji, M., and Takahashi, M. (2005). Effect of Flow Rate and CO2 Content on the Phase and Morphology of CaCO3 Prepared by Bubbling Method. J. Cryst. Growth 276 (3-4), 541–548. doi:10.1016/j.jcrysgro.2004.11.408
Han, Y. S., Hadiko, G., Fuji, M., and Takahashi, M. (2006). Factors Affecting the Phase and Morphology of CaCO3 Prepared by a Bubbling Method. J. Eur. Ceram. Soc. 26 (4-5), 843–847. doi:10.1016/j.jeurceramsoc.2005.07.050
Hostomsky, J., and Jones, A. G. (1991). Calcium Carbonate Crystallization, Agglomeration and Form during Continuous Precipitation from Solution. J. Phys. D: Appl. Phys. 24 (2), 165–170. doi:10.1088/0022-3727/24/2/012
Jimoh, O. A., Ariffin, K. S., Hussin, H. B., and Temitope, A. E. (2018). Synthesis of Precipitated Calcium Carbonate: a Review. Carbonates Evaporites 33 (2), 331–346. doi:10.1007/s13146-017-0341-x
Jung, W.-M., Hoon Kang, S., Kim, K.-S., Kim, W.-S., and Kyun Choi, C. (2010). Precipitation of Calcium Carbonate Particles by Gas-Liquid Reaction: Morphology and Size Distribution of Particles in Couette-Taylor and Stirred Tank Reactors. J. Cryst. Growth 312 (22), 3331–3339. doi:10.1016/j.jcrysgro.2010.08.026
Jung, W. M., Kang, S. H., Kim, W.-S., and Choi, C. K. (2000). Particle Morphology of Calcium Carbonate Precipitated by Gas-Liquid Reaction in a Couette-Taylor Reactor. Chem. Eng. Sci. 55 (4), 733–747. doi:10.1016/s0009-2509(99)00395-4
Kontoyannis, C. G., and Vagenas, N. V. (2000). Calcium Carbonate Phase Analysis Using XRD and FT-Raman Spectroscopy. Analyst 125 (2), 251–255. doi:10.1039/a908609i
Mattila, H.-P., Hudd, H., and Zevenhoven, R. (2014). Cradle-to-gate Life Cycle Assessment of Precipitated Calcium Carbonate Production from Steel Converter Slag. J. Clean. Prod. 84, 611–618. doi:10.1016/j.jclepro.2014.05.064
Mattila, H.-P., and Zevenhoven, R. (2014b). Design of a Continuous Process Setup for Precipitated Calcium Carbonate Production from Steel Converter Slag. ChemSusChem 7 (3), 903–913. doi:10.1002/cssc.201300516
Mattila, H.-P., and Zevenhoven, R. (2014a). “Production of Precipitated Calcium Carbonate from Steel Converter Slag and Other Calcium-Containing Industrial Wastes and Residues,” in Advances in Inorganic Chemistry (Turku, Finland: Elsevier), 66, 347–384. doi:10.1016/b978-0-12-420221-4.00010-x
Nehrke, G., Reichart, G. J., Van Cappellen, P., Meile, C., and Bijma, J. (2007). Dependence of Calcite Growth Rate and Sr Partitioning on Solution Stoichiometry: Non-kossel crystal Growth. Geochimica et Cosmochimica Acta 71 (9), 2240–2249. doi:10.1016/j.gca.2007.02.002
Plummer, L. N., and Busenberg, E. (1982). The Solubilities of Calcite, Aragonite and Vaterite in CO2-H2O Solutions between 0 and 90°C, and an Evaluation of the Aqueous Model for the System CaCO3-CO2-H2O. Geochimica et cosmochimica acta 46 (6), 1011–1040. doi:10.1016/0016-7037(82)90056-4
Ramakrishna, C., Thenepalli, T., Huh, J.-H., and Ahn, J. W. (2016). Precipitated Calcium Carbonate Synthesis by Simultaneous Injection to Produce Nano Whisker Aragonite. J. Korean Ceram. Soc. 53 (2), 222–226. doi:10.4191/kcers.2016.53.2.222
Sanna, A., Uibu, M., Caramanna, G., Kuusik, R., and Maroto-Valer, M. M. (2014). A Review of mineral Carbonation Technologies to Sequester CO2. Chem. Soc. Rev. 43 (23), 8049–8080. doi:10.1039/c4cs00035h
Verdoes, D., Kashchiev, D., and Van Rosmalen, G. (1992). Determination of Nucleation and Growth Rates from Induction Times in Seeded and Unseeded Precipitation of Calcium Carbonate. J. Cryst. Growth 118 (3-4), 401–413. doi:10.1016/0022-0248(92)90089-2
Wolthers, M., Nehrke, G., Gustafsson, J. P., and Van Cappellen, P. (2012). Calcite Growth Kinetics: Modeling the Effect of Solution Stoichiometry. Geochimica et Cosmochimica Acta 77, 121–134. doi:10.1016/j.gca.2011.11.003
Glossary
P Total pressure (bar)
T Temperature of aqueous solution (°C)
t Time (min)
τ Residence time of the aqueous solution (min)
Keywords: CO2 mineralization, continuous CaCO3 precipitation, reactive crystallization, CO2 capture, CO2 absorption, aqueous ammonia
Citation: Tiefenthaler J and Mazzotti M (2022) Experimental Investigation of a Continuous Reactor for CO2 Capture and CaCO3 Precipitation. Front. Chem. Eng. 4:830284. doi: 10.3389/fceng.2022.830284
Received: 06 December 2021; Accepted: 13 January 2022;
Published: 10 February 2022.
Edited by:
Heqing Jiang, Qingdao Institute of Bioenergy and Bioprocess Technology (CAS), ChinaReviewed by:
Donata Konopacka-Lyskawa, Gdansk University of Technology, PolandMahmut Altiner, Çukurova University, Turkey
Copyright © 2022 Tiefenthaler and Mazzotti. This is an open-access article distributed under the terms of the Creative Commons Attribution License (CC BY). The use, distribution or reproduction in other forums is permitted, provided the original author(s) and the copyright owner(s) are credited and that the original publication in this journal is cited, in accordance with accepted academic practice. No use, distribution or reproduction is permitted which does not comply with these terms.
*Correspondence: Marco Mazzotti, bWFyY28ubWF6em90dGlAaXBlLm1hdnQuZXRoei5jaA==