 Laura García-Calvo1*
 Divyata Vilas Rane1Nikalet Everson1Sigurd Tømmerberg Humlebrekk1Lise Femanger Mathiassen1Astfrid Helene Morka Mæhlum1
 Jostein Malmo2
 Per Bruheim1
- 1Department of Biotechnology and Food Science, NTNU Norwegian University of Science and Technology, Trondheim, Norway
- 2Vectron Biosolutions AS, Trondheim, Norway
The Gram-negative bacterium Escherichia coli is the most widely used host for recombinant protein production, both as an industrial expression platform and as a model system at laboratory scale. The recombinant protein production industry generates proteins with direct applications as biopharmaceuticals and in technological processes central to a plethora of fields. Despite the increasing economic significance of recombinant protein production, and the importance of E. coli as an expression platform and model organism, only few studies have focused on the central carbon metabolic landscape of E. coli during high-level recombinant protein production. In the present work, we applied four targeted CapIC- and LC-MS/MS methods, covering over 60 metabolites, to perform an in-depth metabolite profiling of the effects of high-level recombinant protein production in strains derived from E. coli BL21, carrying XylS/Pm vectors with different characteristics. The mass-spectrometric central carbon metabolite profiling was complemented with the study of growth kinetics and protein production in batch bioreactors. Our work shows the robustness in E. coli central carbon metabolism when introducing increased plasmid copy number, as well as the greater importance of induction of recombinant protein production as a metabolic challenge, especially when strong promoters are used.
1 Introduction
Recombinant DNA technology is one of the pillars that have supported the progress of Biotechnology during the past 50 years. Recombinant structural proteins and enzymes have direct applications as biopharmaceuticals (hormones, cytokines, growth factors, antibodies, etc.) and in technological processes that are central to industrial fields such as food and feed, detergents, textile, paper, waste management, organic synthesis and biofuels (Kirk et al., 2002; Overton, 2014; Puetz and Wurm, 2019). The production of recombinant proteins is an expanding industry with increasing economic significance. Reports have estimated that the value for the global enzymes market in 2021 exceeded $6 billion, and a steady growth projection is forecast for the following years, at a compound annual growth rate of 6.3%–6.8% between 2019 and 2027 (Sutay Kocabas and Grumet, 2019; BlueWeave Consulting and Research Pvt Ltd, 2021; de la Fuente et al., 2021; Espina et al., 2021; Mesbah, 2022). Concerning biopharmaceuticals, as of 2018, more than 300 protein-based drugs had been approved in Europe and United States, and almost a third of all pharmaceuticals in development were protein-based (Walsh, 2018). The market of protein-based biopharmaceuticals has only continued to grow, with numerous new drugs being approved each year (Martins et al., 2022), and global sales reaching $90.53 billion in 2020 (Sanchez-Trasviña et al., 2021).
Obtaining these highly profitable recombinant protein-based products requires an expression platform. The range of available hosts for recombinant protein production (RPP) is extensive, including eukaryotic organisms, such as filamentous fungi, yeast, mammalian cell lines, transgenic plants, transgenic animals and insect cells, as well as prokaryotic hosts (Tripathi and Shrivastava, 2019). Among the latter, Escherichia coli is to this date the most widely used host for RPP (Terpe, 2006; Kaur et al., 2018; Lozano Terol et al., 2021). This Gram-negative, facultative anaerobic bacterium presents characteristics that render it an advantageous RPP expression platform. E. coli has unparalleled fast growth kinetics, rapid gene expression, it is relatively easy to cultivate using inexpensive substrates, it has the potential to achieve high product yields, and it can be easily genetically modified, thanks to the variety of well-established molecular tools available to edit its genome (Baneyx, 1999; Terpe, 2006; Waegeman and Soetaert, 2011; Overton, 2014; Rosano and Ceccarelli, 2014; Kaur et al., 2018). E. coli can be used in combination with different promoter/regulator systems to achieve high RPP yields. One such system is composed of the Pm promoter and its cognate regulator gene xylS, which originates from the Pseudonomas putida TOL plasmid pWW0, and plays a role in the regulation of an operon that encodes enzymes for the degradation of aromatic hydrocarbons (Worsey and Williams, 1975). Expression vectors containing the XylS/Pm system can be easily induced with inexpensive benzoic acid derivatives, in a dose-dependent manner, which allows tight control of the expression of recombinant genes. The XylS/Pm system has been used in combination with the minimal replication elements oriV and trfA from the naturally occurring RK2 plasmid, to originate vectors that are functional in different expression hosts. The plasmid copy number (PCN) can be selected by utilizing trfA genes with specific point mutations. Moreover, the XylS/Pm expression system has been further improved in the last decades to allow for tightly controlled RPP in E. coli (Gawin et al., 2017).
Although E. coli remains one of the most prominent RPP hosts, it presents shortcomings that negatively impact product yields. High-level RPP may affect the stability of E. coli’s nucleic acid and impair processes such as transcription, translation, protein folding and protein translocation (Silva et al., 2012; Overton, 2014; Singha et al., 2017). Contrary to most small molecule biosynthesis, with one or few building blocks, protein biosynthesis draws carbon and energy resources from the entire central carbon metabolism, that is, the highly conserved network of interconnected pathways that permit the catabolism of sugars to obtain biosynthetic precursors in practically every known living organism. The metabolic burden imposed on E. coli by the maintenance of a foreign plasmid and the expression of heterologous genes can inhibit growth, affect the morphological phenotype, induce stress responses, as well as lead to metabolic alterations that affect the viability of the cell and severely reduce protein yields (Glick, 1995; Jeong and Lee, 2003; Hoffmann and Rinas, 2004; Haddadin and Harcum, 2005; Ow et al., 2006; Silva et al., 2012; Lozano Terol et al., 2021).
E. coli has been a major model system in microbiology for decades, and a plethora of works have investigated the genomic, transcriptomic, proteomic and metabolomic landscape of this bacterium (Han and Lee, 2006; Sevastsyanovich et al., 2010; Guo et al., 2012; Jeong et al., 2015; Kim et al., 2017; Li et al., 2017; Kim et al., 2018). ECMDB, a dedicated database for E. coli metabolomic data, is established (Guo et al., 2012), but the datasets included in ECMDB are not on the preferred RPP strain BL21, and study objectives are centered on growth. Thus, despite its importance as a host, surprisingly few studies focus on the metabolic burden consequences of high-level RPP in E. coli from a metabolomics point of view (Weber et al., 2002; Wittmann et al., 2007; Silva et al., 2012; Mairhofer et al., 2013; Muhamadali et al., 2016; Chae et al., 2017). This knowledge gap about the wider picture of the metabolic burden associated to RPP, together with the need to obtain a product rapidly, determines that the RPP industry often adopts a “trial-and-error” strategy to optimize RPP in E. coli, an approach that demands intensive use of time, manpower and equipment (Sevastsyanovich et al., 2010). The metabolic burden of RPP on E. coli has been insufficiently studied, and further work is needed in order to understand and engineer the mechanisms governing these drawbacks.
In the present work, we applied a deep phenotyping approach by means of advanced quantitative CapIC- and LC-MS/MS workflows (Kvitvang et al., 2014; Stafsnes et al., 2018; Røst et al., 2020a; Røst et al., 2020b) to perform the first in-depth characterization of the metabolic burden imposed on central carbon metabolism pathways when a classical RPP strain, E. coli BL21, is submitted to different levels of RPP, in genetically engineered E. coli BL21 strains harboring different PCN and promoter strengths.
2 Materials and methods
2.1 Microorganisms and cultivation conditions
E. coli BL21 (fhuA2 [lon] ompT gal [dcm] ΔhsdS; New England Biolabs, Irving, MA, United States) was used as a recombinant production host. The RPP strains studied in the present work were obtained by transforming BL21 competent E. coli cells (C2530H, New England Biolabs, Ipswich, MA, United States) with different versions of the pVB expression vector, provided by Vectron Biosolutions AS (Trondheim, Norway). To construct the pVB expression vectors, the mCherry sequence was gene synthesized (Genscript, Piscataway, NJ, United States) and inserted between NdeI-XhoI sites in the pVB expression plasmids. The characteristics of each pVB plasmid and the resulting strains are detailed in Table 1. In strains harboring pVB plasmids, selection pressure was maintained by supplementing the media with ampicillin (100 μg mL-1; A0839.0100, Panreac AppliChem, Darmstadt, Germany). Bacterial strains were stored in 16% (v/v) glycerol (24387.292, VWR, Radnor, PA, United States), at −80°C.
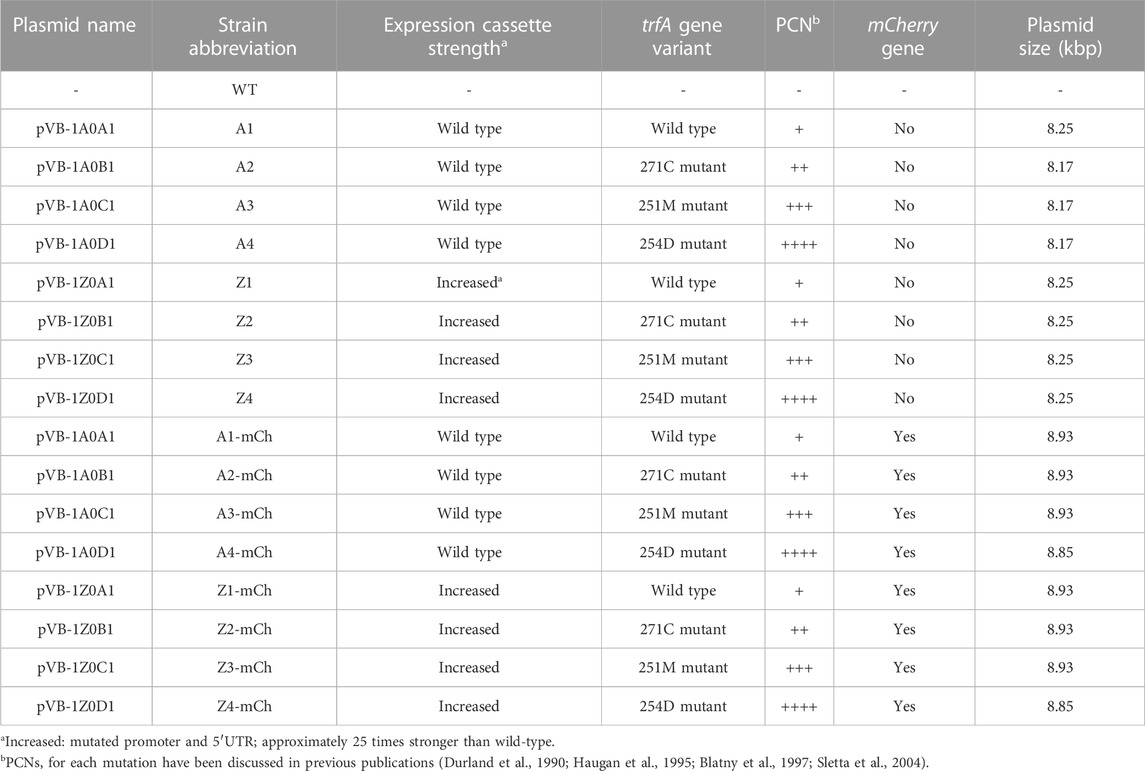
TABLE 1. Expression vector name, resulting strain abbreviation, expression cassette strength, regulator gene trfA variant, plasmid copy number (PCN), presence/absence of the mCherry gene and plasmid size of the bacterial strains used in the present work. All strains derive from the Escherichia coli BL21 wild-type (WT) strain. Plasmids were provided by Vectron Biosolutions AS.
For initial screenings, bacterial strains were cultured in a small scale microbioreactor (BioLector Pro, m2p-labs, Aachen, Germany), monitored and controlled by BioLection 3.18 software. Precultures were prepared by adding 100 μL of bacterial glycerol stock to 10 mL defined mineral Hi medium in 125 mL baffled shake flasks (2543-00125, Bellco Glass, Vineland, NJ, United States), and incubated overnight (30°C, 200 rpm, 16 ± 1 h). Hi medium is a modification of the HiYe medium (Sletta et al., 2007), formulated to remove complex ingredients, and is composed as follows: 8.6 g L-1 Na2HPO4.2H2O (30435, Honeywell Fluka, Charlotte, NC, United States), 3 g L-1 KH2PO4 (P5655, Sigma-Aldrich, Saint-Louis, MO, United States), 1 g L-1 NH4Cl (A9434, Sigma-Aldrich), 0.5 g L-1 NaCl (27810.295, VWR), 0.62 g L-1 MgSO4.7H2O (M5921, Sigma-Aldrich), 0.06 g L-1 Fe(III) citrate hydrate (F3388, Sigma-Aldrich), 0.003 g L-1 H3BO3 (B6768, Sigma-Aldrich), 0.015 g L-1 MnCl2.4 H2O (M5005, Sigma-Aldrich), 0.0084 g L-1 EDTA·2H2O (E6635, Sigma-Aldrich), 0.0015 g L-1 CuCl2.2H2O (C3279, Sigma-Aldrich), 0.0025 g L-1 Na2Mo4O4.2H2O (M1651, Sigma-Aldrich), 0.0025 g L-1 CoCl2.6H2O (C8661, Sigma-Aldrich), 0.008 g L-1 Zn(CH3COO)2·2H2O (379786, Sigma-Aldrich) and 20 g L-1 glucose (101176K, VWR) in Milli-Q (MQ; 18.2 MΩ cm)-H2O. Microbioreactor cultivations were carried out in FlowerPlate 48-well flower-shaped microtiter plates (m2p-labs), covered by a disposable gas-permeable adhesive membrane with evaporation reducing layer (F-GPR48-10, m2p-labs), containing 800 µL Hi medium per well. Microbioreactor cultures were initiated by inoculating from overnight precultures for a starting optical density at 600 nm (OD600) of 0.1 in each well. Biomass (gain 6), fluorescence (gain 10), dissolved oxygen (DO; %) and pH were recorded every 10 min. Plates were incubated at 30°C, 1,400 rpm and 85% humidity until Biomass reached 30 arbitrary units (approximately 0.7 g CDW L-1); at Biomass 30, temperature was reduced to 25°C and 1 mM m-toluate was added to induce expression from the XylS/Pm system. Three independent replicates were cultured per strain. Calibration curves for Biomass (gain 6) values against g CDW L-1 were prepared by fast filtering a volume containing an equivalent amount of biomass (5 OD600 units) at different growth densities, through hydrated Durapore hydrophilic PVDF 0.45 µm pore size membrane disc filters with a diameter of 47 mm (HVLP04700, Merck), coupled to a filtration manifold (X516-1,038, VWR) with a magnetic filter funnel (516-7597, VWR). Vacuum was controlled by a vacuum pressure controlling unit (CVC3000 and VSK3000, Vacuubrand, Wertheim, Germany) connected to a vacuum pump (ME 4R NT, Vacuubrand). After fast filtration, filters containing cell samples for CDW were rinsed with 10 mL of MQ-H2O at 30°C and transferred to pre-weighed aluminum pans (611-1,376, VWR) that were subsequently dried at 110°C until constant weight. CDW values for the different Biomass (gain 6) measurements were obtained by interpolation from the mentioned calibration curve.
Selected strains were grown at a larger scale in benchtop stirred tank bioreactors. Two consecutive precultures were used. Firstly, 125 μL glycerol stock were added to 250 mL baffled shake flasks (2543-00250, Bellco Glass) containing 50 mL rich LB medium, prepared dissolving 10 g L-1 tryptone (T9410, Sigma-Aldrich), 5 g L-1 NaCl (27810.295, VWR) and 5 g L-1 yeast extract (92144, Sigma-Aldrich) in MQ-H2O. Primary precultures were incubated for 8 h at 30°C and 200 rpm. Then, 300 μL primary preculture were added to 500 mL baffled shake flasks (2543-00500, Bellco Glass) containing 100 mL Hi medium. Secondary precultures were incubated at 30°C and 200 rpm for 12 ± 1 h, until late exponential growth phase. Bioreactor cultivations were started at OD600 = 0.1, by adding a corresponding volume of secondary preculture to 0.9 L defined mineral Hi-F medium, composed as follows: 16 g L-1 KH2PO4 (P5655, Sigma-Aldrich), 4 g L-1 (NH4)2HPO4 (101207.0500, Merck, Darmstadt, Germany), citric acid monosodium salt (447690010, Acros Organics, Geel, Belgium), 1.5 g L-1 MgSO4.7H2O (M5921, Sigma-Aldrich), 0.075 g L-1 Fe(III) citrate hydrate (F3388, Sigma-Aldrich), 0.0038 g L-1 H3BO3 (B6768, Sigma-Aldrich), 0.0188 g L-1 MnCl2.4 H2O (M5005, Sigma-Aldrich), 0.0105 g L-1 EDTA·2H2O (E6635, Sigma-Aldrich), 0.0019 g L-1 CuCl2.2H2O (C3279, Sigma-Aldrich), 0.0031 g L-1 Na2Mo4O4.2H2O (M1651, Sigma-Aldrich), 0.0031 g L-1 CoCl2.6H2O (C8661, Sigma-Aldrich), 0.01 g L-1 Zn(CH3COO)2·2H2O (379786, Sigma-Aldrich) and 20 g L-1 glucose (101176K, VWR) in MQ-H2O. Batch bioreactor cultivations were performed in stirred glass tank autoclavable benchtop bioreactors (1 L, Applikon Biotechnology, Delft, Netherlands) controlled by my-Control units (Z310210011, Applikon Biotechnology), and equipped with AppliSens pH+ sensors (Z001023551, Applikon Biotechnology) and AppliSens Low Drift DO2-sensors (Z010023525, Applikon Biotechnology). The pH was kept at 7.00 by automatically pumping 4 M NH4OH (30501, Sigma-Aldrich). Temperature was maintained at 30°C until OD600 = 2.5, when cultures were induced with 1 mM m-toluate. Immediately after induction with m-toluate, the temperature in the bioreactor was lowered to 25°C. Aeration was controlled by sparging 600 mL min-1 of sterile-filtered air into the bioreactors and adjusting stirring from 200 to 800 rpm to ensure levels of DO above 40%. Monitoring and logging of online cultivation data was carried out in BioXpert® 2 (Applikon Biotechnology). Cell growth was recorded regularly through spectrophotometric measurements of OD600. CDW values for the different OD600 measurements were obtained by interpolation from calibration curves for OD600 against g CDW L-1, prepared by fast filtering, as detailed above for the Biolector Pro cultivations. For online monitoring of recombinant protein production during benchtop scale bioreactor cultivations, mCherry fluorescence was evaluated in technical triplicates in a Spark 20M microplate reader (Tecan, Männedorf, Switzerland), with bottom reading at gain 66, excitation wavelength 560 nm, and emission wavelength 635 nm. mCherry concentration values were obtained by interpolation from a calibration curve prepared in triplicates from commercial pure mCherry (ABIN412973, antibodies-online GmbH, Aachen, Germany), measured in the Spark 20M Microplate reader with the parameters indicated above.
2.2 Quantification of extracellular products and substrates
Air flow, percentage (v/v) of O2 (m/z 32) and CO2 (m/z 44) in the exhaust gas were measured continuously by a Prima BT Bench Top Process Mass Spectrometer (ThermoFisher Scientific, Waltham, MA, United States). Samples for exometabolite analyses were collected from exponentially growing batch benchtop stirred tank bioreactor cultivations, in at least triplicates. Cultivation broth samples were centrifuged (8,000 rcf, 5 min, 4°C) to separate spent media and cells. Supernatants were subsequently transferred to clean microtubes, snap frozen in liquid nitrogen (LN2) and stored at −80°C. Before analysis, samples were filtered through 13 mm syringe filters with a 0.2 μm pore size PTFE membrane (514-0068, VWR). D-glucose and excreted organic acids were measured using high-performance liquid chromatography (HPLC), by means of an Alliance HPLC (Waters, Millford, MA, United States of America) with a refractive index (RI) and a UV/Vis detector, and a Hi-Plex H 300 × 7.7 mm column (PL1170-6830, Agilent Technologies, Santa Clara, CA, United States), as described elsewhere (Kumar et al., 2021). Concentrations were calculated by interpolation from a standard curve prepared with commercial standards: D-glucose (101176K, VWR), acetic acid (1.00063.1011, Supelco, Bellefonte, PA, United States), lactic acid (L1500, Sigma-Aldrich) and succinic acid (S3674, Sigma-Aldrich).
2.3 Targeted mass spectrometric metabolic profiling of intracellular metabolites
2.3.1 Quantification of organic acids, amino acids, and phosphorylated metabolites
For the analysis of organic acids, amino acids and phosphorylated metabolites, exponentially growing cells were sampled by fast filtration, according to a protocol based on (Kvitvang and Bruheim, 2015), with the modifications detailed in (Thorfinnsdottir et al., 2023). A volume corresponding to 5 units of OD600 was collected through a bioreactor sampling port and immediately fast filtered at a vacuum pressure 800 mbar below the ambient pressure. Cells were harvested on hydrated Durapore hydrophilic PVDF 0.45 µm pore size membrane disc filters with a diameter of 47 mm (HVLP04700, Merck), as indicated in Section 2.1 of Material and Methods. Harvested cells were rinsed with 10 mL MQ-H2O at the same temperature as the corresponding cultivation (30 or 25°C). Filters were then submerged in centrifuge tubes containing MQ-H2O: ACN (83640.320, VWR): methanol (1.06035.2500, Merck) (5:3:2, v/v) at −20°C, for rapid quenching of metabolic reactions. Quenched samples were immediately snap frozen in LN2 and stored at −80°C until further processing. Metabolites were extracted from quenched samples by thawing and incubating for 30 min at −20°C in a low temperature circulating bath filled with ethanol, with mixing by vortexing for 20 s every 10 min. Then, filters were carefully discarded, and the extracts were centrifuged (4,500 x g, −9°C, 10 min) to separate cell debris. Metabolites were concentrated by lyophilization (0.05 mbar, −105°C) in a SP VirTis BenchTop Pro (SP Scientific, Warminster, PA, United States of America) and reconstitution in 0.5 mL cold MQ-H2O. To clear greater residual cell debris, reconstituted metabolite extracts were centrifuged (4,500 x g, 4°C, 5 min) and then spin filtered through 10 kDa cutoff spin filters (20,800 x g, 4°C, 10 min; 516-0230P, VWR).
Cleared cell extracts were further processed for the spectrometric quantification of intracellular amino acids, organic acids, and phosphorylated metabolites, by means of two targeted LC- and one capillary ion chromatography (CapIC) hyphenated MS/MS methods, respectively. Sample processing, derivatization (for organic acids and amino acids) and analytical protocols were carried out as detailed elsewhere (Kvitvang et al., 2014; Stafsnes et al., 2018; Røst et al., 2020a). Interpolation from calibration curves elaborated with analytical grade standards (Santa-Cruz Biotechnology, Dallas, Texas, United States of America; Sigma-Aldrich) calculated by least-squares regression with 1/x weighting, and isotope dilution, were used to obtain absolute endometabolite quantifications.
2.3.2 Quantification of intracellular pyridine nucleotides
For analysis of intracellular pyridine nucleotides, a volume of cultivation broth equivalent to 5 units of OD600 was harvested from bioreactors at exponential growth phase, in triplicates. Harvested cultivation broth was pelleted by centrifugation at 4,500 x g (5 and 15 mL centrifuge tubes) or 8,000 x g (1.5 and 2.2 mL microtubes), at 4°C, for 5 min. The supernatant collected for analysis of extracellular metabolites, and the cell pellet was immediately snap frozen in LN2 and stored at −80°C until further sample processing. Frozen cell pellets were submitted to metabolite extraction and quantification by LC-MS/MS, as detailed in (Røst et al., 2020b).
2.4 Data Processing, Statistical Analysis, and Visualization
Cultivation data from Biolector Pro and benchtop bioreactor cultivations were plotted using Matplotlib v3.3.4 (Hunter, 2007). The specific growth rate, μ (h-1), was calculated during exponential growth phase, as the slope of a semi-logarithmic plot of biomass concentration or OD600 versus time. Specific rates (specific glucose uptake rate, qs, g g-1 CDW h-1; specific CO2 production rate, pCO2, mmol g-1 CDW h-1; and specific mCherry production rate, qmCh, mg g-1 CDW h-1) were calculated during exponential growth phase by dividing the volumetric rate by the mean biomass between two time points. mCherry yield per substrate consumption (YmCh/s, mg g-1) was calculated by dividing biomass or mCherry produced by the amount of glucose consumed between two time points. % Carbon recovery was calculated on a mmol/L basis, assuming 27.3 g/mol as molecular weight for the biomass, from the biomass formula CH1.8O0.5N0.2 and 10% estimated ashes (Doran, 2013); the flows considered for the mass balance equation were glucose as substrate, and biomass, CO2, mCherry, acetic acid, lactic acid and succinic acid as products, consumed or produced between two time points.
Endometabolome data processing was performed as described in (Røst et al., 2020a), with modifications. Mass spectrometric data were inspected and processed in the TargetLynx application manager of the MassLynx 4.1 software (Waters). Absolute quantification of endometabolites was obtained interpolating from calibration curves elaborated with analytical grade standards (Santa-Cruz Biotechnology, Dallas, Texas, United States; Sigma-Aldrich) calculated by least-squares regression with 1/x weighting, and isotope dilution was used as a correction strategy. Measured concentrations in metabolite extracts obtained from the LC-MS/MS and CapIC-MS/MS analyses were corrected for the dilution and concentration steps taking place during sample processing. Corrected concentrations were normalized to CDW (g L-1), obtained from cultivation samples harvested at each sampling point in similar conditions, following the fast filtration protocol detailed in Section 2.1 of Material and Methods. Two-tailed Dixon’s Q tests with a 95% confidence interval were used to identify and reject potential outliers in the sub-sample sets (Dean and Dixon, 1951). The data were further visualized and submitted to statistical analysis using MetaboAnalyst 5.0 (Pang et al., 2021). Prior to PCA and two-tailed T-tests assuming equal variances (Adjusted p-value (FDR) = 0.05), data was autoscaled (mean-centered and divided by the square root of the standard deviation of each variable). Log 2 fold changes of average metabolite absolute concentrations were visualized into central carbon metabolic pathways using the Omix editor and modeling tool for metabolic network diagrams (Droste et al., 2011).
The adenylate energy charge (EC) was calculated from absolute metabolite concentrations with the formula (ATP +1/2 ADP)/(AMP + ADP + ATP) (Atkinson and Walton, 1967).
3 Results and discussion
The aim of this study was to carry out an in-depth investigation of the metabolic burden on central carbon metabolism caused by high-level RPP. To do so, a total of sixteen genetically engineered E. coli BL21 strains harboring different promoter strengths and PCN were submitted to an initial small-scale screening in a microbioreactor. Subsequently, a selection of five strains was scaled up to benchtop cultivations in bioreactor, to further confirm the microbioreactor findings and perform a thorough metabolic study focused on central carbon metabolism.
3.1 Effect of RPP on growth kinetics and cultivation parameters
3.1.1 Strain screening in microbioreactor: Greater differences are due to PCN and RPP-Induction
Shaken microtiter plates are predominant cultivation platforms for high-throughput screening in bioprocess development (Kensy et al., 2009a). In the present work, a Biolector Pro microbioreactor system was used to carry out online monitoring of biomass, dissolved oxygen, pH, and fluorescence, without disturbing the cultures. Cultivations were initiated at a temperature of 30°C. Subsequently, simultaneously with the addition of m-toluate for induction, the cultivation temperature was reduced to 25°C. A reduction in temperature following induction of the expression of recombinant genes is a common practice in the RPP industry and was included in this study to better simulate relevant conditions. A higher cultivation temperature before induction is also frequently applied, as it increases process efficiency by shortening the non-productive phase (Larentis et al., 2014). Moreover, previous studies have found more favorable growth rates and product yields when culturing E. coli at a higher temperature and then reducing it for RPP induction, pointing at increased fitness of the cells in conditions like the ones in the present work. Decreasing the cultivation temperature after induction of RPP has been reported to increase protein stability, decrease aggregation, ensure proper folding, and, overall, lead to higher product yield (Rosano and Ceccarelli, 2014; Tripathi and Shrivastava, 2019; Huang et al., 2021). RPP at higher temperatures can cause increased metabolic burden (Muhlmann et al., 2017).
Growth kinetics and cultivation parameters were evaluated in Biolector Pro cultivations for wild-type (WT) E. coli BL21 and a total of sixteen derived recombinant E. coli strains: eight mCherry-producing strains, harboring either a native or increased strength promoter, with four different levels of PCN; and eight “control strains”, with similar promoters and PCN, but not carrying the mCherry gene (Table 1). The results of three independent biological replicates per strain cultured in Biolector Pro are shown in Figure 1, and the corresponding calculated values for specific growth rates (µ; h-1), biomass at stationary phase (g CDW L-1) and elapsed cultivation time until stationary phase (h) are indicated in Table 2. As illustrated in Figure 1, pH values remained between 6.5 and 7.0 during exponential growth phase in all cultivations, which is within the optimal range for E. coli (Philip et al., 2018). As for aeration, the DO (%) values stayed above 50% in all cases. DO values above 30% have previously been reported as unrestricted for E. coli during RPP (Sharma et al., 2020), and this assumption is supported by the absence of acetate accumulation in E. coli B grown at 30% DO (Phue and Shiloach, 2005). The findings presented in Figure 1 indicate that the microbioreactor cultivation conditions selected in the present work were adequate to provide good aeration in all the studied strains. The flower-shaped baffled well geometry used in our work has previously been considered optimal to ensure oxygen transfer in small-scale cultivations (Funke et al., 2009). Oxygen availability is important for protein production (Konz et al., 1998; Losen et al., 2004), especially when expressing genes for reporter proteins such as mCherry, which requires oxygen for fluorophore maturation in order to display fluorescence (Kunze et al., 2014).
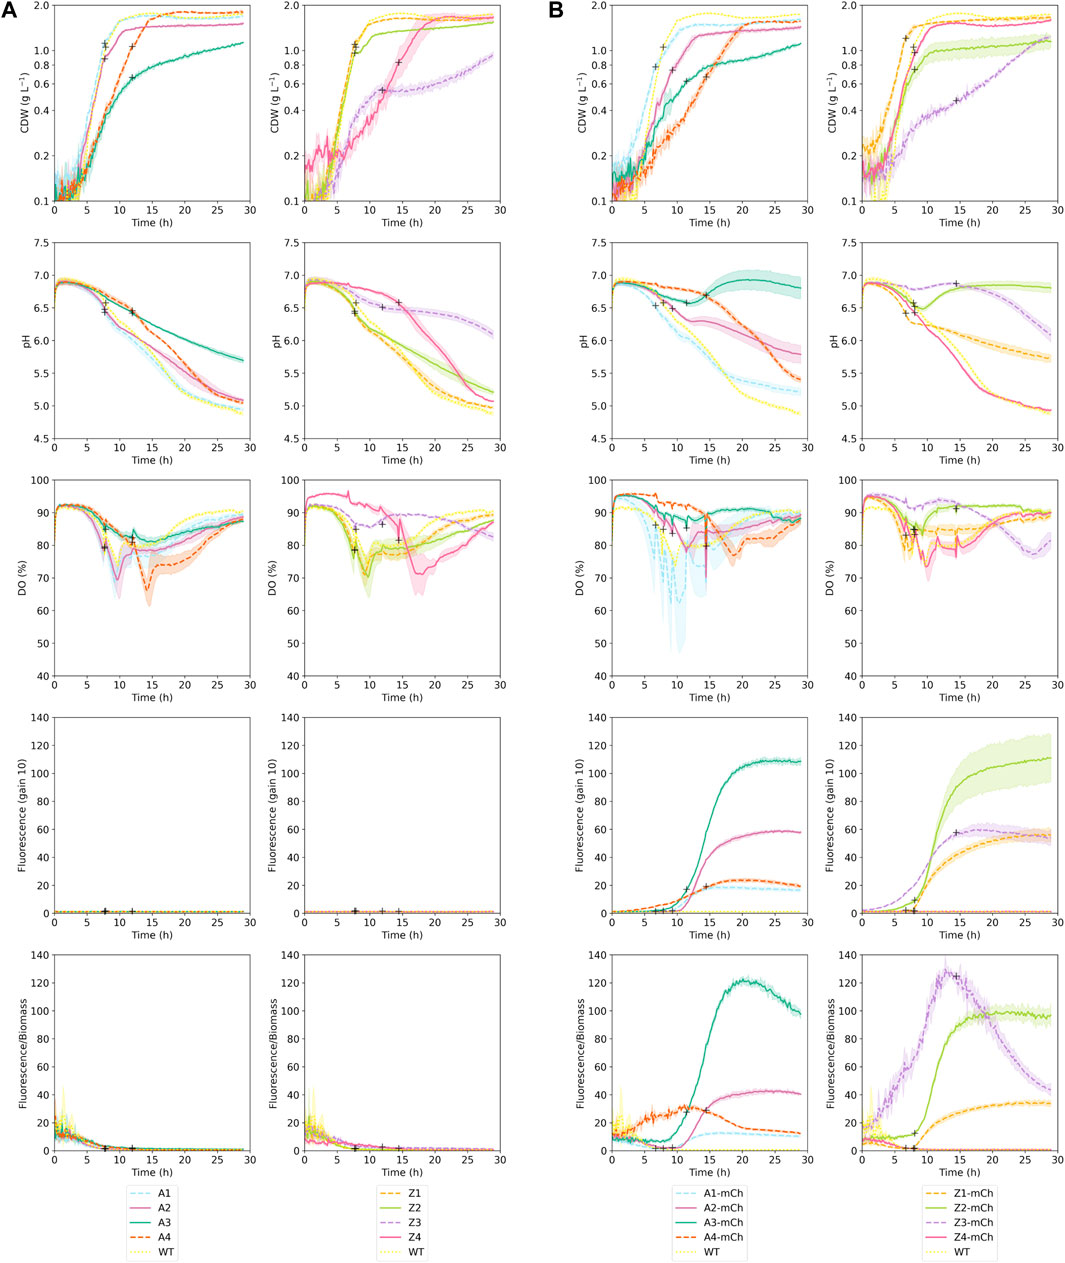
FIGURE 1. Cultivation parameters obtained during Biolector Pro cultivations. The plots display biomass (g CDW L-1), pH, dissolved oxygen (DO; %), absolute fluorescence detected with gain 10, and fluorescence/biomass ratios for each of the seventeen strains that were studied. The plots correspond to three independent biological replicates per strain; averages are indicated with a colored line and standard deviations (SD) are shown as a shaded area around the averages of the same color. Measurements were performed automatically every 10 min. All cultivations were carried out at 30°C, 1,400 rpm and 85% humidity until Biomass reached 30 arbitrary units (approximately 0.7 g CDW L-1); at Biomass 30, temperature was reduced to 25°C and protein production was induced by adding 1 mM m-toluate. Protein production induction points are marked in the figure with black + signs (A) Panels correspond to strains that did not include mCherry gene (empty plasmid control strains) (B) panels show mCherry-producing strains.
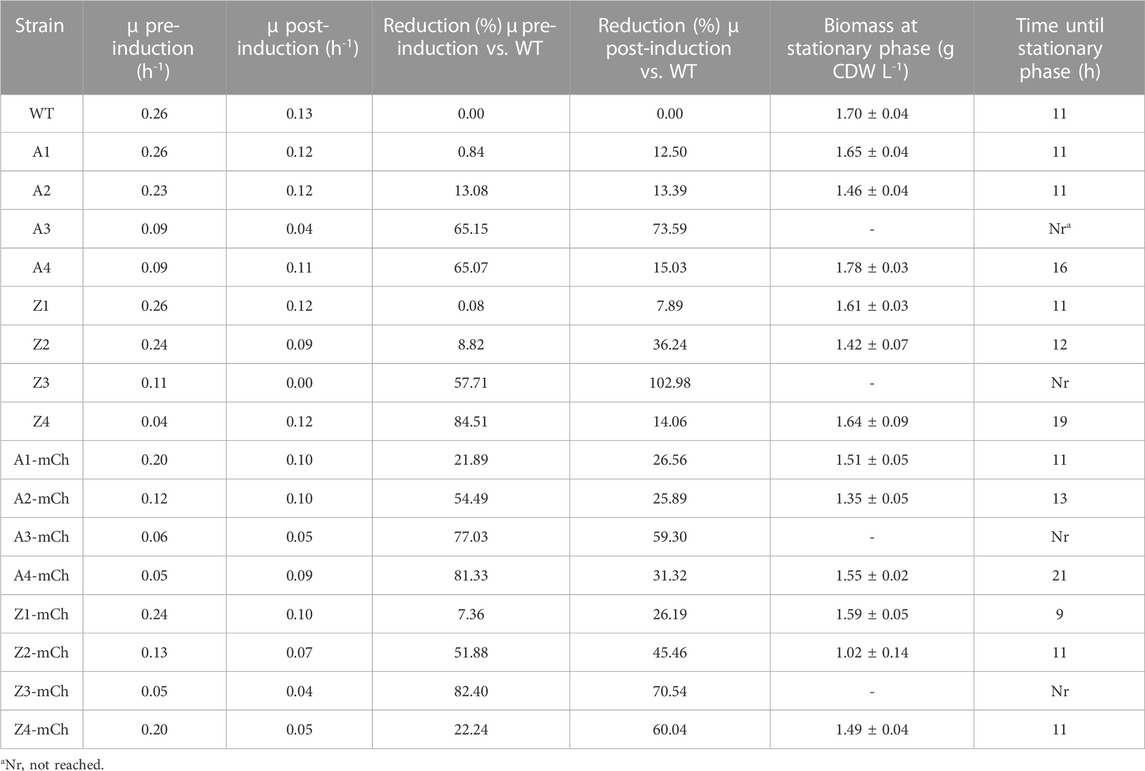
TABLE 2. Summary of results from cultivations in Biolector Pro microbioreactors with WT Escherichia coli BL21 and the sixteen recombinant strains studied in this work. Indicated in the table are average specific growth rates (µ; h-1) at exponential phase before (pre-induction) and after (post-induction) addition of m-toluate (average ±SD); reduction (%) in µ pre- and post-induction, referred to WT; biomass (g CDW L-1) at stationary phase (average ±SD); and time to reach stationary phase (h after inoculation).
As reported in Table 2, the growth kinetics for the WT E. coli BL21 strain (WT) and control strains without the mCherry gene with lowest PCN (A1 and Z1) were very similar, both concerning specific growth rates, highest biomass (g CDW L-1) achieved and time to reach stationary phase. This finding suggests that, at low PCN, the maintenance of the plasmids and constitutive expression of plasmid genes conferring antibiotic resistance did not lead to considerable growth inhibition. Plasmid maintenance appeared to influence the growth kinetics of the control strains A2, A3, Z2, Z3, which displayed lower growth rates with increasing PCN. A decrease in growth rates due to maintenance of plasmid DNA in empty strains has been recently reported in other studies (Lozano Terol et al., 2021). Moreover, the effect of the increased PCN was evident on the biomass (g CDW L-1) values at stationary phase in strains A2 and Z2, which were lower than for the WT (Table 2; Figure 1). PCN has been proposed by previous works as one of the main causes of the metabolic burden associated to RPP (Bentley et al., 1990; Glick, 1995; Carneiro et al., 2013), although the implications on central metabolism of E. coli have not been investigated in depth, and few studies have tried to engineer central pathways of this bacterium to circumvent the metabolic consequences of high PCN (Flores et al., 2004). As for promoter strength, as shown in Table 2, it did not affect the specific growth rates in the control strains not harboring the mCherry gene, as there were no apparent reductions in specific growth rates of A and Z control strains with identical PCN (A1 vs. Z1; A2 vs. Z2; A3 vs. Z3).
The effects of RPP and plasmid size on growth kinetics were evident when comparing growth parameters between the negative control strains and the corresponding producing strains (Table 2; Figure 1). In all cases, mCherry-producing strains harboring similar promoters and PCN displayed lower specific growth rates than their control counterparts (A1-mCh vs. A1, A2-mCh vs. A2; A3-mCh vs. A3; Z1-mCh vs. Z1; Z2-mCh vs. Z2; Z3-mCh vs. Z3). RPP imposes a large metabolic load on the cells, which can be observed as decreased growth rates (Haddadin and Harcum, 2005). Furthermore, the biomass achieved at stationary phase was also lower for the mCherry-producing strains than for their empty-plasmid counterparts. Given that the cultivation conditions and media composition were identical for all strains, this stationary phase at lower biomass may be related to an effect of RPP-derived burden on the central metabolism of the cells.
Concerning protein production, according to fluorescence measurements, absolute mCherry production was higher with increased promoter strength, at lower PCN (Z1-mCh vs. A1-mCh; Z2-mCh vs. A2-mCh). However, interestingly, the absolute fluorescence values were lower for Z3-mCh than for A3-mCh. This finding and the growth parameters displayed on Table 2, point to an increased metabolic burden in the Z3-mCh strain derived from the combination of both high PCN and stronger promoter. Z3-mCh displayed similar relative fluorescence values per biomass compared to A3-mCh; however, the expression of the mCherry gene seemed to be poorly regulated for Z3-mCh, as evidenced from the basal level expression (leaky expression) observed before induction (Figure 1). Tightly controlled regulation of protein expression is crucial to avoid consequences to cell growth and recombinant protein yields, especially in cases where the product may be toxic for the host cells (Rosano and Ceccarelli, 2014). Strains harboring the Z mutated stronger promoter displayed higher fluorescence in the absence of inducer than A strains. Mutated XylS/Pm have previously been reported to have higher background expression than their wild-type counterparts (Balzer et al., 2013). The leaky expression found in Z3-mCh, together with its reduced specific growth rate, made Z3-mCh a less favorable candidate for further studies. Finally, the strains harboring the highest PCN (A4-mCh and Z4-mCh) showed lower fluorescence than strains with similar promoter strength and lower PCN, as well as low repeatability of results between cultivation runs (results not shown) and unexpectedly higher biomass yield compared to PCN 3-strain series (Figure 1; Table 2), so they were similarly excluded from further studies. High PCN vectors have been previously associated with lower recombinant protein yields than vectors with medium or low PCN, and a strategy to improve RPP can be to opt for lower PCN (Jones et al., 2000; Terpe, 2006; Silva et al., 2012; Lozano Terol et al., 2021).
To further explore the observed differences between strains and obtain enough biomass to perform in-depth MS-based endometabolite analysis (Overton, 2014; Hemmerich et al., 2018), a selection of strains was scaled up to benchtop cultivations in bioreactor. The selected strains were A2-mCh and Z2-mCh, given that both showed altered growth kinetics in microbioreactor compared to control strains, while maintaining more tightly regulated mCherry production and high repeatability between biological replicates. The empty-plasmid counterpart strains (A2 and Z2, respectively), as well as WT E. coli BL21, were included as controls in the benchtop bioreactor cultivations.
3.1.2 Growth kinetics in benchtop bioreactor batch cultivations
The five selected strains (WT E. coli BL21, A2, A2-mCh, Z2 and Z2-mCh) were grown in Applikon benchtop bioreactors at lab scale (working volume of 0.9 L), in batch cultivations with identical conditions. In all cases, defined minimal Hi-F medium was used, starting the cultures at OD600 0.1, 30°C, constant air flow and adjusting agitation to maintain DO above 40% along the whole run. pH was controlled at 7.00 to ensure optimal growth conditions. RPP was induced by adding 1 mM m-toluate when the cultures reached OD600 2–2.5. Similarly to what was done in microbioreactor scale, the cultivation temperature was reduced to 25°C simultaneously with the addition of m-toluate for RPP induction.
3.1.2.1 Progression of the growth rate along the different cultivations
A reduction of growth rate was observed for all the studied strains after addition of the inducer, which was greater with increased promoter strength (Z versus A variant), as well as in mCherry producing strains versus their non-producing counterparts (Figures 2A–E and Table 3). Given that induction of RPP in the present study was carried out simultaneously with reduction in cultivation temperature and addition of m-toluate, the effects of these parameters on growth kinetics were assessed separately before proceeding with the targeted endometabolite analysis. Firstly, it was confirmed that m-toluate was not toxic for the cells at the concentrations used in the present study (1 mM), and it did not alter pH, oxygen transfer nor growth kinetics in repeated cultivations of WT E. coli BL21 at 30°C (results not shown). Furthermore, the effect of temperature reduction from 30°C to 25°C in absence of addition of m-toluate was assessed in the same WT control strain, as well as in the strains that displayed stronger growth rate reductions after induction: Z2 and Z2-mCh. The reduction of growth rate in Z2 and Z2-mCh following temperature shift from 30°C to 25°C, in absence of m-toluate, was of 34% and 33%, respectively, which is similar to that observed for WT E. coli BL21 (33%, as shown in Table 3). These findings confirm that the larger reduction in growth rate reported for the recombinant strains in this study can be attributed to the induction of the XylS/Pm system, and not to a poorer ability to adapt to lower cultivation temperatures than the WT strain. Similarly, the growth rates before induction were comparable for all five strains included in this scale-up study (Table 3; Figures 2A–E), pointing at induction of the promoter/regulator and RPP as the cause of altered growth kinetics, more than plasmid maintenance and constitutive expression of antibiotic resistance genes. Interestingly, in smaller scale experiments in microbioreactors, plasmid maintenance before induction seemed to affect growth rates in strains with high PCN and/or strong promoters, as shown in Table 2 and Figure 1. Microbioreactors constitute a very favorable initial tool for high-throughput screening and identification of general trends; however, its transferability can be suboptimal (Kensy et al., 2009a; Kensy et al., 2009b). This emphasizes the importance of complementing small-scale screenings with scale-up experiments such as the one reported in the present work, in order to better understand industrial processes and optimize small-scale approaches (Hemmerich et al., 2018).
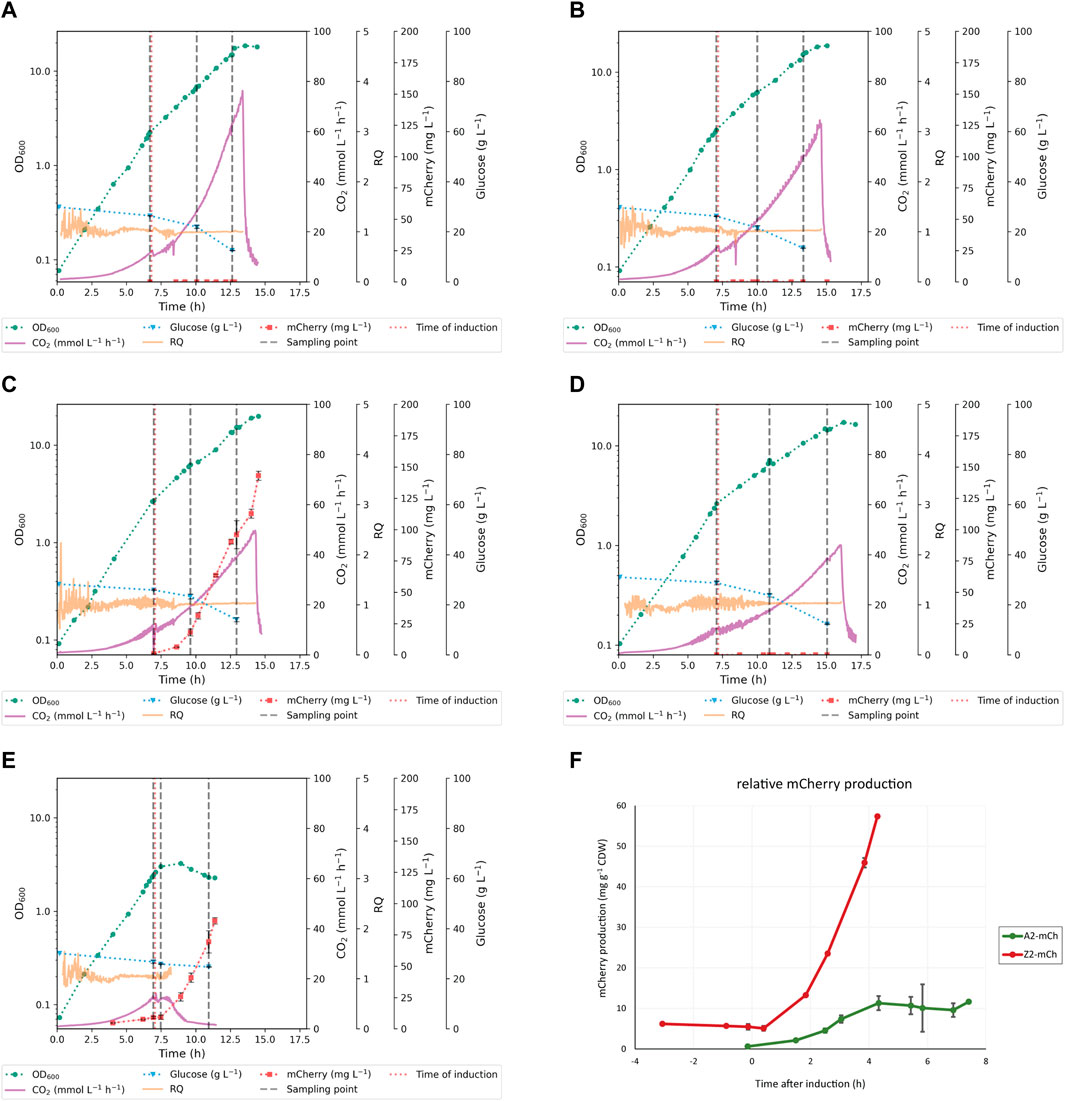
FIGURE 2. Growth and protein production profiles of the strains in benchtop bioreactors, including online and offline cultivation data. The figure shows representative cultivations for each strain (A) WT Escherichia coli BL21 (B) Escherichia coli A2 (C) Escherichia coli A2-mCh (D) Escherichia coli Z2, and (E) Escherichia coli Z2-mCh. Indicated in the figure are biomass growth curves (OD600), off-gas CO2 production (mmol L-1 h-1), respiratory quotient (RQ), extracellular glucose concentration (g L-1), and absolute protein production (mg mCherry mL-1) for each time point. Error bars indicate standard deviations (SD). Induction points are marked with a red vertical dotted line; the three consecutive sampling points for the targeted metabolite profiling are shown with grey vertical dashed lines (F) Comparison of protein production profiles per biomass (mg mCherry g-1 CDW) for recombinant strains A2-mCh and Z2-mCh.
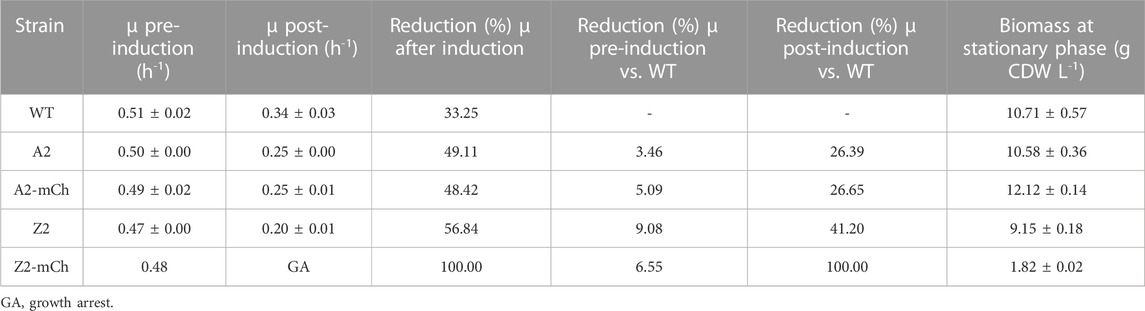
TABLE 3. Summary of results from batch cultivations in Applikon benchtop bioreactors. The table shows the specific growth rates (µ; h-1) at exponential phase before (pre-induction) and after (post-induction) addition of m-toluate (average ±SD); reduction (%) in µ occurred after induction in the same strain and cultivation; reduction (%) in µ pre- and post-induction, referred to WT; and biomass (g CDW L-1) at stationary phase (average ±SD).
3.1.2.2 Effects of RPP on other cultivation parameters
The respiratory quotient (RQ), defined as the ratio of the carbon dioxide production to the oxygen consumption (Roels, 1981), was calculated for all strains during exponential phase. In all cases, the RQ stayed around a value of 1, which is within the expected values for growth on glucose as sole carbon source in fully aerobic conditions (Korz et al., 1995; Fan et al., 2005; Taymaz-Nikerel et al., 2010). The cultures did not enter oxygen limitation throughout the period of study (Figures 2A–E). The CO2 evolution profile displayed similar trends in all strains but Z2-mCh, with a brief adaptation period after lowering of temperature and RPP induction (immediately after sampling point T1), followed by subsequent increase in production rate with time, until stationary phase triggered by a nitrogen limitation, when an expected drop in CO2 production rate occurred (Figures 2A–D). As shown in Supplementary Table S2, the specific CO2 production rate (pCO2) showed no significant differences between the WT, A2, A2-mCh and Z2 strains at each studied time interval. On the other hand, the Z2-mCh strain entered an RPP-induced growth arrest around 30 min–1 h after induction, which was coupled with a progressive decrease in CO2 production rate, as shown in the cultivation plots (Figure 2E) and calculated pCO2 (Supplementary Table S2), especially at later time points in the production phase (T2-T3 and T1-T3). This apparent growth arrest was surprising, as Z2-mCh grew well after induction in the Biolector cultivation format, and shows a cultivation condition scale dependency of the phenotype in this strain. Growth arrest can be a consequence of the metabolic burden and maladaptation to RPP (Sevastsyanovich et al., 2010; Lempp et al., 2020), and has been described for other E. coli strains upon rapid increase of heterologous gene expression (Haddadin and Harcum, 2005; Özkan et al., 2005; Weber et al., 2021). Although cell growth was apparently halted in Z2-mCh due to a metabolic change to accommodate the production of recombinant mCherry, the detected levels of mCherry continued to increase (Figure 2E), and the ratio of protein production per biomass was higher than for A2-mCh (Figure 2F). These findings suggest that RPP in our study was not linked to cell growth. Few studies focus on RPP in E. coli during stationary phase (Ou et al., 2004; Lempp et al., 2020), and further investigations could be of interest.
3.1.2.3 Production of mCherry and overflow metabolites
The consumption of glucose, as well as the production of several secreted organic acids, were evaluated by means of HPLC (Figure 3). All the strains used in the present work derive from an E. coli strain (BL21) that belongs to the B line, which is of high industrial relevance and the preferred one for RPP (Bernal et al., 2016). This particular strain is deficient in proteases Lon and OmpT, among other advantageous features for RPP, and has been reported to produce less overflow metabolites than K12 E. coli strains, which secrete more acetate (Rosano et al., 2019). Overflow metabolism occurs as a response to specific metabolic conditions, such as anaerobiosis or increased demand of precursors for biosynthesis or energy conservation (Veit et al., 2007). As it affects cell fitness, inhibits growth and biosynthesis, and consumes carbon equivalents that could instead be used to synthesize the product of interest, overflow metabolism is usually detrimental for RPP (Bernal et al., 2016). The acetate levels produced per biomass in our study were, in general, low and comparable for all strains, except Z2-mCh, which displayed higher levels at the last time point (T3). Acetate could be excreted in this case due to a metabolic readjustment following growth arrest and RPP. Acetate production has also been hypothesized to be linked in some cases to less available membrane surface to perform oxidative energetic metabolism (Szenk et al., 2017). Z2-mCh displayed altered morphological phenotypes at T3, with significant elongation and evident filamentation (data not shown), which may contribute to this. Finally, Z2-mCh presented increased levels of succinate at T3.
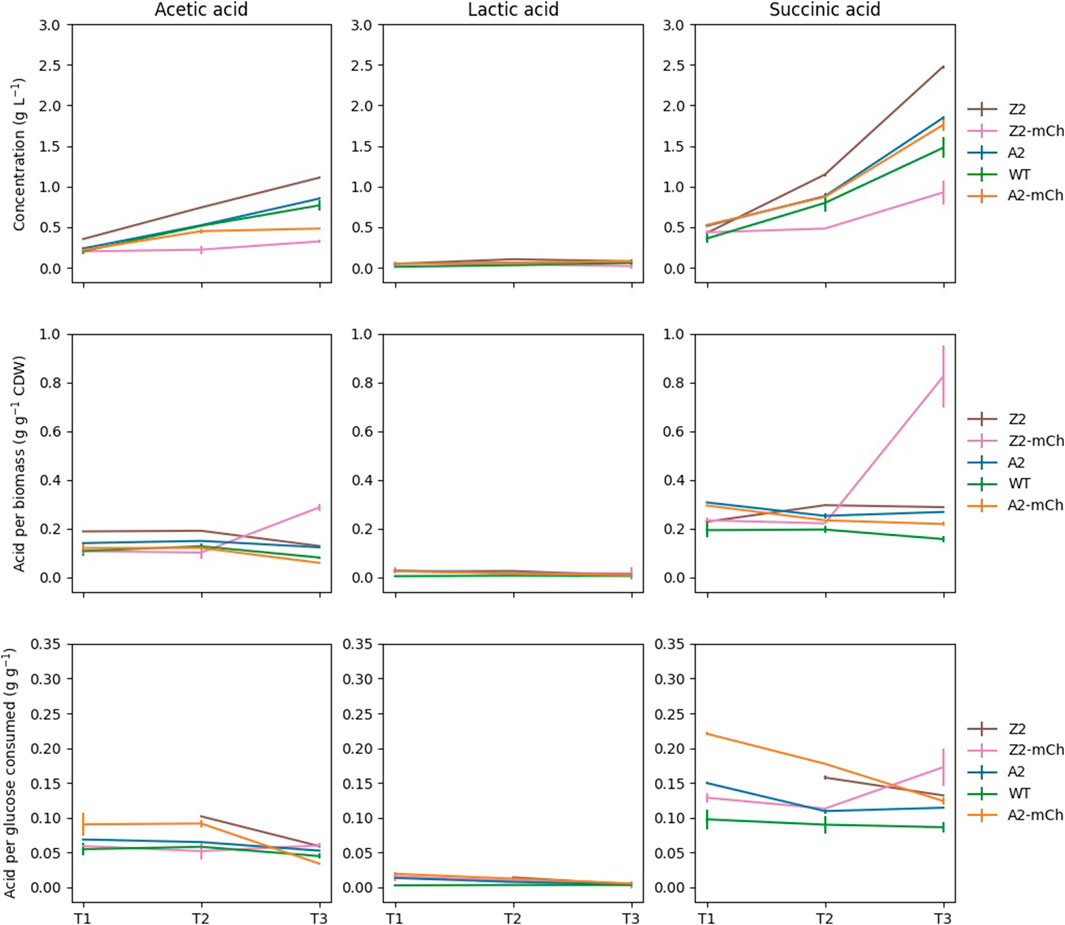
FIGURE 3. Evolution of the extracellular concentrations of selected organic acids during the time series. Each point was harvested simultaneously with samples for targeted metabolite profiling (T1, T2 and T3). Error bars indicate standard deviations (SD). Extracellular organic acid concentrations are expressed in the figure in g L-1 in the medium (top panels), acid produced relative to biomass at each given point (g g-1 CDW; middle panels); and per amount of glucose consumed at each time point (g g-1 glucose; bottom panels).
The differential patterns observed in the growth kinetics, substrate consumption and product accumulation of the selected strains were further explored by means of a comprehensive targeted endometabolite analysis.
3.2 Mass spectrometric profiling of central intracellular metabolite pools during RPP
Over 60 metabolites involved in the glycolysis, PPP and TCA central metabolic pathways, as well as nucleoside phosphates, amino acids and coenzymes participating in redox processes, were quantified in the mCherry producing recombinant strains A2-mCh and Z2-mCh, and in their non-producing control strains WT E. coli BL21, A2 and Z2. Three cultivation points with equivalent biomass were collected for each strain and biological replicate. All sampling points corresponded to exponential growth phase; T1 before induction of the production of protein, and T2 and T3 after induction and establishment of protein production in the mCherry strains. For Z2-mCh, the sampling points were selected differently, adapting to the growth kinetics shown in Figures 2A–E. For this strain, T2 was collected 30 min after induction, to better capture the metabolic changes occurring after induction, before RPP-triggered growth arrest. Finally, T3 in Z2-mCh was collected at a similar time after induction as for T2 in its corresponding empty-plasmid control strain Z2, to avoid sampling well into death phase. Metabolites were absolutely quantified by means of four targeted CapIC- and LC-MS/MS methods optimized for their different physiochemical characteristics. Relative quantification of metabolites or metabolic classes is highly useful to identify changes between conditions and to obtain a general overview of the trends in metabolite pools. However, in many cases, a relative depiction is not enough to understand the metabolic landscape of a given condition. In this regard, absolute metabolite quantification provides key information necessary, for instance, to study the thermodynamics of metabolic reactions, occupation of enzymes binding-sites and to determine relevant concentration ranges for experiments (Lu et al., 2017; Røst et al., 2020a). In the present work, absolute intracellular metabolite concentrations were reported for all measured metabolites in each of the studied strains, along a time series. Absolute concentrations were obtained by interpolating from external standard calibration curves, with isotope dilution correction using labelled internal standards, and accounting for matrix effects.
3.2.1 Characteristics of the expression vector affect the relative distribution of central metabolite classes after induction of RPP
To obtain an initial general overview of the metabolic state of each strain during the time series, the relative contribution of each metabolite class to the total analyzed pool of metabolites was studied. At sampling point T1, the relative distribution by pathway and metabolite type was maintained across all the strains (Figure 4A). After induction with m-toluate and lowering of the temperature (sampling points T2 and T3), the relative distribution differed for some of the studied strains. Said greater differences with increasing time point were also evident after performing an unsupervised principal component analysis (PCA) of the averages of each strain and time point, whose 2D scores plot indicated a closer clustering at T1, with increasing spread between strains at T2, along principal components PC1 and PC2. This spread was even more accentuated at T3 (Figure 4B). These results suggest different rearrangement patterns of central carbon metabolite pools as a response to the induction of the Xyls/Pm system.
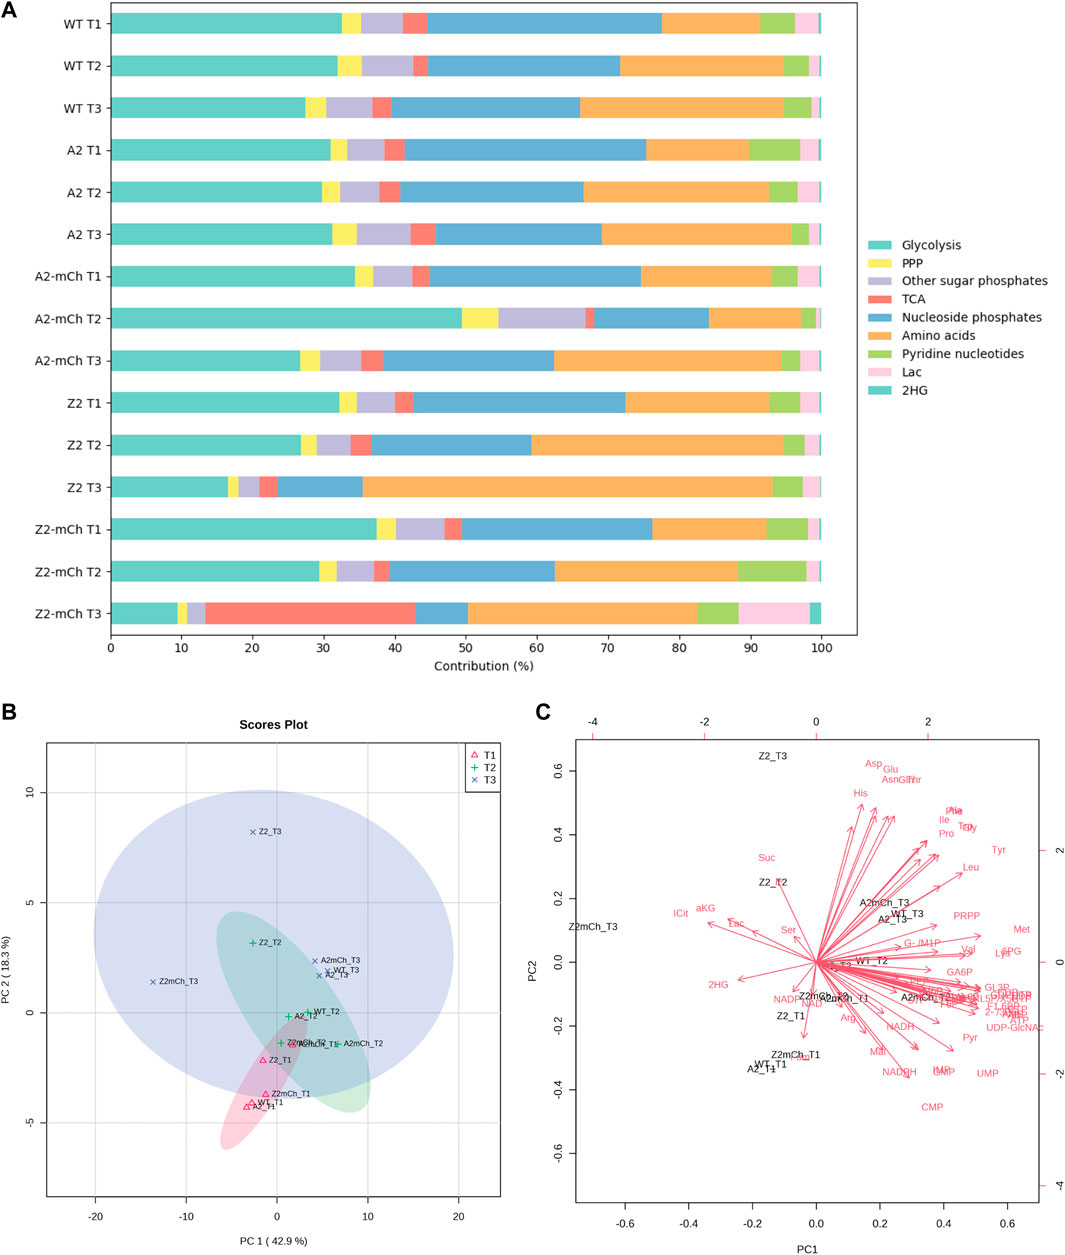
FIGURE 4. General overview of the metabolic state of each strain during the time series (A) Stack bar diagram showing a time series of the relative contribution (%) of metabolites to the total quantified metabolite levels, grouped by pathway or metabolite class (B) 2D scores plot from principal component analysis (PCA) of the averages of each strain. Prior to the PCA, the dataset was autoscaled (mean-centered and divided by the square root of the standard deviation of each variable) in MetaboAnalyst 5.0 (Pang et al., 2021). The colored shaded areas indicate the 95% confidence interval of PC1 and PC2 for each group (C) Biplot of PC1 versus PC2. In total, 61.2% of the variation in the data can be explained by PC1 and PC2.
At T2, most of the strains presented similar percentual ratios, with two exceptions. Firstly, Z2-mCh T2 displayed a larger relative contribution of pyridine nucleotides. Secondly, and perhaps more importantly, A2-mCh T2 showed a markedly different distribution among several of the metabolite groups: namely, this strain presented a larger relative contribution of metabolites involved in glycolysis, PPP and nucleoside phosphates than the rest. Finally, the contribution of different metabolite classes at T3 was fairly conserved between strains, except for in the case of those harboring the plasmids with the mutated strong promoter (Z2 and Z2-mCh). Compared to the rest of the strains, E. coli Z2 displayed a significantly greater proportion (%) of amino acids out of the total metabolite pool at T3 (Figure 4A), indicating that, even in the absence of a recombinant product gene, plasmid maintenance and induction with m-toluate already altered central carbon metabolism in cells harboring strong promoters and multiple PCN, something that was not observed in the control strain with equivalent PCN but weaker promoters (A2). A transcriptomic study comparing WT E. coli MG1655 and a recombinant strain without addition of inducer found higher expression of genes related to, among others, ATP synthesis, TCA cycle, ribosomes and amino acid synthesis, indicating metabolic effects due to plasmids, independent of RPP (Haddadin and Harcum, 2005). Finally, Z2-mCh showed a prominent relative increase in TCA cycle metabolites and decrease in glycolytic metabolites and nucleoside phosphates. These findings pointed at interesting differences in central metabolite pools during the studied conditions, which were further explored individually.
3.2.2 Absolute quantification of central metabolites and relative changes in single metabolites reveal differential metabolic responses to RPP
3.2.2.1 Overall trends
After the comparative analysis of metabolite classes among strains, the metabolomics data was subsequently inspected at individual metabolite pools level. The individual metabolite pool sizes were spanning over four orders of magnitude (Figure 5A). Furthermore, the absolute intracellular metabolite concentrations of glycolytic, PPP, nucleoside phosphates, TCA cycle intermediaries, amino acids, pyridine nucleotides and lactate were quite similar for each time point among all strains, with only one exception (Z2-mCh at the last sampling point, T3). From the overall metabolic picture of A2 and Z2, it could be inferred that the metabolite pool sizes were quite homeostatic compared to WT, with a slight reduction in several metabolite class pools at T3 for Z2 (Figure 5B). PCN was approximately 20 for the 2-series strains (A2, A2-mCh, Z2 and Z2-mCh) (Durland et al., 1990), which represents a small fraction of the total DNA content of the cells (around 3.6% and 3.9%, for empty plasmid and mCherry strains, respectively). The genomic DNA content itself constitutes only 1%–3% of the E. coli dry weight cell mass (Neidhardt et al., 1990; Beck et al., 2018; Simensen et al., 2022). Thus, the additional 20 plasmid copies should not cause a major precursor and energetic burden for E. coli before induction of heterologous gene expression, as supported by both the metabolite profiling and the cultivation data of this study (Figure 2; Table 3; Figure 5). Introducing mCherry production, however, influenced the metabolite pool distributions. The two mCherry producing strains are further evaluated in detail in the following two paragraphs.
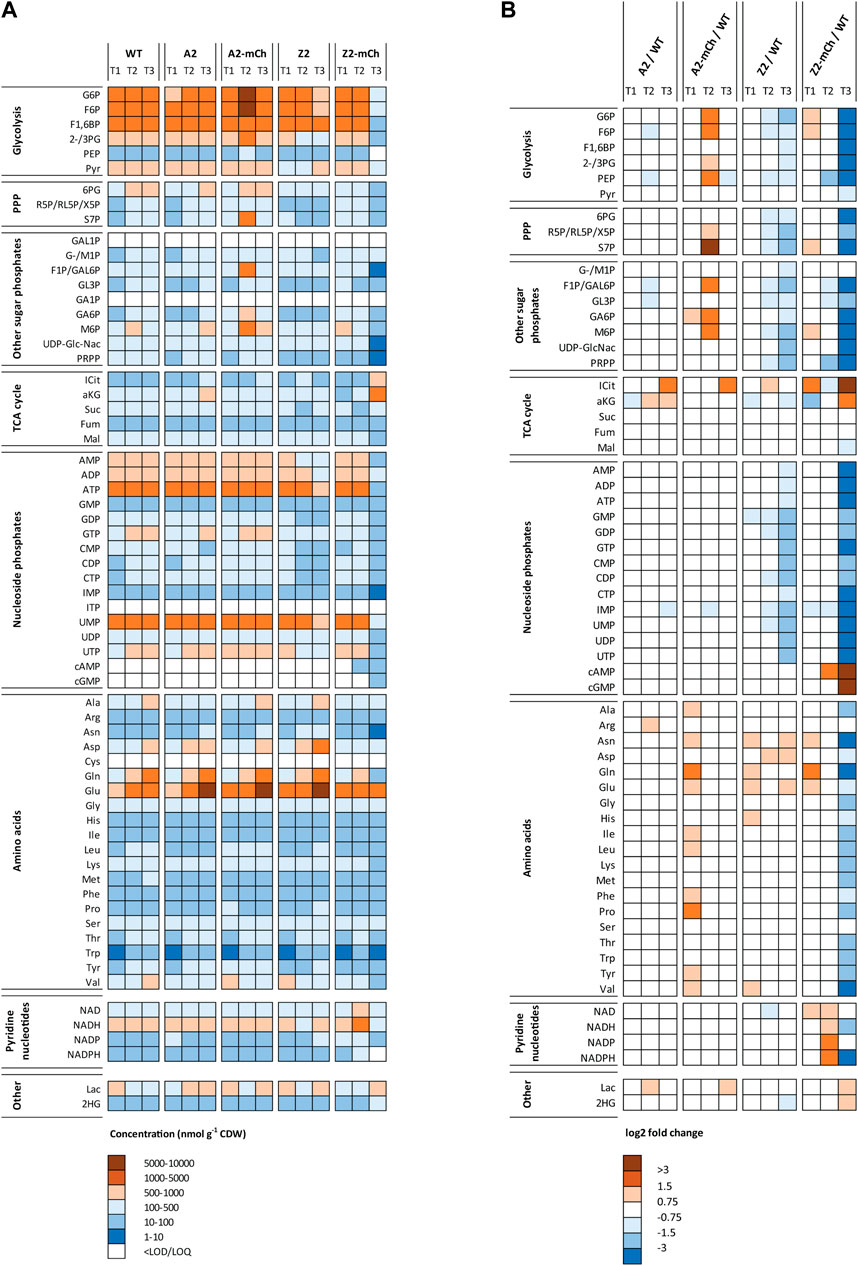
FIGURE 5. Intracellular metabolite levels in strains WT Escherichia coli BL21, A2, A2-mCh, Z2 and Z2-mCh, during a time series before (T1) and after induction of RPP with m-toluate (A) Heatmap indicating the absolute intracellular metabolite concentrations (nmol g-1 CDW). Metabolite concentrations are color-coded according to their absolute concentrations, with red colors indicating higher amounts and blue colors lower amounts. White color shows that the metabolite was below the LOQ or LOD for the given condition (B) Heatmap displaying the log2 fold changes for each single metabolite, for all studied strains, with respect to the corresponding time point in the WT Escherichia coli BL21 strain. Red colors depict positive log2 fold changes in the positive range (higher concentration that in the WT strain), while blue colors indicate log2 fold changes in the negative range (lower concentration that in the WT strain). White indicates similar metabolite levels (from −0.75 to 0.75 log2 fold change). Metabolite abbreviations are listed in Supplementary Table S1. Numeric values for averages and RSD (%) for each condition and metabolite can be found in Supplementary Table S3.
3.2.2.2 A2-mCh
A2-mCh showed a unique metabolite profile compared to the other studied strains. At the first sampling point after induction (T2), A2-mCh presented a transient response with accumulation of glycolytic, PPP and other phosphorylated metabolites. Interestingly, at T3, A2-mCh returned to metabolite concentrations similar to what was observed for WT E. coli BL21 (Figure 5). From T1 to T3, A2-mCh cultures consumed approximately 11.8 g glucose L-1 and the cell density increased with 12 OD units, which amounts to approximately 7 g CDW L-1. In comparison, the mCherry production was small, around 140 mg L-1. This represents 4% of the precursor and energetic resources needed for protein synthesis (assuming 50% protein in E. coli (Simensen et al., 2022)), and 2% of the total resources for cell growth. Compared with its empty-plasmid control (A2), the glucose consumption for A2-mCh was lower between T1 and T2 (Figure 2), and the lower glycolytic flux is manifested by the metabolite accumulation at T2. These findings indicate that the induction of RPP mediated a transient stress in the cells that was resolved at the last time point T3, where the high glucose consumption was resumed. In the case of A2-mCh, we did not find the accumulation of ICit and aKG observed for Z2-mCh at a similar time after induction (T3), discussed in the next paragraph. These features, as well as the slight increase in NADPH and absence of relative decrease in amino acid pools, suggest a better adaptation to RPP in this strain (weaker promoter) as opposed to Z2-mCh (stronger promoter). These findings point to A2-mCh being a strain capable of upregulating pathways that produce energy and reducing power for anabolism (NADPH) in a more balanced manner. This fine balance can be complicated to achieve, as indicated in recent works pointing at aggravated metabolic burden due to RPP when recombinant strains accelerate the glycolytic pathway as a response to induction (Weber et al., 2021). In the present work, however, as mentioned above, we showed that A2-mCh could better adjust its central carbon metabolism to support RPP, as evidenced by the fewer relative changes in metabolite concentrations versus WT E. coli BL21 at the last time point (T3) (Figure 5B). Its successful adaptation to RPP was also supported by the growth kinetics depicted in Figure 2, the growth rates indicated in Table 3, and the representation of central carbon metabolism at production phase sampling points vs. Z2-mCh (Supplementary Figure S4).
3.2.2.3 Z2-mCh
Induction of mCherry production with the stronger promoter caused the complete cessation of growth in Z2-mCh, switching the cultures into a resting stationary condition with almost no glucose consumption (Figure 2), and resulting in overall metabolite pools depletion (Figure 5). However, the cells were able to maintain an mCherry production at almost the same absolute level as A2-mCh, and even a higher specific production (Figure 2F). In this regard, the yield of mCherry on glucose in Z2-mCh was 4-6 times higher than in A2-mCh, and Z2-mCh was able to convert approximately 5% (w/w) of glucose in the product mCherry, as opposed to values below 1% in A2-mCh (Supplementary Table S2). As for the metabolic profile of this strain, Z2-mCh displayed a generalized lower concentration of most metabolites, which contributed to separate this strain at T3 along PC1 in the PCA carried out for the averages of each strain (Figures 4B–C). The higher levels of ICit and aKG at T3 explain the larger relative contribution (%) of the TCA cycle indicated for this strain and time point in Figure 4A. Moreover, the terminal glycolytic intermediary phosphoenolpyruvate (PEP) was depleted, a finding recently reported for other E. coli strains during IPTG-induced production of hFGF-2 (Weber et al., 2021). An increase in aKG has been shown in E. coli, together with a depletion of PEP, during nitrogen limitation (Doucette et al., 2011), which was not present in our case. It can be speculated that the general amino acid depletion observed for Z2-mCh T3 corresponded to a reduced biosynthetic flow from their precursors. The amino acids that showed the most marked relative decrease were valine (Val), glutamine (Gln) and asparagine (Asn). The relative composition of mCherry presents 6.4% Val, 3.4% Gln and 3% Asn, according to the ProtParat tool in Expasy (Duvaud et al., 2021), so RPP does not necessarily explain the depletion of these amino acids in particular. As for the redox state of Z2-mCh during RPP, the log2 fold change calculations at T2 indicated a relative increase in pyridine nucleotides involved in anabolic pathways (NADP, NADPH), with a subsequent marked depletion of NADPH and moderate reduction of NADH in the last time point (T3). The decrease in reduced pyridine nucleotides (NADH, NADPH) during higher anabolic activity, possibly related to RPP, can also be explained by the lower activity of glycolysis and PPP in this strain and time point, as indicated in Figure 5B. Another unique finding in Z2-mCh was the relative larger contribution of lactate to the total metabolite pools, as shown in Figure 4A; Figures 4C, 5B. In E. coli, lactate can be biosynthesized from pyruvate (Pyr), catalyzed by three lactate dehydrogenases (LDH) (Clark, 1989), and is a fermentative solution to regenerate NAD from NADH if electron transport and oxidative phosphorylation is impaired. As a summary of the findings concerning the Z2-mCh strain in the present work, the induction of RPP led to an early apparent stationary phase with growth arrest, marked differences in the total intracellular metabolite pools and individual endometabolites, as well as phenotypic and morphological changes, while still showing the highest specific mCherry production rate. RPP can trigger energetic inefficiency and undesirable physiological changes, as reported in previous studies (Wu et al., 2016).
3.2.2.4 Energy charge
The ratios of ATP, ADP and AMP can be functionally more important than the absolute concentration of ATP, and this relationship may be explored through indices such as the EC. The EC index was proposed in 1967 by Atkinson, and defined as ([ATP] +0.5 [ADP])/([ATP] + [ADP] + [AMP]) (Atkinson and Walton, 1967). In the present work, the EC was calculated for all strains and time points. All conditions except for Z2-mCh T3 did not present statistically significant differences in their calculated EC values. Z2-mCh at T3, in turn, showed a significantly lower EC (Table 4). The EC can serve as an indication of the energetic state of a cell. EC values of 0.7–0.95 have been previously reported as physiological under optimal growth conditions for a variety of organisms (De la Fuente et al., 2014; Røst et al., 2020a). The EC values reported in the present work, although slightly lower, were close to said physiological range, with the exception of Z2-mCh at sampling point T3. For Z2-mCh T3, the lower EC could be attributed to the metabolic burden derived from RPP, and it may also serve as an indication of the energetic state associated with the growth arrest experienced shortly after RPP induction. In this regard, Wittman et al., reported a reduction in EC from 0.85 to 0.6 with the onset of RPP (Wittmann et al., 2007). EC values close to our experimental results have been previously found for a K12 E. coli strain in an IPTG induced fed-batch culture maintained at a low growth rate and high rate of recombinant expression (Sanden et al., 2003). Furthermore, recombinant E. coli K12 strains have been shown to maintain constant EC when well-adjusted after induction of RPP (Weber et al., 2021).
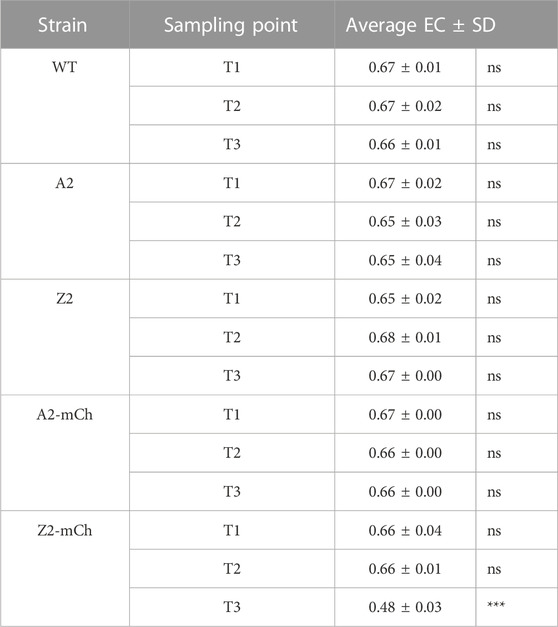
TABLE 4. Average adenylate energy charge (EC) ± standard deviation (SD) for each strain and sampling point, cultivated in defined mineral medium in benchtop bioreactors. Significance levels for multiple comparisons from one-way ANOVA with Tukey’s HSD multiple comparisons tests are marked as ns: not significant; ***: p ≤ 0.001.
To ensure the efficiency of RPP, it is important that the cell maintains high fluxes through energetic pathways, such as glycolysis, TCA cycle and the subsequent oxidative phosphorylation (Haddadin and Harcum, 2005). Recent studies on recombinant B and K12 E. coli strains have reported that the growth inhibitory effect of RPP may not be due to elevated energy and precursor withdrawal for plasmid related functions, but to the accumulation of catabolites and insufficient withdrawal for anabolic purposes (Li and Rinas, 2021; Weber et al., 2021). In these works, the authors found that the availability of ATP was not a limiting factor for RPP. Our results are in alignment with this finding, as the absolute intracellular concentrations of ATP remained at similar levels, except for the time point corresponding to growth arrest (Z2-mCh, T3).
3.2.2.5 Strategies to improve protein production
Several approaches could in principle be applied to improve protein productivity and alleviate the metabolic burden derived from RPP, including genetic engineering of key enzymes involved in the affected pathways, and modifications of the cultivation conditions. A limited number of studies have focused on engineering central carbon metabolic pathways in E. coli to improve growth kinetics or product yields by alleviating the consequences of the metabolic burden imposed by RPP (Chou, 2007; Liu et al., 2015). In this regard, Flores et al. reported a partial recovery in growth rate through engineering of the pentose phosphate pathway by modulation of the zwf gene expression level, as a strategy to overcome a bottleneck in the supply of building blocks (Flores et al., 2004). This strategy could be beneficial for the Z2-mCh strain studied in the present work, given that increased concentrations of PPP metabolites were observed in A2-mCh during RPP, and this was a producing strain that did not undergo growth arrest. Redirecting and increasing the carbon flux through the oxidative branch of the PPP may help meet the demand for biosynthetic precursors and reducing power under RPP (Flores et al., 2004). In another study, Kim et al. showed that E. coli overexpressing phosphoenolpyruvate carboxykinase produced larger product yields with lower biomass increase than a control strain (Kim et al., 2012). Z2-mCh showed ATP depletion at late RPP sampling points (T3), and an increase in phosphoenolpyruvate carboxykinase activity could contribute to higher ATP availability. Finally, cultivation adjustments can be considered to alleviate the metabolic burden imposed on the producing strains. For instance, amino acid supplementation in the culture medium has been proven to reduce the cellular stress due to RPP and increase process productivity (Kumar et al., 2020). A generalized depletion in the amino acid concentrations was observed in the Z2-mCh strain during RPP. Given the importance of amino acids as building blocks, as well as the role of amino acid starvation during the stringent stress response, amino acid supplementation could potentially improve productivity in Z2-mCh.
3.2.2.6 Final remarks and conclusions
The metabolic burden caused by RPP has only been partially studied in E. coli as a host, especially with respect to the effects on central carbon metabolism. In this regard, the present study contributes to the field with, to the best of our knowledge and to this date, the most comprehensive metabolite profiling of strains harboring expression vectors with different features, and over different time points with respect to induction. Our work shows the robustness in E. coli central metabolism when introducing high copy number plasmids, as well as the greater importance of RPP induction as a metabolic challenge, especially when strong promoters are used.
Data availability statement
The original contributions presented in the study are included in the article/Supplementary Material, further inquiries can be directed to the corresponding author.
Author contributions
Conceptualization, LG-C, JM, and PB; Methodology, LG-C and PB; Validation, LG-C, DR, NE, SH, LM, AM, and PB; Formal Analysis, LG, DR, NE, SH, LM, AM, and PB; Investigation, LG-C, DR, NE, SH, LM, and AM; Resources, JM and PB; Writing—Original Draft Preparation, LG-C and PB; Writing—Review and Editing, LG-C and PB; Visualization, LG-C, NE, SH, LM, AM; Supervision, LG-C and PB; Project Administration, LG-C and PB; Funding Acquisition, LG-C and PB. All authors contributed to manuscript revision, read, and approved the submitted version.
Funding
This research was funded by internal funding from NTNU: The Department of Biotechnology and Food Science and the Faculty of Natural Science, as well as by the Research Council of Norway funded research-based innovation centre in Industrial Biotechnology (SFI IB, www.sfi-ib.com; project number 309558). The funders had no role in study design, data collection and analysis, decision to publish, or preparation of the manuscript.
Acknowledgments
The authors acknowledge the administrative and technical support from the host Department and the NTNU Natural Science faculty Mass Spectrometry laboratory. We especially thank senior engineer Kåre Andre Kristiansen for technical support. The authors would like to express their gratitude to Vectron Biosolutions AS for providing the strains used in this work and for their help throughout the project. Finally, we want to specially thank Lisa Marie Røst for her support with endometabolite profiling, and Emil Karlsen for his assistance and guidance using python for data visualization.
Conflict of interest
JM was employed by Vectron Biosolutions AS.
The remaining authors declare that the research was conducted in the absence of any commercial or financial relationships that could be construed as a potential conflict of interest.
Publisher’s note
All claims expressed in this article are solely those of the authors and do not necessarily represent those of their affiliated organizations, or those of the publisher, the editors and the reviewers. Any product that may be evaluated in this article, or claim that may be made by its manufacturer, is not guaranteed or endorsed by the publisher.
Supplementary material
The Supplementary Material for this article can be found online at: https://www.frontiersin.org/articles/10.3389/fceng.2023.1142226/full#supplementary-material
Abbreviations
aKG, α-ketoglutaric acid; DO, dissolved oxygen; ICit, isocitrate; LOD, limit of detection; LOQ, limit of quantitation; OD, optical density; PCA, principal component analysis; PCN, plasmid copy number; PEP, phosphoenolpyruvate; PPP, pentose phosphate pathway; RPP, recombinant protein production; TCA, tricarboxylic acid.
References
Atkinson, D. E., and Walton, G. M. (1967). Adenosine triphosphate conservation in metabolic regulation. J. Biol. Chem. 242 (13), 3239–3241. doi:10.1016/s0021-9258(18)95956-9
Balzer, S., Kucharova, V., Megerle, J., Lale, R., Brautaset, T., and Valla, S. (2013). A comparative analysis of the properties of regulated promoter systems commonly used for recombinant gene expression in Escherichia coli. Microb. Cell Fact. 12, 26. doi:10.1186/1475-2859-12-26
Baneyx, F. (1999). Recombinant protein expression in Escherichia coli. Curr. Opin. Biotechnol. 10 (5), 411–421. doi:10.1016/s0958-1669(99)00003-8
Beck, A., Hunt, K., and Carlson, R. (2018). Measuring cellular biomass composition for computational biology applications. Processes 6 (5), 38. doi:10.3390/pr6050038
Bentley, W. E., Mirjalili, N., Andersen, D. C., Davis, R. H., and Kompala, D. S. (1990). Plasmid-encoded protein: The principal factor in the “metabolic burden” associated with recombinant bacteria. Biotechnol. Bioeng. 35 (7), 668–681. doi:10.1002/bit.260350704
Bernal, V., Castano-Cerezo, S., and Canovas, M. (2016). Acetate metabolism regulation in Escherichia coli: Carbon overflow, pathogenicity, and beyond. Appl. Microbiol. Biotechnol. 100 (21), 8985–9001. doi:10.1007/s00253-016-7832-x
Blatny, J. M., Brautaset, T., Winther-Larsen, H. C., Karunakaran, P., and Valla, S. (1997). Improved broad-host-range RK2 vectors useful for high and low regulated gene expression levels in gram-negative bacteria. Plasmid 38 (1), 35–51. doi:10.1006/plas.1997.1294
BlueWeave Consulting and Research Pvt Ltd (2021). Global industrial enzymes market projected to reach worth $9.2 bn by 2027. Focus Catal. 2021 (12). doi:10.1016/j.focat.2021.11.004
Carneiro, S., Ferreira, E. C., and Rocha, I. (2013). Metabolic responses to recombinant bioprocesses in Escherichia coli. J. Biotechnol. 164 (3), 396–408. doi:10.1016/j.jbiotec.2012.08.026
Chae, Y. K., Kim, S. H., and Markley, J. L. (2017). Relationship between recombinant protein expression and host metabolome as determined by two-dimensional NMR spectroscopy. PLOS ONE 12 (5), e0177233. doi:10.1371/journal.pone.0177233
Chou, C. P. (2007). Engineering cell physiology to enhance recombinant protein production in Escherichia coli. Appl. Microbiol. Biotechnol. 76 (3), 521–532. doi:10.1007/s00253-007-1039-0
Clark, D. P. (1989). The fermentation pathways of Escherichia coli. FEMS Microbiol. Lett. 63 (3), 223–234. doi:10.1111/j.1574-6968.1989.tb03398.x
De la Fuente, I. M., Cortes, J. M., Valero, E., Desroches, M., Rodrigues, S., Malaina, I., et al. (2014). On the dynamics of the adenylate energy system: Homeorhesis vs homeostasis. PLoS One 9 (10), e108676. doi:10.1371/journal.pone.0108676
de la Fuente, M., Lombardero, L., Gomez-Gonzalez, A., Solari, C., Angulo-Barturen, I., Acera, A., et al. (2021). Enzyme therapy: Current challenges and future perspectives. Int. J. Mol. Sci. 22 (17), 9181. doi:10.3390/ijms22179181
Dean, R. B., and Dixon, W. J. (1951). Simplified statistics for small numbers of observations. Anal. Chem. 23 (4), 636–638. doi:10.1021/ac60052a025
Doucette, C. D., Schwab, D. J., Wingreen, N. S., and Rabinowitz, J. D. (2011). α-ketoglutarate coordinates carbon and nitrogen utilization via enzyme I inhibition. Nat. Chem. Biol. 7 (12), 894–901. doi:10.1038/nchembio.685
Droste, P., Miebach, S., Niedenfuhr, S., Wiechert, W., and Noh, K. (2011). Visualizing multi-omics data in metabolic networks with the software Omix: A case study. Biosystems 105 (2), 154–161. doi:10.1016/j.biosystems.2011.04.003
Durland, R. H., Toukdarian, A., Fang, F., and Helinski, D. R. (1990). Mutations in the trfA replication gene of the broad-host-range plasmid RK2 result in elevated plasmid copy numbers. J. Bacteriol. 172 (7), 3859–3867. doi:10.1128/jb.172.7.3859-3867.1990
Duvaud, S., Gabella, C., Lisacek, F., Stockinger, H., Ioannidis, V., and Durinx, C. (2021). Expasy, the Swiss bioinformatics resource portal, as designed by its users. Nucleic Acids Res. 49 (W1), W216–W227. doi:10.1093/nar/gkab225
Espina, G., Munoz-Ibacache, S. A., Caceres-Moreno, P., Amenabar, M. J., and Blamey, J. M. (2021). From the discovery of extremozymes to an enzymatic product: Roadmap based on their applications. Front. Bioeng. Biotechnol. 9, 752281. doi:10.3389/fbioe.2021.752281
Fan, D. D., Luo, Y., Mi, Y., Ma, X. X., and Shang, L. (2005). Characteristics of fed-batch cultures of recombinant Escherichia coli containing human-like collagen cDNA at different specific growth rates. Biotechnol. Lett. 27 (12), 865–870. doi:10.1007/s10529-005-6720-8
Flores, S., de Anda-Herrera, R., Gosset, G., and Bolivar, F. G. (2004). Growth-rate recovery of Escherichia coli cultures carrying a multicopy plasmid, by engineering of the pentose-phosphate pathway. Biotechnol. Bioeng. 87 (4), 485–494. doi:10.1002/bit.20137
Funke, M., Diederichs, S., Kensy, F., Müller, C., and Büchs, J. (2009). The baffled microtiter plate: Increased oxygen transfer and improved online monitoring in small scale fermentations. Biotechnol. Bioeng. 103 (6), 1118–1128. doi:10.1002/bit.22341
Gawin, A., Valla, S., and Brautaset, T. (2017). The XylS/Pm regulator/promoter system and its use in fundamental studies of bacterial gene expression, recombinant protein production and metabolic engineering. Microb. Biotechnol. 10 (4), 702–718. doi:10.1111/1751-7915.12701
Glick, B. R. (1995). Metabolic load and heterologous gene expression. Biotechnol. Adv. 13 (2), 247–261. doi:10.1016/0734-9750(95)00004-A
Guo, A. C., Jewison, T., Wilson, M., Liu, Y., Knox, C., Djoumbou, Y., et al. (2012). Ecmdb: The E. coli metabolome database. Nucleic Acids Res. 41 (D1), D625–D630. doi:10.1093/nar/gks992
Haddadin, F. T., and Harcum, S. W. (2005). Transcriptome profiles for high-cell-density recombinant and wild-type Escherichia coli. Biotechnol. Bioeng. 90 (2), 127–153. doi:10.1002/bit.20340
Han, M. J., and Lee, S. Y. (2006). The Escherichia coli proteome: Past, present, and future prospects. Microbiol. Mol. Biol. Rev. 70 (2), 362–439. doi:10.1128/MMBR.00036-05
Haugan, K., Karunakaran, P., Tondervik, A., and Valla, S. (1995). The host range of RK2 minimal replicon copy-up mutants is limited by species-specific differences in the maximum tolerable copy number. Plasmid 33 (1), 27–39. doi:10.1006/plas.1995.1004
Hemmerich, J., Noack, S., Wiechert, W., and Oldiges, M. (2018). Microbioreactor systems for accelerated bioprocess development. Biotechnol. J. 13 (4), 1700141. doi:10.1002/biot.201700141
Hoffmann, F., and Rinas, U. (2004). “Stress induced by recombinant protein production in Escherichia coli,” in Physiological stress responses in bioprocesses. Advances in biochemical engineering (Berlin, Heidelberg: Springer), Vol. 89, 73–92.
Huang, C.-J., Peng, H.-L., Patel, A. K., Singhania, R. R., Dong, C.-D., and Cheng, C.-Y. (2021). Effects of lower temperature on expression and biochemical characteristics of HCV NS3 antigen recombinant protein. Catalysts 11 (11), 1297. doi:10.3390/catal11111297
Hunter, J. D. (2007). Matplotlib: A 2D graphics environment. Comput. Sci. Eng. 9 (3), 90–95. doi:10.1109/mcse.2007.55
Jeong, H., Kim, H. J., and Lee, S. J. (2015). Complete genome sequence of Escherichia coli strain BL21. Genome 3 (2), e00134. doi:10.1128/genomeA.00134-15
Jeong, K. J., and Lee, S. Y. (2003). Enhanced production of recombinant proteins in Escherichia coli by filamentation suppression. Appl. Environ. Microbiol. 69 (2), 1295–1298. doi:10.1128/AEM.69.2.1295-1298.2003
Jones, K. L., Kim, S. W., and Keasling, J. D. (2000). Low-copy plasmids can perform as well as or better than high-copy plasmids for metabolic engineering of bacteria. Metab. Eng. 2 (4), 328–338. doi:10.1006/mben.2000.0161
Kaur, J., Kumar, A., and Kaur, J. (2018). Strategies for optimization of heterologous protein expression in E. coli: Roadblocks and reinforcements. Int. J. Biol. Macromol. 106, 803–822. doi:10.1016/j.ijbiomac.2017.08.080
Kensy, F., Engelbrecht, C., and Buchs, J. (2009a). Scale-up from microtiter plate to laboratory fermenter: Evaluation by online monitoring techniques of growth and protein expression in Escherichia coli and Hansenula polymorpha fermentations. Microb. Cell Fact. 8, 68. doi:10.1186/1475-2859-8-68
Kensy, F., Zang, E., Faulhammer, C., Tan, R.-K., and Büchs, J. (2009b). Validation of a high-throughput fermentation system based on online monitoring of biomass and fluorescence in continuously shaken microtiter plates. Microb. Cell Factories 8 (1), 31. doi:10.1186/1475-2859-8-31
Kim, H. J., Kwon, Y. D., Lee, S. Y., and Kim, P. (2012). An engineered Escherichia coli having a high intracellular level of ATP and enhanced recombinant protein production. Appl. Microbiol. Biotechnol. 94 (4), 1079–1086. doi:10.1007/s00253-011-3779-0
Kim, H., Kim, S., and Yoon, S. H. (2018). Metabolic network reconstruction and phenome analysis of the industrial microbe, Escherichia coli BL21(DE3). PLOS ONE 13 (9), e0204375. doi:10.1371/journal.pone.0204375
Kim, S., Jeong, H., Kim, E.-Y., Kim, J. F., Lee, S. Y., and Yoon, S. H. (2017). Genomic and transcriptomic landscape of Escherichia coli BL21(DE3). Nucleic Acids Res. 45 (9), 5285–5293. doi:10.1093/nar/gkx228
Kirk, O., Borchert, T. V., and Fuglsang, C. C. (2002). Industrial enzyme applications. Curr. Opin. Biotechnol. 13 (4), 345–351. doi:10.1016/S0958-1669(02)00328-2
Konz, J. O., King, J., and Cooney, C. L. (1998). Effects of oxygen on recombinant protein expression. Biotechnol. Prog. 14 (3), 393–409. doi:10.1021/bp980021l
Korz, D. J., Rinas, U., Hellmuth, K., Sanders, E. A., and Deckwer, W. D. (1995). Simple fed-batch technique for high cell density cultivation of Escherichia coli. J. Biotechnol. 39 (1), 59–65. doi:10.1016/0168-1656(94)00143-Z
Kumar, J., Chauhan, A. S., Shah, R. L., Gupta, J. A., and Rathore, A. S. (2020). Amino acid supplementation for enhancing recombinant protein production in E. coli. Biotechnol. Bioeng. 117 (8), 2420–2433. doi:10.1002/bit.27371
Kumar, K., Venkatraman, V., and Bruheim, P. (2021). Adaptation of central metabolite pools to variations in growth rate and cultivation conditions in Saccharomyces cerevisiae. Microb. Cell Fact. 20 (1), 64. doi:10.1186/s12934-021-01557-8
Kunze, M., Roth, S., Gartz, E., and Büchs, J. (2014). Pitfalls in optical on-line monitoring for high-throughput screening of microbial systems. Microb. Cell Factories 13 (1), 53. doi:10.1186/1475-2859-13-53
Kvitvang, H. F., and Bruheim, P. (2015). Fast filtration sampling protocol for mammalian suspension cells tailored for phosphometabolome profiling by capillary ion chromatography - tandem mass spectrometry. J. Chromatogr. B Anal. Technol. Biomed. Life Sci. 998-999, 45–49. doi:10.1016/j.jchromb.2015.06.018
Kvitvang, H. F., Kristiansen, K. A., and Bruheim, P. (2014). Assessment of capillary anion exchange ion chromatography tandem mass spectrometry for the quantitative profiling of the phosphometabolome and organic acids in biological extracts. J. Chromatogr. A 1370, 70–79. doi:10.1016/j.chroma.2014.10.029
Larentis, A. L., Nicolau, J. F., Esteves Gdos, S., Vareschini, D. T., de Almeida, F. V., dos Reis, M. G., et al. (2014). Evaluation of pre-induction temperature, cell growth at induction and IPTG concentration on the expression of a leptospiral protein in E. coli using shaking flasks and microbioreactor. BMC Res. Notes 7, 671. doi:10.1186/1756-0500-7-671
Lempp, M., Lubrano, P., Bange, G., and Link, H. (2020). Metabolism of non-growing bacteria. Biol. Chem. 401 (12), 1479–1485. doi:10.1515/hsz-2020-0201
Li, Z., Nimtz, M., and Rinas, U. (2017). Global proteome response of Escherichia coli BL21 to production of human basic fibroblast growth factor in complex and defined medium. Eng. Life Sci. 17 (8), 881–891. doi:10.1002/elsc.201700036
Li, Z., and Rinas, U. (2021). Recombinant protein production-associated metabolic burden reflects anabolic constraints and reveals similarities to a carbon overfeeding response. Biotechnol. Bioeng. 118 (1), 94–105. doi:10.1002/bit.27553
Liu, M., Feng, X., Ding, Y., Zhao, G., Liu, H., and Xian, M. (2015). Metabolic engineering of Escherichia coli to improve recombinant protein production. Appl. Microbiol. Biotechnol. 99 (24), 10367–10377. doi:10.1007/s00253-015-6955-9
Losen, M., Frolich, B., Pohl, M., and Buchs, J. (2004). Effect of oxygen limitation and medium composition on Escherichia coli fermentation in shake-flask cultures. Biotechnol. Prog. 20 (4), 1062–1068. doi:10.1021/bp034282t
Lozano Terol, G., Gallego-Jara, J., Sola Martínez, R. A., Martínez Vivancos, A., Cánovas Díaz, M., and de Diego Puente, T. (2021). Impact of the expression system on recombinant protein production in Escherichia coli BL21. Front. Microbiol. 12, 682001. doi:10.3389/fmicb.2021.682001
Lu, W., Su, X., Klein, M. S., Lewis, I. A., Fiehn, O., and Rabinowitz, J. D. (2017). Metabolite measurement: Pitfalls to avoid and practices to follow. Annu. Rev. Biochem. 86, 277–304. doi:10.1146/annurev-biochem-061516-044952
Mairhofer, J., Scharl, T., Marisch, K., Cserjan-Puschmann, M., and Striedner, G. (2013). Comparative transcription profiling and in-depth characterization of plasmid-based and plasmid-free Escherichia coli expression systems under production conditions. Appl. Environ. Microbiol. 79 (12), 3802–3812. doi:10.1128/AEM.00365-13
Martins, A. C., Oshiro, M. Y., Albericio, F., de la Torre, B. G., Pereira, G. J. V., and Gonzaga, R. V. (2022). Trends and perspectives of biological drug approvals by the fda: A review from 2015 to 2021. Biomedicines 10 (9), 2325. doi:10.3390/biomedicines10092325
Mesbah, N. M. (2022). Industrial biotechnology based on enzymes from extreme environments. Front. Bioeng. Biotechnol. 10, 870083. doi:10.3389/fbioe.2022.870083
Muhamadali, H., Xu, Y., Morra, R., Trivedi, D. K., Rattray, N. J. W., Dixon, N., et al. (2016). Metabolomic analysis of riboswitch containing E. coli recombinant expression system. Mol. Biosyst. 12 (2), 350–361. doi:10.1039/C5MB00624D
Muhlmann, M., Forsten, E., Noack, S., and Buchs, J. (2017). Optimizing recombinant protein expression via automated induction profiling in microtiter plates at different temperatures. Microb. Cell Fact. 16 (1), 220. doi:10.1186/s12934-017-0832-4
Neidhardt, F. C., Ingraham, J. L., and Schaechter, M. (1990). Physiology of the bacterial cell: A molecular approach. Sinauer Associates.
Ou, J., Wang, L., Ding, X., Du, J., Zhang, Y., Chen, H., et al. (2004). Stationary phase protein overproduction is a fundamental capability of Escherichia coli. Biochem. Biophys. Res. Commun. 314 (1), 174–180. doi:10.1016/j.bbrc.2003.12.077
Overton, T. W. (2014). Recombinant protein production in bacterial hosts. Drug Discov. Today 19 (5), 590–601. doi:10.1016/j.drudis.2013.11.008
Ow, D. S.-W., Nissom, P. M., Philp, R., Oh, S. K.-W., and Yap, M. G.-S. (2006). Global transcriptional analysis of metabolic burden due to plasmid maintenance in Escherichia coli DH5α during batch fermentation. Enzyme Microb. Technol. 39 (3), 391–398. doi:10.1016/j.enzmictec.2005.11.048
Özkan, P., Sariyar, B., Ütkür, F. Ö., Akman, U., and Hortaçsu, A. (2005). Metabolic flux analysis of recombinant protein overproduction in Escherichia coli. Biochem. Eng. J. 22 (2), 167–195. doi:10.1016/j.bej.2004.09.012
Pang, Z., Chong, J., Zhou, G., de Lima Morais, D. A., Chang, L., Barrette, M., et al. (2021). MetaboAnalyst 5.0: Narrowing the gap between raw spectra and functional insights. Nucleic Acids Res. 49 (W1), W388–W396. doi:10.1093/nar/gkab382
Philip, P., Kern, D., Goldmanns, J., Seiler, F., Schulte, A., Habicher, T., et al. (2018). Parallel substrate supply and pH stabilization for optimal screening of E. coli with the membrane-based fed-batch shake flask. Microb. Cell Fact. 17 (1), 69. doi:10.1186/s12934-018-0917-8
Phue, J. N., and Shiloach, J. (2005). Impact of dissolved oxygen concentration on acetate accumulation and physiology of E. coli BL21, evaluating transcription levels of key genes at different dissolved oxygen conditions. Metab. Eng. 7 (5-6), 353–363. doi:10.1016/j.ymben.2005.06.003
Puetz, J., and Wurm, F. M. (2019). Recombinant proteins for industrial versus pharmaceutical purposes: A review of process and pricing. Processes 7 (8), 476. doi:10.3390/pr7080476
Roels, J. A. (1981). Application of macroscopic principles to microbial metabolism. Ann. N. Y. Acad. Sci. 369, 113–134. doi:10.1111/j.1749-6632.1981.tb14182.x
Rosano, G. L., and Ceccarelli, E. A. (2014). Recombinant protein expression in Escherichia coli: Advances and challenges. Front. Microbiol. 5, 172–217. doi:10.3389/fmicb.2014.00172
Rosano, G. L., Morales, E. S., and Ceccarelli, E. A. (2019). New tools for recombinant protein production in Escherichia coli: A 5-year update. Protein Sci. 28 (8), 1412–1422. doi:10.1002/pro.3668
Røst, L. M., Brekke Thorfinnsdottir, L., Kumar, K., Fuchino, K., Eide Langørgen, I., Bartosova, Z., et al. (2020a). Absolute quantification of the central carbon metabolome in eight commonly applied prokaryotic and eukaryotic model systems. Metabolites 10 (2), 74. doi:10.3390/metabo10020074
Røst, L. M., Shafaei, A., Fuchino, K., and Bruheim, P. (2020b). Zwitterionic HILIC tandem mass spectrometry with isotope dilution for rapid, sensitive and robust quantification of pyridine nucleotides in biological extracts. J. Chromatogr. B Anal. Technol. Biomed. Life Sci. 1144, 122078. doi:10.1016/j.jchromb.2020.122078
Sanchez-Trasviña, C., Flores-Gatica, M., Enriquez-Ochoa, D., Rito-Palomares, M., and Mayolo-Deloisa, K. (2021). Purification of modified therapeutic proteins available on the market: An analysis of chromatography-based strategies. Front. Bioeng. Biotechnol. 9, 717326. doi:10.3389/fbioe.2021.717326
Sanden, A. M., Prytz, I., Tubulekas, I., Forberg, C., Le, H., Hektor, A., et al. (2003). Limiting factors in Escherichia coli fed-batch production of recombinant proteins. Biotechnol. Bioeng. 81 (2), 158–166. doi:10.1002/bit.10457
Sevastsyanovich, Y. R., Alfasi, S. N., and Cole, J. A. (2010). Sense and nonsense from a systems biology approach to microbial recombinant protein production. Biotechnol. Appl. Biochem. 55 (1), 9–28. doi:10.1042/BA20090174
Sharma, A. K., Phue, J., Khatipov, E., Dalal, N., Anderson, E. D., and Shiloach, J. (2020). Effect of restricted dissolved oxygen on expression of Clostridium difficile toxin A subunit from E. coli. Sci. Rep. 10 (1), 3059. doi:10.1038/s41598-020-59978-1
Silva, F., Queiroz, J. A., and Domingues, F. C. (2012). Evaluating metabolic stress and plasmid stability in plasmid DNA production by Escherichia coli. Biotechnol. Adv. 30 (3), 691–708. doi:10.1016/j.biotechadv.2011.12.005
Simensen, V., Schulz, C., Karlsen, E., Bratelund, S., Burgos, I., Thorfinnsdottir, L. B., et al. (2022). Experimental determination of Escherichia coli biomass composition for constraint-based metabolic modeling. PLoS One 17 (1), e0262450. doi:10.1371/journal.pone.0262450
Singha, T. K., Gulati, P., Mohanty, A., Khasa, Y. P., Kapoor, R. K., and Kumar, S. (2017). Efficient genetic approaches for improvement of plasmid based expression of recombinant protein in Escherichia coli: A review. Process Biochem. 55, 17–31. doi:10.1016/j.procbio.2017.01.026
Sletta, H., Nedal, A., Aune, T. E., Hellebust, H., Hakvag, S., Aune, R., et al. (2004). Broad-host-range plasmid pJB658 can be used for industrial-level production of a secreted host-toxic single-chain antibody fragment in Escherichia coli. Appl. Environ. Microbiol. 70 (12), 7033–7039. doi:10.1128/AEM.70.12.7033-7039.2004
Sletta, H., Tondervik, A., Hakvag, S., Aune, T. E., Nedal, A., Aune, R., et al. (2007). The presence of N-terminal secretion signal sequences leads to strong stimulation of the total expression levels of three tested medically important proteins during high-cell-density cultivations of Escherichia coli. Appl. Environ. Microbiol. 73 (3), 906–912. doi:10.1128/AEM.01804-06
Stafsnes, M. H., Røst, L. M., and Bruheim, P. (2018). Improved phosphometabolome profiling applying isotope dilution strategy and capillary ion chromatography-tandem mass spectrometry. J. Chromatogr. B Anal. Technol. Biomed. Life Sci. 1083, 278–283. doi:10.1016/j.jchromb.2018.02.004
Sutay Kocabas, D., and Grumet, R. (2019). Evolving regulatory policies regarding food enzymes produced by recombinant microorganisms. Gm. Crops Food 10 (4), 191–207. doi:10.1080/21645698.2019.1649531
Szenk, M., Dill, K. A., and de Graff, A. M. R. (2017). Why do fast-growing bacteria enter overflow metabolism? Testing the membrane real estate hypothesis. Cell Syst. 5 (2), 95–104. doi:10.1016/j.cels.2017.06.005
Taymaz-Nikerel, H., Borujeni, A. E., Verheijen, P. J. T., Heijnen, J. J., and van Gulik, W. M. (2010). Genome-derived minimal metabolic models for Escherichia coli MG1655 with estimated in vivo respiratory ATP stoichiometry. Biotechnol. Bioeng. 107 (2), 369–381. doi:10.1002/bit.22802
Terpe, K. (2006). Overview of bacterial expression systems for heterologous protein production: From molecular and biochemical fundamentals to commercial systems. Appl. Microbiol. Biotechnol. 72 (2), 211–222. doi:10.1007/s00253-006-0465-8
Thorfinnsdottir, L. B., García-Calvo, L., Bø, G. H., Bruheim, P., and Røst, L. M. (2023). Optimized fast filtration-based sampling and extraction enables precise and absolute quantification of the Escherichia coli central carbon metabolome. Metabolites 13 (2), 150. doi:10.3390/metabo13020150
Tripathi, N. K., and Shrivastava, A. (2019). Recent developments in bioprocessing of recombinant proteins: Expression hosts and process development. Front. Bioeng. Biotechnol. 7, 420. doi:10.3389/fbioe.2019.00420
Veit, A., Polen, T., and Wendisch, V. F. (2007). Global gene expression analysis of glucose overflow metabolism in Escherichia coli and reduction of aerobic acetate formation. Appl. Microbiol. Biotechnol. 74 (2), 406–421. doi:10.1007/s00253-006-0680-3
Waegeman, H., and Soetaert, W. (2011). Increasing recombinant protein production in Escherichia coli through metabolic and genetic engineering. J. Ind. Microbiol. Biotechnol. 38 (12), 1891–1910. doi:10.1007/s10295-011-1034-4
Walsh, G. (2018). Biopharmaceutical benchmarks 2018. Nat. Biotechnol. 36 (12), 1136–1145. doi:10.1038/nbt.4305
Weber, J., Hoffmann, F., and Rinas, U. (2002). Metabolic adaptation of Escherichia coli during temperature-induced recombinant protein production: 2. Redirection of metabolic fluxes. Biotechnol. Bioeng. 80 (3), 320–330. doi:10.1002/bit.10380
Weber, J., Li, Z., and Rinas, U. (2021). Recombinant protein production provoked accumulation of ATP, fructose-1,6-bisphosphate and pyruvate in E. coli K12 strain TG1. Microb. Cell Fact. 20 (1), 169. doi:10.1186/s12934-021-01661-9
Wittmann, C., Weber, J., Betiku, E., Krömer, J., Böhm, D., and Rinas, U. (2007). Response of fluxome and metabolome to temperature-induced recombinant protein synthesis in Escherichia coli. J. Biotechnol. 132 (4), 375–384. doi:10.1016/j.jbiotec.2007.07.495
Worsey, M. J., and Williams, P. A. (1975). Metabolism of toluene and xylenes by Pseudomonas putida (arvilla) mt-2: Evidence for a new function of the TOL plasmid. J. Bacteriol. 124 (1), 7–13. doi:10.1128/jb.124.1.7-13.1975
Keywords: Escherichia coli, recombinant protein production, metabolic burden, central carbon metabolism, XylS/Pm, mass spectrometry, targeted metabolite profiling
Citation: García-Calvo L, Rane DV, Everson N, Humlebrekk ST, Mathiassen LF, Mæhlum AHM, Malmo J and Bruheim P (2023) Central carbon metabolite profiling reveals vector-associated differences in the recombinant protein production host Escherichia coli BL21. Front. Chem. Eng. 5:1142226. doi: 10.3389/fceng.2023.1142226
Received: 11 January 2023; Accepted: 27 February 2023;
Published: 13 March 2023.
Edited by:
Enketeswara Subudhi, Siksha O Anusandhan University, IndiaReviewed by:
Jae Ho Shin, Sartorius, GermanyZhi-Gang Jeff Qian, Shanghai Jiao Tong University, China
Copyright © 2023 García-Calvo, Rane, Everson, Humlebrekk, Mathiassen, Mæhlum, Malmo and Bruheim. This is an open-access article distributed under the terms of the Creative Commons Attribution License (CC BY). The use, distribution or reproduction in other forums is permitted, provided the original author(s) and the copyright owner(s) are credited and that the original publication in this journal is cited, in accordance with accepted academic practice. No use, distribution or reproduction is permitted which does not comply with these terms.
*Correspondence: Laura García-Calvo, bGF1cmEuZy5jYWx2b0BudG51Lm5v