 Juan Castilla-Archilla
 Maria Cermeño
 Maria G. Tuohy
 Richard J. FitzGerald
 Piet N. L. Lens
- 1School of Biological and Chemical Science, University of Galway, Galway, Ireland
- 2Department of Biological Sciences, School of Natural Sciences, University of Limerick, Limerick, Ireland
A thermal diluted acid pretreatment using brewers spent grain (BSG) was optimised to improve enzymatic hydrolysis while minimising energy and chemical inputs. First, the use of hydrochloric or sulfuric acid for pretreatment was compared, using hydrochloric acid for the next steps. Three different dilute acid thermal pretreatment combinations were optimised in terms of acid concentration, temperature and time using a response surface methodology. Optimization was based on i) highest remaining protein content in the solid fraction (C1: 0.49% HCl; 87.7°C; 92 min), ii) highest liquid recovery (C2: 0.80% HCl; 121.0°C; 142 min), iii) lowest acid concentration applied to achieve largest protein and lowest remaining solid levels (C3: 0.10% HCl; 104.0°C; 70 min); and iv) a final condition based on the lowest water retention capacity when using HCl (C4: 0.20% HCl; 121.0°C; 20 min). The efficiency of enzymatic hydrolysis was evaluated, in the absence and presence of a large concentration of reducing carbohydrates, by centrifuging the slurry after acid pretreatment, recovering the solid fraction and resuspending it in fresh water. In C2, the enzyme (Depol 40L) was added directly to the entire slurry after pretreatment. For C1, C3, and C4 direct addition of enzyme to the whole slurry resulted in a higher release of carbohydrates during hydrolysis. Only in the case of C2 did the use of the resuspended solid result in a higher carbohydrate release. The overall carbohydrate recovery efficiency in the liquid fractions for C1, C2, C3 and C4 corresponded to 399.1 (±26.1), 535.8 (±28.7), 257.0 (±11.5), and 446.3 (±81.1) mg carbohydrate per Gram of BSG (dry weight), respectively. C1 and C4 were considered the optimal pretreatments as these combined a low acid concentration and energy input prior to enzymatic hydrolysis.
1 Introduction
The increase in pollution and the dependency on fuel fossil sources has resulted in the development of new technologies for chemical and energy production. Nevertheless, the competition for feedstock with food crop production or farming land should be avoided. The use of current waste and low-value by-products of food and beverage processing can contribute to the uncoupling of fossil sources, while improving the circular economy (Cherubini et al., 2009). On the other hand, the selection of feedstock is an important step as the composition and availability through the year affects the stability of chemical and energy production during biorefining processes (Fava et al., 2015). Lignocellulosic feedstock is the largest source of solid biomass derived from side-stream waste and by-products and has a high potential to replace fossil sources (Karimi et al., 2013). Although some agricultural lignocellulosic wastes could be good candidates from a biorefining perspective, their seasonality makes their use in industrial processes difficult. Alternatively, the food and beverage industries could act as more stable sources of lignocellulosic feedstock throughout the year. For example, brewers spent grain (BSG) represents the largest solid waste from beer production, where about 15–20 kg of BSG is produced per hectolitre of beer (Mussatto et al., 2006). In Ireland, beer production in 2019 exceeded 8.2 million L (IBA, 2020), generating an estimated 170,000 tonnes of BSG.
During beer processing barley is malted, the embryo and endosperm are hydrated allowing germination and inducing the synthesis of hydrolytic enzymes that solubilise starch (Arendt and Zannini, 2013). Thus, the leftover solid fraction, BSG, is rich in cellulose and no-cellulosic polysaccharides, lignin and proteins (Mussatto et al., 2006). While hemicellulose with an amorphous structure composed of a mix of hexosans, pentosans and other components can be more easily biodegraded, cellulose has a crystalline structure that prevents microbial degradation. In addition, lignin acts as a glue to the entire structure that increases its resistance to be degraded (Karimi et al., 2013). The hydrolysis of this structure results in the release and solubilisation of the lignocellulosic biomass for further use. Nevertheless, some solubilised compounds may have inhibitory effects on downstream fermentation, such as the degradation of lignin into phenolic compounds that requires delignification prior the production of bioethanol or biobutanol (López-Linares et al., 2020; Rojas-Chamorro et al., 2020; Rojas-Perez et al., 2022). Other uses include the production of volatile fatty acids, where the mix of extracted carbohydrates, pentoses and hexoses, can be used without further pretreatment (Castilla-Archilla et al., 2021a).
From a sustainable point of view, the use of enzymes represents an advantage with lower use of chemicals and less production of inhibitory compounds from side reactions. However, the extent of lignocellulosic material enzymatic hydrolysis using carbohydrases may be limited due to the complex structure of cellulose which restricts enzyme accessibility (Niemi et al., 2012; Sibono et al., 2023). Thus, different pretreatments are used prior to enzymatic hydrolysis, such as thermal diluted acid hydrolysis (Rojas-Chamorro et al., 2020), microwave-assisted diluted acid hydrolysis (Lopez-Linares et al., 2020), steam explosion (Rojas-Perez et al., 2022), and alkaline pretreatment (Wilkinson et al., 2014). One of the most common pretreatment is diluted acid thermal hydrolysis. This involves the use of different parameters (temperature, time and acid concentration), which can be integrated into a single value known as combined severity factor (CSF) based on the Arrhenius equation for lignocellulose degradation (Chum et al., 1990). This factor is widely applied to evaluate the effectiveness of hydrolysis and carbohydrate release (Carvalheiro et al., 2004; Castilla-Archilla et al., 2020). Some of the studies working with BSG used an acid concentration ranging between 1.0%–3.0% (v/v) for soluble carbohydrate release or prior enzymatic hydrolysis (Carvalheiro et al., 2004; Lopez-Linares et al., 2020; Rojas-Chamorro et al., 2020; Wagner et al., 2021). Nevertheless, the breakdown of the complex lignocellulosic wall from a crystallinity to an amorphous structure does not necessarily result in the hydrolysis and solubilisation of carbohydrates. Changes in the lignocellulosic structure can be better monitored by the hydration dynamics of the material (Sanchez et al., 2019), such as the water retention capacity (WRC). This factor is related to the fibre configuration, where an increase in hydration represents the weakening of the hydrogen bonds of cellulose (Lara-Vazquez et al., 2014), and therefore facilitating enzymatic hydrolysis. Thus, an in-depth study is required to optimise the chemical pretreatment with the lowest CSF that subsequently allows efficient enzymatic degradation of the whole structure.
The current study investigated the combination of diluted acid thermal pretreatment using different CSFs for the breakdown of the lignocellulosic wall in BSG prior to enzymatic hydrolysis. While the use of sulfuric acid is more largely applied, this can affect the downstream fermentation process such as inhibition of biogas production outcompeting methanogens by sulfate reduction and hydrogen sulfide production (Castilla-Archilla et al., 2021b), which would require cleaning of the biogas to be used as renewable natural gas. Thus, sulfuric and hydrochloric acid was first evaluated to be used during the pretreatment step in order to determine their effectiveness under the same conditions. Thereafter, the combination of the different parameters during the diluted acid thermal pretreatment (time, temperature and acid concentration) were optimised using a response surface methodology (RSM) design to enhance the initial degradation of the lignocellulosic wall and, therefore, facilitate more efficient enzymatic hydrolysis. For this optimisation, different parameters were evaluated, including pentose release (xylose and arabinose), volume of liquid recovered and solid fraction weight as well as protein concentration in the remaining solid fraction. The efficiency of the enzymatic hydrolysis was evaluated under two different conditions: i) using the whole slurry immediately after pretreatment, or ii) a re-suspension of the pellet obtained from the centrifugation of the whole slurry in fresh water. The overall effect of the combination of pretreatment and enzymatic hydrolysis was used to calculate and compare the final carbohydrate release efficiency for each condition.
2 Material and methods
2.1 Feedstock
The BSG used for the trial was kindly supplied by a local brewery in Galway (Ireland) from the production of Irish Pale Ale beer. The BSG was collected immediately after the wort production and brought to the lab, where it was stored in 500 g bags and frozen at −20°C within 3 h of collection. The BSG was defrosted at 15°C overnight before use.
2.2 Diluted acid hydrolysis pretreatment
2.2.1 Sulfuric and hydrochloric acid comparison
The BSG was blended using distilled water in a Waring 2-Speed laboratory blender (McConnellsburg, Pennsylvania, United States of America) set at the highest speed for 1 min. The first batch of experiments tested the effectiveness of diluted acid thermal pretreatment using hydrochloric or sulfuric acid at different concentrations (0.00, 0.05, 0.10, 0.25, 0.5, 1.00 and 1.50% v/v). Sulfuric acid and hydrochloric acid were supplied from Fisher Chemical (Basingstoke, United Kingdom). A total solids (TS) concentration of 10% (w/w) BSG was used and acid pretreatment was performed in an autoclave (Sanyo Labo, Osaka, Japan) at 121°C for 20 min as described previously (Carvalheiro et al., 2004; Djioleu and Carrier, 2016). Based on these experiments, hydrochloric acid was chosen as a pretreatment option for the subsequent steps of this work.
2.2.2 Acid pretreatment optimization using response surface methodology (RSM)
Three different parameters (temperature, hydrochloric acid concentration and time) were optimised using a Box Behnken design, each at three levels (Table 1). The upper and lower values for each parameter were introduced in Minitab software v19 (Minitab, LLC) which generated 45 experimental runs (Supplementary Table S1). These experiments were performed in glass bottles with a working volume of 100 mL. Incubations at temperatures above 100°C were carried out in an autoclave (Sanyo Labo, Japan) and incubations below 100°C were carried out in a thermostatic incubator (Grant, United Kingdom).
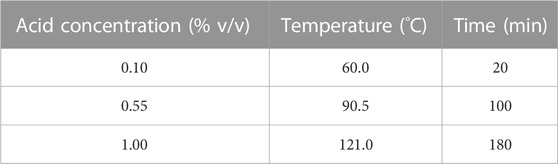
TABLE 1. Range in the parameters used in the response surface methodology for optimization of the diluted hydrochloric acid thermal pretreatment prior to enzyme addition.
The experimental data were analysed by RSM in order to determine the mathematical model for the interaction between parameters and to generate the optimal pretreatment combinations. Three different optimal conditions were used to obtain three different combinations from the RSM analysis. C1 was optimised for the highest protein content in the remaining solid fraction. C2 relies on the largest volume of hydrolysate recovery and the weight of the remaining solid fraction. C3 was optimised for the highest protein content in the pellet with the lowest solid residue while keeping the hydrochloric acid concentration at 0.10% (v/v). An additional condition not based on the RSM optimisation was added, C4, which corresponded to the conditions giving the lowest WRC when comparing the use of hydrochloric acid with sulfuric acid during the diluted acid thermal pretreatment step.
2.3 Enzymatic hydrolysis
The different combinations of hydrochloric acid concentration, temperature and time obtained (Table 2) were further tested for enzymatic hydrolysis using an enzymatic cocktail Depol 40L (kindly provided by Biocatalysts, Cardiff, United Kingdom) which contains cellulase and endogalacturonase activities. Depol 40L was added to the reactions at a final concentration of 15 cellulose units/g of BSG (TS). Two different approaches were tested to evaluate the possible inhibition of the enzymes in the presence of reducing sugars and inhibitory compounds released during the pretreatment. The first approach involved adding the enzymes directly to the whole slurry obtained after hydrochloric acid pretreatment. For the second approach, the whole slurry was centrifuged, and the pellet was re-suspended in distilled water using the same volume as the liquid recovered during the centrifugation step. The enzymatic hydrolysis was then carried out in 250 mL glass bottles (n = 6) at 50°C, under agitation at 100 rpm using a thermostatic incubator (Grant LSB Aqua Pro 18, Royston, United Kingdom) and the enzymatic reaction was allowed to proceed for 24 h. The pH was initially adjusted using NaOH to the optimal conditions for the enzymatic hydrolysis, as suggested by the manufacturer (pH 5.0); no further pH corrections were performed during the hydrolysis. Samples were taken at 0, 3, 6, 12, 18, and 24 h by aseptically removing an aliquot and samples were boiled for 5 min to inactivate the enzymes.
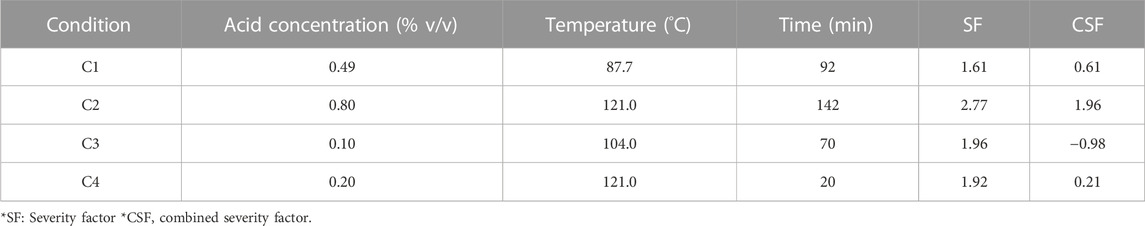
TABLE 2. Optimised parameters used for the different pretreatment prior the enzymatic hydrolysis of the brewers spent grain.
Following enzymatic hydrolysis, the solubilisation of carbohydrates and proteins was evaluated under acidic (pH 1.0) and alkaline (pH 8.0) conditions. This was carried out by subdividing the six replicates in half (n = 3 for each pH). The pH was adjusted accordingly using hydrochloric acid or sodium hydroxide (NaOH), and the samples were then maintained at 4°C overnight. The following day, the liquid fraction was recovered by centrifugation (Beckman Coulter, Allegra X-30R Centrifuge, Germany) at 4,000 relative centrifugal force (RCF–g-force) speed for 30 min at 10°C, and the supernatants were filtered using filter paper (Sigma-Aldrich, Grade 542, 150 mm diameter) to remove any remaining solid particles. The efficiency of the process was based on the amount of sugars (cellobiose, maltose, glucose, xylose and arabinose) recovered per Gram dry of BSG used (TS). The ratio between the liquid and solid fraction was also calculated to determine the efficiency of the overall hydrolysis process in terms of liquid recovered.
2.4 Analytical methods
All liquid samples obtained after acid pretreatment and enzymatic hydrolysis were analysed for monosaccharides and disaccharides (cellobiose, maltose, glucose, xylose and arabinose) using a 1,260 Infinity II liquid chromatograph (Agilent, Germany) equipped with a Hi Plex H 7.7 × 300 mm and 8 µm (p/n PL1170-6,830) column (Agilent, United Kingdom) kept at 60°C and an RI detector at 55°C. The mobile phase was sulfuric acid at a concentration of 5 mM which was run at a flow rate of 0.7 mL/min. Total protein and ammonia content were determined using a discrete nutrient analyser (Gallery Plus, ThermoFisher, Vaasa, Finland) based on a colorimetric assay as described previously at Castilla-Archilla et al. (2021a). All the solid samples were lyophilised and the protein content was determined by the Kjeldahl method using a nitrogen to protein conversion factor of 5.50 (Mariotti et al., 2019).
2.5 Calculation
The efficiency of hydrolysis was calculated based on the total sugars (cellobiose, maltose, glucose, xylose and arabinose) in i) the liquid fraction after the neutralization of the acid liquid from the pretreatment step, ii) the release of sugars during enzymatic hydrolysis, and iii) the overall process. The TS content of the samples was calculated by determining the difference between the weight of the samples before and after lyophilisation. The CSF for each of the combinations during the pretreatment step was calculated as described in Carvalheiro et al. (2004). Briefly, the severity factor was calculated based on the Arrhenius temperature behaviour (Eq. (1)) (Chum et al., 1990). Thereafter, the CSF related to the severity factor with the acid concentration used through the pH as indicator of the hydrogen ion concentration (Eq. (2)).
The WRC was calculated following Robertson et al. (2000). This represents the amount of water retained by the solid fraction after centrifugation as reported in Eq. (3):
3 Results
3.1 Pretreatment efficiency using hydrochloric and sulfuric acid
In terms of carbohydrate and protein release, pretreatment with dilute hydrochloric acid exhibited superior performance compared sulfuric acid (Figure 1A, B). When the concentration of hydrochloric acid was increased to 0.25% (v/v) the glucose, xylose and arabinose released reached similar concentrations (Figure 1A). The release of sugars using sulfuric acid was slower than that of hydrochloric acid. For sulfuric acid, the highest arabinose concentration was achieved at 0.25% and xylose at 1.0% (v/v), whereas glucose concentration was still increasing when using 1.5% v/v (Figure 1B). For solubilised proteins and ammonia, the highest concentrations and rates were also achieved with hydrochloric acid, where the highest protein concentration for hydrochloric acid pre-treatment was achieved at 0.5% (v/v) and for sulfuric acid it was at 1.0% (v/v) (Figure 1C, D).
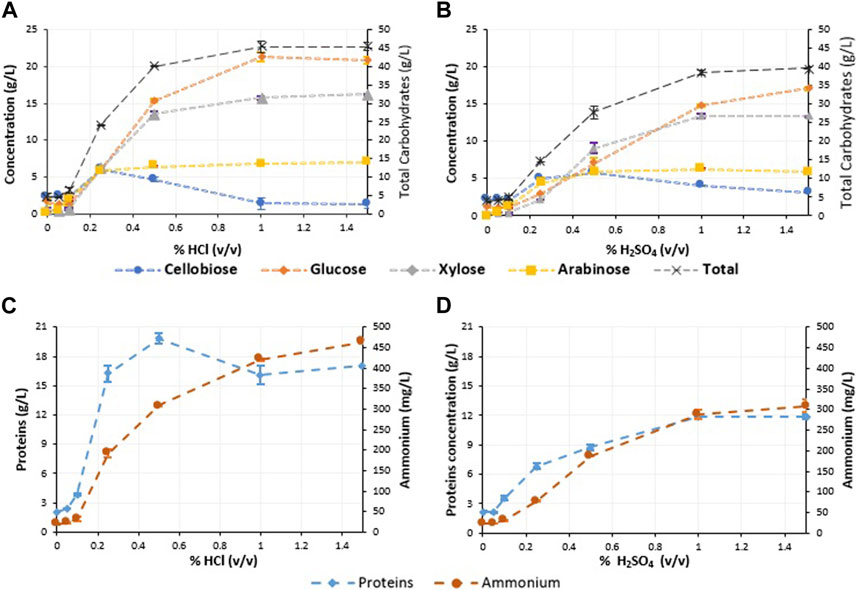
FIGURE 1. Compound characterisation in the filtered liquid fraction (20 µL) of the hydrolysis of brewers spent grain 10% TS (w/w) at 121°C for 20 min under different acid concentrations: (A) carbohydrates content corresponding to hydrochloric acid; (B) carbohydrates content corresponding to sulfuric acid; (C) proteins and ammonium concentration corresponding to hydrochloric acid; and (D) proteins and ammonium concentration corresponding to sulfuric acid.
Three different stages during the diluted acid thermal pretreatment of BSG were detected regarding the WRC while increasing the acid concentration (Figure 2A). Stage 1 corresponded to an increase of the WRC, stage 2 with a decrease, and stage 3 with an increase again in the WRC of the solid fraction. The WRC in the sulfuric acid pretreatment increased during stage 1 from 0% to 0.10% (v/v) and achieved the lowest WRC at the end of stage 2 with an acid concentration of 0.50%. For the hydrochloric acid, this increase in the WRC for stage 1 was achieved by increasing the acid concentration to 0.05%, moving after to stage 2 where the lowest WRC was reached at 0.25% hydrochloric acid (Figure 2A). In both treatments, the WRC followed a similar trend for stage 3, where the WRC increased at a higher rate for sulfuric acid.
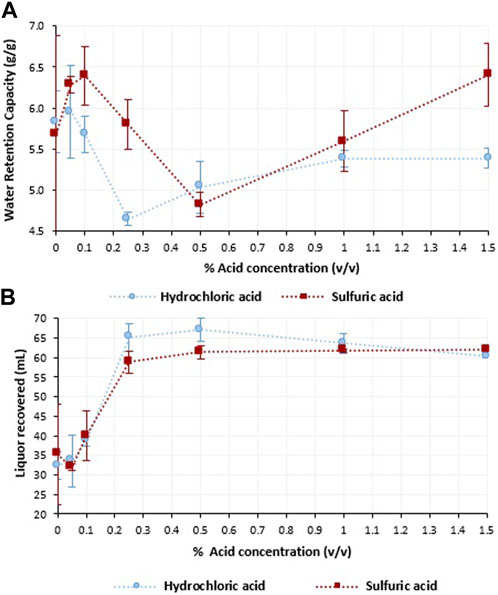
FIGURE 2. (A) Water retention capacity (gram of water per gram of total solid), and (B) liquor recovered from 100 mL, during the hydrolysis of brewers spent grain with 10% TS (w/w) carried out in an autoclave at 121°C for 20 min with hydrochloric ( ) and sulfuric (
 ) acid at different concentrations
Figure 2B shows the amount of liquor recovered from the initial 100 mL. In both cases, the highest increase in the liquid fraction recovered was from 0.05% to 0.25% (v/v) acid. The liquid fraction recovered was higher with hydrochloric than with sulfuric acid (Figure 2B). However, the liquid from the hydrochloric acid hydrolysis was lower when the acid concentration was increased from 0.25% to 1.5% (v/v), whereas the liquid recovered from sulfuric acid was almost constant with concentrations ranging from 0.5% to 1.5% (v/v) (Figure 2B).
In addition, some changes were observed in the colour of the BSG structure when the acid concentration was increased. Samples subjected to hydrochloric acid concentrations below 0.10% resulted in a liquid fraction with a milk-like colour appearance which included a top white layer (Figure 3). When the hydrochloric acid concentration was increased from 0.10% to 0.25%, the liquid fraction turned golden/brown and the top layer had a darker colour. Additionally, an increasing number of floating particles were observed upon centrifugation with higher acid concentrations (Figure 3).
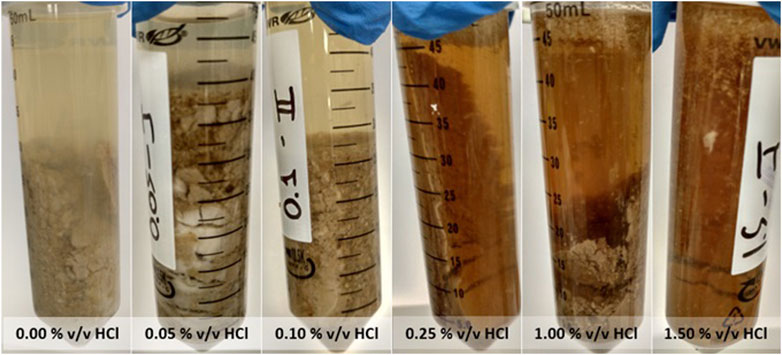
FIGURE 3. Tubes after centrifugation of the whole slurry for each of the different thermal diluted hydrochloric acid pretreatments of brewers spent grain at different acid concentrations carried at 121°C for 20 mins.
3.2 Response surface methodology (RSM)
RSM was used to evaluate the effect of three parameters (acid concentration, temperature and time) on the dilute acid thermal pretreatment process. To generate these combinations, the highest and lowest levels of the parameters were fixed, and three different values for each parameter (Table 1) were used generating 45 combinations. The outcomes evaluated in the resulting acid hydrolysates included overall total protein content, weight of the solid and total liquid fraction, as well as soluble sugars content including monosaccharide concentration and pentose concentration as arabinose and xylose.
In total, three optimised conditions were obtained after performing 45 combinations generated by the software (Supplementary Table S1). These conditions were:
C1 was the combination which achieved the maximum protein content in the pellet and was selected as an indicator for when the lignocellulosic barrier that behaves as protective wall started to break down before further release of the protein fraction (Supplementary Figure S1A), ANOVA: Supplementary Table S2). As the lignocellulosic wall behaves as a protective barrier (Ibbet et al., 2019), a decrease in the protein content of the solid fraction should take place once the protective wall started to be hydrolysed. This corresponded to a combination of 0.49% (v/v) hydrochloric acid on heating at 87.7°C for 92.7 min, and had a CSF of 0.61.
C2 was based on the largest liquid fraction and lowest amount of solids obtained within the combinations (Supplementary Figure S1B), ANOVA: Supplementary Table S3). This was related to the lowest hydration capacity of the BSG. These parameters were used to understand the extent of the possible degradation of the hydrogen bonds between cellulose that may decrease the hydration capacity. The C2 treatment corresponded to 0.80% (v/v) hydrochloric acid on heating at 121.0°C for 142 min with a CSF of 1.96.
C3 was designed by fixing the acid concentration at the lowest level tested, with the maximum of protein in the pellet fraction and the lowest solid residue (Supplementary Figure S1C), ANOVA: Supplementary Table S4). This combination was set at the following parameters, 0.10% (v/v) hydrochloric acid on heating at 104.0°C for 70 min.
In addition, condition 4 (C4) was added based on the highest WRC obtained during the initial experiment (Figure 2A). Thus, C4 was performed using a hydrochloric acid concentration of 0.20% (v/v) on heating at 121.0°C for 20 min.
3.3 Diluted acid thermal pretreatment impact on sugar released
Table 3 contains the different concentrations of sugar released for each of the conditions obtained in the RSM. Of the four conditions, C2 presented the best performance in terms of sugars solubilisation, with the highest amount of glucose and xylose released. In contrast, C3 presented the lowest soluble carbohydrate concentration with the largest amount of cellobiose. In the case of C1 and C4, the release of all carbohydrates was similar, with a slightly higher concentration in C4. C1 and C4 also released maltose, which was not present in the samples which were subjected to C2 and C3.
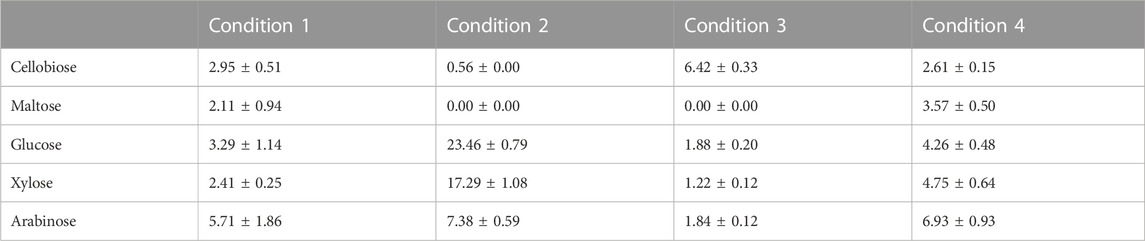
TABLE 3. Carbohydrates concentration (g/L) after diluted acid hydrolysis under different conditions.
3.4 Enzymatic hydrolysis impact on carbohydrate released
The samples resulting from the four different acid pretreatment conditions (Table 2) were subjected to enzymatic hydrolysis for 24 h in order to evaluate the degradation of complex carbohydrates. This was performed on the whole slurry after diluted acid pretreatment, and also on the resuspended solid fraction, i.e., the pellet obtained after centrifugation and resuspension in fresh water (Table 4).

TABLE 4. Increase in carbohydrate concentration after 24 h of enzymatic hydrolysis for four different pretreatment conditions.
Figure 4 shows the increase in carbohydrate concentration after enzymatic hydrolysis with Depol 40L. The highest increase in total carbohydrate for the whole slurry was observed for C1 corresponding to 23.10 (±5.11) g/L and C4 with 24.91 (±4.64) g/L (Figure 4). In addition, in the case of the whole slurry for C1 and C4 maltose was detected after diluted acid thermal pretreatment prior to enzymatic hydrolysis. For C1, maltose was fully consumed after 12 h in the whole slurry, whereas for C4 the maltose concentration increased at the beginning of the enzymatic hydrolysis, with the highest concentration achieved after 9 h, and then the concentration slightly decreased at the end of the hydrolysis (Figure 4). Whereas maltose was not present in the case of C1 and C4 for the resuspended pellet. For C2 and C3, maltose was absent in the whole slurry as well as in the resuspended pellet. In C3, the enzymatic hydrolysis of the whole slurry and the resuspended pellet resulted in a similar carbohydrate increment, 14.31 (±1.24) and 13.56 (±2.33) g/L, respectively. Likewise, C2 differed from C1 and C4 as more carbohydrates were released from the resuspended pellet with an increase of 5.17 (±1.69) g/L, whereas the increase of the whole slurry was 3.74 (±2.86) g/L. In addition, this increase in C2 for the carbohydrate concentrations was mainly due to cellobiose, as all the other types of carbohydrates maintained a similar concentration until the end of the hydrolysis step (Figure 4).
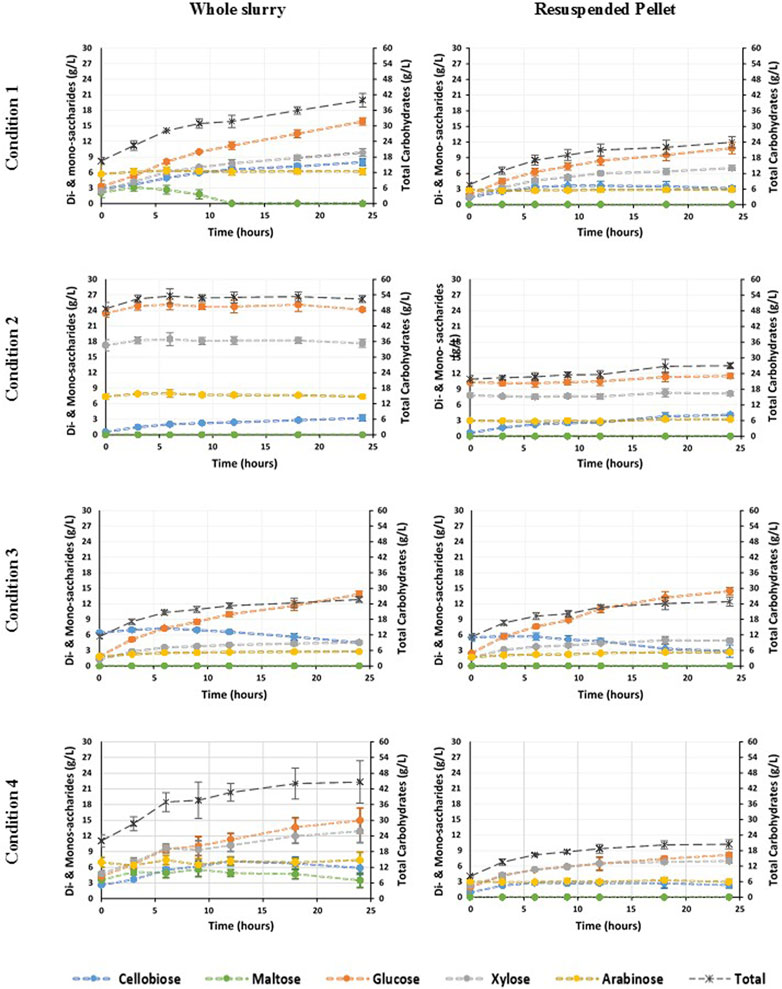
FIGURE 4. Carbohydrate release during the enzymatic hydrolysis for the four different thermal diluted acid pretreatment conditions (Table 2) of brewers spent grain. Left) Whole Slurry, and right) resuspended pellet.
For C1, C2, and C4, the concentration of cellobiose increased during the enzymatic hydrolysis, whereas it decreased in C3 (Figure 4). For all the tested conditions, arabinose was the monosaccharide with the lowest concentration. The largest increase in xylose concentration was observed when using the whole slurry for C1 and C4, whereas these values were slightly lower for the resuspended pellet (Figure 4). C1 and C4 had a similar efficiency in terms of carbohydrate released during the enzymatic hydrolysis, being slightly higher than the release of carbohydrates for C1. However, the overall efficiency of the full treatment (diluted acid pretreatment and enzymatic hydrolysis) was higher for C4 as more carbohydrates were released during the diluted acid pretreatment (Figure 4).
At the end of the enzymatic hydrolysis the samples were centrifuged and the supernatant and the pellet were recovered and weighed. The values obtained were used to calculate the ratio between the liquid and solid fraction, as an indicator for the extent of lignocellulose degradation. In addition, the influence of the pH on the ratio was studied, and therefore, samples were adjusted to acid (pH 1.0) and alkaline (pH 8.0) conditions. The lowest ratio between the liquid and solid fraction was obtained for C3, which had the lowest CSF (Table 5). In all cases where enzymatic hydrolysis was carried out using the resuspended pellet, the liquid:solid was higher under acidic pH conditions. Similarly, for all the conditions using the whole slurry the lowest liquid:solid was obtained at pH 1.0, except for C2 where the liquid:solid at alkaline pH was lower than at the acid conditions (Table 5).
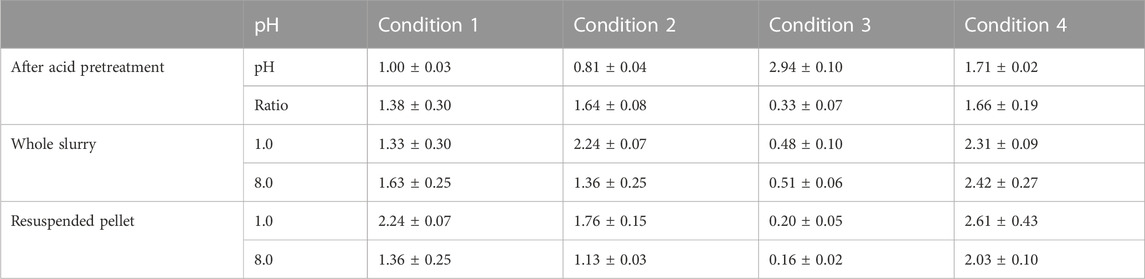
TABLE 5. pH after thermal diluted hydrochloric acid pretreatment and ratio between liquid and solid fraction of the slurry after the acid hydrolysis, whole slurry left overnight at pH 1.0 and pH 8.0, and resuspended solid left overnight at pH 1.0 or pH 8.0.
4 Discussion
The aim of the current work was to determine the highest carbohydrate release using the lowest energy and chemical consumption during the pretreatment. Different indicators were used to determine the effectiveness of the pretreatment.
4.1 Effect of acid pretreatment
4.1.1 Influence of hydrochloric and sulfuric acid
The first part of this work compared the use of sulfuric and hydrochloric acid for the diluted acid thermal hydrolysis of BSG. Sulfuric acid is the most commonly used acid for pretreatment of lignocellulosic material (Yoon et al., 2014; Zoulikha et al., 2015; Plaza et al., 2017; Tizazu and Moholkar, 2017; Rojas-Chamorro et al., 2020). However, hydrochloric acid was tested here as sulfate can present additional problems during downstream fermentation; for example, during anaerobic digestion sulfate compete with volatile fatty acid production for sulfur reduction and hydrogen sulfide production (Castilla-Archilla et al., 2021a).
Three different stages were identified in terms of the WRC for both acids (Figure 2A). Stage 1 corresponds to the degradation of the lignocellulose in an amorphous structure, resulting in an increase of the hydration capacity due to the disruption of the hydrogen bonds (Lara-Vazquez et al., 2014). In stage 1, for hydrochloric acid the highest WRC was achieved using 0.05% v/v of acid, and for the sulfuric acid the end of this stage corresponded to 0.10% v/v of acid with the highest WRC. A further increase of the severity of the hydrolysis resulted not only in the degradation of the crystalline structure of the cellulose, but also in the degradation of the polysaccharide structure into soluble sugars (Stage 2), decreasing the hydration capacity of the material (Figure 2). The third stage corresponds to a further increase of the acid concentration that would have resulted in the production of humins when working at higher CSF under acid conditions (Patil and Lund, 2011). The development of the humins by the reaction of the saccharides with other subproducts (e.g., xylose with furfural) may contribute to the rehydration capacity of the solid fraction of the material (Negahdar et al., 2016).
The use of hydrochloric acid resulted in a more efficient release of carbohydrates and proteins, degrading simultaneously cellulose (into cellobiose and glucose) and hemicellulose (into arabinose and xylose), with all of these reaching a similar concentration when using 0.25% (v/v) of hydrochloric acid (Figure 1). Whereas, sulfuric acid seems to be more selective, initially degrading hemicellulose. Therefore, when using up to 0.25% (v/v) sulfuric acid, the main sugars released corresponded to cellobiose, xylose and arabinose (Figure 1).
The chloride anion has been suggested to have a higher capacity to disrupt hydrogen bonds in lignocellulose than other acids including acetic or sulfuric (Wilkinson et al., 2014). Therefore, it may have a more extended impact for simultaneous degradation of the cellulose and hemicellulose fraction than sulfuric acid. On the other hand, the increase in sulfuric acid concentration could contribute to a more extended change of the cellulose configuration from crystalline to amorphous structure without polysaccharide degradation as no carbohydrates were solubilised. As a result, the sulfuric acid pretreatment achieved a higher WRC with a lower liquor recovery, and larger stages based on the different trend of the WRC requiring a higher acid concentration for starting to decrease and increase this again (Figure 2). Thus, the use of a lower hydrochloric acid concentration prior to enzymatic hydrolysis could have a greater benefit in comparison with sulfuric acid, through disruption of inter- and intra-chain hydrogen bonds and rendering the cellulose fraction more accessible to degradation in the enzymatic pretreatment.
4.1.2 Brewers spent grain degradation: effect of each pretreatment condition
The optimization of the pretreatment step was focused on the degradation of the crystalline structure of cellulose without the release of monosaccharides. The different parameters of the CSF (acid concentration, temperature, and time) were optimised using the RSM to develop the conditions that could lead to the most efficient enzymatic hydrolysis. C1 corresponded to the highest solid protein content achieved in the solid fraction after acid pretreatment. BSG protein is entrapped within a lignocellulosic structure, which behaves as a protective wall, once this structure is hydrolysed, the proteins are released and solubilised in the liquid fraction (Ibbet et al., 2019). Therefore, the aim was to maintain the maximum amount of protein in the pellet and solubilise only carbohydrates. C2 resulted in the release of the largest liquid fraction after pretreatment, with the lowest WRC in the solid fraction. For this point, the increase of the liquid fraction is a result of cellulose degradation, however, using harsher conditions could result in the production of other subproducts such as humins (Patil and Lund, 2011), or inhibitors such as furfural (Plaza et al., 2017).
Initially, another condition was designed to optimise the hydrolysis efficiency via the hemicellulose solubilisation by the highest increase of xylose and arabinose, but this was discarded. No decrease of pentose was detected under any of the conditions, thus, the highest xylose and arabinose concentration was achieved with the maximum parameters given to the software. Likewise, the optimal combination for glucose or total carbohydrate released corresponded to the combination with the highest acid concentration, temperature and time used during this part of the trial (1.0% (v/v) of hydrochloric acid, 121.0°C and 180 min). These conditions had a CSF of 2.13 higher than when using 1.5% hydrochloric acid at 121.0°C for 20 min. In addition, increasing the acid concentration from 1.0% to 1.5% resulted in a lesser extent of increase of the amount of carbohydrates released (Figure 1). Furthermore, some of the CSF previously evaluated in the literature using chemical hydrolysis only were lower than the CSF obtained in the current experiment when using the highest parameters in the RSM (Carvalheiro et al., 2004; Negahdar et al., 2016). Thus, the parameters with the highest xylose and arabinose release, or glucose concentration, were not used as pretreatment prior to enzymatic hydrolysis.
4.2 Performance of the enzymatic hydrolysis: efficiency and hydration capacity
The change in the structure of lignocellulose from crystalline to amorphous results in a material with higher availability for microorganisms and enzymes to degrade it (Raghavendra et al., 2004; Jeihanipour et al., 2010; Guo et al., 2018; Oliva et al., 2020). The use of a pretreatment showed an improvement on the enzymatic hydrolysis for all the different conditions in comparison with the untreated BSG with only particle side reduction (Niemi et al., 2012; Sibono et al., 2023). Furthermore, the amorphous structure of lignocellulose results in higher hydration and WRC of the solid (Lara-Vazquez et al., 2014). However, applying severe conditions to hydrolyse cellulose could lead to the degradation of monosaccharides released from hemicellulose, but may also increase the energy consumption or chemical input requirement. Thus, the different conditions developed in the previous section (C1 to C4) aimed to use a pretreatment with the lowest possible CSF, followed by enzymatic hydrolysis to achieve the largest carbohydrate release from BSG. For example, the chemical addition in terms of volume of acid added per Gram of BSG (dry matter) was lower than in previous studies. Furthermore, the amount of hydrochloric acid used in C1 and C4 corresponded to 4.9 and 2.0 mL of acid per 100 g BSG, representing a decrease in the acid consumption of between 27%–70% when compared to Plaza et al. (2017), 46%–78% (Rojas-Chamorro et al., 2020) and 83%–93% (Wagner et al., 2021).
Overall, the release of carbohydrates from the addition of the enzyme to the whole slurry was more efficient than that from the resuspended pellet, especially in the case of C1 and C4 (Table 1). The total carbohydrate release during enzymatic hydrolysis of the whole slurry was 234.4 (±39.3) and 225.04 (±81.7) mg carbohydrates per Gram of BSG (dry weight) for C1 and C4, respectively, which was 29.6% and 42.7% higher than the release for C1 and C4, respectively, when using the resuspended pellet. This higher efficiency of carbohydrate release could be explained by the washout of some solubilised or suspended saccharides in the discarded liquid fraction after centrifugation, such as colloids of small fractions of hemicellulose or starch (Hubbe and Rojas, 2008; Wilkinson et al., 2016; Wagner et al., 2021), which could have been further hydrolysed by the enzymes.
C3 presented the largest amount of water absorbed with the lowest liquid:solid (Table 5). However, this fraction showed a low carbohydrate release during enzymatic hydrolysis, where only C2 resulted in lower values. The limited enzymatic hydrolysis efficiency of C3 could be explained by an inefficient pretreatment, in which only a small fraction of the cellulose would have changed to an amorphous structure (Mosier et al., 2005; López-Linares et al., 2020). In addition, C3 with the lowest CSF had the poorest performance in terms of carbohydrate release. The pH for C3 after pretreatment corresponded to 2.94, while previous studies have determined the requirement for a pH below 2.0 for efficient degradation of the lignocellulosic material during diluted acid thermal pretreatment (Wilkinson and Cook, 2014). Thus, C3 would have allowed the degradation and decomposition of the crystalline structure on the surface of the material, where microfibril bundles were hydrolysed in a surface reaction process (Zhao et al., 2007). However, the severity of the reaction was not sufficient to carry out lignocellulose degradation, i.e., making the crystalline cellulose in the bulk inaccessible to enzymes. Thus, C3 with the lowest CSF presented the poorest performance in terms of carbohydrate release.
The enzymatic hydrolysis efficiency for C2 decreased, corresponding to the total carbohydrate release during the enzymatic hydrolysis for the whole slurry to 8.9 (±6.8)% and for the resuspended pellet to 9.4 (±4.5)%. As C2 had the highest CSF, the poor enzymatic hydrolysis efficiency may have been related to the presence of inhibitory compounds for the enzymes such as 5-hydroxymethilfurfural, levulinic acid or humins (Patil and Lund, 2011; Yoon et al., 2014; Plaza et al., 2017). Indeed, acid concentration has the most significant effect on the production of inhibitory compounds during the acid hydrolysis pretreatment (Zoulikha et al., 2015). Thus, it was expected to have a higher concentration of inhibitory compounds for C2, which had the highest CSF and had a slightly improved efficiency of enzymatic hydrolysis for the resuspended pellet compared to that of the whole slurry. It is possible that some inhibitors were washed away, and the lower initial concentration of reducing carbohydrates prior to enzymatic hydrolysis was smaller than that of the whole slurry for C1 and C4 (Figure 4). Another reason for the limited efficiency during the enzymatic hydrolysis of C2 could be related to the almost complete degradation of hemicellulose and cellulose during the pretreatment step. This could result in an increase in the interactions between cellulose microfibrils and lignin, limiting the ability of the enzyme to access and degrade cellulose (Wagner et al., 2021). Additionally, the lignin fraction of the solid could interact with the enzymes in a non-productive binding, especially with a higher adsorption capacity when operating at a lower pH (Pareek et al., 2013; Rahikainen et al., 2013). This effect increased when the enzymatic hydrolysis was performed at 50°C (Mou et al., 2021), with a higher reduction in the efficiency activity of xylanase and cellulase, whereas ß-glucosidase is the least affected enzyme (Berlin et al., 2006). All of these factors could explain the limited enzymatic efficiency of C2, with mainly cellobiose released.
The results of the present work for C1, C3, and C4 differ from previous studies that attribute the lower efficiency of enzymatic hydrolysis not only to inhibitor compound production, but also to the release of reducing carbohydrates during diluted acid thermal pretreatment (Yoon et al., 2014; Plaza et al., 2017; Wagner et al., 2021). While C2 presented a similar CSF to these studies, the CSF for C1, C3 and C4 was lower comparing to that in the combination (temperature, acid concentration and time) used in these reports. For example, Plaza et al. (2017) obtained a more efficient enzymatic hydrolysis using a washed pellet than the whole slurry after diluted acid pretreatment of BSG by decreasing the pH to 1.0 using sulfuric acid at 121°C for 20 min. Similarly, Wagner et al. (2021) extracted only 37.26 mg of glucose per Gram of BSG (dry weight) during enzymatic hydrolysis after diluted acid pretreatment using 2% sulfuric acid (v/v) for 15 min at 121°C. In the present work when using the whole slurry, the efficiency in C1 corresponded to 125.6 (±36.5) mg glucose per Gram of BSG (dry weight), and for C4 corresponded to 106.87 (±31.1) mg glucose per Gram of BSG (dry weight).
This suggests the possibility of using hydrochloric acid with a lower chemical consumption for optimal pretreatment prior to enzymatic hydrolysis, which results in a liquid with a high concentration of carbohydrates. Further analysis of the solid fraction of the selected conditions could be carried out for a deeper characterisation and valorisation of the solids. Furthermore, the downstream fermentation of the liquid fraction for production of commodities products and co-products (e.g., lactic ethanol, ethanol or carboxylic acid) or energy (e.g., hydrogen or renewable biogas) can be further optimised to maximise the valorisation of the BSG.
5 Conclusion
This study evaluated and optimised the diluted acid thermal pretreatment process of BSG prior enzymatic hydrolysis. First, the use of sulfuric and hydrochloric acids was evaluated, which showed hydrochloric acid a more extended degradation of the lignocellulose structure in terms of WRC, as well as resulting in cellulose and hemicellulose degradation. Thus, the use of hydrochloric acid was evaluated under different combinations of time, temperature and acid concentration as CSF using a Box Behnken design. The parameters used for this optimisation were based on indicators for the degradation of the lignocellulosic structure while minimising the use of acid and energy requirement. From there, three different conditions were obtained plus an extra condition based on the hydration capacity of the solid obtained when comparing both acids. The enzymatic hydrolysis was carried out under two different conditions, i) using the whole slurry and ii) recovering the solid pellet after pretreatment and resuspending this in fresh water. For C1 and C4 the use of the whole slurry resulted in a higher release of carbohydrates than the resuspended pellet. During enzymatic hydrolysis two of the conditions were considered inefficient, C2 because the high CSF where mainly all the carbohydrates were released during the pretreatment and may have resulted in the production of inhibitory compounds. The second inefficient pretreatment, i.e., C3, with a lesser extent of the pretreatment limiting the carbohydrate release during enzymatic hydrolysis. C1 uses a higher acid concentration with a lower energy input, while the C4 acid concentration was lower but with a higher energy requirement. Both conditions, C1 and C4, allowed for the direct enzymatic hydrolysis after the diluted acid thermal pretreatment without removing the liquid fraction and washing the pellet. From a biorefinery perspective, the latter two conditions show promising results as they optimise the chemical and energy inputs.
Data availability statement
The raw data supporting the conclusion of this article will be made available by the authors, without undue reservation.
Author contributions
JC-A: Conceptualization, Data curation, Investigation, Methodology, Writing–original draft. MC: Conceptualization, Data curation, Software, Writing–review and editing. MT: Investigation, Software, Writing–original draft, Writing–review and editing. RF: Conceptualization, Methodology, Writing–review and editing. PL: Conceptualization, Methodology, Writing–review and editing.
Funding
The author(s) declare financial support was received for the research, authorship, and/or publication of this article. This work was supported by the Science Foundation Ireland (SFI) Research Professorship Programme Innovative Energy Technologies for Biofuels, Bioenergy and a Sustainable Irish Bioeconomy (IETSBIO3, award no. 15/RP/2763), the Research Infrastructure research grant Platform for Biofuel Analysis (Grant Number 16/RI/3401) and the Department of Foreign Affairs (DFA) under the SDG challenge project Floating Treatment Wetland, supporting teams to develop solutions addressing challenges under UN SDG3: Good Health and Wellbeing (grant No SFI/21/FIP/SDG/9933). Funding for this research was provided to Prof Richard J. FitzGerald and Maria Cermeño under the National Development Plan 2007–2013, through the Food Institutional Research Measure (FIRM), administered by the Department of Agriculture, Food and Marine, Ireland under grant issue 15/F/647.
Conflict of interest
The authors declare that the research was conducted in the absence of any commercial or financial relationships that could be construed as a potential conflict of interest.
Publisher’s note
All claims expressed in this article are solely those of the authors and do not necessarily represent those of their affiliated organizations, or those of the publisher, the editors and the reviewers. Any product that may be evaluated in this article, or claim that may be made by its manufacturer, is not guaranteed or endorsed by the publisher.
Supplementary material
The Supplementary Material for this article can be found online at: https://www.frontiersin.org/articles/10.3389/fceng.2023.1272988/full#supplementary-material
References
Arendt, E., and Zannini, E. (2013). “Barley,” in Cereal grains for the food and beverage industries, 155–201e. doi:10.1533/9780857098924.155
Berlin, A., Balakshin, M., Gilkes, N., Kadla, J., Maximenko, V., Kubo, S., et al. (2006). Inhibition of cellulase, xylanase and β-glucosidase activities by softwood lignin preparations. J. Biotechnol. 125 (2), 198–209. doi:10.1016/j.jbiotec.2006.02.021
CarvalheiroDuarte, F. L. C., Medeiros, R., and Gírio, F. M. (2004). Optimization of Brewery's spent grain dilute-acid hydrolysis for the production of pentose-rich culture media. Appl. Biochem. Biotechnol. 115 (1-3), 1059–1072. doi:10.1385/ABAB:115:1-3:1059
Castilla-Archilla, J., Papirio, S., and Lens, P. N. L. (2021a). Two step process for volatile fatty acid production from brewery spent grain: hydrolysis and direct acidogenic fermentation using anaerobic granular sludge. Process Biochem. 100, 272–283. doi:10.1016/j.procbio.2020.10.011
Castillla-Archilla, J., Heiberger, J., Mills, S., Hilbig, J., Collins, G., and Lens, P. N. L. (2021b). “Continuous volatile fatty acid production from acid brewery spent grain leachate in expanded granular sludge bed reactors.” Front. Sustain. Food Syst. 5, 129. doi:10.3389/fsufs.2021.664944
Chum, H. L., Johnson, D. K., Black, S. K., and Overend, R. P. (1990). Pretreatment-Catalyst effects and the combined severity parameter. Appl. Biochem. Biotechnol. 24 (1), 1–14. doi:10.1007/BF02920229
Djioleu, A., and Carrier, D. J. (2016). Effects of dilute acid pretreatment parameters on sugar production during biochemical conversion of switchgrass using a full factorial design. J. ACS Sustain. Chem. Eng. 4 (8), 4124–4130. doi:10.1021/acssuschemeng.6b00441
F. Cherubini, G. Jungmeier, M. Wellisch, T. Willke, I. Skiadas, R. V. Reeet al. (Editors) (2009). “Modeling and analysis,” Toward a common classification approach for biorefinery systems. 3. doi:10.1002/bbb.172
Guo, Z., Ling, Z., Wang, C., Zhang, X., and Xu, F. (2018). Integration of facile deep eutectic solvents pretreatment for enhanced enzymatic hydrolysis and lignin valorization from industrial xylose residue. Bioresour. Technol. 265, 334–339. doi:10.1016/j.biortech.2018.06.027
Hubbe, M., and Rojas, O. (2008). Colloidal stability and aggregation of Lignocellulosic materials in aqueous suspension: a review. BioResources 3 (4), 1419–1491.
IBA (2020). Irish beer market report 2020. Available at: https://www.ibec.ie/drinksireland/-/media/documents/drinks-ireland-new-website/beer/beer-market-report-2020.pdf (Accessed on May 29, 2021).
Ibbett, R., White, R., Tucker, G., and Foster, T. (2019). Hydro-mechanical processing of brewer's spent grain as a novel route for separation of protein products with differentiated techno-functional properties. Innovative Food Sci. Emerg. Technol. 56, 102184. doi:10.1016/j.ifset.2019.102184
Jeihanipour, A., Karimi, K., and Mohammad Taherzadeh, J. (2010). Enhancement of ethanol and biogas production from high-crystalline cellulose by different modes of NMO pretreatment. Biotechnol. Bioeng. 105 (3), 469–476. doi:10.1002/bit.22558
Karimi, K., Shafiei, M., and Kumar, R. (2013). “Progress in physical and chemical pretreatment of lignocellulosic biomass,” in Biofuel technologies: recent developments. Editors V. K. Gupta, and M. G. Tuohy (Berlin, Heidelberg: Springer Berlin Heidelberg), 53–96.
Lara-Vázquez, A. R., Quiroz-Figueroa, F. R., Sánchez, A., and Valdez-Vazquez, I. (2014). Particle size and hydration medium effects on hydration properties and sugar release of wheat straw fibers. Biomass Bioenergy 68, 67–74. doi:10.1016/j.biombioe.2014.06.006
López-Linares, J. C., Teresa García-Cubero, M., Lucas, S., and Coca, M. (2020). Integral valorization of cellulosic and hemicellulosic sugars for biobutanol production: ABE fermentation of the whole slurry from microwave pretreated brewer's spent grain. Biomass Bioenergy 135, 105524. doi:10.1016/j.biombioe.2020.105524
Mosier, N., Wyman, C., Dale, B., Elander, R., Lee, Y. Y., Holtzapple, M., et al. (2005). Features of promising technologies for pretreatment of lignocellulosic biomass. Bioresour. Technol. 96 (6), 673–686. doi:10.1016/j.biortech.2004.06.025
Mou, H., Wu, X., Huang, J., Liu, Y., and Fan, H. (2021). Eucalyptus lignin modification for dynamic adsorption with lignocellulose-degradation enzymes dependent on pH values. Industrial Crops Prod. 169 (113650), 113650. ISSN 0926-6690. doi:10.1016/j.indcrop.2021.113650
Mussatto, S. I., Dragone, G., and Roberto, I. C. (2006). Brewers' spent grain: generation, characteristics and potential applications. J. Cereal Sci. 43 (1), 1–14. doi:10.1016/j.jcs.2005.06.001
Negahdar, L., Delidovich, I., and Palkovits, R. (2016). Aqueous-phase hydrolysis of cellulose and hemicelluloses over molecular acidic catalysts: insights into the kinetics and reaction mechanism. Appl. Catal. B Environ. 184, 285–298. ISSN 0926-3373. doi:10.1016/j.apcatb.2015.11.039
Niemi, P., Tamminen, T., Smeds, A., Viljanen, K., Ohra-aho, T., Holopainen-Mantila, U., et al. (2012). Characterization of lipids and lignans in brewer’s spent grain and its enzymatically extracted fraction. J. Agric. Food Chem. 60 (39), 9910–9917. doi:10.1021/jf302684x
Oliva, A., Tan, L. C., Papirio, S., Esposito, G., and Lens, P. N. L. (2020). Effect of methanol-organosolv pretreatment on anaerobic digestion of lignocellulosic materials. Renew. Energy 169, 1000–1012. doi:10.1016/j.renene.2020.12.095
Pareek, N., Gillgren, T., and Jönsson, L. J. (2013). Adsorption of proteins involved in hydrolysis of lignocellulose on lignins and hemicelluloses. Bioresour. Technol. 48, 70–77. ISSN 0960-8524. doi:10.1016/j.biortech.2013.08.121
Patil, S. K. R., and Lund, C. R. F. (2011). Formation and growth of humins via aldol addition and condensation during acid-catalyzed conversion of 5-hydroxymethylfurfural. Energy & Fuels 25 (10), 4745–4755. doi:10.1021/ef2010157
Plaza, P. E., Gallego-Morales, L. J., Peñuela-Vásquez, M., Lucas, S., García-Cubero, M. T., and Coca, M. (2017). Biobutanol production from brewer’s spent grain hydrolysates by Clostridium beijerinckii. Bioresour. Technol. 244, 166–174. doi:10.1016/j.biortech.2017.07.139
Raghavendra, S. N., Rastogi, N. K., Raghavarao, K. S. M. S., and Tharanathan, R. N. (2004). Dietary fiber from coconut residue: effects of different treatments and particle size on the hydration properties. Eur. Food Res. Technol. 218, 563–567. doi:10.1007/s00217-004-0889-2
Rahikainen, J. L., Evans, J. D., Mikander, S., Kalliola, A., Puranen, T., Tamminen, T., et al. (2013). Cellulase–lignin interactions—the role of carbohydrate-binding module and pH in non-productive binding. Enzyme Microb. Technol. 53 (5), 315–321. doi:10.1016/j.enzmictec.2013.07.003
Rojas-Chamorro, J. A., Romero, I., López-Linares, J. C., and Castro, E. (2020). Brewer’s spent grain as a source of renewable fuel through optimized dilute acid pretreatment. Renew. Energy 148, 81–90. doi:10.1016/j.renene.2019.12.030
Rojas-Pérez, L. C., Narváez-Rincón, P. C., and Ballesteros, I. (2022). Improving sugar extraction from brewers’ spent grain using sequential deproteinization and acid-catalyzed steam explosion in a biorefinery context. Biomass Bioenergy 159, 106389. ISSN 0961-9534 Sanchez et al., 2019. doi:10.1016/j.biombioe.2022.106389
Tizazu, B. Z., and Moholkar, V. S. (2017). Kinetic and thermodynamic analysis of dilute acid hydrolysis of sugarcane bagasse. Bioresour. Technol. 250, 197–203. doi:10.1016/j.biortech.2017.11.032
Wagner, E., Pería, M. E., Ortiz, G. E., Rojas, N. L., and Ghiringhelli, P. D. (2021). Valorization of brewer's spent grain by different strategies of structural destabilization and enzymatic saccharification. Industrial Crops Prod. 163, 113329. doi:10.1016/j.indcrop.2021.113329
Wilkinson, S., Smart, K. A., and Cook, D. J. (2014). Optimisation of alkaline reagent based chemical pre-treatment of Brewers spent grains for bioethanol production. Industrial Crops Prod. 62, 219–227. doi:10.1016/j.indcrop.2014.08.036
Wilkinson, S., Smart, K. A., James, S., and Cook, D. J. (2016). Maximising high solid loading enzymatic saccharification yield from acid-catalysed hydrothermally-pretreated brewers spent grain. Biofuel Res. J. 3 (2), 417–429. doi:10.18331/BRJ2016.3.2.7
Yoon, S. Y., Han, S. H., and Shin, S. J. (2014). The effect of hemicelluloses and lignin on acid hydrolysis of cellulose. Energy 77, 19–24. doi:10.1016/j.energy.2014.01.104
Zhao, H., Kwak, J. H., Zhang, Z. C., Brown, H. M., Arey, B. W., and Holladay, J. E. (2007). Studying cellulose fiber structure by SEM, XRD, NMR and acid hydrolysis. Carbohydr. Polym. 68 (2), 235–241. ISSN 0144-8617. doi:10.1016/j.carbpol.2006.12.013
Keywords: acid pretreatment, enzymatic hydrolysis, brewers spent grain, lignocellulose degradation, optimization, carbohydrate release
Citation: Castilla-Archilla J, Cermeño M, Tuohy MG, FitzGerald RJ and Lens PNL (2023) Brewers’ spent grain pretreatment optimisation to enhance enzymatic hydrolysis of whole slurry and resuspended pellet. Front. Chem. Eng. 5:1272988. doi: 10.3389/fceng.2023.1272988
Received: 05 August 2023; Accepted: 27 November 2023;
Published: 12 December 2023.
Edited by:
Ali Hussain Motagamwala, Shell, United StatesReviewed by:
Izaskun Dávila, University of the Basque Country, SpainNaveenkumar Rajendran, University of Wisconsin-Madison, United States
Copyright © 2023 Castilla-Archilla, Cermeño, Tuohy, FitzGerald and Lens. This is an open-access article distributed under the terms of the Creative Commons Attribution License (CC BY). The use, distribution or reproduction in other forums is permitted, provided the original author(s) and the copyright owner(s) are credited and that the original publication in this journal is cited, in accordance with accepted academic practice. No use, distribution or reproduction is permitted which does not comply with these terms.
*Correspondence: Juan Castilla-Archilla, anVhbmNhc3RpbGxhYXJjaGlsbGFAZ21haWwuY29t