 Marta García-Prats
 Daniel González
 Antoni Sánchez
- Composting Research Group (GICOM), Department of Chemical, Biological and Environmental Engineering, Universitat Autònoma de Barcelona, Barcelona, Spain
Anaerobic digestion (AD) is a wide-spread strategy to manage organic waste and recover valuable products but faces some limitations that could be overcome with additives like biochar (BC). The production of BC defines its properties, which in turn determine its effect on AD performance and methane yield. In this study, three biochars (BC1, BC2 and BC3) were characterized using several techniques (SEM imaging, BET, GC, ICP and FTIR). The properties of BC were found to be defined both by the feedstock and the production process. The BC were then applied to the AD of the organic fraction of municipal solid waste (OFMSW) using three doses (1, 5% and 10% w/w TS). Compared to the control, there was an increase in methane production in BC3 at doses 1% and 5% (+15 and +30%, respectively) and a decrease in BC1 and BC2 at 1% (−33% and −19%, respectively). The decrease in biogas production was often paired with an increased methane content. A two-way ANOVA analysis showed that the interaction of biochar dose and type had a significant effect on methane yield, meaning that the effect of BC on AD cannot be predicted with the dose or the type alone. When a second substrate feeding was performed, no significant differences on methane production were observed among the experimental conditions. Key aspects to properly assess the economic viability of the process have been also discussed. Further experiments could help to fill knowledge gaps and clarify the roles of BC characteristics and dose on AD performance.
Highlights
Anaerobic digestion is a widely established technology to treat organic waste.
Biochar addition could solve some of the main limitations of anaerobic digestion.
The feedstock plays a key role in defining biochar properties and is often overlooked.
Both the dose and the characteristics of the biochar influence methane production.
Many factors are involved in determining the economic viability of adding BC to AD.
1 Introduction
With the world’s population and economy constantly increasing, meeting energy demands and managing waste have become two of the greatest challenges of modern society. In 2022, 9,263 MT (56 kg/habitant) of the organic fraction of municipal solid waste (OFMSW) were collected in Catalonia (Spain) (ARC, 2022), and its availability and abundance are expected to increase over the next years, as institutions globally opt for more sustainable organic waste management (European Commission, 2020). In Catalonia, almost all the OFMSW is processed in mechanical-biological treatments (MBT) (ARC, 2022), which combine the mechanical separation of the different fractions with the stabilization of organic matter through biological processes such as anaerobic digestion or composting (Montejo et al., 2013).
Anaerobic digestion (AD) is an efficient, economical, and widely established technology to treat organic waste while recovering energy (biogas) and producing a value-added fertilizer (digestate) (Valentin et al., 2023), which can be directly applied to the soil or further processed through composting to obtain a higher-quality product (compost). However, it faces several challenges, including low methane productivity, long retention time, low organic loading rate (OLR), instability related to ammonia and acid inhibition, and metal accumulation (Pramanik et al., 2019; Kumar et al., 2021; Zhao et al., 2021). One of the strategies used to improve AD is the incorporation of additives such as microbial inoculant, enzymes, biological metabolites, carbon-based additives, chelating agents, and nanoparticles (Parra-Orobio et al., 2023).
Biochar (BC) is a carbon-rich solid generated from waste biomass (agricultural and forestry residues, OFMSW, waste activated sludge, etc.) through thermochemical processes at high temperature (350ºC–950°C) under anoxic/anaerobic conditions (pyrolysis, gasification, and hydrothermal carbonization) (Zhao et al., 2021; Bardi et al., 2023; Nie et al., 2024). Among its characteristics are a relatively high surface area (SA), favorable porosity, abundant oxygen-containing functional groups, high cation exchange capacity (CEC), and good electrical conductivity (EC) (Kumar et al., 2021). These properties make it a great adsorbent and a promising sustainable alternative to traditional fossil-based activated carbons. BC has been widely used for pollutant removal both in gaseous and liquid streams. In gaseous streams it is known for its ability to adsorb carbon monoxide (CO) and dioxide (CO2), nitrogen (NOx) and sulfur oxides (SOx), volatile organic compounds (VOC) and gaseous elemental mercury (Hg) (Wen et al., 2023). In wastewater, it has been used for the removal of numerous pollutants including antibiotics (Krasucka et al., 2021), dyes (Zhang et al., 2024) and heavy metals (Chen et al., 2020). In recent years, it has also been proven to be useful for many other applications such as agronomy, anaerobic digestion, composting, water treatment, soil remediation and carbon sequestration (Osman et al., 2022).
Regarding AD, there are several mechanisms in which BC can help overcome the main process limitations and improve overall performance. The salts and nutrients present on the BC surface increase the buffering capacity of the AD system (Bardi et al., 2023). Its porous structure and surface functional groups make BC a great adsorbent, helping mitigate inhibition by contaminants and remove biogas impurities (CO2, H2S) (Kumar et al., 2021). Besides, it serves as a support for biomass immobilization and the formation of microbial biofilms, which offers shelter to microorganisms, reduces the lag phase, and helps develop syntrophic metabolisms among anaerobic microbes (Chiappero et al., 2020; Bardi et al., 2023). Biofilm formation, together with EC and surface functional groups, promotes direct interspecies electron transfer (DIET) between methanogenic and acetogenic microorganisms (Wang et al., 2018; Shi et al., 2023). The addition of BC in AD also increases the elemental composition of the digestate, enhancing its quality as fertilizer (Kumar et al., 2021); the use of BC as fertilizer is widely reported in the bibliography as well (Osman et al., 2022). All improvements in process stability and microbial activity translate into higher CH4 production, which in turn reduces dependence on additional biogas cleaning and upgrading processes (Chiappero et al., 2020).
The main advantage of biochar is that it can be “tailor-made” controlling the feedstock and the main process parameters (temperature and activation/modification methods) in order to obtain a material with the desired physicochemical characteristics for AD (or any other application) (Chiappero et al., 2020; Bardi et al., 2023). Overall, it seems like the costs of biochar supplementation could be balanced with the increased energy production from AD (Chiappero et al., 2022). The economic feasibility of the process is subject to the price of BC, which depends on the feedstock and the energy price, but is relatively cheap (0.2–0.5 USD/kg) compared to similar carbon-based additives like granular activated carbon (0.6–20 USD/kg) (Chiappero et al., 2020). However, it is still a nascent technology and there is a lack of consensus on many major topics. The BC doses tested in the literature range from 1 to over 30 g/L and are reported with multiple units (g/L, g/day, % w/w, TS ratio, etc.) (Chiappero et al., 2020), with recent meta-analyses obtaining opposite results on whether the best results on methane yield are obtained with higher or lower doses (Xiao et al., 2021; Chiappero et al., 2022). Further research is also needed on the factors determining BC properties and the mechanisms through which BC can potentially improve AD.
The goal of this work is to study the effect of BC addition on the AD of the OFMSW, focusing both on the dose and the characteristics of the BC. This is one of the few works analyzing the role of BC in AD using the OFMSW as a substrate because its high heterogeneity poses some difficulties from an experimental point of view compared to other organic wastes such as sewage sludge and manure (Chiappero et al., 2020), although it is also the cause of many of the aforementioned instability problems that limit optimal AD performance (Xu et al., 2018). Moreover, no studies have been performed so far that analyze the combined effect of BC dose and characteristics on AD performance. This novel dual approach is based on the idea that the same amount of BC may affect the AD process differently depending on the characteristics thereof. Substrate re-feeding was performed to study the adaptation of the AD system to BC, which is also unprecedented. Last, most experimental works either focus on the development of BC characteristics during its synthesis, or the mechanisms in which those characteristics affect AD. This work gives a general understanding of the whole process using the link between BC production, characteristics, and functionality as a backbone.
2 Materials and methods
2.1 AD substrate and inoculum
The substrate and inoculum of anaerobic digestion were obtained from a full-scale MBT plant located in Granollers (Barcelona, Spain) that treats about 45,000 tons per year of source selected OFMSW. The substrate is the material obtained after the OFMSW goes through a pre-treatment to remove impurities and a set of pulpers to homogenize the mixture. The inoculum was obtained from a 3,000 m3 digester operating in wet and mesophilic conditions with a residence time of approximately 15 days.
The substrate was obtained twice, in October and November, and the inoculum once, in October. The substrate was kept at 4°C to avoid the degradation of organic components. The inoculum was maintained under starving conditions for 1 week to remove any biodegradable organic matter and was kept at 37°C to ensure the survival of the microbial populations. Both the substrate and the inoculum were sieved to eliminate the particles over 1 mm and reduce the heterogeneity, and were characterized before and after the sieving to ensure the composition was not significantly altered. Table 1 shows the physicochemical properties of the substrates and the inoculum, which were determined according to standard methods (TMECC, 1997).
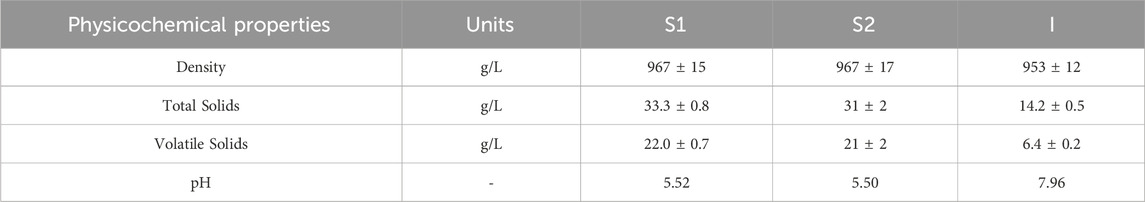
Table 1. Physicochemical properties of the two substrates (S1 and S2) and the inoculum (I).
2.2 Biochar characterization
Five biochars produced from forestry biomass were gently provided by several manufacturers around Europe. Due to limitations in the number of experiments, three biochars (BC1, BC2 and BC3) were selected, which had desirable properties for AD, but at the same time presented diversity in their production process and characteristics. The most relevant information is shown in Table 2, although the full table with all the characteristics given by the manufacturers can be found in the Supplementary Table S1. All the biochars were sieved to a particle size ranged between 710 μm and 1.6 mm to avoid the size differences significantly affecting the results. The BCs were kept at room temperature and dried in the oven at 105°C for 24 h before the experiment to ensure that the same amount of all the biochars was added despite the differences in humidity (TS and moisture values found in Supplementary Table S2).
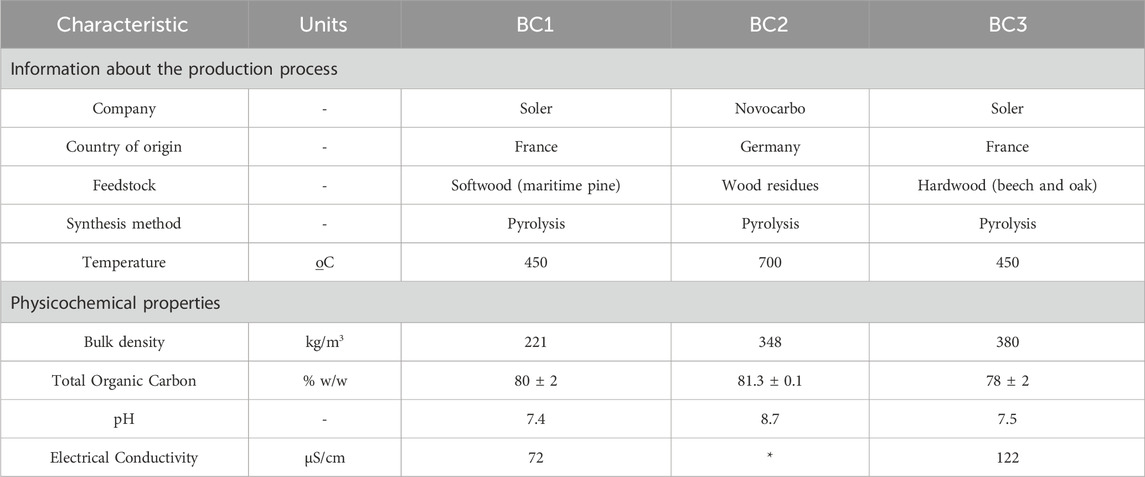
Table 2. Characteristics of the three selected biochars (BC1, BC2, BC3) provided by the manufacturers (fields marked with an asterisk (*) are unknown/not provided).
The characterization analyses were done at SAQ (Servei d’Anàlisi Química de la UAB) (https://www.uab.cat/ca/servei-analisi-quimica). Microscopic images of the biochars were taken using a Scanning Electron Microscope (Merlin FE-SEM). In order to measure surface area and pore size, samples of the BCs were degassed at 80°C for 20 h and analyzed with nitrogen adsorption/desorption at −196°C using a Brunauer–Emmett–Teller (BET) analyzer (ASAP 2020 Micrometrics Inc.).
Quantitative determination of C, H, N and S in solid samples was done by combustion of BC samples at 1200°C in an oxygen atmosphere and subsequent quantification by Gas Chromatography (GC) (CHNS Thermo Scientific Flash 2000 Elemental Analyzer). The standard, Sulfanilamide STD (PN33825100 from ThermoFisher Scientific) is NIST traceable (Certificate Elemental Analysis Standard and Reference Material 282005–03/08/2017) and was stored at room temperature in the desiccator.
Semiquantitative estimation of inorganic elements was carried out by Inductively Coupled Plasma Mass Spectroscopy (ICP-MS) (Agilent, 7,900 model). First, 0.1 g samples of the BCs were weighted (Mettler Toledo XPE205DR Analytical Balance) and digested with a mixture of HNO3 and HCl for 24 h in a microwave oven (Milestone Microwave Digester, Ultrawave model). After digestion, a slightly white solid remained. The determination by ICP-MS was continued with the supernatant and the semi-quantitative estimation of the measuring solutions was done using the molar response vs. atomic weight curve.
Surface functional groups were analyzed using a Fourier-transform Infrared (FTIR) spectrometer (Alpha II Bruker, United States) with a Diamond Crystal ATR (Attenuated Total internal Reflectance) accessory. The BC samples were placed directly on the diamond crystal plate and the transmittance data were analyzed with Opus 7.8 software.
2.3 Anaerobic digestion assays
All the anaerobic digestion assays were performed in 250 mL glass serum bottles with 150 mL of liquid and 100 mL of air headspace. Each assay was conducted in triplicate independent experiments. The bottles were incubated at 37°C and manually stirred twice a week for 22 days. After that, some bottles were re-fed and incubated for another 22 days (44 days in total).
2.3.1 Batch assays
Biochemical methane potential (BMP) tests were conducted following Angelidaki et al. (2009) and adapting the protocols from Barrena et al. (2023). A total of 12 experimental conditions were prepared (Table 3). Substrate and inoculum were added in a 2:1 ISR (inoculum to substrate ratio) based on VS (Volatile Solids), which accounted for 130 mL of inoculum and 20 mL of substrate. In the bottles where there was no substrate (Blank and Cellulose), 20 mL of water were added instead, and the latter contained 0.3 g of cellulose. The blank test was performed to subtract biogas production from any biodegradable organic matter contained in the inoculum, and the cellulose control is required by the BMP standard to ensure the inoculum is in good condition. The three selected biochars (BC1, BC2 and BC3) were added in three different doses (1, 5% and 10% w/w) based on the TS (Total Solids) of the substrate and the inoculum, which accounted for 24, 121 and 242 mg of biochar, respectively; giving up to nine combinations. Dose selection was made with the aim to observe a significant effect of BC, while avoiding inhibitory effects and saving costs in large-scale application. The doses were based on TS in order to be reproducible in other scenarios. A control with substrate and inoculum alone was prepared to compare biogas production with sample tests. All the bottles were sealed with a 2 mm rubber septum and aluminum caps and the headspace was purged with nitrogen gas for 2 min to ensure anaerobic conditions.
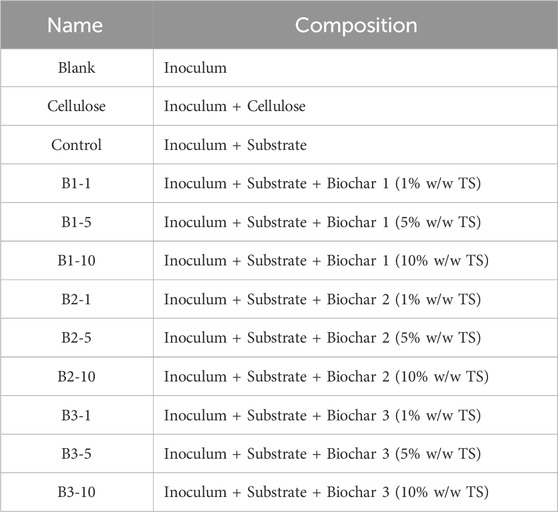
Table 3. Composition of the experimental conditions tested in the anaerobic assays.
2.3.2 Sequential batch assays
Once the biogas production reached a steady state (day 22), which was ensured with similar results of biogas production and methane content for three consecutive measuring days, the second addition of substrate was performed in the selected bottles (C, B2-1, B2-5, B2-10, B3-1, B3-5 and B3-10). The volume of substrate needed for the re-feeding was calculated using the characterization of the second substrate to maintain the 2:1 ISR; as the substrates were very similar (view Table 1), the added volume was the same (20 mL). To keep the same headspace volume, 20 mL of liquid were removed from the bottles prior to the substrate addition. The liquid was removed from the top part without mixing the bottles to avoid taking microorganisms or solids sedimented on the bottom. The bottles were constantly pumped with nitrogen gas during the process and the headspace was purged with nitrogen gas for 1 min after the procedure to ensure anaerobic conditions.
2.3.3 Biogas production and composition analysis
The test methodology to determine the anaerobic biogas production was adapted from the German standard DIN-38414 and can be found in Casals et al. (2014). The biogas production was measured as headspace pressure with a high-precision manometer (bars with 2 decimals) and was later transformed into volume considering normal conditions using the ideal gas law. After the measurement, the pressure all the bottles were purged with a syringe. The biogas content in methane (CH4) and carbon dioxide (CO2) was analyzed using a Hewlett Packard Chromatograph (HP 5890) equipped with a thermal conductivity detector (TCD) and a Supelco Porapack Q (250 °C) 3 m × 1/8″ column. The sample volume was 100 μL, the carrier gas was helium at 338 kPa, and the temperatures of oven, injector and detector were 70, 150°C and 180 °C, respectively. The CH4 and CO2 content were normalized to 100% and used to calculate the methane production (mL of CH4/g VS). The results are shown as the average value from the three replicas with the corresponding standard deviation.
2.3.4 Statistical treatment of data
The influence of the biochar type and dose on the AD of the OFMSW was assessed through analysis of variance (ANOVA) tests. One-way ANOVA with α = 0.05 was used to compare within each type of biochar (BC1, BC2 and BC3) the effect of the dose (1, 5% and 10%, with control being 0% in all cases) on methane production (mL CH4/g VS) and methane content (%) at steady-state (d22 and d44). Significant differences between the subgroups were identified though all pairwise multiple comparison procedures using the Tukey Test with α = 0.05. Two-way ANOVA with α = 0.05 was performed to analyze the combined effect of BC dose (factor 1: levels 1, 5% and 10%) and type (factor 2: levels BC1, BC2 and BC3) on methane production (mL CH4/g VS) at steady-state (d22 and d44). In this case, the control was excluded from the analysis as the main goal was to determine whether the effect of a specific BC dose on AD depends on the biochar that is being added. Significant differences between the subgroups were identified though all pairwise multiple comparison procedures using the Holm-Sidak method with α = 0.05. All statistical analyses were conducted using SigmaPlot.
3 Results and discussion
3.1 AD substrate and inoculum characterization
The physicochemical characteristics found in Table 1 show pH values consistent with the literature for both substrates (5.50–5.52) and the inoculum (7.69) (Campuzano and González-Martínez, 2016; Alghashm et al., 2023). The TS and VS of the substrate (31–33 and 21–22 g/L, respectively) are below the typical values for the OFMSW (Campuzano and González-Martínez, 2016) due to the addition of water in the pretreatment of the OFMSW, which reduces the concentration of solids and in turn affects the TS and VS of the inoculum (14.2 and 6.4 g/L, respectively). Still, they are consistent with previous values obtained from the Granollers waste plant. The OFMSW is known to be highly biodegradable, with a Dynamic Respiration Index (DRI) of 4.8 g O2 kg-1 of organic matter h-1 (Colón et al., 2012). The methane yield of the cellulose control (298 ± 17 mL CH4/g cellulose) is below the Theorical Methane Yield (TMY) of cellulose (415 mL CH4/g cellulose), which could indicate that the inoculum was not in great condition. Last, the results of the two substrates (S1 and S2) are really similar thanks to the pretreatment of the OFMSW at the MBT plant, but they cannot be considered identical, as their composition is unknown. This is realistic in terms of how a real scale digestor works but poses some experimental limitations when comparing results that will be discussed later on.
3.2 Biochar characterization
Biochar characterization studies have two main focuses. One is analyzing how the BC properties are defined by their production and, therefore, how the physicochemical process (Pecchi and Baratieri, 2019), temperature (Bardi et al., 2023) and activation methods (Nie et al., 2024) can be used as engineering tools to obtain a material with the desired properties. The other is assessing how the BC properties determine the improvement on methane yield to define the optimal values of the key parameters (Xiao et al., 2021; Chiappero et al., 2022). These studies materialize the link between BC production, characteristics, and functionality, which is the backbone of this work, and open the door to tailoring biochar with the desired properties for each application.
3.2.1 Biochar production
From the information given by the manufacturers (Table 2) it can be seen that all biochars were produced through pyrolysis. The production process of BC1 and BC3 is presumably identical, as they were provided by the same manufacturer, and was carried out at high temperature (700°C), while BC2 was produced at lower temperature (450°C). High pyrolysis temperatures (500°C–1000°C) have been related with increased SA, porosity, C content, ash content, pH and EC, while low pyrolysis temperatures (300°C–500°C) favor surface functional groups, H, O and N content and pore size (Chen et al., 2017; Zhao et al., 2018; Bardi et al., 2023; Nie et al., 2024). The data provided supports some of these correlations, with BC2 having a higher pH (8.7) than BC1 and BC3 (7.4 and 7.5, respectively) and a slightly higher TOC (81.3% compared to 80 and 78, respectively).
All three biochars are produced from lignocellulosic biomass. The thermal stability of lignin is known to preserve the microporous structure during pyrolysis, resulting in BC with larger SA and porosity compared to other feedstocks like sludge and manure (Chiappero et al., 2022). The exact raw materials are known for BC1 and BC3 (maritime pine and beech and oak, respectively) but unknown for BC2 (wood residues). However, no further details on the characteristics of the feedstocks are given in any case, and their effect on BC properties and AD performance is almost not found in the literature.
There is no information on whether BCs have undergone activation methods. They can be used to improve the adsorption capacity by increasing SA and porosity (physical adsorption) or surface functional groups and metal oxides (chemical adsorption) (Chiappero et al., 2020), but their effect is less studied than that of the process temperature because they are more expensive (Masebinu et al., 2019).
3.2.2 Microscopic images
The scanning electron microscope (SEM) images presented in Figure 1 show that biochar is a very porous material with a high surface area, which explains its utility as an adsorbent and a support for microbial growth. The three biochars display differences in the number, size, shape, and distribution of the microporous structures. The pore size, shape, and distribution of BC1 and BC2 is much more homogeneous than that of BC3. It is noteworthy that BC1 and BC3 look considerably different despite being produced with the exact same process, which is previously reported in the literature (Chiappero et al., 2021) and highlights the key role that the feedstock plays on defining the BC characteristics. Morphological differences could also be seen at the macroscopic scale (images found in Supplementary Figure S1).
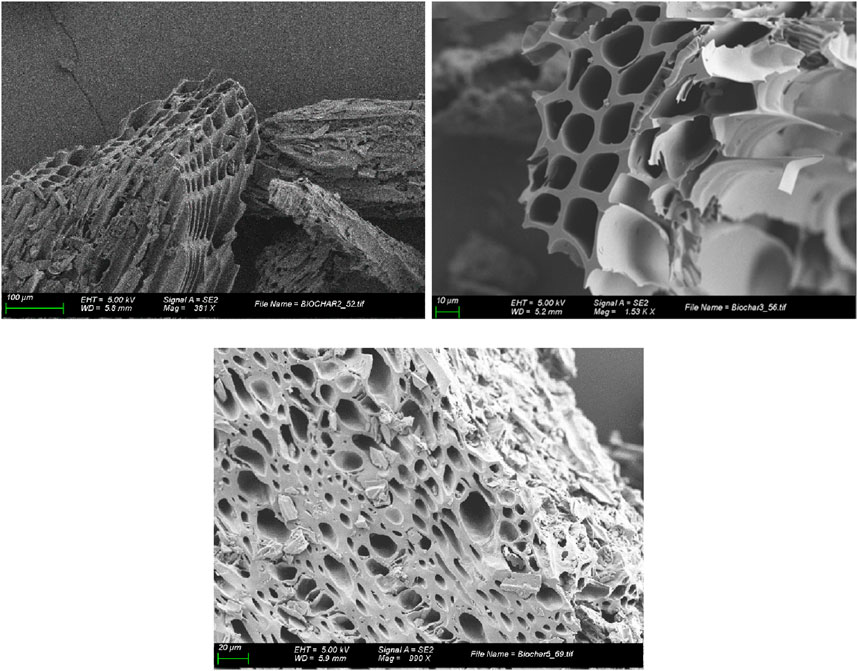
Figure 1. Microscopic images of the three selected biochars (top left: BC1, top right: BC2, bottom: BC3). Obtained with a scanning electron microscope (SEM).
3.2.3 Brunauer–Emmett–Teller (BET) analysis
BET analysis was used to determine SA and pore size (Table 4). The reported SA values of BC vary from 1 to 100 m2/g for non-activated BC depending on pyrolysis temperature and feedstock and they can reach 1,000 m2/g after activation (Chiappero et al., 2020). The values of the three biochars are within the ranges of non-activated BC but follow an unexpected trend: BC3>BC2>BC1. According to the literature previously referenced, it would be expected that BC2 (produced at 700°C) had a higher SA and a lower pore size than BC1 and BC3 (produced at 450°C). It would also be expected that BC1 and BC3 had more similar results, since they have been produced through the same process. The differences between BC1 and BC3 are most certainly due to the feedstocks. BC2 is probably a mixture of different species, which could be an explanation of the intermediate values between BC1 and BC3 obtained for SA and pore size. If this was the case, the feedstock used for BC production would be much more important to determine BC properties than it is currently considered and its description should go further than a classification in broad groups like lignocellulosic biomass or hardwood/softwood, including information about its characteristics such as the elemental composition and microporous structure.

Table 4. Characteristics of the three biochars (BC1, BC2, BC3) obtained from BET (Brunauer–Emmett–Teller) analysis.
3.2.4 Elemental composition
The elemental composition of the biochars in C, H, N and S was analyzed through gas chromatography (GC) (Table 5). BC2 has a greater N content than BC1 and BC3, and a slightly higher C content and lower H content, while no significant levels of S were detected in any case. At pyrolysis temperatures over 450°C, elements like H, O and N tend to volatilize, thus reducing their content, the amount of surface groups bearing those elements and the H/C and O/C molar ratios, while increasing the C content (Chiappero et al., 2022). This reduces BC polarity and increases aromatization, which has consequences on BC functionality because it hinders its adsorption capacity and the ability to mediate electron transfer (Masebinu et al., 2019; Nie et al., 2024). The temperature difference could explain the higher C content (77.42%) and lower H content (2.41%) of BC2 compared to BC1 and BC3 (71.5%–74.4% and 2.72%–2.78%, respectively), but does not explain the higher N content (more than double). Two possible answers for that would be: a) the feedstock used to produce BC2 (wood residues) is richer in N than that of BC1 and BC3, or b) BC2 was activated through N-doping. The addition of N during activation has been used to improve the microporous structure and the amount of N-containing functional groups of biochar, thus enhancing CO2 and H2S removal from biogas (Ma et al., 2021). However, the SA and pore size results discussed previously (Table 4) are indicative of non-activated BC and, therefore, the most plausible hypothesis is a feedstock with higher N content.
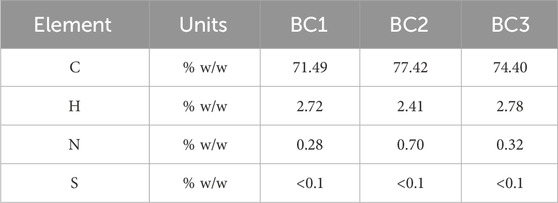
Table 5. Elemental composition in carbon (C), hydrogen (H), nitrogen (N) and sulfur (S) of the three biochars (BC1, BC2, BC3) obtained from gas chromatography (GC).
ICP (Inductively Coupled Plasma) spectroscopy was used to further analyze the elemental composition of the biochars. BC2 showed the highest content in inorganic compounds, with considerable amounts of Ca (18,436.3 μg/g), K (6,047.7 μg/g), Si (3,140.3 μg/g), Mn (1,784.9 μg/g), Mg (1,729.1 μg/g), Fe (1,300.4 μg/g) and Al (1,121.4 μg/g). BC3 had a relevant content of Ca (9,664.7 μg/g) and K (3,817.3 μg/g), and BC1 only of K (1,828.4 μg/g). The concentration of macro-elements such as Ca, K and Mg depends largely on the feedstock composition and the pyrolysis temperature; Ca concentration has been found to increase with the temperature due to the precipitation of Ca-containing oxides, hydroxides, and carbonate mineral phases (Ippolito et al., 2020). This explains the overall richer composition in macro-elements of BC2 and the greater concentration of Ca. The full elemental composition can be found in Supplementary Table S3.
3.2.5 Fourier-transform infrared (FTIR) spectroscopy
The IR-spectra obtained by FTIR spectroscopy from the three biochars (Figure 2) was compared with reference values (Janu et al., 2021; IR-Spectra Table, 2024) to identify surface functional groups. The first notable thig is the closer resemblance of the BC2 and BC3 spectra compared to BC1, proving once again that BC properties are not only defined by the production process and temperature. BC1 and BC3 displayed surprisingly big peaks in the region between 3,000 and 3,500 cm-1 wavelengths corresponding to -OH stretching. However, these were most certainly due to moisture (Supplementary Table S2), as BC1 and BC3 had quite high moisture contents (45% and 22%, respectively) proportional to the size of the peaks. BC2 had no peak in that region due to the comparably low moisture content (7%) and the volatilization of O and H at the high temperatures in which it was produced. BC2 has a peak around 1,000–1,200 cm-1 corresponding to amino groups (C-N), which probably account for most of the N-content found previously (Table 5). All three biochars have a small peak close to 2,870 cm-1, corresponding to aliphatic groups (-CHx) and BC1 and BC3 have peaks around 1,100–1,300 cm-1 corresponding to ester groups (C-O-C), which could indicate the presence of carbohydrates in the biochars. BC2 and BC3 have peaks close to 1,475 cm-1 and BC2 has peaks below 1,000 cm-1 all corresponding to alkenes (C=C), which are commonly generated during pyrolysis as elements that are less resistant volatilize and aromatic structures condense (Janu et al., 2021).

Figure 2. IR-spectra of the three biochars (top: BC1, middle: BC2, bottom: BC3) obtained through Fourier-Transform Infrared (FTIR) spectroscopy.
One conclusion from the characterization is that development of the BC properties is heavily conditioned by the feedstock, although they can later be modified during the production process (temperature, activation methods, etc.). Bardi et al. (2023) emphasized that putting too much attention on the production process while selecting the feedstock based on availability or proximity is counter-productive from an economical and environmental point of view. For example, resources spent on activation methods to increase N-containing functional groups in BC could be saved by simply choosing a N-rich feedstock.
Based on the previous characterization, the most desirable biochars would be BC2 –it has the highest pH for the buffering capacity and the greatest content in C, N, and macro-nutrients for the microbial growth and digestate quality–and BC3 –it has the largest SA and pore size for biofilm formation and contaminant absorbance–. Interestingly, the meta-analyses conducted by Xiao et al. (2021) and Chiappero et al. (2022) correlating BC properties with AD performance from hundreds of experiments found results that contradict general knowledge on BC and AD. For instance, the former found the greatest effects on methane yield in BC with low pH (<7.0) and low SA (<10 m2/g), while the latter found no significant effects on either parameter. However, they both agreed on BC addition to AD having a positive effect on methane production.
3.3 Anaerobic digestion assays
The AD of the OFMSW with three biochars (BC1, BC2 and BC3) at different doses (1, 5% and 10%) was monitored for 22 days (biogas production, methane content and methane production). Once the methane production reached a steady state, a second addition of substrate was performed, and the process was monitored for 22 more days (44 days in total) to simulate a sequential batch reactor (SBR). This was done to see whether the microorganisms had adapted to the presence of BC and, once new substrate was available, the process yielded better results. The selected reactors for the sequential batch assays were those containing BC2 and BC3 (all doses) because they showed two different outcomes of the first feeding, and the control to have a base methane production to compare the samples with. The data of methane production (mL CH4/g VS) and methane content (%) at the end of the batch (day 22) and the sequential batch (day 44) assays can be found in the Supplementary Table S5, S8), together with the results of the normality (Supplementary Table S4,S7) and ANOVA (Supplementary Table S6, S9) tests. The results of the two feedings cannot be compared with each other, comparisons can only be made among the experimental conditions of the same feeding, because two different batches of the OFMSW were used.
3.3.1 Batch assays
The cumulative methane production (mL CH4/g VS) for each biochar (BC1, BC2 and BC3) compared to the control are presented in Figure 3A,B,C, respectively. The results of the blank and the cellulose control can be found in Supplementary Figure S2. The first remarkable point is the absence of a lag phase in all cases; the degradation of the OFMSW through AD and the consequent biogas production starts at a high speed from the beginning. In other additives such as nanoparticles (NPs), the microbial populations may need time to adapt to the foreign material (Casals et al., 2014), which lengthens the lag phase and can make the process longer even if the final methane production is higher than the control. Liu et al. (2024) created a public database collecting the BMP of many organic substrates (https://bmp.wmdatabase.cn/webdatabase/auth/login). For food waste (FW), equivalent of the OFMSW, the maximum methanogenic potential ranges from 250 to 500 mL CH4/g VS, which shows the heterogeneity of the OFMSW as a substrate of AD. The yield of our control is in the lower end of that range (248 ± 18 mL CH4/g VS), which is consistent with the low results from the cellulose control that could be due to the inoculum state. However, the absence of a lag phase and the relatively short time needed to reach the steady state (22 days) indicate that the process was not majorly inhibited and took place in fairly good conditions.
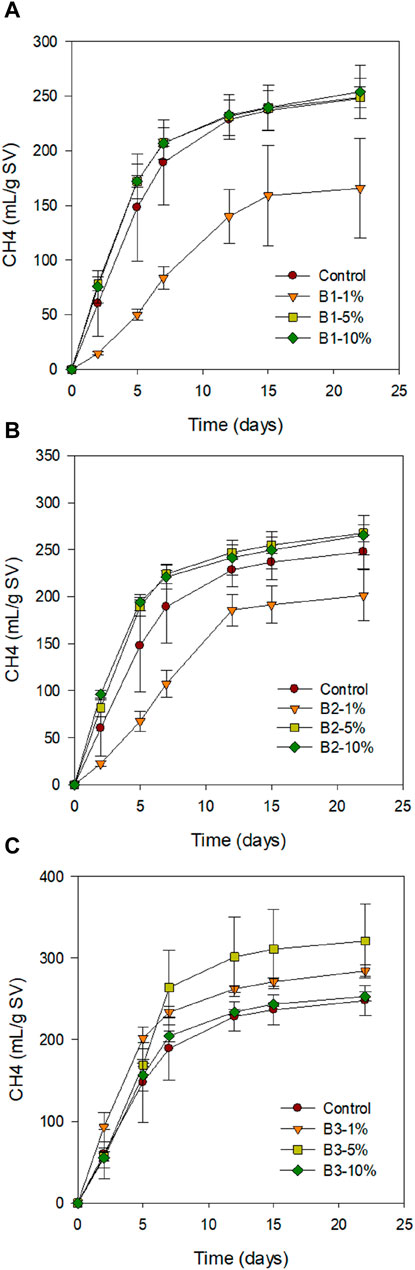
Figure 3. Accumulated methane production (mL CH4/g VS) of the biochars (A): BC1, (B) BC2, (C) BC3) at different doses (1, 5, 10%) compared to the Control during the batch assays.
All experimental conditions followed a similar trend, with most of the methane being produced during the first 9 days, peaking on day 2–5 and reaching steady state by day 22. Most conditions did not show significant differences compared to the control, except for two cases. On one hand, B1-1 and B2-1 showed a significant decrease in methane production of −30% and −19%, respectively (Figures 3A,B). This apparent inhibition concurred with a smaller peak at day 2–5 and a second peak around day 12. This trend is not so common, as negative effects would be expected to increase along with the concentration of BC, and not the other way around. Inhibitory effects of BC on AD have been reported with excessive doses of BC that widely exceed those evaluated in this study, mostly due to nutrient adsorption and microbial activity inhibition (M. Zhang et al., 2019; Shen et al., 2016). The fact that BC1 and BC2 at higher doses (5% and 10%) were not significantly different from the control, and that BC3 at 1% was not inhibitory either, indicate that the inhibition is probably not caused by the biochar, or at least not alone. One reason would be a difference in the composition of the OFMSW in the reactors due to the high heterogeneity of the OFMSW and the small volume of substrate used (15 mL). On the other hand, B3-1 and B3-5 showed a significant increase in methane production of +8 and +19%, respectively (Figure 3C). This trend is more in line with the results found in the literature; the beneficial effects of BC on AD increase along with the dose until it surpasses a limit value (in this case, somewhere between 5% and 10%) and then the effect diminishes (B3-10 is not significantly different from the control) until BC becomes inhibitory. This outcome confirms that the selected range of BC doses was optimal in order to address the variety of effects that BC can have on AD (positive, negative and null). The opposed effect of BC1/BC2 and BC3 on methane yield at 1% is in line with previous findings, as Chiappero et al. (2021) described that the same dose of BC under the same experimental conditions could have enhancing or inhibitory effects on methane production (from +22 to −46%) depending on the physicochemical properties of the biochars. In this case, the biochar that produced the highest results in terms of methane production (BC3) was the one with the largest SA, which was also found by Zhang et al. (2019) in a similar study.
The methane content (%) at steady state (day 22) for all experimental conditions (control and biochars) is presented in Figure 4. Interestingly, the conditions with a lower methane production (B1-1 and B2-1) had a slightly but significantly higher methane content (+8 and +6%, respectively) compared to the control. This phenomenon is frequently reported and is explained by the fact that high biogas production rates exceed BC CO2 adsorption rate, thus rendering a lower CH4 content in biogas (Shen et al., 2016). However, this slight increase in methane content did not compensate the greater decrease in biogas production. Overall, the biogas composition was quite uniform in all conditions, and the differences in methane production were mostly due to differences in biogas production.
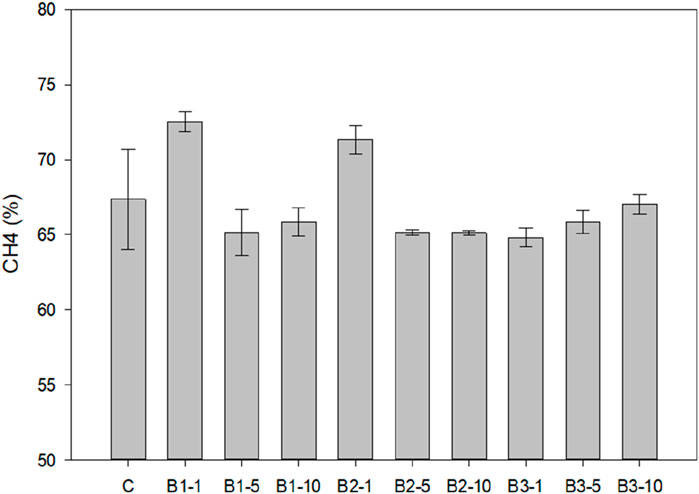
Figure 4. Methane content (%) of all the experimental conditions at the end of the batch assays (day 22).
Focusing on the BC type-dose interaction, a two-way ANOVA analysis was performed (Figure 5) to determine whether the differences in methane production were mostly explained by the BC type, the dose, or a combination of the two. Only a few studies have analyzed the effect of BCs with different physicochemical characteristics with the same operating conditions, and they all used sewage sludge as a substrate (Zhang et al., 2019; Chiappero et al., 2021). To our knowledge, no similar studies have been performed using the OFMSW as substrate nor considering both the dose and the type of the BC. The results show that there is a statistically significant interaction between the factors Dose and Type (p = 0.008). This means that the effect of a BC type or dose on methane production cannot be properly interpreted alone, as the effect of a specific BC type depend on which dose is used, and vice versa. It is a statistical confirmation of the experimental results discussed previously (Figure 3). It cannot be stated that a 1% dose of BC is inhibitory to AD based on BC1 and BC2 results because it was not for BC3. Similarly, BC3 cannot be considered the best biochar overall because it yielded better results than BC1 and BC2 at doses one% and 5% but was not significantly different at 10%. Still, BC3 had the most common dose-effect relationship and was not inhibitory at any dose, so it would be selected as the best BC to work with in the future.
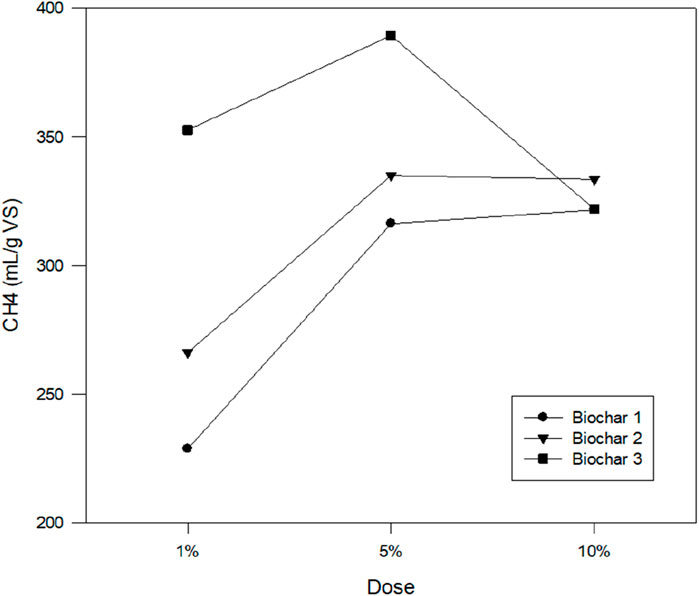
Figure 5. Least square means for biochar dose (1, 5% and 10%) and type (BC1, BC2 and BC3) obtained from the two-way ANOVA analysis (α = 0.05) performed with the methane production (mL CH4/g VS) results at the end of the batch assays (day 22).
Chiappero et al. (2021) conducted a principal component analysis (PCA) to determine the key physicochemical properties related to BC improvement of AD performance. They found that methane production was correlated with C/O and C/H molar ratios and VS, while biogas production had a positive correlation with SA, pore volume and C content, and a negative correlation with ash content. This is again consistent with the fact that the biochar with the largest SA (BC3) yielded the highest methane production. Interestingly, methane and biogas production were not correlated to each other, meaning that a higher biogas production is not necessarily coupled with a higher methane content, as it can also be seen in these results. Finally, the BC types were differently distributed on the PCA plot, which indicates that the effect of each BC on AD is determined by different parameters depending on their characteristics; for example, if a BC has an extremely low pH its effect on AD will be mainly determined by this parameter and not others.
3.3.2 Sequential batch assays
The cumulative biogas production (mL CH4/g VS) of BC2 and BC3 compared to the control are presented in Figures 6A,B, respectively. After the second feeding, there was not a lag phase either and biogas production started at high speed from the moment that the new substrate was available to the microbial populations, indicating that the AD system operates under optimal conditions. The performance of the control was very similar to that of the first feeding (248 ± 5 mL CH4/g VS), indicating that the OFMSW are quite similar although the exact composition is unknown. Again, all experimental conditions followed a similar trend; most of the methane was produced during the first 10 days, peaking on day 3 and reaching steady state by day 22 (day 44 in total). B2-1 production was a bit delayed and reached its maximum methane production on day 6, even though the inhibition was much smaller than in the first feeding (see slope difference in the first and the second feeding). At the end of the sequential batch assays, no significant differences in methane production were found among conditions (p > 0.05); the positive results of B3-1 and B3-5 and the negative results of B2-1 and B2-5 in the first feeding did not replicate in the second feeding. This could be evidence that the cause of the inhibition was present in the OFMSW, as it did not persist when the same BCs and a new batch of substrate were added. Another explanation would be that the microbial populations had adapted to what was causing inhibition from the BC and therefore, performed better when it was added again; microbial acclimatation has been proven to be a key step for the application of other additives in AD like nanoparticles (Barrena et al., 2021). The methane content (%) at steady state (day 44) for all experimental conditions (BC2, BC3 and control) is presented in Figure 7. Overall, all the samples had a similar biogas composition. Only B2-1, which showed a slightly slower AD process, had a significantly higher methane content than the control (+6.4%), in line with the phenomenon previously explained.
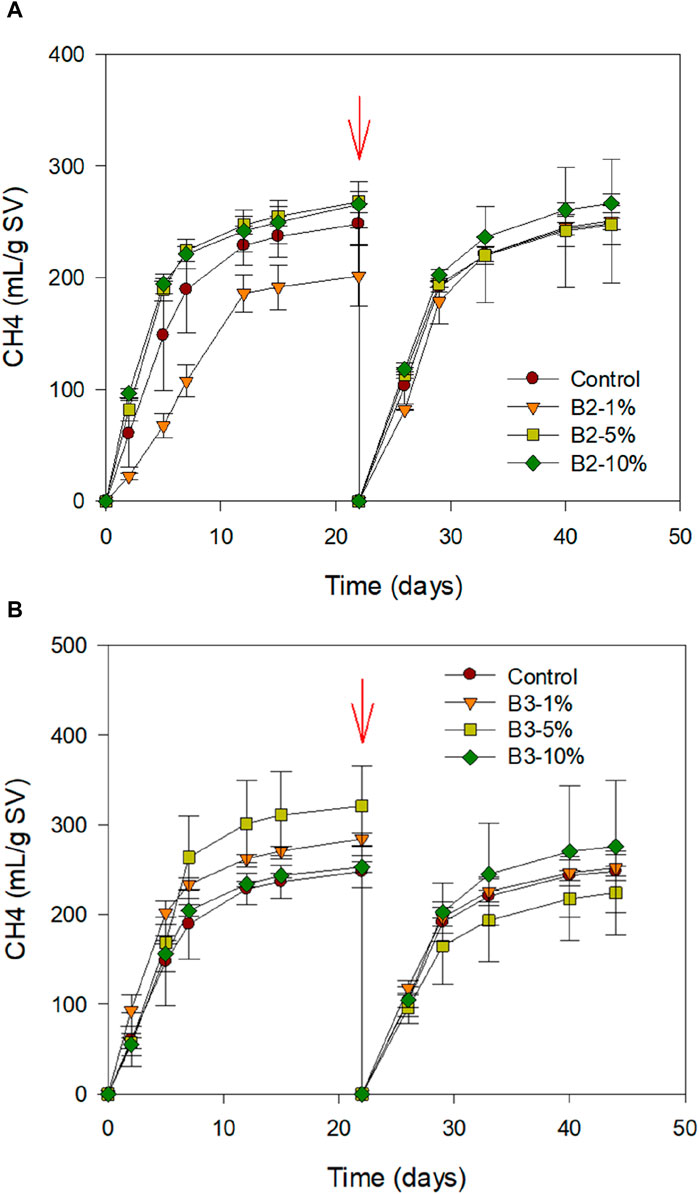
Figure 6. Accumulated methane production (mL CH4/g VS) of the biochars (A): BC2, (B) BC3) at different doses (1, 5, 10% w/w TS) compared to the Control during the sequential batch assays. The arrow indicates the second substrate addition performed at day 22.
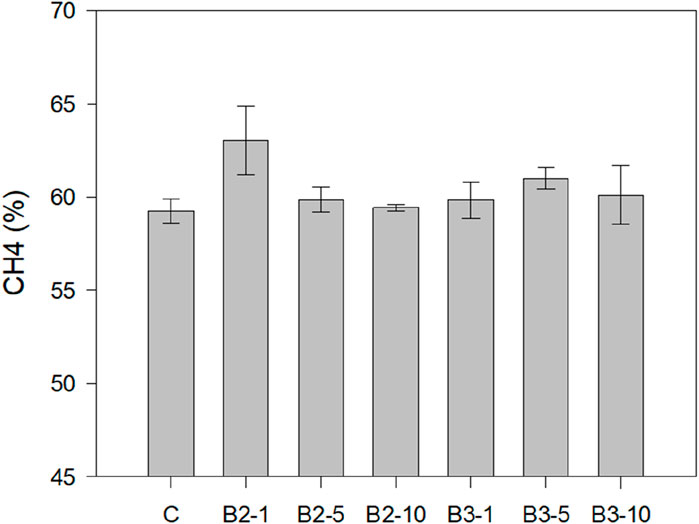
Figure 7. Methane content (%) of all the experimental conditions at the end of the sequential batch assays (day 44).
The absence of significant differences in the methane production of the second feeding is partly due to the high standard deviation of conditions B2-1 and B3-10 (±55 and 47 mL CH4/g VS, respectively), caused by a replica having very different results than the other two. This problem arises from the combination of working with small scale reactors (150 mL working volume) and a highly heterogeneous substrate like the OFMSW. Some experiments opt for using simulated OFMSW to avoid these issues (Khadka et al., 2022), but real OFMSW gives more truthful although less conclusive results. The solution would therefore be to work with bigger scale reactors; when carrying BMP tests with heterogeneous substrates is recommended to work with larger volumes (500–2000 mL) to reduce the effect of small composition differences between replicas on the process outcome and ensure that the concentrations of microorganisms and volatile fatty acids (VFAs) are closer to real operation conditions (Filer et al., 2019). Another reason why no big differences were observed between the control and the biochar supplemented reactors would be the fact that the process works under fairly optimal conditions. Wang et al. (2023) observed that the positive effects of BC on AD, such as the improvement of the maximum CH4 production rate and the shortening of the lag phase, increased as ammonia stress intensified. Similar studies modify the S:I ratio to increase OLR and related acid stress (Wang et al., 2018). BC is useful to tackle the main instabilities of AD and, therefore, its effect will logically be more evident when those instabilities are present. In that case scenario, the control under sub-optimal conditions would have a significantly lower methane yield than the control under optimal conditions, and the reactors supplemented with BC would be more or less close to the optimal depending on the dose, the characteristics, etc.
The two-way ANOVA analysis was repeated at the end of the sequential batch assays (day 44). In this case, the differences among the levels of the factors dose and type were not statistically significant (p = 0.393 and 0.854, respectively) and neither was the interaction (p = 0.803). The effect of each dose was not dependent on the biochar used, and vice versa, because all the biochars and doses yielded the same methane production, which tracked back to the big standard deviations of some experimental conditions. The results can be consulted in the Supplementary Figure S3.
3.4 Preliminary economical assessment
Very few papers on BC application on AD or any other process include an economic feasibility study on whether the improvement on methane production compensates the cost of BC addition, resulting in a net benefit. One reason is that most experimental works are done at lab-scale, making the obtained results barely applicable to a real-scale scenario. But the main problem is that both the benefits from improved AD and the cost of BC are difficult to calculate, as they depend on many factors. The sale price of biochar globally is set roughly around 0.2–0.5 USD/kg (Chiappero et al., 2020), even though it can vary widely depending on the feedstock, its accessibility to the BC production facilities and the energy consumption, which in turn depends on the pyrolysis temperature and the cost of energy itself (Zhao et al., 2021; Chiappero et al., 2022). The benefits resulting from the increase in methane production are also bound to the price of energy at the exact time and location of the process. Moreover, the increase in methane content decreases the need for further purification in biogas upgrading processes, a cost saving that is really difficult to estimate (Angelidaki et al., 2018). Other factors that can help reduce the overall expense of the process, and should be taken into account in those calculations, are: obtaining revenues for using biowaste as feedstock, gaining carbon credits from BC, recovering the heat of biogas combustion for the pyrolysis process, generating additional benefits from the by-products of pyrolysis (biogas and bio-oil), and potentially reusing the BC, among others (Zhao et al., 2021).
For all the aforementioned reasons, analyzing the economic feasibility of this case study could require a full technical, environmental, and economical assessment that is out of the scope of this work. To the knowledge of the authors, this type of study on BC addition to AD has never been done. The only similar assessment was performed by Zhang et al. (2020) on a thermophilic 1000 L pilot-scale semi-continuous digester, which cannot be compared to the lab-scale batch reactors operated in this study. Besides, that analysis only considered average prices for BC and methane and did not have into account the many factors affecting the economic performance of the process previously discussed. In more similar experiments, Hu et al. (2023) found that BC addition to AD only had significative positive effects on methane production when the process operated under inhibitory conditions and at high BC doses (25%). In that scenario, BC addition to AD would not be economically profitable per se, as the improvement in methane yield would not compensate the BC addition cost and BC would occupy an important portion of the digesters working volume. However, by combining AD and pyrolysis, two biowastes would be treated and the efficient recovery and use of energy would not only result in an energetically self-sufficient process but a surplus of energy. Following a different approximation, Chiappero et al. (2022) found a significant linear regression between BC dose and maximum cost and established a threshold for maximum sustainable BC unit cost of 0.45–0.76 g BC/g of VS. Above that range, the addition of more BC would not be cost-effective. This suggests that the optimal strategy for AD improvement through BC addition could be obtaining slight increases in methane production with the lowest BC dose possible, rather than looking for the biggest increase with extremely high amounts of BC, which can additionally cause inhibitory effects and loss of working volume as previously seen.
To summarize, an economic feasibility study should provide a net cost of the process that is precise and trustful. In order to obtain precise results, the cost of BC and energy should be specific for the time and location of each case study, instead of global average values. That estimation, however, would not be very trustful, as many factors conditioning the economic feasibility of the process cannot be considered in a lab-scale batch experiment, such as revenues from using biowaste, savings from energy recirculation and decreased biogas upgrading, among others. Therefore, estimations on the economic performance of BC addition on AD in a real scenario should only be done with experiments at pilot or large-scale, using case-specific data and considering as many influencing factors as possible.
4 Conclusion
In this work, three BC were characterized and their effect on the AD of the OFMSW was analyzed in terms of methane production and content. The characteristics of the feedstock were proven to be as determinant for the development of BC properties as the production process, although they are comparatively less studied, highlighting the need for more research on the matter. Overall, only a few significant differences on methane yield were observed between the control and the BC supplemented reactors, which difficulted further discussion on the link between BC properties/dose and AD performance. However, an interaction between the biochar type and dose could be sensed, meaning that a specific BC can enhance or inhibit AD depending on the dose, and that the same dose of BC can have diverse results depending on the characteristics thereof. This demonstrates that the properties of BC and their effect on AD are the result of a complex combination of many factors and interactions. A preliminary economical assessment of the process was performed, where the key points to ensure a precise and trustful economic feasibility study of BC application in AD were discussed. Further experiments under sub-optimal conditions could be carried out to obtain clearer results about BC effects on AD, while continuous operation could be used to analyze other aspects of the process such as microbial populations and BC addition mechanisms.
Data availability statement
The raw data supporting the conclusions of this article will be made available by the authors, without undue reservation.
Author contributions
MG-P: Data curation, Investigation, Writing–original draft, Data curation, Investigation, Writing–original draft, DG: Conceptualization, Investigation, Supervision, Writing–review and editing, Conceptualization, Investigation, Supervision, Writing–review and editing, AS: Data curation, Funding acquisition, Project administration, Supervision, Writing–review and editing, Data curation, Funding acquisition, Project administration, Supervision, Writing–review and editing.
Funding
The author(s) declare that no financial support was received for the research, authorship, and/or publication of this article.
Conflict of interest
The authors declare that the research was conducted in the absence of any commercial or financial relationships that could be construed as a potential conflict of interest.
The author(s) declared that they were an editorial board member of Frontiers, at the time of submission. This had no impact on the peer review process and the final decision.
Publisher’s note
All claims expressed in this article are solely those of the authors and do not necessarily represent those of their affiliated organizations, or those of the publisher, the editors and the reviewers. Any product that may be evaluated in this article, or claim that may be made by its manufacturer, is not guaranteed or endorsed by the publisher.
Supplementary material
The Supplementary Material for this article can be found online at: https://www.frontiersin.org/articles/10.3389/fceng.2024.1384495/full#supplementary-material
References
Alghashm, S., Song, L., Liu, L., Ouyang, C., Zhou, J. L., and Li, X. (2023). Improvement of biogas production using biochar from digestate at different pyrolysis temperatures during OFMSW anaerobic digestion. Sustainability 15 (15), 11917. doi:10.3390/su151511917
Angelidaki, I., Alves, M. M., Bolzonella, D., Borzacconi, L., Campos, J. L., Guwy, A. J., et al. (2009). Defining the biomethane potential (BMP) of solid organic wastes and energy crops: a proposed protocol for batch assays. Water Sci. Technol. 59 (5), 927–934. doi:10.2166/wst.2009.040
Angelidaki, I., Treu, L., Tsapekos, P., Luo, G., Campanaro, S., Wenzel, H., et al. (2018). Biogas upgrading and utilization: current status and perspectives. Biotechnol. Adv. 36 (2), 452–466. doi:10.1016/j.biotechadv.2018.01.011
ARC (2022). Agència de Residus de Catalunya. Estadístiques de residus municipals. Available at: http://estadistiques.arc.cat/ARC/?_ga=2.215534165.310736077.1703587404-1627425823.1604006259# (Accessed December 12, 2023).
Bardi, M. J., Mutunga, J. M., Ndiritu, H., and Koch, K. (2023). Effect of pyrolysis temperature on the physiochemical properties of biochar and its potential use in anaerobic digestion: a critical review. Environ. Technol. Innovation 32, 103349. doi:10.1016/j.eti.2023.103349
Barrena, R., Vargas-Garcia, M., Capell, G., Barańska, M., Puntes, V., Moral-Vico, J., et al. (2021). Sustained effect of zero-valent iron nanoparticles under semi-continuous anaerobic digestion of sewage sludge: evolution of nanoparticles and microbial community dynamics. Sci. Total Environ. 777, 145969. doi:10.1016/j.scitotenv.2021.145969
Barrena, R., Vargas-Garcia, M., Catacora-Padilla, P. O., Gea, T., Markeb, A. A., Moral-Vico, J., et al. (2023). Magnetite-based nanoparticles and nanocomposites for recovery of overloaded anaerobic digesters. Bioresour. Technol. 372, 128632. doi:10.1016/j.biortech.2023.128632
Campuzano, R., and González-Martínez, S. (2016). Characteristics of the organic fraction of municipal solid waste and methane production: a review. Waste Manag. 54, 3–12. doi:10.1016/j.wasman.2016.05.016
Casals, E., Barrena, R., García, A., González, E., Delgado, L., Busquets-Fité, M., et al. (2014). Programmed iron oxide nanoparticles disintegration in anaerobic digesters boosts biogas production. Small 10 (14), 2801–2808. doi:10.1002/smll.201303703
Chen, T., Quan, X., Ji, Z., Li, X., and Pei, Y. (2020). Synthesis and characterization of a novel magnetic calcium-rich nanocomposite and its remediation behaviour for As(III) and Pb(II) co-contamination in aqueous systems. Sci. Total Environ. 706, 135122. doi:10.1016/j.scitotenv.2019.135122
Chen, Y., Zhang, X., Chen, W., Yang, H., and Chen, H. (2017). The structure evolution of biochar from biomass pyrolysis and its correlation with gas pollutant adsorption performance. Bioresour. Technol. 246, 101–109. doi:10.1016/j.biortech.2017.08.138
Chiappero, M., Cillerai, F., Berruti, F., Mašek, O., and Fiore, S. (2021). Addition of different biochars as catalysts during the mesophilic anaerobic digestion of mixed wastewater sludge. Catalysts 11 (9), 1094. doi:10.3390/catal11091094
Chiappero, M., Fiore, S., and Berruti, F. (2022). Impact of biochar on anaerobic digestion: meta-analysis and economic evaluation. J. Environ. Chem. Eng. 10 (6), 108870. doi:10.1016/j.jece.2022.108870
Chiappero, M., Norouzi, O., Hu, M., Demichelis, F., Berruti, F., Mašek, O., et al. (2020). Review of Biochar role as additive in anaerobic digestion processes. Renew. Sustain. Energy Rev. 131, 110037. doi:10.1016/j.rser.2020.110037
Colón, J., Cadena, E., Pognani, M., Barrena, R., Sánchez, A., Font, X., et al. (2012). Determination of the energy and environmental burdens associated with the biological treatment of source-separated municipal solid wastes. Energy Environ. Sci. 5 (2), 5731–5741. doi:10.1039/c2ee01085b
European Commission (2020). Circular economy - implementation of the circular economy action plan. Available at: https://ec.europa.eu/environment/circular-economy/(Accessed December 12, 2023).
Filer, J., Ding, H., and Chang, S. (2019). Biochemical methane potential (BMP) assay method for anaerobic digestion research. Water 11 (5), 921. doi:10.3390/w11050921
Hu, J., Stenchly, K., Gwenzi, W., Wachendorf, M., and Kaetzl, K. (2023). Critical evaluation of biochar effects on methane production and process stability in anaerobic digestion. Front. Energy Res. 11. doi:10.3389/fenrg.2023.1205818
Ippolito, J. A., Cui, L., Kammann, C., Wrage-Mönnig, N., Estavillo, J. M., Fuertes-Mendizábal, T., et al. (2020). Feedstock choice, pyrolysis temperature and type influence biochar characteristics: a comprehensive meta-data analysis review. Biochar 2 (4), 421–438. doi:10.1007/s42773-020-00067-x
IR-Spectra Table (2024). Tabla de espectro de infrarrojos por intervalo de frecuencia. Darmstadt, Germany: MERCK. Available at: https://www.sigmaaldrich.com/ES/es/technical-documents/technical-article/analytical-chemistry/photometry-and-reflectometry/ir-spectrum-table (Accessed January 1, 2024).
Janu, R., Mrlik, V., Ribitsch, D., Hofman, J., Sedláček, P., Bielská, L., et al. (2021). Biochar surface functional groups as affected by biomass feedstock, biochar composition and pyrolysis temperature. Carbon Resour. Convers. 4, 36–46. doi:10.1016/j.crcon.2021.01.003
Khadka, A., Parajuli, A., Dangol, S., Thapa, B., Sapkota, L., Carmona-Martínez, A. A., et al. (2022). Effect of the substrate to inoculum ratios on the kinetics of biogas production during the mesophilic anaerobic digestion of food waste. Energies 15 (3), 834. doi:10.3390/en15030834
Krasucka, P., Pan, B., Ok, Y. S., Mohan, D., Sarkar, B., and Oleszczuk, P. (2021). Engineered biochar – a sustainable solution for the removal of antibiotics from water. Chem. Eng. J. 405, 126926. doi:10.1016/j.cej.2020.126926
Kumar, M., Dutta, S., You, S., Luo, G., Zhang, S., Show, P. L., et al. (2021). A critical review on Biochar for enhancing biogas production from anaerobic digestion of food waste and sludge. J. Clean. Prod. 305, 127143. doi:10.1016/j.jclepro.2021.127143
Liu, Y., He, P., Peng, W., Zhang, H., and Lü, F. (2024). Biochemical methane potential database: a public platform. Bioresour. Technol. 393, 130111. doi:10.1016/j.biortech.2023.130111
Ma, Q., Chen, W., Jin, Z., Chen, L., Zhou, Q., and Jiang, X. (2021). One-step synthesis of microporous nitrogen-doped biochar for efficient removal of CO2 and H2S. Fuel 289, 119932. doi:10.1016/j.fuel.2020.119932
Masebinu, S. O., Akinlabi, E. T., Muzenda, E., and Aboyade, A. O. (2019). A review of biochar properties and their roles in mitigating challenges with anaerobic digestion. Renew. Sustain. Energy Rev. 103, 291–307. doi:10.1016/j.rser.2018.12.048
Montejo, C., Tonini, D., Del Carmen Paradinas Márquez, M., and Fruergaard Astrup, T. (2013). Mechanical–biological treatment: performance and potentials. An LCA of 8 MBT plants including waste characterization. J. Environ. Manag. 128, 661–673. doi:10.1016/j.jenvman.2013.05.063
Nie, W., He, S., Lin, Y., Cheng, J. J., and Yang, C. (2024). Functional biochar in enhanced anaerobic digestion: synthesis, performances, and mechanisms. Sci. total Environ. 906, 167681. doi:10.1016/j.scitotenv.2023.167681
Osman, A. I., Fawzy, S., Farghali, M., El-Azazy, M., Elgarahy, A. M., Fahim, R. A., et al. (2022). Biochar for agronomy, animal farming, anaerobic digestion, composting, water treatment, soil remediation, construction, energy storage, and carbon sequestration: a review. Environ. Chem. Lett. 20 (4), 2385–2485. doi:10.1007/s10311-022-01424-x
Parra-Orobio, B. A., Soto-Paz, J., Oviedo-Ocaña, É. R., Vali, S. A., and Sánchez, A. (2023). Advances, Trends and Challenges in the use of Biochar as an improvement strategy in the anaerobic digestion of organic waste: a Systematic analysis. Bioengineered 14 (1), 2252191. doi:10.1080/21655979.2023.2252191
Pecchi, M., and Baratieri, M. (2019). Coupling anaerobic digestion with gasification, pyrolysis or hydrothermal carbonization: a review. Renew. Sustain. Energy Rev. 105, 462–475. doi:10.1016/j.rser.2019.02.003
Pramanik, S. K., Sujá, F., Zain, S. M., and Pramanik, B. K. (2019). The anaerobic digestion process of biogas production from food waste: prospects and constraints. Bioresour. Technol. Rep. 8, 100310. doi:10.1016/j.biteb.2019.100310
Shen, Y., Linville, J. L., Leon, P. A. A. I., Schoene, R. P., and Urgun-Demirtas, M. (2016). Towards a sustainable paradigm of waste-to-energy process: enhanced anaerobic digestion of sludge with woody biochar. J. Clean. Prod. 135, 1054–1064. doi:10.1016/j.jclepro.2016.06.144
Shi, Y., Xue, H., Yao, Y., Jing, C., Liu, R., Niu, Q., et al. (2023). Overcoming methanogenesis barrier to acid inhibition and enhancing PAHs removal by granular biochar during anaerobic digestion. Chem. Eng. J. 477, 147229. doi:10.1016/j.cej.2023.147229
TMECC (1997). Test methods for the examination of composting and compost. Raleigh, North Caroline, USA: US Composting Council. Available at: https://www.compostingcouncil.org/page/tmecc (Accessed January 1, 2024).
Valentin, M. T., Luo, G., Zhang, S., and Białowiec, A. (2023). Direct interspecies electron transfer mechanisms of a biochar-amended anaerobic digestion: a review. Biotechnol. Biofuels Bioprod. 16 (1), 146. doi:10.1186/s13068-023-02391-3
Wang, G., Fu, P., Zhang, B., Zhang, J., Huang, Q., Yao, G., et al. (2023). Biochar facilitates methanogens evolution by enhancing extracellular electron transfer to boost anaerobic digestion of swine manure under ammonia stress. Bioresour. Technol. 388, 129773. doi:10.1016/j.biortech.2023.129773
Wang, G., Li, Q., Gao, X., and Wang, X. C. (2018). Synergetic promotion of syntrophic methane production from anaerobic digestion of complex organic wastes by Biochar: performance and associated mechanisms. Bioresour. Technol. 250, 812–820. doi:10.1016/j.biortech.2017.12.004
Wen, C., Li, T., Wang, D., Wang, Y., Chen, H., Luo, G., et al. (2023). Biochar as the effective adsorbent to combustion gaseous pollutants: preparation, activation, functionalization and the adsorption mechanisms. Prog. Energy And Combust. Sci. 99, 101098. doi:10.1016/j.pecs.2023.101098
Xiao, L., Lichtfouse, É., Kumar, P., Wang, Q., and Liu, F. (2021). Biochar promotes methane production during anaerobic digestion of organic waste. Environ. Chem. Lett. 19 (5), 3557–3564. doi:10.1007/s10311-021-01251-6
Xu, F., Li, Y., Ge, X., Yang, L., and Li, Y. (2018). Anaerobic digestion of food waste – challenges and opportunities. Bioresour. Technol. 247, 1047–1058. doi:10.1016/j.biortech.2017.09.020
Zhang, L., Lim, E. Y., Loh, K., Ok, Y. S., Lee, J. T., Shen, Y., et al. (2020). Biochar Enhanced Thermophilic Anaerobic digestion of food waste: focusing on biochar particle size, microbial community analysis and pilot-scale application. Energy Convers. Manag. 209, 112654. doi:10.1016/j.enconman.2020.112654
Zhang, M., Li, J., Wang, Y., and Yang, C. (2019). Impacts of different biochar types on the anaerobic digestion of sewage sludge. RSC Adv. 9 (72), 42375–42386. doi:10.1039/c9ra08700a
Zhang, Z., Zhang, M., Zhao, X., and Cao, J. (2024). High-efficient removal and adsorption mechanism of organic dyes in wastewater by KOH-activated biochar from phenol-formaldehyde resin modified wood. Sep. And Purif. Technol. 330, 125542. doi:10.1016/j.seppur.2023.125542
Zhao, B., O’Connor, D., Zhang, J., Peng, T., Shen, Z., Tsang, D. C., et al. (2018). Effect of pyrolysis temperature, heating rate, and residence time on rapeseed stem derived biochar. J. Clean. Prod. 174, 977–987. doi:10.1016/j.jclepro.2017.11.013
Keywords: anaerobic digestion, biochar, biogas, characterization, organic fraction of municipal waste, OFMSW
Citation: García-Prats M, González D and Sánchez A (2024) Characterization of biochars of different origin and application to the anaerobic digestion of source-selected organic fraction of municipal solid waste under batch conditions and at different dosages. Front. Chem. Eng. 6:1384495. doi: 10.3389/fceng.2024.1384495
Received: 09 February 2024; Accepted: 21 March 2024;
Published: 03 April 2024.
Edited by:
Sartaj Ahmad Bhat, Gifu University, JapanReviewed by:
Bulgariu Laura, Gheorghe Asachi Technical University of Iași, RomaniaWaheed Ahmad Khanday, Sri Pratap College Srinagar, India
Behnam Asgari Lajayer, Dalhousie University, Canada
Copyright © 2024 García-Prats, González and Sánchez. This is an open-access article distributed under the terms of the Creative Commons Attribution License (CC BY). The use, distribution or reproduction in other forums is permitted, provided the original author(s) and the copyright owner(s) are credited and that the original publication in this journal is cited, in accordance with accepted academic practice. No use, distribution or reproduction is permitted which does not comply with these terms.
*Correspondence: Antoni Sánchez, YW50b25pLnNhbmNoZXpAdWFiLmNhdA==