 Hongwei Xue1†
 Guangwu Qian2†Xiaofen Wu1
 Yan Gao1Hongguang Yang3
 Mingqian Liu4Lei Wang1Renfei Chen3
 Peijun Wang1*
- 1Department of Radiology, Tongji Hospital, School of Medicine, Tongji University, Shanghai, China
- 2Peng Cheng Laboratory, Shenzhen, China
- 3AI Research Lab, Imsight Technology Co., Ltd., Shenzhen, China
- 4Winning Health Technology Group Co., Ltd., Shanghai, China
Introduction: Early breast carcinomas can be effectively diagnosed and controlled. However, it demands extra work and radiologist in China often suffer from overtime working due to too many patients, even experienced ones could make mistakes after overloaded work. To improve the efficiency and reduce the rate of misdiagnosis, automatic breast diagnosis on Magnetic Resonance Imaging (MRI) images is vital yet challenging for breast disease screening and successful treatment planning. There are some obstacles that hinder the development of automatic approaches, such as class-imbalance of samples, hard mimics of lesions, etc. In this paper, we propose a coarse-to-fine algorithm to address those problems of automatic breast diagnosis on multi-series MRI images. The algorithm utilizes deep learning techniques to provide breast segmentation, tumor segmentation and tumor classification functions, thus supporting doctors' decisions in clinical practice.
Methods: In proposed algorithm, a DenseUNet is firstly employed to extract breast-related regions by removing irrelevant parts in the thoracic cavity. Then, by taking advantage of the attention mechanism and the focal loss, a novel network named Attention Dense UNet (ADUNet) is designed for the tumor segmentation. Particularly, the focal loss in ADUNet addresses class-imbalance and model overwhelmed problems. Finally, a customized network is developed for the tumor classification. Besides, while most approaches only consider one or two series, the proposed algorithm takes in account multiple series of MRI images.
Results: Extensive experiments are carried out to evaluate its performance on 435 multi-series MRI volumes from 87 patients collected from Tongji Hospital. In the dataset, all cases are with benign, malignant, or both type of tumors, the category of which covers carcinoma, fibroadenoma, cyst and abscess. The ground truths of tumors are labeled by two radiologists with 3 years of experience on breast MRI reporting by drawing contours of tumor slice by slice. ADUNet is compared with other prevalent deep-learning methods on the tumor segmentation and quantitative results, and achieves the best performance on both Case Dice Score and Global Dice Score by 0.748 and 0.801 respectively. Moreover, the customized classification network outperforms two CNN-M based models and achieves tumor-level and case-level AUC by 0.831 and 0.918 respectively.
Discussion: All data in this paper are collected from the same MRI device, thus it is reasonable to assume that they are from the same domain and independent identically distributed. Whether the proposed algorithm is robust enough in a multi-source case still remains an open question. Each stage of the proposed algorithm is trained separately, which makes each stage more robust and converge faster. Such training strategy considers each stage as a separate task and does not take into account the relationships between tasks.
1. Introduction
As one of the leading causes of deaths, breast cancer is the most common cancer for women globally. Moreover, breast cancer tends to show a high incidence, especially for people with high-risk factors, such as nulliparity, use of hormonal replacement therapy, strong family history, and so on Torre et al. (2017) and Bray et al. (2018). Once reaching a certain size, malignant breast tumors are known to grow their own blood supply network, which enables the cancer to grow continually. Although the non-metastatic breast cancer has a long survival time, it will be incurable once metastasis occurs. Therefore, early detection of breast cancer is a crucial step in the treatment of this disease (Kalli et al., 2018).
Medical imaging plays an important role in reducing the mortality rate of breast cancer. Through screening, diagnosis, image-guided biopsy, treatment planning and treatment response monitoring, early detection of breast cancer can be facilitated (Yuan et al., 2010). Compared with other medical imaging techniques, Magnetic Resonance Imaging (MRI) shows advantages of high resolution, no radiation, multi-directional and multi-functional imaging. Furthermore, MRI has demonstrated its worth by showing its superiority in categorizing lesions, assessing morphological and architectural characteristics, as well as assessing kinetic parameters (Frana et al., 2017). Nevertheless, analyzing MRI images is time-consuming and requires experienced radiologists. To make things worse, with the widespread application of MRI, it is always short of experienced radiologists. Therefore, it is inevitable to introduce automatic breast diagnosis on MRI images to assist radiologists.
Some studies have extracted hand-crafted features of lesions to identify the genomic composition of breast tumors and the malignancy probabilities (Zheng et al., 2007; Bhooshan et al., 2010; Vignati et al., 2011). Although those studies have reported satisfactory results within their datasets, the applicability of those methods is limited due to the varied breast MRI images caused by different MRI protocols and breast variations among patients. Besides, some studies have applied deep learning techniques, especially Convolutional Neural Networks (CNNs) (Chen et al., 2019), to extract deep semantic features from whole-volume MRI images (Maicas et al., 2018; Luo et al., 2019; Zhou et al., 2019). Deep features are beyond human understanding, so it is critical to develop new mechanisms in deep learning based breast diagnosis to guarantee accurate segmentations, which have been taken into consideration during the development of hand-crafted features.
As the fast growth of deep learning, CNNs, especially Fully Convolutional Neural Networks (FCNs), have been proven to be quite effective for biomedical image segmentation and require few hand-crafted features or prior knowledge (Long et al., 2015; Ronneberger et al., 2015; Li et al., 2018b). In this scenario, some studies have proposed two-stage approaches, which firstly segment breast tumors through a FCN and then identify cancer candidates at the second stage. However, it is a common challenge for FCNs that the imbalanced distribution of positive (tumors) and negative (non-tumor regions) samples could overwhelm the model (Christ et al., 2017). In addition, as shown in Figure 1, some hard samples, like inapparent tumors and the tumor necrosis which are different from common ones, make breast tumor segmentation more challenging. By far, very few deep learning based methods, which address the aforementioned problems, are developed for the breast tumor segmentation.
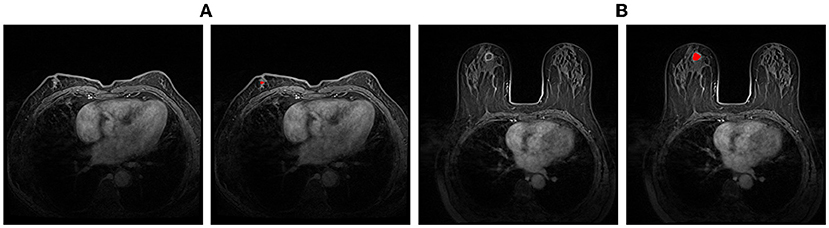
Figure 1. Examples of hard samples. (A) An example with inapparent tumor; (B) An example with the tumor necrosis. The left one of each pair is the original image, and the right one is the segmentation annotation.
In this paper, we develop a coarse-to-fine algorithm based on deep learning for breast diagnosis on MRI images. The main idea is about a divide-and-conquer algorithm, which divides the diagnosis process into several single target and progressive tasks. At the first stage, a DenseUNet model (Li et al., 2018b) is employed to generate breast masks so that irrelevant regions inside MRI images can be removed to obtain breast regions. At the second stage, given breast regions as inputs, we present the Attention Dense UNet (ADUNet) by implementing attention mechanisms to generate tumor segmentation results. To deal with class-imbalance and hard samples problems, we further introduce the focal loss (Lin et al., 2017), an effective technique for balancing object samples, to supervise ADUNet during the training. At the third stage, with the help of breast tumor segmentation results from the previous stage, a customized classification network is designed to identify whether tumors are benign or malignant.
The specific contributions and highlights are as follows:
• We propose a coarse-to-fine algorithm for breast diagnosis on MRI images, which consists of breast segmentation, tumor segmentation, and tumor classification.
• ADUNet, a network enhanced by attention blocks and the focal loss with DenseUNet as the backbone, is proposed for the breast tumor segmentation to overcome the class-imbalance and overwhelmed model problems and improves the performance significantly.
• Suggested by experienced radiologists, rather than one or two series, 4 series of MRI images are collected as the input of ADUNet.
• A network-based binary classifier is constructed to predict tumor-level classification results and case-level (also known as patient-level) classification results are deduced from tumor-level ones.
2. Related work
The tumor segmentation is a crucial step in breast diagnosis on MRI images. Many semi-automatic methods, such as Fuzzy C-Means (FCM) (Chen et al., 2006) and active contour models (Yao et al., 2009), are often employed in tumor segmentation tasks. Those methods cannot directly distinguish tumors from MRI volumes, because they require initial cluster centers or a rough initial contour of breast tumors by radiologists. Zheng et al. (2007) proposed to use a graph-cut-based method, while it still needs a rough segmentation from manual annotations. Ashraf et al. (2013) developed a multichannel Markov Random Field (MRF) framework for the tumor segmentation. In this framework, kinetic feature maps are derived from breast Dynamic Contrast-Enhanced (DCE) MRI as observation channels in MRF, where the slices containing tumors are selected according to experiments. Fully automatic methods can perform breast tumor segmentation tasks by training a pixel-wise classification through supervised learning. For example, Support Vector Machine (SVM) and Bayesian classifier are adopted for breast tumor segmentation tasks on thermogram images (Dinsha and Manikandaprabu, 2014). Jiang et al. (2012) proposed a method that uses an AdaBoost classifier on Harr-like features to detect a preliminary set of tumor regions, which are further screened with a SVM classifier by using quantized intensity. However, most conventional machine-learning methods demand manual features or prior knowledge, so the performance will degrade inevitably when applied in complex scenarios. Recently, deep neural networks, which do not require any manual extracted feature or prior knowledge, have been proven to be effective for biomedical image segmentation (Long et al., 2015; Yuan et al., 2017; Zhang et al., 2017).
Also, some deep learning based Computer-Aided Diagnosis (CAD) systems for the breast diagnosis have been proposed (Piantadosi, 2018; Herent et al., 2019). Piantadosi (2018) proposed a hierarchical architecture by implementing modules for breast segmentation, attenuation of motion artifacts, localization of lesions and final classification according to their malignancies. Herent et al. (2019) developed a deep learning model that simultaneously learnt to detect lesions and characterize them. Nonetheless, these methods either still use conventional machine learning methods rather than deep learning methods or consider only a few series.
Deep neural networks achieve the purpose of segmentation by performing pixel-wise classification and can be trained in an end-to-end way. FCNs are often regarded as baseline models for segmentation tasks (Long et al., 2015). UNet (Ronneberger et al., 2015) is a well developed FCN and improves the segmentation performance by connecting intermediate encoders and decoders to learn context information. Yu et al. (2017) proposed a 3D CNN with mixed residual connections to segment the prostate automatically in MRI volumes. Li et al. (2018b) developed a hybrid densely connected UNet named H-DenseUNet, which consists of a 2D DenseUNet and a 3D DenseUNet. To a certain extent, such combination can address the problems that 2D convolutions could ignore the volumetric contexts and 3D convolutions may bear heavy computational cost. These methods combine the low-level features with high-level features directly, but neglect the possibility that the global context information embedded in high-level features could guide the low-level feature extraction conversely.
With the boost of researches and applications in deep learning, attention mechanism has been widely used in knowledge graphs (Wen et al., 2017), Natural Language Processing (NLP) (Yin et al., 2016), and image analysis (Mnih et al., 2014; Wang et al., 2017; Li et al., 2018a; Oktay et al., 2018). Attention models can be categorized into hard-attention and soft-attention depending on whether it is differentiable or not. Mnih et al. (2014) presented a hard-attention model which can adaptively propose regions for processing. But the hard-attention models have difficulties in training the model, because the standard back-propagation requires differentiable activation functions. To address this problem, soft-attention models are proposed and employed more frequently. Li et al. (2018a) developed a channel-wise attention model to provide global information captured with high-level features, which guide low-level features to capture category localization details for natural image segmentation. Oktay et al. (2018) proposed an spatial-wise attention model and integrated it into UNet architecture for multi-class CT abdominal image segmentation.
3. Methods
All experiments including all relevant details in this paper have been approved by Tongji Hospital, Tongji University School of Medicine and performed in accordance with relevant guidelines and regulations. In addition, informed consent was obtained from all subjects.
We propose a coarse-to-fine algorithm named ADUNet for automatic breast diagnosis on multi-series MRI images by using deep learning with attention mechanisms and the focal loss (see Figure 2). Firstly, we train a DenseUNet model to generate breast masks on Turbo Spin Echo (TSE) modality (Stage 1). TSE imaging, also known as Fast Spin Echo (FSE) imaging, is a commercial implementation of the Rapid Acquisition with Refocused Echoes (RARE) technique (Hennig et al., 1986). The DCE series have been registered with TSE modality in the scanning machine, hence we then align the two modalities by simply resizing the breast masks to the same size of DCE series. Subject to breast masks in DCE images, ADUNet is trained to predict regions of tumors (Stage 2). At last, a customized classification network is developed to distinguish benign or malignant tumors (Stage 3). The following sections present detailed descriptions for each stage.
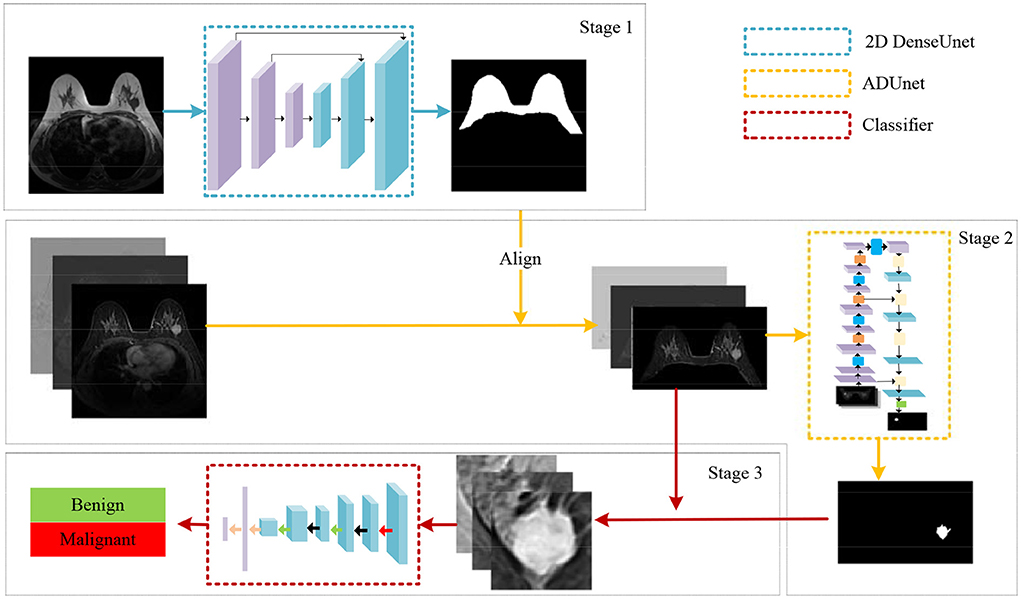
Figure 2. An illustration of the proposed algorithm for automatic breast diagnosis on multi-series images.
3.1. Breast segmentation
With the prior knowledge that breast tumors only exist in the breast gland, it is intuitive to firstly generate a Region Of Interest (ROI) that only contains the mammary region. Inspired by Thakran et al. (2018), we initialize breast masks by automatic landmark detection technique based on TSE images. But its performance is not robust and cannot completely remove irrelevant organs in some cases. Therefore, we choose the images with well segmented masks and ask experienced radiologists to fine-tune on them to build a breast segmentation dataset, which is then utilized to train a FCN to obtain better segmentation results.
As an improved FCN with the encoder-decoder structure, UNet can learn context information by connecting intermediate encoders and decoders. But its encoders are shallow and the learning ability is limited. Hence, we employ a DenseUNet (Li et al., 2018b), which uses a DenseNet (Huang et al., 2017) as the encoder and adopts UNet-like connections. DenseNet is a powerful network for feature extraction. It consists of blocks with repeated dense connections of different output sizes. In each tightly connected block, there are direct connections from any layer to all subsequent layers. One advantage of dense inter-layer connectivity is lower output dimensions than traditional networks to avoid learning redundancy. Furthermore, the dense connected path ensures the maximum information flow between layers, thus improving the gradient flow and relieving the burden of finding the optimal solution in a very deep neural network. The UNet-like connections can unite the encoders and decoders to preserve low-level information when restoring resolution. The network of breast segmentation is trained by a Dice loss (Milletari et al., 2016) as follows:
where Ω denotes the position space, p(x) ∈ [0, 1] is the probability of positive samples at position x in the predictions, and y(x) ∈ {0, 1} is the corresponding ground truth.
3.2. Tumor segmentation
The shape and size of tumor are critical for the breast disease analysis, so the tumor segmentation is a vital step of the proposed algorithm and will be depicted in this section.
Image representation: Although irrelevant regions can be excluded by breast masks predicted by the trained DenseUNet, there are still a lot of negative regions, leading to a serious class-imbalance problem. Thus, images are cropped to reduce negative regions and more details can be found in the experimental section. Then, we employ the image representation as the same as Amit et al. (2017) for the cropped regions of DCE images, where a multi-channel sample is constructed to capture anatomical and metabolic characteristics. Figure 3 shows an illustration of the 3-channel image representation, where Ibase denotes the pre-contrast T1 image, Ipeak is the image at peak enhancement, Iearly is the initial response image after contrast injection, and Idelayed is the delayed enhancement which is usually the last acquired temporal series. All the 4 series are raw images exported from the same MRI scanner directly. Hence, the first channel is Ipeak, the second channel is the T1-subtracted image at peak enhancement Ipeak-Ibase, and the last channel is the contrast washout image Iearly-Idelayed.
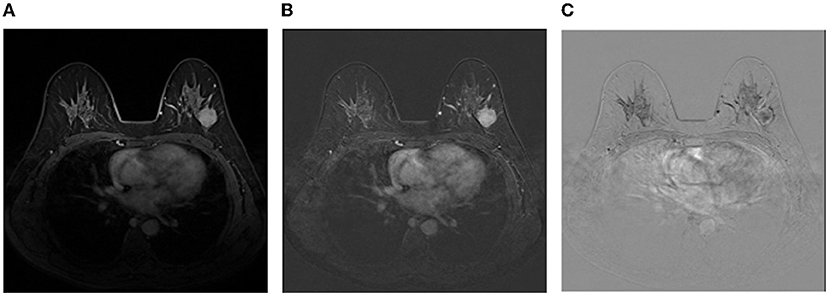
Figure 3. An illustration of the image representation with three channels. (A) The first channel:Ipeak; (B) The second channel:Ipeak-Ibase; (C) The third channel:Iearly-Idelayed.
Attention block: Hereinafter, the meanings of encoders and decoders are the feature extraction stage and the generating stage of semantic segmentation masks in a network, respectively. In an encoder, a feature map is gradually reduced to obtain a large receptive field and semantic contextual information. In this way, high-level feature maps may catpure abundant semantic information, which is harmful for recovering spatial details of small objects. Therefore, for decoders, most methods either employ UNet-like connections to gradually recover the shape of objects (Ronneberger et al., 2015) or introduce an object localization model which highly increase the number of training parameters (Roth et al., 2017; Khened et al., 2019). Recent studies have shown that attention mechanisms can enhance feature responses in foreground regions without an additional model (Wang et al., 2017; Oktay et al., 2018). Here, we develop an attention block which combines the channel-wise attention with the spatial-wise attention mechanisms. Attention blocks are applied in upsampling blocks of decoders. As shown in Figure 4, the resolution of the low-level feature maps l is reduced to the resolution of high-level feature maps h by convolving a 3 × 3 kernel with stride 2. The high-level feature maps are performed by a convolutional layer with a 1 × 1 kernel to reduce the number of its channels and added with the low-level feature maps. To generate spatial-wise attention coefficient maps within a single channel, the fused feature maps go though a convolutional layer with a 1 × 1 kernel and stride 1, and a sigmoid function. Then, the resolution of the coefficient map is doubled by the bidirectional interpolation (the green part in Figure 4). On the other hand, the channel-wise attention performs global average pooling on high-level feature maps to provide abundant categorical information for enhancing regions of interest in low-level feature maps. In detail, the information flows through a convolutional layer with a 1 × 1 kernel and a sigmoid function to generate a channel-wise attention coefficient vector at size 1 × 1 × c, where c denotes the number of channels of low-level feature maps (the red part in Figure 4). Finally, the low-level feature maps are multiplied by the spatial-wise attention coefficient map and the channel-wise attention coefficient vector. As a result, the regions of interest in the low-level feature maps are highlighted under the guidance of high-level feature maps. Afterwards, the high-level feature maps are upsampled and concatenated with the weighed low-level feature maps. The concatenated feature maps are fed into a convolutional block which consists of a convolution layer with a 3 × 3 kernel, a Group Normalization (GN) (Wu and He, 2020) layer and a ReLU activation function to fuse context information. Furthermore, dropout layers are attached after each convolution block to prevent overfitting.
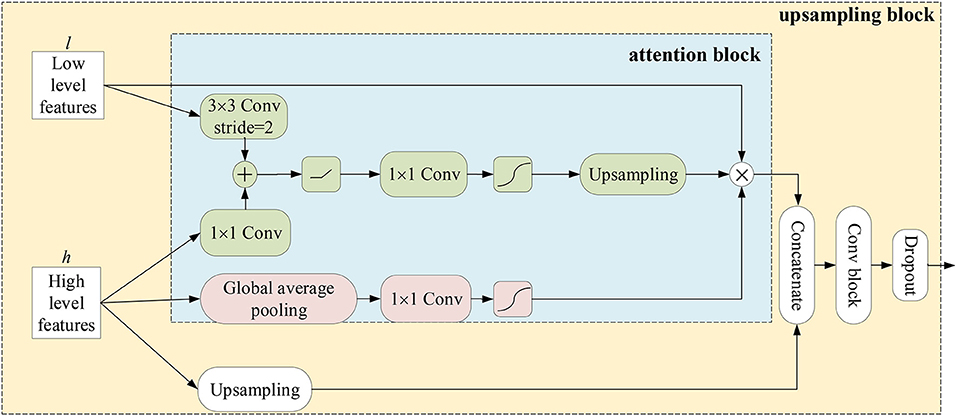
Figure 4. An illustration of attention blocks and upsampling blocks.
ADUNet: The decoder is composed of sequential upsampling blocks and recovers spatial information gradually. The attention blocks are interposed into a deep neural network to construct ADUNet (as shown in Figure 5) for tumor segmentation. The purple blocks and aqua-green blocks denote the feature maps generated by encoders and decoders, respectively. The numbers on the top and bottom of blocks denote the number of channels. It is worth noting that the input l of Upsampling Blocks (UBs) is the output of the convolutional layer with a 1 × 1 kernel in Transition Layers (TLs), whose purpose is to reduce the number of feature maps, instead of the output of Downsampling Blocks (DBs).
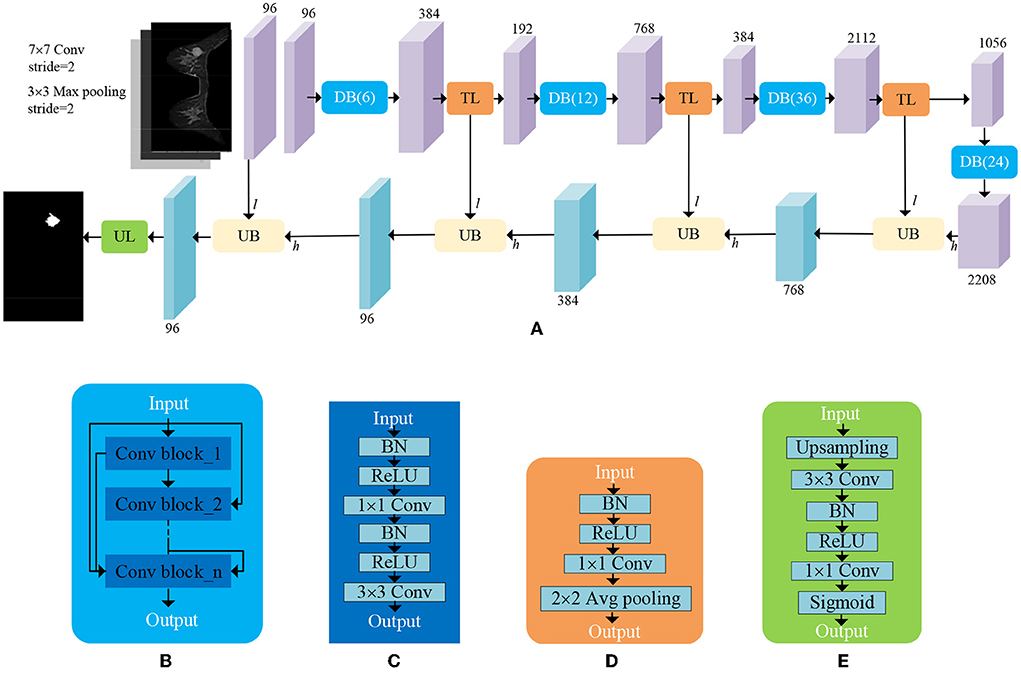
Figure 5. An illustration of ADUNet. (A) The architecture of ADUNet; (B) Dense Block (DB(n)); (C) Convolutional Block; (D) Transition Layer (TL); (E) Upsampling Layer (UL).
Focal loss: The imbalanced distribution of positive and negative samples in breast MRI images can overwhelm the model during training. Furthermore, some hard samples like inapparent tumors, are difficult to distinguish, even for experienced radiologists. Both problems could make the loss function converge to a local optimal and reduce the generalization ability of the model (Lin et al., 2017). Therefore, we take advantage of the focal loss to address the extreme class imbalance and prevent too many easy samples from overwhelming the model during training. In this paper, the focal loss in the tumor segmentation can be defined as:
where α ∈ [0, 1] is a factor to balance the class frequencies. The parameter γ>0 controls the contribution of hard and easy samples to the loss. For a positive sample, the larger p(x) is, indicating a simple sample, the smaller the corresponding (1−p(x))γ is, thus reducing its contribution to the loss. The focal loss not only solves the imbalance between positive samples and negative samples, but also adaptively tunes the contribution of hard and simple samples in the loss, thus leading to a more general model.
3.3. Classification of tumors
The ROIs of tumors are obtained by circumscribed rectangles of the segmentation results predicted by ADUNet. A customized network is developed as a tumor-level classifier (as shown in Figure 6). The designed network consists of 3 convolutional layers with a 5 × 5 kernel and a ReLU activation function, pooling layers and fully-connected layers at the end. The same image preprocessing described in Section 3.2 is applied here and 3-channel input images are resized to 32 × 32 × 3. For case-level classification, all tumors are collected to train the model, so that it can learn features of samples in various sizes. The network is trained with the cross entropy loss function. At the testing phase, only a portion of predicted tumors in each case are selected according to sizes of tumors. Because small tumors are rare in training samples and may feed noisy data to the classification model. Besides, fewer tumor candidates also reduce the testing time, a sensitive performance index in clinical practice. The case-level category is determined by the results predicted from the majority of tumors.
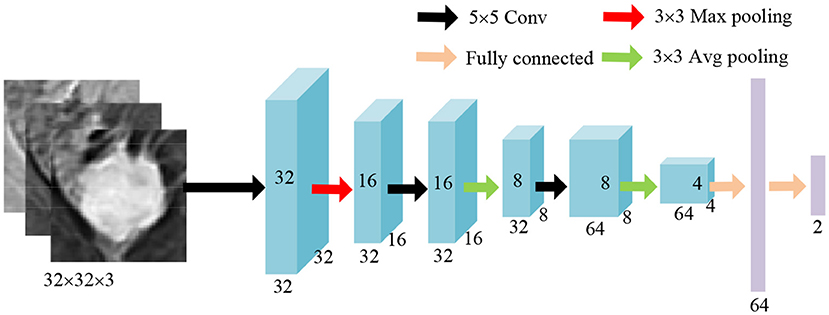
Figure 6. An illustration of the classification network.
4. Results
Experiments are conducted on the breast MRI dataset collected from Tongji Hospital, Tongji University School of Medicine. The dataset contains 435 volumes collected from 87 patients and is divided into the training set of 70 patients and the test set of 17 patients. As summarized in Table 1, all cases, consisting of 43 benign cases and 44 malignant cases, are scanned by Siemens Verio 3.0t MRI and histopathologically confirmed by ultrasound guided biopsy or radical mastectomy from January 2013 to December 2017. The benign cases include 25 cases of fibroadenoma, 8 cases of cyst, 7 cases of inflammation and 3 cases of abscess, while the malignant cases include 14 cases of carcinoma in situ, 23 cases of invasive ductal carcinoma and 7 cases of invasive lobular carcinoma. For each case, raw data contain 1 TSE and 4 DCE series which are acquired at different times after intravenous injection of a contrast agent. About annotations, two radiologists with 3 years of experience on breast MRI reporting label ground truths of tumors by drawing contours of tumors slice by slice and labeling them by different colors (i.e., red for malignant tumors and green for benign ones), but the breast masks are not directly provided for saving the workload of radiologists. To address this problem, the breast masks are firstly generated by an unsupervised method proposed in Thakran et al. (2018) on TSE series. Then 1421 well-performing slices are selected and fine-tuned by radiologists as the training set for the further supervised learning on breast segmentation. In the second stage, the generated breast masks are interpolated to the size of DCE series, i.e., 448 × 448 × 140. The breast regions can be easily obtained by element-wise multiplication between DCE images and binarized breast masks. To reduce areas of negative regions, all images are further cropped to the size 288 × 448 × 140 as shown in Figure 2. At the classification stage, tumor regions are given by ground truths during training, while segmentation predictions from the previous stage are used instead during testing. All ROIs of tumors is resized to the size 32 × 32 × 3 to keep the input dimension fixed, which is required by most classification networks.
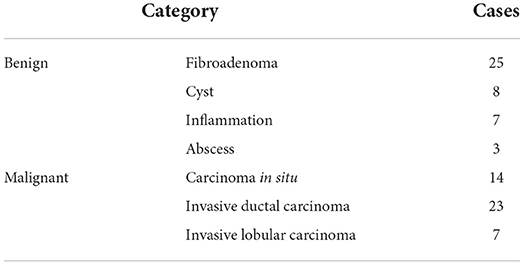
Table 1. Statistics of the dataset.
4.1. Evaluation metrics
Dice Similarity Coefficient (DSC) is commonly used for the quantitative analysis of the medical image segmentation. To evaluate the performance of tumor segmentation from the case level and global level perspectives, Case Dice Score and Global Dice Score are employed and defined, respectively as follows:
where pji ∈ {0, 1} and gji ∈ {0, 1} denote the category at i th pixel on the prediction and the annotation, respectively. N is the number of pixels in one case, i.e., the whole volume of a patient, and M denotes the number of cases. Case Dice Score is an average Dice Score over cases while Global Dice Score refers to a Dice Score obtained by regarding all volumes as a whole. For classification tasks, accuracy (Acc.), sensitivity (Sens.), specificity (Spec.), and Area Under the receiver operating characteristics Curve (AUC) are adopted.
4.2. Implementation details
The proposed models are implemented by using keras package (Chollet et al., 2015) on a NVIDIA TITAN XP GPU to accelerate training. We train the models with Adam (Kingma and Ba, 2015) with an initial learning rate of 0.001. Similar to Li et al. (2018b), a “poly” learning rate policy is employed, namely the initial learning rate is multiplied by , where iter denotes the iter-th training step, max_iter is the number of total training steps, and power = 0.9. Since deep learning demands a large amount of data for training, data augmentation methods, including random mirroring, rotation, scaling ranging from 0.8 and 1.2, and elastic distortion, are applied to increase training samples. Furthermore, the tumor segmentation network is initialized by transfer learning with a DenseNet-161 (Huang et al., 2017) pre-trained on the large-scale natural image dataset ImageNet (Deng et al., 2009) for classification tasks.
Since ground truths of breast are not provided directly but fine-tuned by radiologists on chosen ones from results generated by automatic landmark detection, the corresponding quantitative evaluation is not constructed due to the unfair comparison between a supervised learning model and an unsupervised learning one.
4.3. Ablation analysis
In this section, we conduct experiments to verify the effectiveness of the proposed methods that include attention blocks, focal loss, and pre-trained models. The quantitative results can be seen in Table 2.
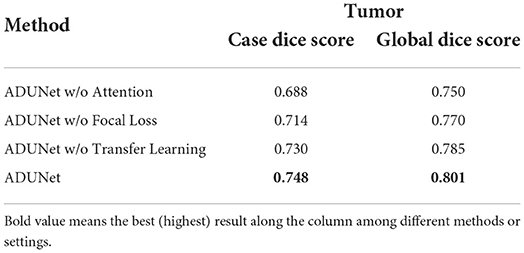
Table 2. Segmentation results of the ablation studies.
Attention blocks: It is worth noting that the loss function is 1−Dice if not specified. When attention blocks are removed (denoted as ADUNet w/o Attention), UNet-like connections are used instead. As shown in Table 2, it can be found that both scores decrease when the attention blocks are removed, so it demonstrates that attention blocks can improve the performance of ADUNet.
Focal loss: The performance of Dice loss function is compared with that of focal loss function to verify the effectiveness of the focal loss in ADUNet. We set α = 0.75 and γ = 0.25 for the focal loss empirically. From Table 2, compared with ADUNet w/o Focal Loss, it has improved the performance by 0.016 and 0.015 in Case Dice and Global Dice, respectively on the tumor segmentation.
Pre-trained models: The architecture of the encoder in a DenseUNet as the same as that in DenseNet-160, which is the features-learning part of DenseNet-161 trained on ImageNet. The DenseUNet can be initialized by transfer learning with the pre-trained model, which can find an optimal solution more quickly. To achieve that, weights of the encoder are loaded with pre-trained ones, while weights of the decoder are randomly initialized. Since the model is also trained with the focal loss, it can be regarded as pre-trained ADUNet with focal loss (denoted as ADUNet). It achieves Case Dice Score 0.748 and Global Dice Score 0.801, respectively, outperforming ADUNet without pre-trained weights (denoted as ADUNet w/o Transfer Learning).
4.4. Comparative experiments
In this section, ADUNet is compared with other prevalent deep-learning methods on the tumor segmentation and quantitative results are showed in Table 3. 2D UNet (Ronneberger et al., 2015) is a widely used network for medical segmentation and often regarded as a baseline model. Different from 2D UNet, 3D UNet (Çiçek et al., 2016) utilizes 3D convolution to learn volumetric contexts. However, 3D UNet suffers from high computational cost and GPU memory consumption, especially in a medical imaging scenario. Therefore, in practice, the implementation of 3D UNet is constrained by limited resources and cannot achieve significant superior performance as the theory claims. FusionNet (Quan et al., 2016) is a fully residual network with summation-based skip connections and much deeper than UNet. As shown in Table 3, ADUNet achieves better results than other comparison methods.
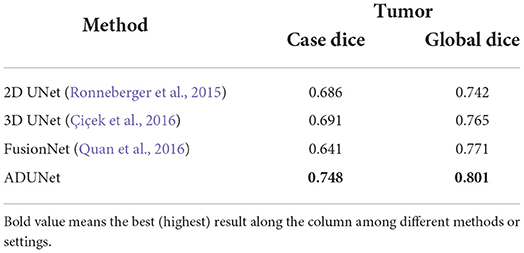
Table 3. Experimental results of the tumor segmentation.
4.5. Qualitative analysis of our method
The qualitative results of our method can be seen in Figure 7. The first and second rows show that the sizes of tumors vary greatly. Especially, the second row shows an example of an inapparent tumor. Even so, our method can segment these tumors accurately. The last row shows a hard example of tumor necrosis, which is also segmented accurately, indicating the effectiveness of ADUNet. Besides, the irrelevant organs in the abdominal cavity do not affect the segmentation as they have been excluded in stage 1, i.e., the stage of breast segmentation. Moreover, the 3D visualization of segmentation results and ground truths share similar shape.
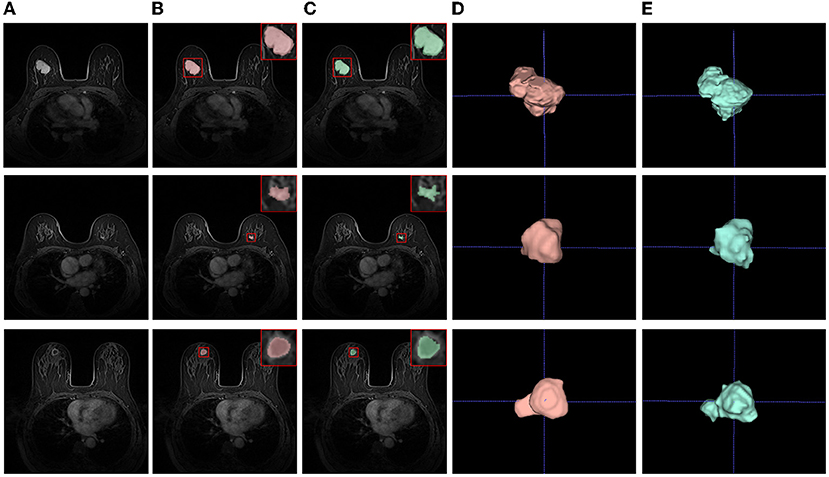
Figure 7. Examples of tumor segmentation results. (A) Test images; (B) Segmentation results; (C) Ground truths; (D) 3D visualizations of tumor segmentation results; (E) 3D visualizations of ground truths.
4.6. Classification results
In the testing phase, we sort tumors by size in descending, then select a portion of tumors for testing. Because small tumors are usually regarded as negative samples due to lack of biopsy results (ground truths) and their predictions are not trustworthy, the contribution of small tumors to the benignancy or malignancy is neglected. As shown in Figure 8A, three ROC curves in gray, yellow and blue, respectively, are drawn in terms of true positive rates (the vertical axis) and false positive rates (the horizontal axis) at different thresholds of probabilities predicted by the classification network. When all predicted tumors are considered, the gray ROC curve (denoted as Top 100%) indicates the smallest AUC, while the best performance is achieved by the blue ROC curve when only the top 50% of tumors (denoted as Top 50%) are selected by size. The ROC curves of case-level in Figure 8B also show that the top 50% is the best choice among all.
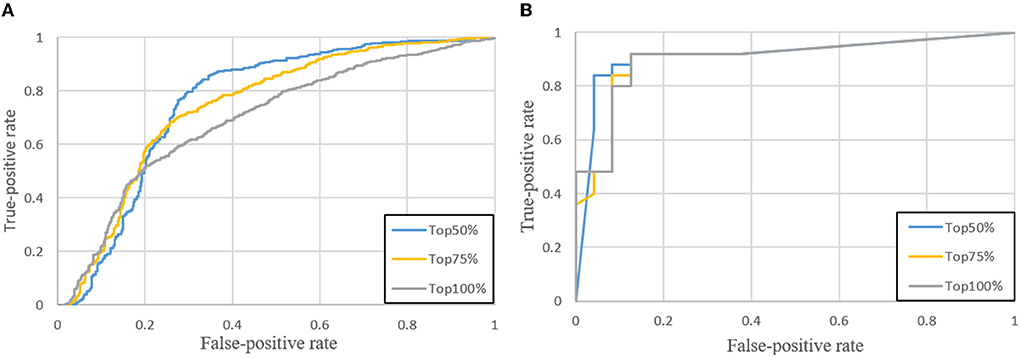
Figure 8. ROC curves when the top 50, 75, and 100% of tumors are selected. (A) Tumor-level; (B) Case-level.
To determine which size of tumor images is the most suitable for the proposed classification network, several experiments are conducted to analyze how the performance is affected by the size of tumors. As shown in Table 4, due to the square shape of tumor images, the image size denotes the width or the height. Obviously, the image size 32 is the best choice among all and employed in the proposed classifier.
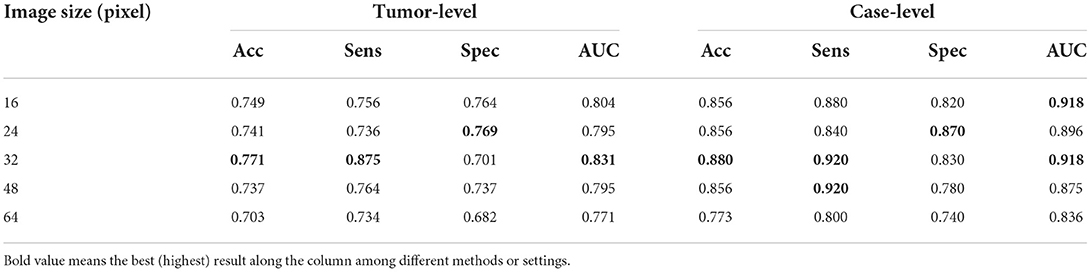
Table 4. Evaluations of tumor images at different sizes.
Our customized classification network is compared with two baseline models which both use CNN-M (Ioffe and Szegedy, 2015) as the feature extractor and a SVM and a softmax as the classifier, respectively. The quantitative results are showed in Table 5. The proposed method achieves sensitivity 0.920 and specificity 0.830, respectively at case-level. It outperforms the compared methods both on the accuracy and AUC. In addition, there are quite fewer parameters in the proposed classification network, i.e., 140K vs. 138M, the total number of parameters in CNN-M.
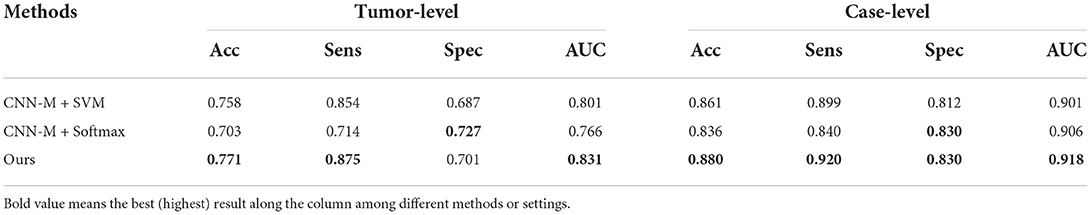
Table 5. Experimental results of the tumor-level and case-level classification.
5. Discussion
Breast cancer is a major public health problem worldwide for women. Fortunately, early breast carcinomas can be effectively diagnosed and controlled, so it is vitally important to diagnose breast cancer as early as possible. However, doctors in China often suffer from overtime working due to too many patients and even experienced radiologists could make mistakes after overloaded work. Although, from perspective of ethics, the automatic diagnosis is not well accepted, we believe an automatic diagnostic algorithm is a decision supporter for doctors rather than a substitution of doctors. Therefore, we propose a united algorithm including breast segmentation, tumor segmentation and tumor classification to save analyzing time and assist diagnosis of the radiologists.
Some limitations of our method are also worth mentioning and will be addressed in our future work. All data in this paper are collected from the same MRI device, thus it is reasonable to assume that they are from the same domain and independent identically distributed. Whether the proposed algorithm is robust enough in a multi-source case still remains an open question. Nonetheless, in our opinion, increasing training samples from different domains could ensure the proposed model as general as possible. Moreover, many domain adaptation methods are proposed to tackle multi-domain issues, and they can be applied to the proposed approach in our future work.
Although the proposed coarse-to-fine algorithm provides a united pipeline to generate breast segmentation, tumor segmentation and tumor classification results consecutively, each stage of the algorithm is trained separately, which makes each stage more robust and converge faster. Such training strategy considers each stage as a separate task and does not take into account the relationships between tasks. For instance, the detection of malignant tumors has a higher priority than that of other lesions in clinical practice, so it is valuable to pay more attention to them, but such information is not utilized at the tumor segmentation stage.
In conclusion, we present a full stack algorithm for automatic breast diagnosis on multi-series MRI images, where we predict regions and categories of tumors in a coarse-to-fine way. At the first stage, a DenseUNet model is employed to generate breast masks so that confusing organs in the abdominal cavity can be excluded afterwards. At the second stage, ADUNet, enhanced by attention blocks, is developed for the tumor segmentation. The attention blocks implement both the channel-wise attention and the element-wise attention. Furthermore, the focal loss is utilized to tackle class-imbalance and hard samples problems in tumor segmentation tasks. At the final stage, a customized classification CNN is proposed to identify whether a tumor is benign or malignant, guided by tumor segmentation results in previous stage. ADUNet can gracefully recover spatial locations of tumors by attention blocks in decoders. In summary, the automatic algorithm ADUNet is a full stack solution for breast diagnosis on multi-series MRI images from scanners to final predictions and can be easily deployed into clinical workflows.
Data availability statement
The datasets presented in this article are not readily available because the data is only used for internal research purposes. Requests to access the datasets should be directed to PW, tongjipjwangxhw@sina.com.
Ethics statement
The studies involving human participants were reviewed and approved by Ethics Committee, Tongji Hospital, School of Medicine, Tongji University, Shanghai. The patients/participants provided their written informed consent to participate in this study.
Author contributions
HX: data curation and writing–original draft preparation. GQ: software, validation, writing–review, and editing. XW: resources. YG and LW: data curation. HY: conceptualization, methodology, and software. ML: investigation. RC: software, validation, and visualization. PW: supervision and resources. All authors contributed to the article and approved the submitted version.
Funding
This work was supported by Key Research and Development Project, Ministry of Science and Technology of the People's Republic of China (2017YFC0112800), Special Funds for the Development of Information Technology, Shanghai Municipal Commission of Economy, and Informatization (XX-XXFZ-02-17-4126), and Program of Science and Technology Commission of Shanghai Municipality (No. 17411952300).
Conflict of interest
Authors HY and RC were employed by Imsight Technology Co., Ltd. Author ML were employed by Winning Health Technology Group Co., Ltd.
The remaining authors declare that the research was conducted in the absence of any commercial or financial relationships that could be construed as a potential conflict of interest.
Publisher's note
All claims expressed in this article are solely those of the authors and do not necessarily represent those of their affiliated organizations, or those of the publisher, the editors and the reviewers. Any product that may be evaluated in this article, or claim that may be made by its manufacturer, is not guaranteed or endorsed by the publisher.
References
Amit, G., Benari, R., Hadad, O., Monovich, E., Granot, N., and Hashoul, S. (2017). “Classification of breast mri lesions using small-size training sets: comparison of deep learning approaches,” in SPIE Medical Imaging (Orlando, FL), 101341H.
Ashraf, A. B., Gavenonis, S. C., Daye, D., Mies, C., Rosen, M. A., and Kontos, D. (2013). A multichannel markov random field framework for tumor segmentation with an application to classification of gene expression-based breast cancer recurrence risk. IEEE Trans. Med. Imaging 32, 637–648. doi: 10.1109/TMI.2012.2219589
Bhooshan, N., Giger, M. L., Jansen, S. A., Li, H., Lan, L., and Newstead, G. M. (2010). Cancerous breast lesions on dynamic contrast-enhanced mr images: computerized characterization for image-based prognostic markers. Radiology 254, 680. doi: 10.1148/radiol.09090838
Bray, F., Ferlay, J., Soerjomataram, I., Siegel, R. L., Torre, L. A.-D. L., and Jemal, A. (2018). Global cancer statistics 2018: Globocan estimates of incidence and mortality worldwide for 36 cancers in 185 countries. CA 68, 394–424. doi: 10.3322/caac.21492
Chen, K., Pang, J., Wang, J., Xiong, Y., Li, X., Sun, S., et al. (2019). “Hybrid task cascade for instance segmentation,” in IEEE Conference on Computer Vision and Pattern Recognition (Long Beach, CA: IEEE).
Chen, W., Giger, M. L., and Bick, U. (2006). A fuzzy c-means (fcm)-based approach for computerized segmentation of breast lesions in dynamic contrast-enhanced mr images1. Acad Radiol. 13, 63–72. doi: 10.1016/j.acra.2005.08.035
Chollet, F., and Others. (2015). Keras. GitHub. Available online at: https://github.com/fchollet/keras
Christ, P. F., Ettlinger, F., Grün, F., Elshaera, M. E. A., Lipkova, J., Schlecht, S., et al. (2017). Automatic liver and tumor segmentation of ct and mri volumes using cascaded fully convolutional neural networks. arXiv preprint arXiv:1702.05970. doi: 10.48550/arXiv.1702.05970
Çiçek, Ö., Abdulkadir, A., Lienkamp, S. S., Brox, T., and Ronneberger, O. (2016). “3D u-net: learning dense volumetric segmentation from sparse annotation,” in International Conference on Medical Image Computing and Computer-Assisted Intervention (Athens: Springer), 424–432.
Deng, J., Dong, W., Socher, R., Li, L.-J., Li, K., and Fei-Fei, L. (2009). “Imagenet: a large-scale hierarchical image database,” in 2009 IEEE Conference on Computer Vision and Pattern Recognition (Miami, FL: IEEE), 248–255.
Dinsha, D., and Manikandaprabu, N. (2014). Breast tumor segmentation and classification using svm and bayesian from thermogram images. Unique J. Eng. Adv. Sci. 2, 147–151.
Frana, L. K. L., Bitencourt, A. G. V., Paiva, H. L. S., da Silva, C. B., Pereira, N. P., Paludo, J., et al. (2017). “Role of magnetic resonance imaging in the planning of breast cancer treatment strategies: comparison with conventional imaging techniques,” in Radiologia Brasileira.
Hennig, J., Nauerth, A., and Friedburg, H. (1986). Rare imaging: a fast imaging method for clinical mr. Mag. Reson. Med. 3, 823–833. doi: 10.1002/mrm.1910030602
Herent, P., Schmauch, B., Jehanno, P., Dehaene, O., Saillard, C., Balleyguier, C., et al. (2019). Detection and characterization of mri breast lesions using deep learning. Diagn. Interv. Imaging 100, 219–225. doi: 10.1016/j.diii.2019.02.008
Huang, G., Liu, Z., Maaten, L. V. D., and Weinberger, K. Q. (2017). “Densely connected convolutional networks,” in IEEE Conference on Computer Vision and Pattern Recognition (Honolulu, HI: IEEE), 2261–2269.
Ioffe, S., and Szegedy, C. (2015). “Batch normalization: accelerating deep network training by reducing internal covariate shift,” in International Conference on Machine Learning (Lille), 448–456.
Jiang, P., Peng, J., Zhang, G., Cheng, E., Megalooikonomou, V., and Ling, H. (2012). “Learning-based automatic breast tumor detection and segmentation in ultrasound images,” in IEEE International Symposium on Biomedical Imaging (Barcelona: IEEE), 1587–1590.
Kalli, S., Semine, A. A., Cohen, S., Naber, S. P., Makim, S. S., and Bahl, M. (2018). American joint committee on cancer's staging system for breast cancer, eighth edition: what the radiologist needs to know. Radiographics 38, 1921–1933. doi: 10.1148/rg.2018180056
Khened, M., Kollerathu, V. A., and Krishnamurthi, G. (2019). Fully convolutional multi-scale residual densenets for cardiac segmentation and automated cardiac diagnosis using ensemble of classifiers. Med. Image Anal. 51, 21–45. doi: 10.1016/j.media.2018.10.004
Kingma, D. P., and Ba., J. (2015). Adam: A method for stochastic optimization. arXiv [Preprint]. arXiv: 1412.6980. Available online at: http://arxiv.org/abs/1412.6980
Li, H., Xiong, P., An, J., and Wang, L. (2018a). “Pyramid attention network for semantic segmentation,” in British Machine Vision Conference (Newcastle).
Li, X., Chen, H., Qi, X., Dou, Q., Fu, C.-W., and Heng, P.-A. (2018b). H-denseunet: hybrid densely connected unet for liver and tumor segmentation from ct volumes. IEEE Trans. Med. Imaging 37, 2663–2674. doi: 10.1109/TMI.2018.2845918
Lin, T.-Y., Goyal, P., Girshick, R., He, K., and Dollár, P. (2017). “Focal loss for dense object detection,” in Proceedings of the IEEE International Conference on Computer Vision (Venice: IEEE), 2980–2988.
Long, J., Shelhamer, E., and Darrell, T. (2015). “Fully convolutional networks for semantic segmentation,” in IEEE Conference on Computer Vision and Pattern Recognition (Boston, MA: IEEE), 3431–3440.
Luo, L., Chen, H., Wang, X., Dou, Q., Lin, H., Zhou, J., et al. (2019). Deep angular embedding and feature correlation attention for breast mri cancer analysis. arXiv preprint arXiv:1906.02999. doi: 10.1007/978-3-030-32251-9_55
Maicas, G., Bradley, A. P., Nascimento, J. C., Reid, I., and Carneiro, G. (2018). “Training medical image analysis systems like radiologists,” in International Conference on Medical Image Computing and Computer-Assisted Intervention (Granada: Springer), 546–554.
Milletari, F., Navab, N., and Ahmadi, S. A. (2016). “V-net: fully convolutional neural networks for volumetric medical image segmentation,” in International Conference on 3D Vision (Stanford, CA), 565–571.
Mnih, V., Heess, N., and Graves, A. (2014). “Recurrent models of visual attention,” in Advances in Neural Information Processing Systems (Montréal), 2204–2212.
Oktay, O., Schlemper, J., Folgoc, L. L., Lee, M., Heinrich, M., Misawa, K., et al. (2018). “Attention u-net: learning where to look for the pancreas,” in Medical Imaging with Deep Learning (Amsterdam).
Piantadosi, G. (2018). Comprehensive computer-aided diagnosis for breast t1-weighted dce-mri through quantitative dynamical features and spatio-temporal local binary patterns. IET Comput. Vis. 12, 1007–1017. doi: 10.1049/iet-cvi.2018.5273
Quan, T. M., Hildebrand, D. G., and Jeong, W.-K. (2016). Fusionnet: a deep fully residual convolutional neural network for image segmentation in connectomics. arXiv preprint arXiv:1612.05360.
Ronneberger, O., Fischer, P., and Brox, T. (2015). “U-net: convolutional networks for biomedical image segmentation,” in International Conference on Medical Image Computing and Computer-Assisted Intervention (Munich), 234–241.
Roth, H. R., Lu, L., Lay, N., Harrison, A. P., Farag, A., Sohn, A., et al. (2017). Spatial aggregation of holistically-nested convolutional neural networks for automated pancreas localization and segmentation. Med. Image Anal. 45, 94. doi: 10.1016/j.media.2018.01.006
Thakran, S., Chatterjee, S., Singhal, M., Gupta, R. K., and Singh, A. (2018). Automatic outer and inner breast tissue segmentation using multi-parametric mri images of breast tumor patients. PLoS ONE 13, e0190348. doi: 10.1371/journal.pone.0190348
Torre, L. A.-D. L., Islami, F., Siegel, R. L., Ward, E. M., and Jemal, A. (2017). Global cancer in women: burden and trends. Cancer Epidemiol. Biomark. Prevent. 26, 444–457. doi: 10.1158/1055-9965.EPI-16-0858
Vignati, A., Giannini, V., De, L. M., Morra, L., Persano, D., Carbonaro, L. A., et al. (2011). Performance of a fully automatic lesion detection system for breast dce-mri. J. Mag. Reson. Imaging 34, 1341–1351. doi: 10.1002/jmri.22680
Wang, F., Jiang, M., Qian, C., Yang, S., Li, C., Zhang, H., et al. (2017). “Residual attention network for image classification,” in Computer Vision and Pattern Recognition (Honolulu, HI), 6450–6458.
Wen, D., Liu, Y., Yuan, K., Si, S., and Shen, Y. (2017). “Attention-aware path-based relation extraction for medical knowledge graph,” in International Conference on Smart Computing and Communication (Shenzhen), 321–331.
Wu, Y., and He, K. (2020). Group normalization. Int. J. Comput. Vis. 128, 742–755. doi: 10.1007/s11263-019-01198-w
Yao, J., Chen, J., and Chow, C. (2009). Breast tumor analysis in dynamic contrast enhanced mri using texture features and wavelet transform. IEEE J. Sel. Top. Signal Process. 3, 94–100. doi: 10.1109/JSTSP.2008.2011110
Yin, W., Ebert, S., and Schütze, H. (2016). “Attention-based convolutional neural network for machine comprehension,” in Proceedings of the Workshop on Human-Computer Question Answering. Association for Computational Linguistics (San Diego, CA).
Yu, L., Yang, X., Chen, H., Qin, J., and Heng, P.-A. (2017). “Volumetric convnets with mixed residual connections for automated prostate segmentation from 3D MR images,” in AAAI (San Francisco, CA), 66–72.
Yuan, Y., Chao, M., and Lo, Y.-C. (2017). Automatic skin lesion segmentation using deep fully convolutional networks with jaccard distance. IEEE Trans. Med. Imaging 36, 1876–1886. doi: 10.1109/TMI.2017.2695227
Yuan, Y., Giger, M. L., Li, H., Bhooshan, N., and Sennett, C. A. (2010). Multimodality computer-aided breast cancer diagnosis with ffdm and DCE-MRI. Acad. Radiol. 17, 1158–1167. doi: 10.1016/j.acra.2010.04.015
Zhang, J., Liu, M., Li, W., Si, C., Peng, Y., Li, J., et al. (2017). “Joint craniomaxillofacial bone segmentation and landmark digitization by context-guided fully convolutional networks,” in International Conference on Medical Image Computing and Computer-Assisted Intervention, 720–728.
Zheng, Y., Baloch, S., Englander, S., Schnall, M. D., and Shen, D. (2007). “Segmentation and classification of breast tumor using dynamic contrast-enhanced mr images,” in International Conference on Medical Image Computing and Computer-Assisted Intervention (Quebec City), 393–401.
Keywords: breast diagnosis, computer-aided diagnosis, magnetic resonance imaging, deep learning, multi-series
Citation: Xue H, Qian G, Wu X, Gao Y, Yang H, Liu M, Wang L, Chen R and Wang P (2022) A coarse-to-fine and automatic algorithm for breast diagnosis on multi-series MRI images. Front. Comput. Sci. 4:1054158. doi: 10.3389/fcomp.2022.1054158
Received: 26 September 2022; Accepted: 07 November 2022;
Published: 24 November 2022.
Edited by:
Xiao Wang, Anhui University, ChinaReviewed by:
Yanan Sun, Sichuan University, ChinaTang Wei, Fudan University Shanghai Cancer Center, China
Copyright © 2022 Xue, Qian, Wu, Gao, Yang, Liu, Wang, Chen and Wang. This is an open-access article distributed under the terms of the Creative Commons Attribution License (CC BY). The use, distribution or reproduction in other forums is permitted, provided the original author(s) and the copyright owner(s) are credited and that the original publication in this journal is cited, in accordance with accepted academic practice. No use, distribution or reproduction is permitted which does not comply with these terms.
*Correspondence: Peijun Wang, tongjipjwangxhw@sina.com
†These authors have contributed equally to this work