 Avinash Jairam
 Tzipora Halevi
 Theodore Raphan
- 1Ph.D. Program in Computer Science, Graduate Center of CUNY, New York, NY, United States
- 2Department of Computer and Information Science, Brooklyn College of CUNY, Brooklyn, NY, United States
- 3Ph.D. Program in Psychology and Neuroscience, Graduate Center of CUNY, New York, NY, United States
At present, interfaces between users and smart devices such as smart phones rely primarily on passwords. This has allowed for the intrusion and perturbation of the interface between the user and the device and has compromised security. Recently, Frank et al. have suggested that security could be improved by having an interface with biometric features of finger swiping. This approach has been termed touchalytics, in maintaining cybersecurity. The number of features of finger swiping have been large (32) and have been made available as a public database, which we utilize in our study. However, it has not been shown which of these features uniquely identify a particular user. In this paper, we study whether a subset of features that embody human cognitive motor features can be used to identify a particular user. We consider how the security might be made more efficient embodying Principal Component Analysis (PCA) into the interface, which has the potential of reducing the features utilized in the identification of intruders. We compare the accuracy and performance of the reduced feature space to that of having all the features. Embodying a robust continuous authentication system will give users an extra layer of security and an increased sense of peace of mind if their devices are lost or stolen. Consequently, such improvements may prevent access to sensitive information and thus will save businesses money. Consequently, such improvements may prevent access to sensitive information and thus will save businesses money. If continuous authentication models become successful and easily implementable, embodiment and co-adaptation of user authentication would inhibit the growing problem of mobile device theft.
Introduction
Communication between individuals has an inherent authentication problem to determine if the sender is who he/she claims to be. This authentication problem has intrigued mankind for millennia. One of the first authentication systems dealt with the problem of point-to-point communication and addressed whether we could trust the person on the other end of a conversation (Dooley, 2013). As society expanded, humans have developed increasingly better systems for communicating over long distances. With each advancement, there exist unscrupulous individuals who will exploit weaknesses in the communication link to prey upon and exploit unsuspecting users (Dooley, 2013). In fact, the wider the communication links and the greater the distance they span, the more likely that the communications medium will become a target for impersonators. Thus, at each stage of advancement, the need for verifying the identity of individuals far away and the need for better authentication systems have become increasingly important. One useful approach was the development of what has been referred to as biometric authentication (Bhattacharyya et al., 2009).
The idea of using biometric features, such as retinal scanning, gait characteristics, EEG biometrics, ear biometrics or combinations thereof have been a subject of investigation for quite some time in order to identify an individual's personal identity (Horst et al., 2019; Ma et al., 2020; Olanrewaju et al., 2020). These studies are based on the idea that every human has a unique anatomy, resulting in unique behavioral characteristics. For example, each human has a unique vocal tone because of the size and shape of the mouth and throat (Bhattacharyya et al., 2009). However, these techniques have described general characteristics of human features. For example, gait characteristic such as stride length, step frequency, and gait velocity, which are features of human gait (Cho et al., 2006, 2010; Osaki et al., 2007, 2008; Raphan, 2020) are difficult to implement for continuous monitoring by mobile handheld devices, which are generally used to examine documents and may be used while sitting or using transportation without walking. Neither is EEG an adequate medium for implementing continuous authentication of a user when these mobile devices are used in a wide range of environments. Finger swiping on the other hand has become the natural interface between humans and mobile devices and can be used in a wide range of environments. Therefore a concerted effort has been made to understand how the biometrics of finger swiping can be incorporated into the user interface of mobile devices (Frank et al., 2013).
The evolution of touch dynamics has progressed from the time of the introduction of the telegraph system to the present (Figure 1). The advent of the telegraph allowed messages to travel across the Atlantic within hours. Accordingly, the telegraph quickly became the information superhighway of its era and governments around the world soon adapted this technology (Telegraph, 2016). To ensure secure transmission of data, telegraph operators realized that they could identify each other by the timing patterns of their fellow operators over the medium. That is, the character set of Morse Code is the language of the telegraph and it consists of a series of dots and dashes. Telegraph operators noticed that the timing interval between when a dot and a dash is transmitted appeared to be unique to the user on the other end. Therefore, a pair of telegraph operators can become familiar with their counterpart's timing intervals and thus could identify each other and authenticate the transmission (Jenkins et al., 2011).
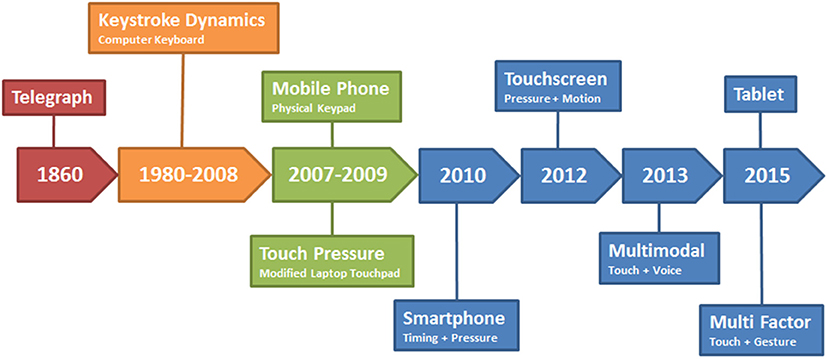
Figure 1. Evolution of touchalytics research [taken from Teh et al. (2016)]. The timeline of using finger strokes for identifying users has a history (see text for historical perspective).
During World War II, the American military intelligence community developed the “FIST,” which attempted to improve the security of Morse Code over wireless networks (Jenkins et al., 2011). Rapidly moving army units needed to communicate with their rear echelon commanders in real time. However, the dynamic nature of a battlefield made it impossible to erect telephone poles along the battle routes (Jenkins et al., 2011). Therefore, field units used Morse Code over portable two-way radios to communicate with each other. However, the risk of enemy eavesdropping and intercepting the wireless communications persisted and radio operators had to remain anonymous. Consequently, the army further developed the behavior biometric of identifying a radio operator by the gaps in their taps on the radio (Jenkins et al., 2011).
The 1970's saw the rise of computer terminals with operators sitting at keyboards and entering commands and typing messages. Consequently, IBM researchers considered that keyboard typing rhythms can be used to distinguish typists. Spillane asserted this in a bulletin, but did not mention any experiments which were conducted (Spillane, 1975; Killourhy, 2012). However, Forsen et al. (1977) conducted several tests in order to determine whether or not the typing patterns of one typist can be determined. Among the experiments conducted was one where a small group of subjects were asked to type their own and each other's names. The researchers presented findings indicating that it was possible to identify the subjects typing their own names from those who were not (Killourhy, 2012).
A more in-depth study was conducted by Gaines (Gaines et al., 1980) using seven typists to transcribe three passages of words and sentences while monitoring the time between when a key was pressed and when it was released. From this timing, they were able to analytically determine differences among typing patterns. The researchers found that time between two consecutive keystrokes follow a log-normal distribution. Moreover, they were able to develop a statistical test which was able to successfully distinguish which transcript was typed by each of the seven typists. However, the authors acknowledged that more research would be needed in order for their findings to be conclusive, since their experiment was conducted on a small population (Gaines et al., 1980; Killourhy, 2012). The 1990's and early 2000's saw researchers endeavoring to use machine learning algorithms to classify whether or not a series of keystrokes belonged to a particular user. Brown and Rogers (1994) utilized a neural network to identify imposters with a 0% miss rate and a 12% false positive rate. Moreover, Azevedo et al. (2007a,b) modified a Support Vector Machine classifier which utilized genetic algorithms and particle swarm optimization and thus achieved miss and false positive rates between 1.1 and 1.2% (Killourhy, 2012).
The touch screen was developed in the 1960's for air traffic control systems (Ion, 2013). Today, they are found in ATM machines, self-service kiosks, and most notably, the smartphone. Moreover, the internet has replaced the letter, telephone, telegraph, and desktop computers for communication. Today, the smartphone is the most commonly used communication device and is always connected to the internet. People store a variety of personal and sensitive information on their smartphones from credit card information, photographs, fingerprints, emails, and text messages. Hence, this development has provided the impetus for adversaries to conduct their activities on a much wider scale. In fact, one in three mobile phone users has experienced device theft (Norton, 2011). Gaining access to a person's mobile phone can allow a criminal the opportunity to commit a variety of dangerous actions such as impersonating the legitimate user and stealing that person's identity.
When a Personal Identification Number (P.I.N) is used for identification, an intruder can possibly steal the PIN by looking over the shoulder of a user logging into a system, i.e., “shoulder surfing.” As a result of the greater use of the touchscreen, biometric verification methods for mobile devices are becoming an important tool to ensure security for usage of the mobile devices (Trewin et al., 2012). Conventional sensors are fingerprint sensors, retina scanners, and facial recognition cameras, which are now embedded in a large array of devices (Trewin et al., 2012). However, many of these biometric verification methods are single use authentication schemes, which can be compromised by other users and then be used to access sensitive information. Fingerprint identification can be compromised by activating the device while a person is asleep. For example, a suspicious wife unlocked her sleeping husband's phone on an airplane and found information implicating her spouse in an extramarital affair (Sky-News, 2017). Even retinal and facial recognition systems can be compromised by malicious or coerced intruders. In fact, hackers were able to trick the retinal scanner on Samsung's flagship Galaxy S8 phone within 1 month of the phone's release (Hern, 2017). Furthermore, attackers are becoming more adept at using social engineering to elicit passwords and other authentication means from unsuspecting individuals such as seniors and teenagers. That is, attackers utilize spear-phishing and are able to convince users to download malware onto computers. This malware then grants the attackers access to the victims' machine (Ariu et al., 2017). In general, once the device is compromised, it would allow the intruder unfettered access to the phone's contents, which could have serious consequences.
Prior to the proliferation of the touchscreen smartphone, mobile phones with physical keypads were the norm (Mcloughlin and Naransamy, 2009). These devices were secured by P.I.N codes which the user had to physically type on the keypads. However, the keypad can only record the timing interval of the keystrokes and thus this severely limits the ability of a classifier to authenticate a user using this biometric feature (Teh et al., 2016). In fact, while mobile keypad analytics may result in lower accuracies than that of other biometric methods, it has been asserted by Ali et al. (2017) that such an approach is nevertheless economic, noninvasive, and provides an opportunity for continuous authentication.
Recently, there has been a focus on co-adaptation and Embodiment as a means for human interaction with robotic systems (Beckerle et al., 2019). Co-adaptation is where the machine adapts to the human operator, while the human adapts to it. Embodiment is where the participants are equipped with the investigated technical device and become part of the human–machine system and its control loop. Due to the direct interaction of both partners, such experiments can yield detailed information during the usage, which might not be captured by post experiment questionnaires or measures. This might even be performed during development to guide the design in a user-centered direction (Beckerle et al., 2019). It has been suggested that Co-adaptation and Embodiment can have a more general framework (Ziemke, 2003). One way to look at embodiment is as a structural coupling (Ziemke, 2003). A system “X” is embodied in an environment “E” if perturbatory channels exist between the two. That means, “X” is embodied in “E” if for every time “t” at which both “X” and “E” exist, some subset of E's possible states with respect to “X” have the capacity to perturb X's state, and some subset of X's possible states with respect to “E” have the capacity to perturb E's state (Ziemke, 2003). From this perspective biometric security methods in user interfaces would be important for cybersecurity. Co-adaptation can be imagined as a transformation of a “simple tool” to that of an “intelligent tool.” As a result of this transformation, the new tool becomes pivotal to the defining and accomplishing the user's security goal (Sanchez et al., 2009). An application of these ideas can be used to build better security systems for user interaction with smart devices. The user's goal in communicating with a smart device is to maintain security.
Saevanee and Bhatarakosol (2008) simulated a touch screen by collecting finger stroke data from a laptop's touchpad. Users were asked to enter various 10-digit codes using the touch pad entirely. The features extracted were the inter stroke time, the hold time (time which a finger was on the keypad) and the finger pressure. Finger pressure, according to Teh et al. (2016) can be determined by the device's operating system. A user's touch pressure value is directly related to the strength of that user's finger muscle. Therefore, the touch pressure is unique to each user and is very difficult for a shoulder surfing adversary to imitate by mere observation (Teh et al., 2016). In fact, Saevanee and Bhatarakosol (2008) reported that when finger pressure was used as the input to a KNN classifier, 99% accuracy was reported. Moreover, when all three of the aforementioned features where considered the accuracy fell to 90%. Frank et al. (2013) endeavored to understand how many finger swipes/strokes contributed to better performance rates. They postulated that a series of strokes belonging to an individual user resulted in better results than that of a single stroke. Their experiments yielded a 13% equal error rate (EER) for a single stroke and 2–3% for 11−20 (inclusive) strokes (Frank et al., 2013). Miguel-Hurtado et al. (2016) presented findings which indicated that it was possible to predict the sex of a mobile user based on finger strokes. Their experiment utilized the SSD dataset which consisted of 116 users (Guest et al., 2014). By utilizing Naïve Bayes and Logistic classifiers, the researchers were able to make predictions with ~78% accuracy. Wang et al. (2017) endeavored to utilize the same biometric method to augment continuous authentication and cross device authentication by conducting a similar study. That is, the researchers proposed transferring a behavioral model from one device to others in order to compare results. Subjects were tasked with interacting with a News application on different devices and various touch stroke characteristics were collected including the X, Y coordinates of their fingers on the screen, timestamp, pressure, and finger size. Consequently, an area under curve score of 80–96% was achieved by utilizing SVM and Random Forest classifiers (Wang et al., 2017).
One way to have an extra level of security and protect the system is to implement a continuous authentication method, without imposing a burdensome requirement of having to re-enter the identification. One such methodology has been developed and is known as Touch analytics (Frank et al., 2013). This technique is the process of user authentication based on finger movements on a touchscreen. Each user has a unique way in which he uses a mobile phone's touchscreen. For example, the way one user's fingers swipe a touch screen is different from that of another (Frank et al., 2013) and could be the basis of devising continuous monitoring of user-phone interaction and making it more secure. The swipe is one of the most frequent methods in which a user interacts with a smartphone. In fact, research has proven the swipe to be a reliable means of identifying users (Ellavarason et al., 2020). In real time, the swiping can adapt to the touchscreen while the touchscreen's intelligent interface adapts to the human swiping, implementing co-adaptation (Beckerle et al., 2019).
The Intricacies of a Touch Dynamics System
According to Teh et al. (2016), the schematic of any touch dynamics system follows the diagram outlined in Figure 2. That is, before any type of authentication can be done, there must be data. In any smartphone, the touch-strokes are recorded using sensors embedded in the touchscreen. Next, the data needs to be preprocessed or cleaned in order to remove error values and outliers which can mislead the classifier during training. Thereafter, feature extraction is done in order to reduce the effects of dimensionality (Teh et al., 2016). Accordingly, the model is then trained on the training data and then evaluated on the test set. However, given the continuous nature of the proposed authentication mechanism on a smartphone, there is an error correction loop in the process. That is, after the model makes a decision, it continues to collect data in the form of touch strokes and attempts to retain itself and adapt using the new data (Teh et al., 2016).
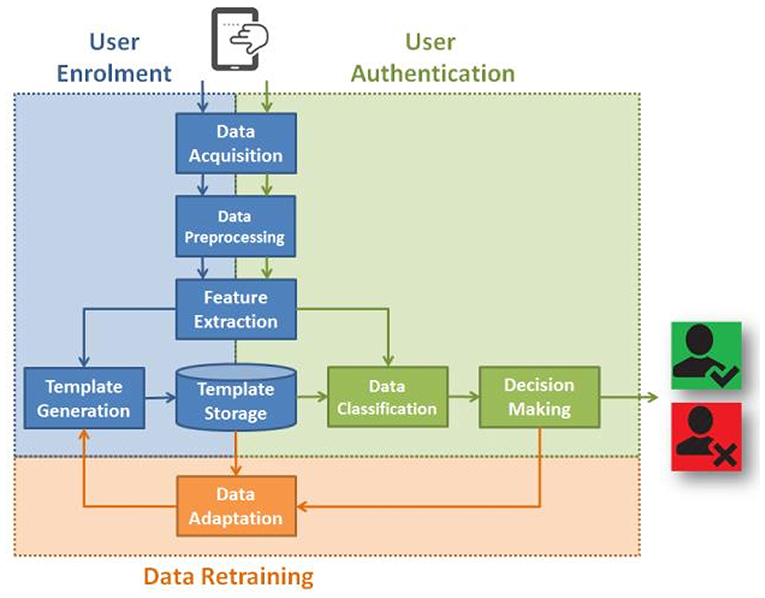
Figure 2. A touchalytics framework for identifying a user [taken from Teh et al. (2016)]. (1) The data is acquired from finger swiping of a mobile device. (2) The data is pre-processed. (3) Features are extracted. (4) The data are classified. (5) A decision about whether the user is appropriate or not. The decision is fed back and the template for the user is adapted and stored. Taken from Teh et al. (2016).
Motivations
The objective of our study is to investigate how the utilization of a broad range and continuous monitoring of user interaction with a device can be made fast enough to ensure that the owner of the device is using it and the control of the device has not been compromised. However, the number of features defined are relatively large and could compromise the performance of the system because the KNN algorithm used by Frank et al. (2013) suffer from the curse of dimensionality (Yiu, 2019).
All the major studies conducted on touch stroke dynamics on mobile devices was outlined (Ellavarason et al., 2020; Figure 3). From this table (Figure 3), we can see that the primary classification algorithms used are Support Vector Machines, Nearest Neighbors, Decision Trees Random Forests, Logistic Regression, and Bayesian models. Touch strokes on a mobile device often happen in a sequence of actions. That is, almost everyone utilizes more than one touch stroke when interacting with a smartphone. Therefore, the nature of this process makes it a prime candidate for time series analysis. For example, when given “n” consecutive touch strokes of a user, what is the probability that the “n+1” stroke will belong to that said user? From our review of the literature, we found no time series approach taken to solve the authentication problem outlined by Frank et al. (2013) and is a possible extension from that proposed in this paper.
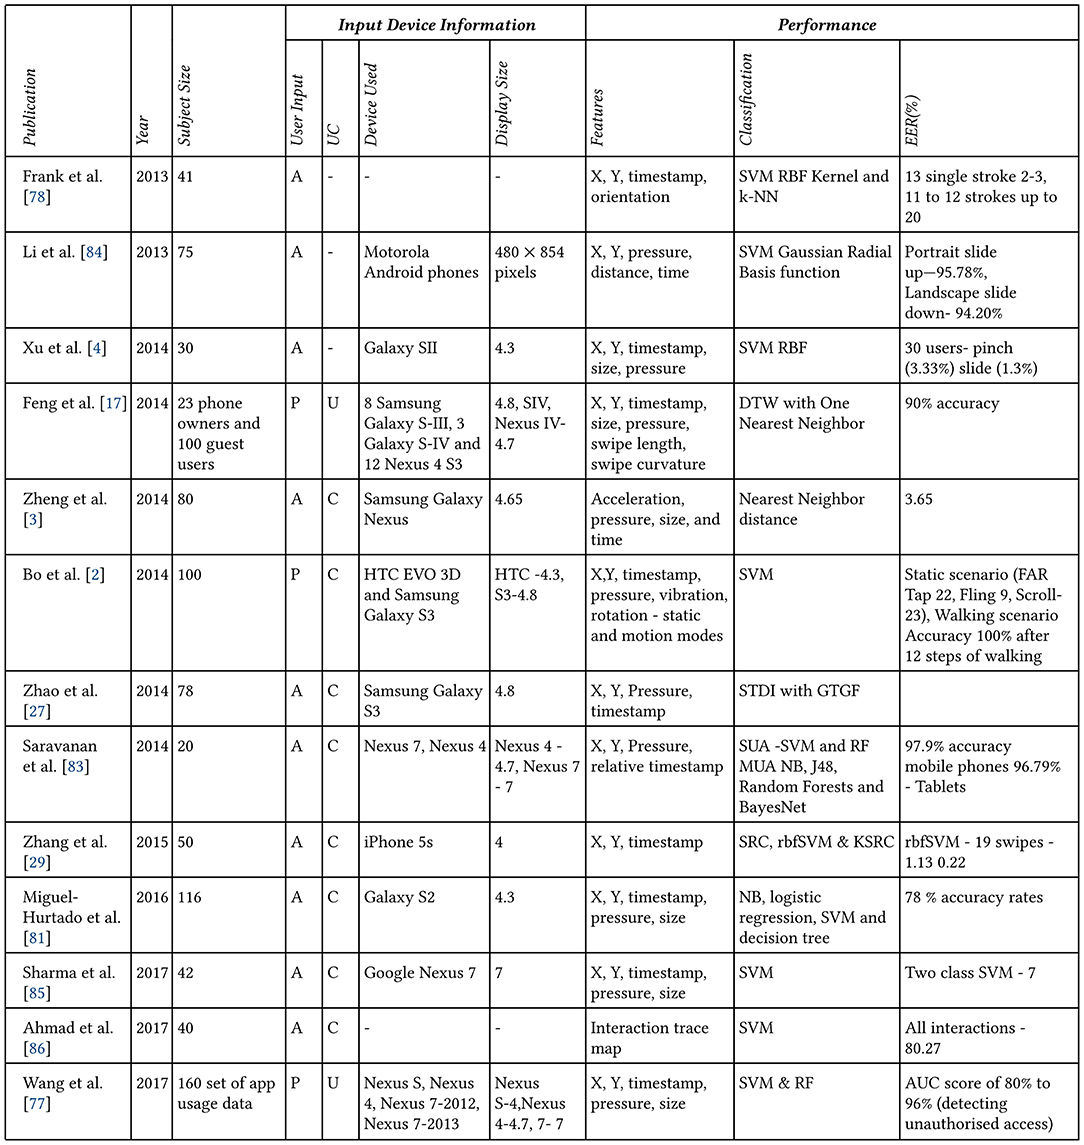
Figure 3. The progression of touch dynamics research, which has evolved into what is presently called touchalytics. Taken from Ellavarason et al. (2020).
The purpose of this paper is to explore the present effectiveness of Touch-analytics and consider how this might be improved using Principal Component Analysis (PCA) and compare the performance of the reduced feature space to that of having all the features. PCA analysis computes the eigenvectors of the covariance matrix of the defined touchanalytics features. This covariance matrix is symmetric and generates an orthogonal basis of PCA vectors, which can be used to optimize the important features. There are algorithms that can compute PCA in real time using Oja's rule in a neural net implementation of Hebbian learning (Oja, 1989). A robust continuous authentication system will give users an extra layer of security and an increased sense of peace of mind if their devices are lost or stolen. Consequently, such improvements using PCA may prevent access to sensitive information and thus will save businesses money (Lau, 2018). If continuous authentication models become successful and easily implementable, it would inhibit the growing problem of mobile device theft (Norton, 2011).
Methodological Approach
One particular measure of the effectiveness of the authentication procedure is to use Decision Theory to reduce the false acceptance vs the false rejection of a user (Powers, 2020). One such metric has been defined as the Equal Error Rate (EER) as the intersection point of the false rejection and false acceptance (Kar-Ann, 2008; Figure 4). In this paper, we develop and implement a touch classifier that improves the EER of a single stroke mobile authentication system. The research described in this paper lends itself to further enhancement using neural network authentication schemes.
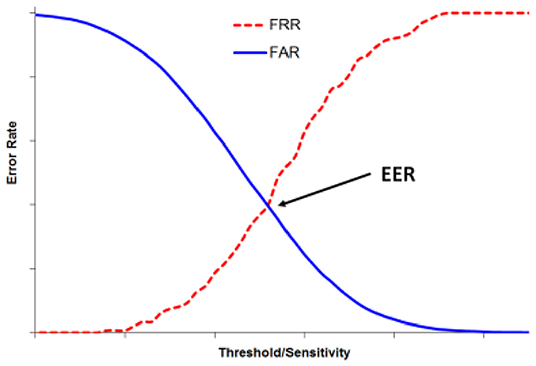
Figure 4. The relationship between the False Reject Rate (FRR) and False Accept Rate (FAR) as a function threshold sensitivity. FRR increases with threshold sensitivity while FAR declines as function of threshold sensitivity. The Equal Error Rate (EER) is the threshold sensitivity at the point of intersection of these two functions. This is an accepted evaluation metric for biometric authentication systems. Taken from Teh et al. (2016).
The Frank et al. (2013) study implemented two classifiers in order to determine if a series of stroke patterns belonged to a particular user. These classifiers implemented the K-Nearest Neighbors and the Support Vector Machines algorithm. Frank et al. (2013) to identify a particular user.
Results
The model of Frank et al. (2013) has postulated that there are 30 features, which can be derived from a single stroke by a finger on a touch screen (see Appendix B for this list). As a first pass, we implemented the KNN and PCA algorithms as a basis for comparison to those of Frank et al. (2013). A python implementation is given in Appendix A.
KNN Implementation
We first tested the efficacy of all the features by implementing a K-Nearest Neighbors algorithm and compared it with the results obtained by Frank et al. (2013) who used MATLAB in their implementation. This was used as a basis for comparing their results with our implementation of this system and finding the PCA components (Figure 5). We utilized the KNN clustering algorithm because Frank et al. (2013), used it in their studies and we wished to insure that the dimensionality reduction that we found from the PCA analysis of the finger swiping data was not affected by the clustering algorithm used. This was important for comparison purposes.
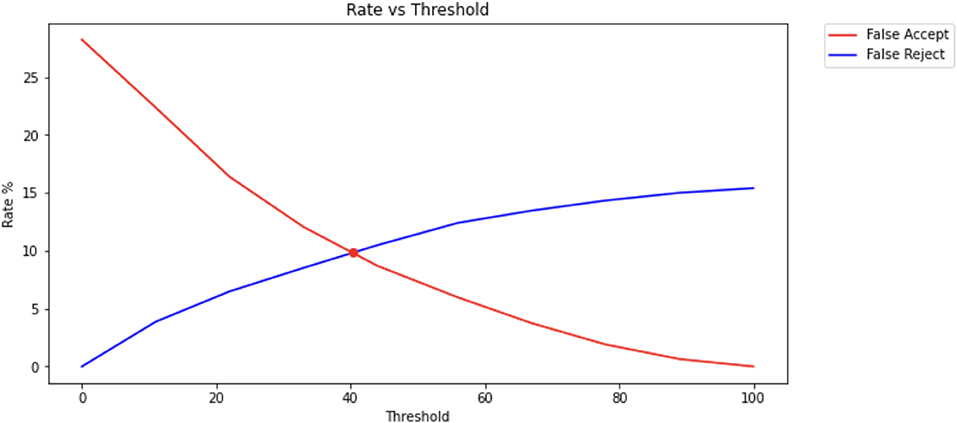
Figure 5. Equal error rate percentage that was achieved by our implementation of the KNN and PCA for finger swiping. This value was approximately equal to that obtained by Frank et al. (2013), despite the fact that fewer features of the finger swiping were utilized.
We implemented a principal component (PCA) program (Appendix A) to extract the dominant features from the given 30 features and compared the results to those using the K-nearest neighbor algorithm.
PCA-Based Algorithm Design and Implementation
It is possible to determine which features in a dataset are more relevant when performing principal component analysis process. Hence, the phone ID, User ID, and document ID fields were removed from the dataset as (Frank et al., 2013) indicated that such were not to be used for testing. Feature Scaling was then performed on the data using the standardization technique. A covariance matrix was then extracted from the dataset using the scikit-learn library in Python (Pedregosa et al., 2011). This was followed by an eigenvector decomposition from this matrix using the scikit-learn Python library function.
The distribution of the variance among all the Principal Components derived from the dataset with descending variance shows that the first 15 principal components contain most of the variance (Figures 6, 7). Among these principal components, we consistently determined the following dominant features that can be used in computing the equal error rate:
1. average velocity
2. largest deviation from end-to-end line
3. 50%-perc. pairwise acc
4. length of trajectory
5. start $y$
6. mean resultant length
7. up/down/left/right flag
8. start $x$
9. mid-stroke area covered
10. inter-stroke time
11. mid-stroke pressure
12. mid-stroke finger orientation
13. stroke duration
14. 20%-perc. pairwise velocity
15. phone orientation.
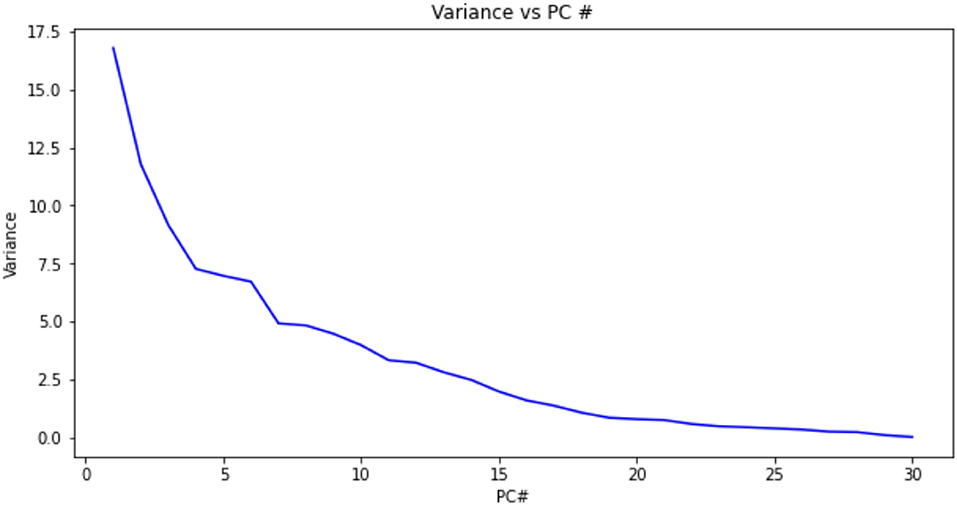
Figure 6. Variance as a function of principal component f(PC#) using the data from Frank et al. (2013). The variance orders the principal components. The cumulative variance reaches a plateau and is a measure of the number of PC's necessary to contain the information necessary to identify a pattern of finger swiping.
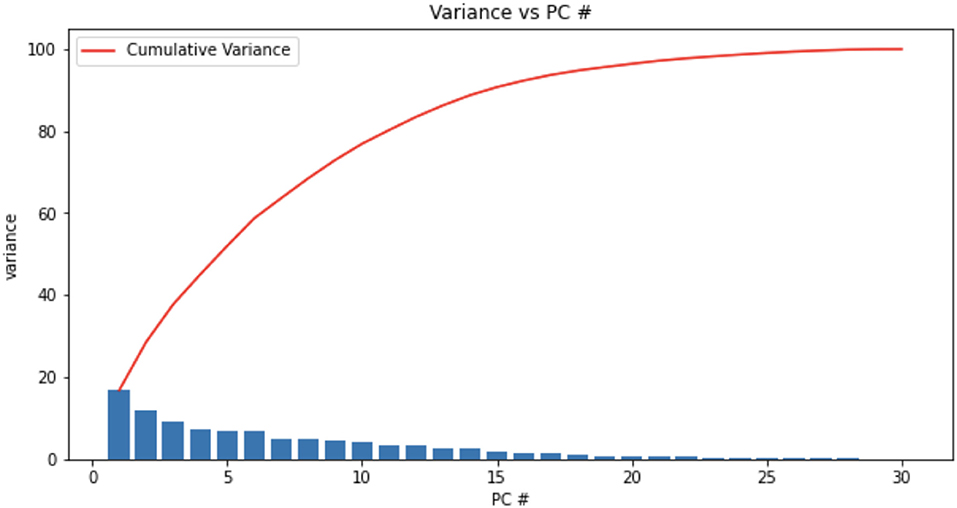
Figure 7. The variance vs. the 30 principal components. The cumulative variance reached a plateau at close to 15 principal components. We found that 23 of the 30 principal components were the most prominent. See text for details.
Therefore, we can conclude that these 15 features are most helpful in uniquely identifying a user on a mobile device. The full rankings of the features up to 23 can be found in Appendix C.
Performing Cross-Validation on Touchalytics Dataset
The authentication problem which we are trying to solve can be described as a two class classifier (Bishop, 2006). That is, the classifier should determine whether the user is authorized to use the device or is not authorized to use the devise using features representing the touch patterns of 40 different users interacting with five different documents on a mobile device. We start by selecting all of the strokes belonging to a particular user and recording a count of such. These strokes are given a label of “Class One.” We then randomly select the same number of strokes belonging to the other users. These are given the label “Class Two” Hence, we have the same number of strokes belonging to Class One and Class Two. The data was then cleaned by removing the rows with missing and infinite values. In addition, the class column was designated the target variable “Y” and was removed. Furthermore, the doc id, user id, phone id, and class were removed from the data set as these were deemed to not have any impact on the results by Frank et al. (2013). The remaining columns were designated as the variable X.
Accordingly, we then split the dataset into training (80%) and testing (20%) sets. Consequently, the data were rescaled using the MiniMax Method. A KNN model was created utilizing a library from Scikit learn (Pedregosa et al., 2011). We chose 3, 5, 7, and 9 neighbors respectively as the “K” parameter and trained our model. Thereafter, we made predictions on the test data.
Discussion
This study has shown that the main feature for characterizing touch dynamics for touchscreen mobile devices (Frank et al., 2013) is the average velocity of a finger stroke. The novelty in our research is in our comparison of the effectiveness of the different features toward the creation of a digital fingerprint of a mobile phone user. Using the database established by Frank et al. (2013), we have expanded on this to suggest that by using co-adaptation of user and finger swiping, we can incorporate continuous authentication to enhance security. Similar behavioral biometric features were used to characterized telegraph communication (Jenkins et al., 2011), keyboard typing (Gaines et al., 1980), and keypad typing (Teh et al., 2016) using ad hoc approaches. That is, the speed at which the user's fingers move on the touch screen is what is most unique to each user. This is most consistent with the “Behavioral Biometrics” theme of this paper, which is based on the idea that each human being has a unique behavioral identifiable characteristic when typing (Horst et al., 2019). As a result, this feature would be integral in the building of any finger stroke touch dynamics classification model.
History supports this observation. While the devices have changed over time, the biological composition of a human being has remained the same. That is, in most devices which requires the user to utilize their fingers, the speed in which a human press and releases a surface remained unique to that user. This is a result of the unique muscle composition, nerve organization and electrical impulses connections among the brain, nerves, and muscle connections that are learned over time (Bhattacharyya et al., 2009). During the days of Morse Code and the telegraph, operators were able to identify their counterparts by the rate of the taps on the medium. Approximately, half a century later, Gaines et al. (1980) observed that the intervals between a typist's keystrokes could be modeled using a log normal distribution. More recently, Teh et al. (2016) reported that they could identify users based on the intervals of key presses on the physical keypad of a mobile device. Furthermore, and most relevant to our paper, a plethora of research conducted on touch patterns on mobile devices have come to a similar conclusion.
With the advent of touch screen devices, the user now has to move his finger over a larger surface area. Consequently, the start and end positions of the user's finger strokes have become a set of new features which can possibly be used to identify an individual. However, it must be noted that the end positions of a finger stroke were not paramount in the top principal components. Therefore, we can assert that the end position of a finger stroke should not be used as the sole basis for identifying a user. However, when these features are combined with the aforementioned velocity measures, the results could be more beneficial and less prone to intrusion.
We then sorted the principal components according to their largest eigenvalue (variance) (Figure 7). We further sorted the 30 features (Frank et al., 2013) from the strongest feature to the weakest in the first principal component. This showed a steady decline in EER as we added features for each k in the KNN algorithm all the way up to 30 features (Figure 8). KNN was utilized as the clustering algorithm, since that was the one used by Frank et al. (2013), so that there would be an adequate basis for comparison.
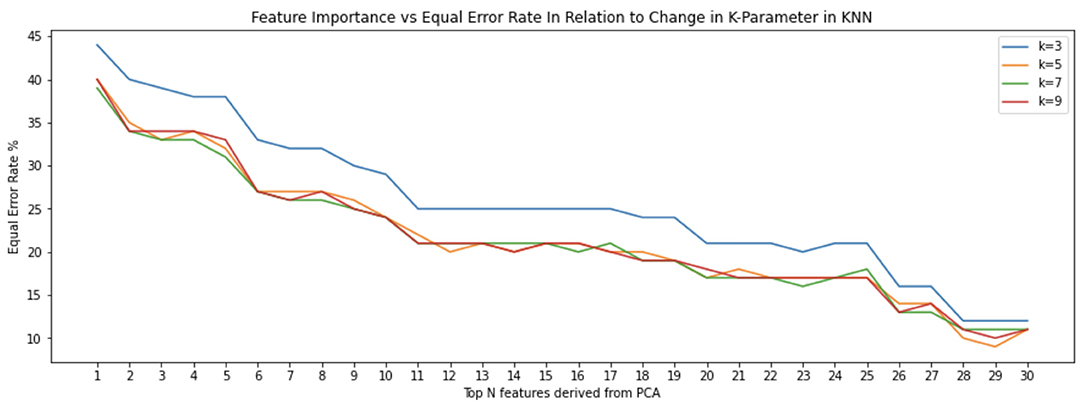
Figure 8. Classification done using all 30 features defined by Frank et al. (2013), derived from the first principal component result in stabilization of equal error rate. These features are numbered according their order of importance: “average velocity,” “50%-perc. pairwise velocity,” “median velocity at last 3 pts,” “80%-perc. pairwise velocity,” “20%-perc. pairwise velocity,” “direction of end-to-end line,” “average direction,” “80%-perc. pairwise acc,” “stroke duration,” “direct end-to-end distance,” “stop $y$,” “20%-perc. pairwise acc,” “ratio end-to-end dist and length of trajectory,” “median acceleration at first 5 points,” “50%-perc. pairwise acc,” “length of trajectory,” “largest deviation from end-to-end line,” “phone orientation,” “80%-perc. dev. from end-to-end line,” “stop $x$,” “50%-perc. dev. from end-to-end line,” “20%-perc. dev. from end-to-end line,” “start $y$,” “mid-stroke finger orientation,” “up/down/left/right flag,” “mid-stroke area covered,” “mean resultant length,” “mid-stroke pressure,” “start $x$,” and “inter-stroke time.”
However, by using additional principal components, we discovered that there was a plateau such that strongest 12 features resulted in similar or better results as when all 30 are used with a decline in EER (Figure 9). There are repeats of seven of the 30 most important features. Therefore, 23 features are the most relevant in the top 30 principal components. This is significant because it means that an authentication system can remain effective using fewer features. That is, if the system has to consider fewer features when performing a classification, less sensors have to be used and thus energy is saved. In addition, if the classifier has to consider less data, then it becomes more efficient. What is surprising is the fact the K-value chosen for the KNN classifier doesn't seem to affect the Equal Error Rate. This is depicted in the interwoven KNN curves (Figures 8, 9). Furthermore, we can observe that the equal error rate continually drops after each one of the top 15 features is considered and then remains within a certain range or reaching a plateau (Figure 9).
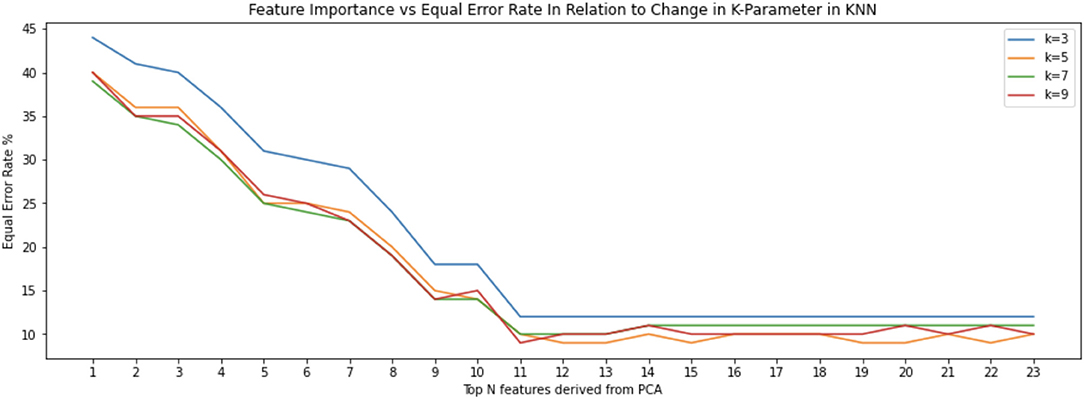
Figure 9. Classification done using the 23 features derived from the top 30 principal components result in a more pronounced stabilization of equal error rate. These features are numbered according to their order of importance are: “average velocity,” “largest deviation from end-to-end line,” “50%-perc. pairwise acc,” “length of trajectory,” “start $y$,” “mean resultant length,” “up/down/left/right flag,” “start $x$,” “mid-stroke area covered,” “inter-stroke time,” “mid-stroke pressure,” “mid-stroke finger orientation,” and “stroke.”
We also plotted a histogram of the number of users for a particular feature (Figure 10). The analysis indicates that “average velocity” of finger swiping is the dominant feature across subjects. The next dominant feature is the “largest deviation from end to end line.” Four of these histograms (Figures 10A–D) show that as we consider more features, the distribution becomes flattened, consistent with the equal error rate decline across all users. The equal error rate decline and stabilization indicate that using a 15 dimensional feature vector well characterizes each user.
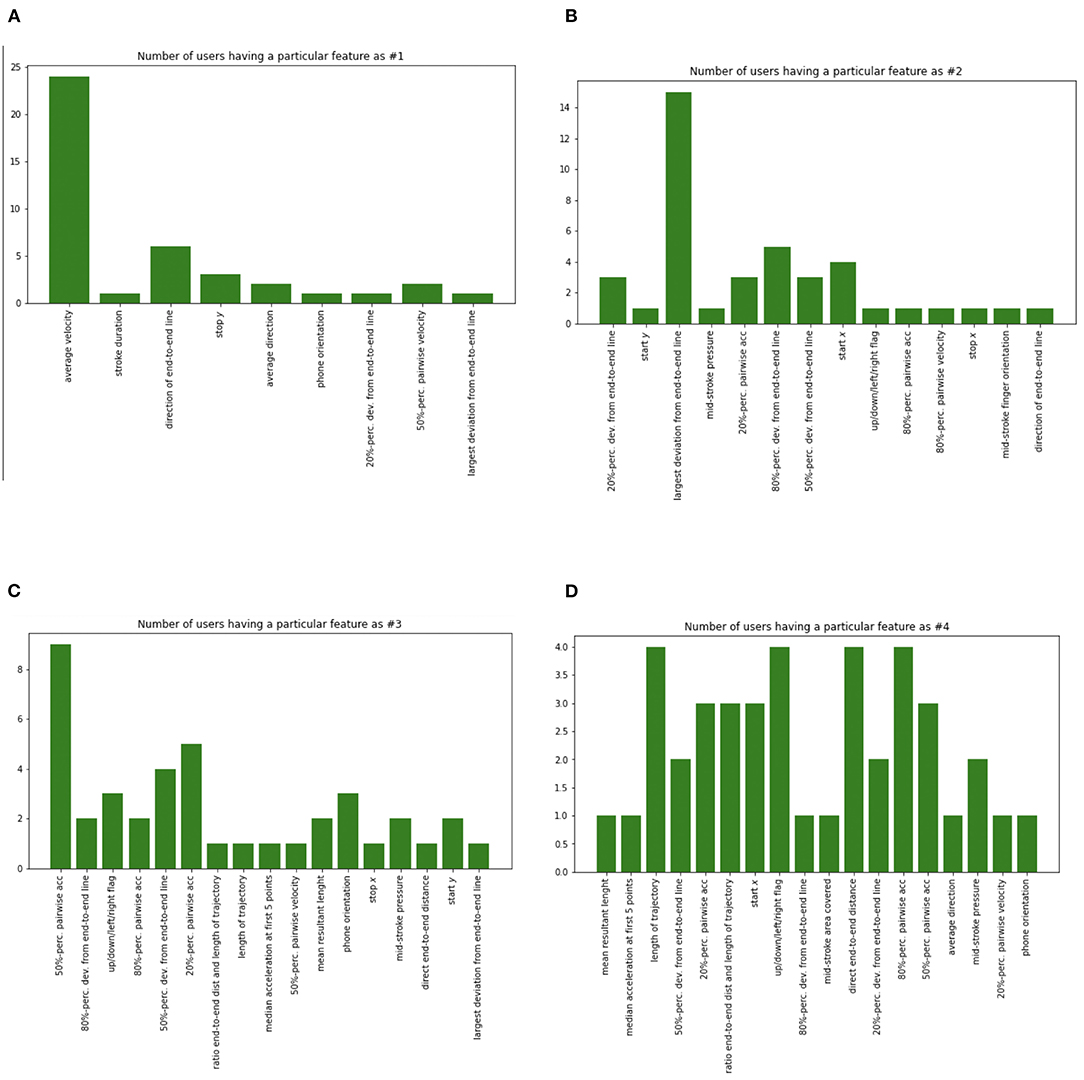
Figure 10. Four histograms of the number of users for a particular feature. “Average velocity” of finger swiping is the dominant feature across subjects. The next dominant feature is “largest deviation from end to end line”. In all histograms (A–D), the distribution becomes flattened consistent with equal error rate decline across all users. The feature designations were given in Frank et al. (2013), from whose database these features were extracted for this study.
It would be of interest to compare datasets from other touch screens such as kiosks etc., which have larger screens in order to learn if the start and stop positions are consistent with that of users on a personal mobile device. Similar to how the inter-stroke time and stroke duration were consistently used to discern users among all touch-based devices in the past, we expect that the stop and start positions would also be consistent among all touch screen devices. Thus, the application of the principles of embodiment and co-adaptation could be important in the development of secure and efficient ways of human interaction with mobile communication devices.
Data Availability Statement
The data was obtained from the dataset created by Frank et al. (2013).
Author Contributions
AJ contributed to the conceptual understanding of the bio-metric features, writing the computer programs to implement the algorithms used in the study, and writing of the manuscript. TH contributed to some of the concepts utilizing touchalytics, reviewed some of the code for the implementation of the touchalytics algorithm, and contributed to the writing of the manuscript. TR contributed to the organization, writing of the manuscript, and utilization of machine learning approach to finding the dominant bio-metric features of the classification algorithm. All authors contributed to the article and approved the submitted version.
Funding
TR has been funded by City University of New York through a Distinguished Professorship, which allows for re-assigned time to allow him to do this research. AJ has received support from a grant to Brooklyn College from New York State to support the Star Early College program (TR) and Research funds that support the research of TR. TR was also funded by an award made by Pheobe Cohen to Dr. Raphan's General Research Activities- 7B613-00-01.
Conflict of Interest
The authors declare that the research was conducted in the absence of any commercial or financial relationships that could be construed as a potential conflict of interest.
Publisher's Note
All claims expressed in this article are solely those of the authors and do not necessarily represent those of their affiliated organizations, or those of the publisher, the editors and the reviewers. Any product that may be evaluated in this article, or claim that may be made by its manufacturer, is not guaranteed or endorsed by the publisher.
Supplementary Material
The Supplementary Material for this article can be found online at: https://www.frontiersin.org/articles/10.3389/fcomp.2022.754716/full#supplementary-material
References
Ali, M. L., Monaco, J. V., Tappert, C. C., and Qiu, M. (2017). Keystroke biometric systems for user authentication. J. Signal Process. Syst. 86, 175–190. doi: 10.1007/s11265-016-1114-9
Ariu, D., Frumento, E., and Fumera, G. (2017). “Social engineering 2.0: a foundational work: invited paper,” in Proceedings of the Computing Frontiers Conference. (Siena: Association for Computing Machinery). doi: 10.1145/3075564.3076260
Azevedo, G., Cavalcanti, G., and Filho, E. (2007a). “An approach to feature selection for keystroke dynamics systems based on PSO and feature weighting,” in In IEEE Congress on Evolutionary Computation (CEC 2007). Piscataway, NJ: IEEE. doi: 10.1109/CEC.2007.4424936
Azevedo, G., Cavalcanti, G., and Filho, E. (2007b). “Hybrid solutions for the feature selection in personal identification problems through keystroke dynamics,” in International Joint Conference on Neural Networks (IJCNN 2007). Orlando, FL: IEEE. doi: 10.1109/IJCNN.2007.4371256
Beckerle, P., Castellini, C., and Lenggenhager, B. (2019). Robotic interfaces for cognitive psychology and embodiment research: a research roadmap. WIREs Cogn Sci. 10, e1486. doi: 10.1002/wcs.1486
Bhattacharyya, D., Ranjan, R., Alisherov, F., and Minkyu, C. (2009). Biometric authentication: a review. Int. J. u- e- Service Sci. Technol. 2, 82–86.
Bishop, C. M. (2006). Pattern Recognition and Machine Learning (Information Science and Statistics). Berlin: Springer-Verlag.
Brown, M., and Rogers, S. J. (1994). “A practical approach to user authentication,” in In 10th Annual Computer Security Applications Conference. Orlando, FL: IEEE Computer Society.
Cho, C., Kunin, M., Osaki, Y., Olanow, C. W., Cohen, B., and Raphan, T. (2006). “A model-based approach for assessing Parkinsonian gait and effects of Levadopa and Deep Brain Stimulation,” in Proc. 28th IEEE EMBS Annual International Conference. New York City, NY. doi: 10.1109/IEMBS.2006.259439
Cho, C., Kunin, M., Osaki, Y., Olanow, C. W., Cohen, B., and Raphan, T. (2010). Frequency-velocity mismatch: a fundamental abnormality in Parrkinsonian gait. J. Neurophysiol. 103, 1478–1489. doi: 10.1152/jn.00664.2009
Dooley, J. (2013). A Brief History of Cryptology and Cryptographic Algorithms. Springer doi: 10.1007/978-3-319-01628-3
Ellavarason, E., Guest, R., Deravi, F., Sanchez-Riello, R., and Corsetti, B. (2020). Touch-dynamics based behavioural biometrics on mobile devices – a review from a usability and performance perspective. ACM Comput. Survey (Rome), 53:120. doi: 10.1145/3394713
Forsen, G., Nelson, M., and Staron, R. J. (1977). Personal Attributes Authentication Techniques. (Rome, NY: Pattern Analysis & Recognition Corp).
Frank, M., Biedert, R., Ma, E., Martinovic, I., and Song, D. (2013). Touchalytics: on the applicability of touchscreen input as a behavioral biometric for continuous authentication. IEEE Trans. Inform. Forens. Security 8, 136–148. doi: 10.1109/TIFS.2012.2225048
Gaines, R., Lisowski, W., Press, S., and Shapiro, N. (1980). Authentication by Keystroke Timing: Some Preliminary Results. Santa Monica, CA: RAND Corporation.
Guest, R., Miguel-Hurtado, O., Stevenage, S. V., Neil, G. J., and Black, S. (2014). “Biometrics within the SuperIdentity project: a new approach to spanning multiple identity domains,” in 2014 International Carnahan Conference on Security Technology (ICCST) (Rome), 1–6. doi: 10.1109/CCST.2014.6986992
Hern, A. (2017). Samsung Galaxy S8 Iris Scanner Fooled by German Hackers. Available online at: https://www.theguardian.com/technology/2017/may/23/samsung-galaxy-s8-iris-scanner-german-hackers-biometric-security (accessed January 5, 2021).
Horst, F., Lapuschkin, S., Samek, W., Müller, K., and Schöllhorn, W. (2019). Explaining the unique nature of individual gait patterns with deep learning. Sci. Rep. 9, 8. doi: 10.1038/s41598-019-38748-8
Ion, F. (2013). From Touch Displays to the Surface: A Brief History of Touchscreen Technology. arsTechnica. Available online at: https://arstechnica.com/gadgets/2013/04/from-touch-displays-to-the-surface-a-brief-history-of-touchscreen-technology/ (accessed July 20, 2021).
Jenkins, J., Nguyen, Q., Reynolds, J., Horner, W., and Szu, H. (2011). “The physiology of keystroke dynamics,” in Proceedings of SPIE - The International Society for Optical Engineering, 8058. doi: 10.1117/12.887419
Kar-Ann, T. (2008). “Between AUC based and error rate based learning,” in 2008 3rd IEEE Conference on Industrial Electronics and Applications, 2116–2120. doi: 10.1109/ICIEA.2008.4582893
Killourhy, K. S. (2012). A Scientific Understanding of Keystroke Dynamics. Pittsburgh, PA: Carnegie Mellon University.
Lau, L. (2018). Cybercrime “Pandemic” May Have Cost the World $600 Billion Last Year. CNBC. Available online at: https://www.cnbc.com/2018/02/22/cybercrime-pandemic-may-have-cost-the-world-600-billion-last-year.html (accessed September 30, 2020).
Ma, Y., Huang, Z., Wang, X., and Huang, K. (2020). An overview of multimodal biometrics using the face and ear. Hindawi Math. Probl. Eng. 2010, 1–17. doi: 10.1155/2020/6802905
Mcloughlin, I. V., and Naransamy, M. S. (2009). “Keypress biometrics for user validation in mobile consumer devices,” in 2009 IEEE 13th International Symposium on Consumer Electronics (Kyoto), 280–284. doi: 10.1109/ISCE.2009.5156933
Miguel-Hurtado, O., Stevenage, S. V., Bevan, C., and Guest, R. (2016). Predicting sex as a soft-biometrics from device interaction swipe gestures. Pattern Recogn. Lett. 79, 44–51. doi: 10.1016/j.patrec.2016.04.024
Norton (2011). Norton Survey Reveals One in Three Experience Cell Phone Loss, Theft. Norton. Available online at: http://www.symantec.com/about/news/release/article.jsp?prid=20110208_01 (accessed January 5, 2021).
Oja, E. (1989). Neural networks, principal components, and subspaces. Int J Neural Syst. 1, 61–68. doi: 10.1142/S0129065789000475
Olanrewaju, L., Oyebiyi, O., Misra, S., Maskeliunas, R., and Damasevicius, R. (2020). Secure ear biometrics using circular kernel principal component analysis, Chebyshev transform hashing and Bose–Chaudhuri–Hocquenghem error-correcting codes. Signal Image Video Proces. 14, 847–855. doi: 10.1007/s11760-019-01609-y
Osaki, Y., Kunin, M., Cohen, B., and Raphan, T. (2007). Three-dimensional kinematics and dynamics of the foot during walking: a model of central control mechanisms. Exp. Brain Res. 176, 476–496. doi: 10.1007/s00221-006-0633-1
Osaki, Y., Kunin, M., Cohen, B., and Raphan, T. (2008). Relative contribution of walking velocity and stepping frequency to the neural control of locomotion. Exp. Brain Res. 185, 121–135. doi: 10.1007/s00221-007-1139-1
Pedregosa, F., Varoquaux, G., Gramfort, A., Michel, V., Thirion, B., Grisel, O., et al. (2011). Scikit-Learn: Machine Learning in Python (Brookline, MA: Microtome Publishing), 2825–2830.
Powers, D. M. W. (2020). Evaluation: from precision, recall and F-measure to ROC, informedness, markedness and correlation. Int. J. Machine Learn. Technol. 2, 37–63. doi: 10.48550/arXiv.2010.16061
Raphan, T. (2020). Vestibular, locomotor, and vestibulo-autonomic research: 50 years of collaboration with Bernard Cohen. J. Neurophysiol. 123, 329–345. doi: 10.1152/jn.00485.2019
Saevanee, H., and Bhatarakosol, P. (2008). “User authentication using combination of behavioral biometrics over the touchpad acting like touch screen of mobile device,” in ICCEE 2008. International Conference on Computer and Electrical Engineering (Phuket: ICCEE), doi: 10.1109/ICCEE.2008.157
Sanchez, J., Mahmoudi, B., Digiovanna, J., and Principe, J. (2009). Exploiting co-adaptation for the design of symbiotic neural prosthetic assistance. Neural Netw. 22, 305–315. doi: 10.1016/j.neunet.2009.03.015
Sky-News (2017). Flight Diverted After Woman Unlocks Husband's Phone and Discovers Affair. Sky News. Available online at: https://news.sky.com/story/flight-diverted-after-woman-unlocks-husbands-phone-and-discovers-affair-11117184 (accessed October 25, 2020).
Spillane, R. (1975). Keyboard apparatus for personal identification. IBM Techn. Discl. Bull. 1975, 17.
Teh, P. S., Zhang, N., Teoh, A. B. J., and Chen, K. (2016). A survey on touch dynamics authentication in mobile devices. Comput. Security 59, 210–235. doi: 10.1016/j.cose.2016.03.003
Telegraph, T. (2016). The First Electric Telegraph in 1837 Revolutionised Communications. The Telegraph. Available online at: https://www.telegraph.co.uk/technology/connecting-britain/first-electric-telegraph/ (accessed January 17, 2021].
Trewin, S., Swart, C., Koved, L., Martino, J., Singh, K., and Ben-David, S. (2012). “Biometric authentication on a mobile device: a study of user effort, error and task disruption,” in Proceedings of the 28th Annual Computer Security Applications Conference. Orlando, FL: Association for Computing Machinery. doi: 10.1145/2420950.2420976
Wang, X., Yu, T., Mengshoel, O., and Tague, P. (2017). “Towards continuous and passive authentication across mobile devices: an empirical study,” in Proceedings of the 10th ACM Conference on Security and Privacy in Wireless and Mobile Networks. Boston, MA: Association for Computing Machinery. doi: 10.1145/3098243.3098244
Yiu, T. (2019). The Curse of Dimensionality. Towards Data Science. Available online at: https://towardsdatascience.com/the-curse-of-dimensionality-50dc6e49aa1e?gi=c269056e0e89 (accessed January 5, 2021).
Keywords: Behavioral Biometrics, computer security, keystroke dynamics, machine learning, touchalytics, embodiment, co-adaptation
Citation: Jairam A, Halevi T and Raphan T (2022) Improving Mobile Device Security by Embodying and Co-adapting a Behavioral Biometric Interface. Front. Comput. Sci. 4:754716. doi: 10.3389/fcomp.2022.754716
Received: 15 August 2021; Accepted: 07 March 2022;
Published: 11 April 2022.
Edited by:
Andrej Košir, University of Ljubljana, SloveniaReviewed by:
Robertas Damasevicius, Silesian University of Technology, PolandMohammad Jabed Morshed Chowdhury, La Trobe University, Australia
Copyright © 2022 Jairam, Halevi and Raphan. This is an open-access article distributed under the terms of the Creative Commons Attribution License (CC BY). The use, distribution or reproduction in other forums is permitted, provided the original author(s) and the copyright owner(s) are credited and that the original publication in this journal is cited, in accordance with accepted academic practice. No use, distribution or reproduction is permitted which does not comply with these terms.
*Correspondence: Theodore Raphan, raphan@nsi.brooklyn.cuny.edu