 Lukas Flinzberger
 Miguel A. Cebrián-Piqueras
 Cord Peppler-Lisbach
 Yves Zinngrebe
- 1Faculty of Agricultural Sciences, Department of Agricultural Economics and Rural Development, University of Göttingen, Göttingen, Germany
- 2Institute of Biology and Environmental Sciences (IBU) - Landscape Ecology Group, University of Oldenburg, Oldenburg, Germany
- 3Department for Conservation Biology and Social-Ecological Systems, Helmholtz-Centre for Environmental Research (UFZ), Leipzig, Germany
Implementing the European Green Deal and transforming agricultural practices requires a wider and amplified policy toolbox. As many sustainability considerations are context-dependent, there is a need for instruments, which take individual characteristics of production landscapes into account. Food products with a particularly strong relationship to their landscape of origin can be marketed under the “Protected Designation of Origin” label (PDO). In this article, we analyze synergies between PDO production and regional sustainable development by assessing to what extent social-ecological landscape characteristics appear in landscapes with PDO-labeled food production systems. Building upon 12 social-ecological variables we defined three landscape characteristics influential for the presence of PDOs by using a principal component analysis. By running regression models combining those characteristic landscapes with the spatial distribution of PDO certification we were able to explore linkages between landscapes and products. Additionally, a geographically weighted regression delivered insights into the regional differences and product-specific relationships throughout the EU countries. Overall, we could prove the assumed positive correlation between PDO production and ecologically valuable landscapes. Further, we showed that mostly meat PDOs coincide with landscapes influenced by structural change, while cheese PDOs are not well captured by our models despite their large number. We can conclude that PDOs have the potential to jointly support conservation and rural development, especially when they would be tied to sustainable management standards in the future.
Introduction
Agricultural food products are linked to the social and ecological conditions of the production systems they originate from (Andersson et al., 2015; Oteros-Rozas et al., 2019). Some prominent food products even constitute central characteristic elements of particular iconic landscapes, bearing a deep relation with the local traditions of landscape stewardship (Mann and Plieninger, 2017). While both the European Green Deal and its Farm to Fork strategy aim for a sustainable transformation of European agricultural landscapes, the green architecture of EU policies is still limited and ineffective (Pe'er et al., 2020). Aside from the Common Agricultural Policy (CAP), private labels and value chain-based incentives represent an unused potential for supporting sustainable production. The EU has developed a “Geographical Indications” scheme (GI), providing the option to register products under the “Protected Designation of Origin” (PDO) label or the “Protected Geographic Indication” (PGI) label (European Council, 1992, 2012) and thus legally protect their names. The PDO label certifies the highest standard for products to be linked with the geography, landscape, traditions, and food culture of their production system, making them a landscape label (Ghazoul et al., 2011). PDOs are widespread over European agricultural landscapes, with a particularly high representation in Mediterranean countries (European Commission, 2020b). Without being designed for this purpose, PDOs were found suitable for supporting sustainable forms of production, such as agroforestry systems (Flinzberger et al., 2020). Uneven distribution patterns of PDOs across Europe however indicate that potential synergies between PDO systems and sustainability efforts vary across product types, geographical location, or social-ecological context.
Definitions of PDOs include strict spatial requirements for producing and processing the product, as well as descriptions of how products and traditional agricultural landscapes are connected (Kizos and Vakoufaris, 2009). The associated EU regulation states the following requirements for any PDO: “[…] “designation of origin” is a name which identifies a product: (a) originating in a specific place, region or, in exceptional cases, a country; (b) whose quality or characteristics are essentially or exclusively due to a particular geographical environment with its inherent natural and human factors; and (c) the production steps of which all take place in the defined geographical area” (European Council, 2012). Thus, besides its function as protection of intellectual and cultural property (May, 2016), the PDO label is also meant to transmit landscape values to consumers (Vakoufaris et al., 2014). Meanwhile, the requirements for PGIs are less strict. Product characteristics are less tightly bound to the geographic environment, animal feed can be sourced in distant regions or countries, with only certain production or processing steps being linked to the designated area. Hence, we focus this study solely on PDO products due to their stronger linkage with landscape characteristics. In terms of causal relationships, it is difficult to determine whether agricultural management practices such as PDOs have shaped the landscapes or vice versa. Instead, a co-evolutionary process (Quiñones-Ruiz et al., 2018) between landscapes and products appears to be sensible.
The potential of PDOs to contribute to sustainable development will depend on their ability to induce and support suitable management practices. While some characteristics of successful PDO production have been described as inherently sustainable (Lamarque and Lambin, 2015; Egea and Pérez y Pérez, 2016), they were not designed to be sustainability labels in the first place. Existing studies on PDOs have mainly focused on analyzing the cultural and economic history of “Geographical Indications” (Clark and Kerr, 2017; Fournier and Michel, 2017; Török and Moir, 2018). Despite these efforts, we still lack a better understanding of how individual product types interact with landscapes of origin and to what extent they can assure sustainability safeguards. The potential of the PDO scheme for contributing to the implementation of EU's sustainable development targets, such as those indicated in the European Green Deal or its Farm to Fork strategy (European Commission, 2020a), will depend on its ability to actively shape the underlying landscape-production system (Tashiro et al., 2019). To assess the PDO's potential for supporting sustainability, we need to better understand the synergies between social-ecological trajectories in PDO-certified landscapes and different dimensions of sustainability.
To this end, this article analyses how different PDO types are linked to certain social-ecological landscape indicators. For this purpose, we have used a spatially explicit dataset of all 638 food PDOs registered across the EU and linked them to their location on the NUTS-3 level. In addition, we have selected 12 social-ecological indicators available on the same scale, representing environmental and social-economic states and trends. We have then performed a principal component analysis and identified three distinguishable social-ecological landscape types (landscapes of high ecologic value, landscapes characterized by structural change, and landscapes of high cultural-touristic value). Based on these landscape types, considering the PDOs' geographical distribution and splitting them up into four different product categories (meat, cheese, oils, fresh crops), we calculated multi-linear hurdle regression models. These models allowed us to assess to what extent specific PDOs correlate with the predefined landscape types, distinguishing between the Mediterranean and non-Mediterranean countries. Finally, we analyzed under-performing and over-performing regions in terms of PDO production with regard to the expected distribution from a geographically weighted regression model.
Our research design was based on the following three assumptions about the leverage points that PDO production offers for sustainable landscape management:
1. Landscapes providing high ecological values have stronger potentials for producing PDO-labeled quality food products.
2. PDO products are associated with rural, less populated regions and can act as entry points for rural development strategies.
3. Given the first two hypotheses, we assume that PDOs are suitable tools to combine the ecological and social aspects of sustainable landscape management.
To examine these assumptions, we apply a holistic understanding of social-ecological sustainability. In the methods section, we explain how we have derived three landscapes of distinct characteristics by using a principal component analysis (PCA), and how we build a regression model from those landscape types together with the spatial PDO data. In the results, we present the outcome of our regression models and the quality of those models, including an additional geographically weighted model. Finally, we discuss the implications of those results for using PDO products successfully within the EU's agriculture policy and conclude with a recommendation for initiating a sustainability-oriented PDO+ label.
Materials and Methods
A Dataset of European PDO Products
In preparation for this research, we mapped the geographical extent of all European food products labeled under the “Protected Designation of Origin” (PDO). The original data was retrieved from the eAmbrosia database of the European Commission, where the geographical extent of each product had to be extracted from the legal documents (PDF text files). We included all 638 food PDOs registered by 31st July 2020 but did not include wine products. As explained above, we consciously decided to not include any PGI products, because their production is not linked closely enough to a certain landscape. Due to practical reasons and data availability, the extent of all PDOs was mapped at the local NUTS-3 scale (EU's territorial units for statistics). Many statistical datasets at EUROSTAT are available at this scale or the regional NUTS-2 scale, but rarely at finer scales. Hence, for merging a dataset of PDO-data and social-ecological indicators (see below), suitable for a multi-linear regression, the NUTS-3 scale was the optimal choice.
The final dataset revealed the geographical extent of any PDO product using the boundaries of the European NUTS-3 regions. Counting the number of PDO products linked to any given NUTS-3 region we calculated the so-called “PDO-score” for all EU NUTS-3 regions (Figure 1). This means that PDOs with geographical areas larger than a single NUTS-3 region were added to the score in each corresponding NUTS-3 region (original PDO data in Supplementary Material). As presented in Table 1 and visualized in Figure 1, the PDOs are not evenly distributed over Europe, but eight Mediterranean EU countries (PT, ES, FR, IT, SI, HR, GR, CY) are home to 542 of 638 PDO-labeled products. Also in terms of product types, the number of registered PDOs varies significantly. Five major product categories account for the majority (85%) of all registered PDOs: “fresh meat,” “processed meat,” “cheese, oils and fats,” and “fruits, vegetables, and cereals.” Both meat categories were merged into one sample and are further referred to as “meat PDOs,” while the category of “fruits, vegetables and cereals” is called “fresh crops” from here on.
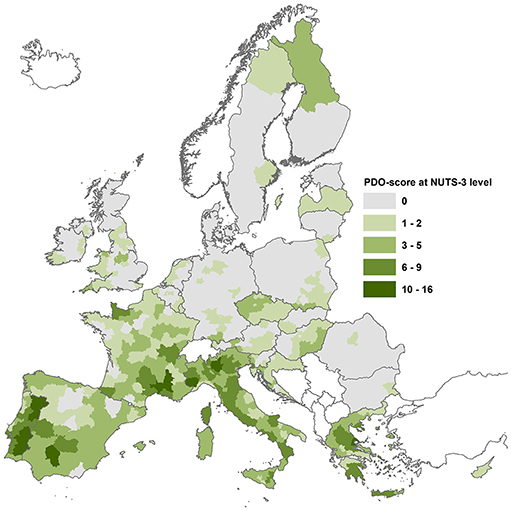
Figure 1. Range of the PDO-score across all NUTS-3 regions in Europe. The PDO-score represents the number of PDO products that are allowed to be produced in any given NUTS-3 region. The score ranges from zero to 16 with easily recognizable hotspots in some Mediterranean countries.
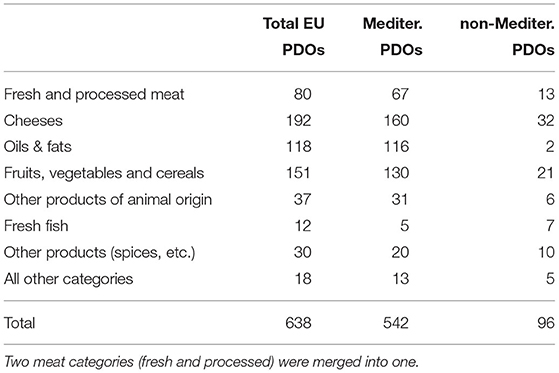
Table 1. Categories of PDOs according to the European eAmbrosia database with separate numbers for the Mediterranean and non-Mediterranean countries, data extracted by 31st July 2020.
Variables Explaining Hotspots of PDO Production in Europe
To approach our hypotheses about the landscape relations of PDOs we selected 12 variables covering a broad range of social-ecological characteristics. The variables covered indicators for ecological values, the state of conservation, cultural and touristic values, demographic situation and development, socio-economic aspects, and average farm sizes. The data was retrieved mainly from the official databases of EUROSTAT or EEA (Table 2).
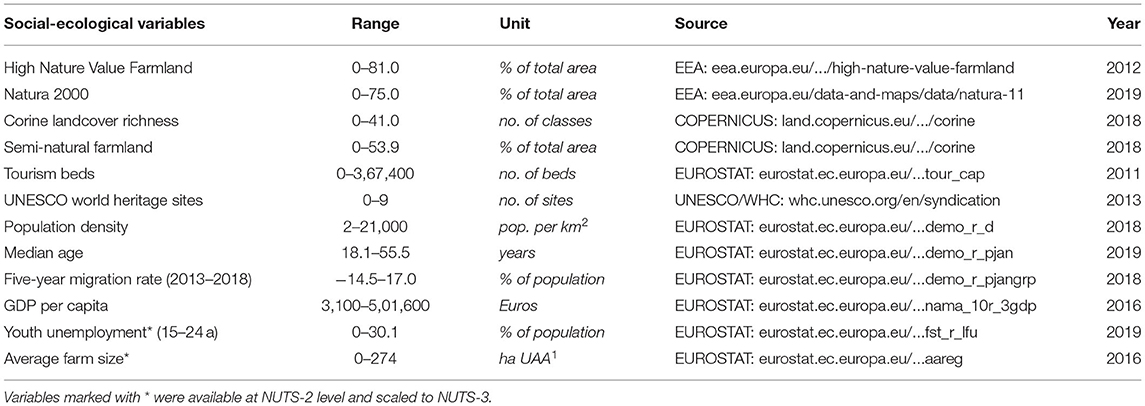
Table 2. List of all original social-ecological variables used for the PCA analysis.
The proportion of “High Nature Value Farmland” (HNVF) and the share of NATURE 2000 areas were used as indicators for a high environmental value as they reflect efforts of nature conservation. The number of different Corine landcover classes (“Corine landcover richness”) and the share of semi-natural farmland (three selected Corine classes: “agroforestry,” “agricultural land with nature areas,” and “complex agricultural patterns”) were used as indicators for a diverse and multifunctional agricultural landscape. The numbers of “tourism beds” and the “UNESCO world heritage sites” were selected to reflect the cultural-touristic value of a given region. “Population density,” “median age,” and a “5-year migration rate” (2013–2018) were chosen as indicators for the demographic trend. The two indicators “regional GDP per capita” and “youth unemployment” (between age 15 and 24) were selected to represent the economic situation. Finally, we included the “average farm size” as a regional indicator for the level of industrialization of the agricultural sector. The environmental and cultural variables are proven indicators within the context of sustainable landscape management and conservation. Considering the socio-demographic variables, they are even more frequently used in various kinds of socio-economic assessments.
Where possible, we used data provided at the NUTS-3 level to match the spatial scale of the mapped PDO products later on. Data available only at the NUTS-2 level (youth unemployment, and avg. farm size) was scaled down, assuming all subordinated NUTS-3 areas to have the same value as the higher-level NUTS-2 region. A larger set of social-ecological variables has been tested for their direct correlation with the presence of PDO products. From this pre-test, only variables that showed a relevant and significant correlation with PDO presence were chosen. For example, the “organic farming” indicator was not significantly correlated and thus not used in this regression analysis.
Extraction and Interpretation of Relevant Factors
We performed a principal component analysis (PCA) in Statistica to reduce the complexity of the initial set of variables. The explorative PCA for all EU states, including 12 social-ecological variables, revealed three components that represented more than half of the variance within the original variables. By considering components with an eigenvalue above one, the three components combined explained 53% of the total variance. This step—the extraction of relevant components—can be seen as a form of correlation analysis, when treating the component loadings of each variable as the correlation of the component with the original variable (Table 3). From the PCA we found which original variables were particularly “correlated” with which of the newly computed components—either negative or positive—and which variables jointly loaded onto the same component. Hence, based on those combinations of positive and negative component loadings we interpreted the three components as three distinguishable social-ecological landscapes of different characteristics.
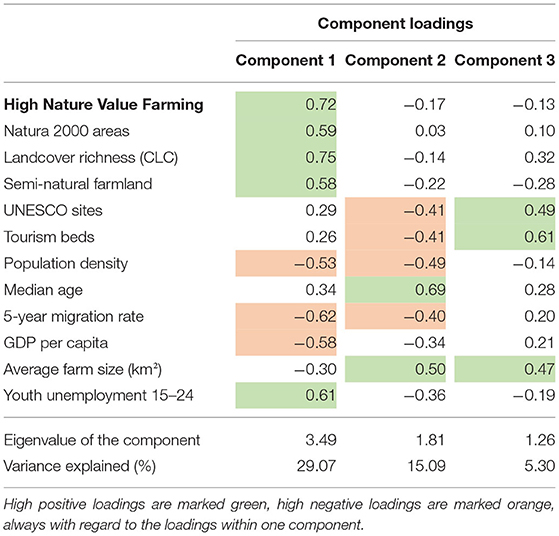
Table 3. Loadings for three components (C1–C3),that were derived from a principal component analysis of 12 social-ecological variables.
Regression Models for Count and Zero-Inflated Data
For testing the effect of the aforementioned components on the number of PDOs per NUTS-3 region, we employed regression models. Each region represented one observation (n = 1,348). As our dependent variables were count data and displayed an excess of zero values, we used regression models specifically designed for this type of data called “hurdle models” (similar to generalized linear models [GLM]). Hurdle models combine two model types. The “zero-model” predicts the probability of occurrence of any count > 0 with a logistic regression model (GLM with logit link function). The “count-model” is a zero truncated regression model for the number of counts based on all observations with counts > 0. The predicted number of counts is yielded by combining (multiplying) the predicted probability of occurrence from the zero-models (the “hurdle”) with the predicted counts of the count-models (Mullahy, 1986; Cameron and Trivedi, 2013). For the count-model, we used a GLM with a negative binomial error distribution to account for over-dispersed count data in our data set.
As predictor variables in our models, we used the component scores (C1, C2, C3) from the PCA (see geographically weighted regreession). The components represented different complex landscape characteristics derived from the correlation structure of the 12 initial socio-ecological variables. The component scores were standardized prior to the regression analyses to make regression coefficients better comparable with respect to effect sizes. As all components were derived from a PCA, they were uncorrelated, hence multicollinearity was no problem.
Additionally, we included a dichotomous covariable MEDITERRANEAN indicating whether a region was situated in a Mediterranean country (1, n = 347) or not (0, n = 1,001). To account for the possibility of modeling different responses of PDOs to the components in the Mediterranean vs. non-Mediterranean regions, we included the interactions between MEDITERRANEAN and the component variables C1–3. We started with a full model containing all components and their interactions with MEDITERRANEAN and subsequently reduced the models by stepwise omitting non-significant interactions or components. Non-significant components were retained if their interactions with MEDITERRANEAN were significant.
We fitted our models with the hurdle() function from the “pscl” package in R (R Core Development Team, 2020). We used maximum likelihood estimation and BFGS iterations for optimization (Zeileis et al., 2008; Jackman, 2020). In multiple linear regression, model fit is usually reported with R squared (R2), calculated from sums of squares. As this does not apply to GLM models with a non-normal error distribution, we calculated the squared correlation coefficient (r) of predicted vs. observed counts as an equivalent measure for the hurdle model fit. Moreover, we calculated the Nagelkerke- (or Cragg-Uhler-) pseudo-R squared-value (Nagelkerke, 1991) to assess the fit of the zero-model alone [function pR2(), package pscl].
We calculated five different regression models: one for the total number of PDOs, and one for each of the four PDO categories. The hurdle() function then estimated the coefficients for the zero model and the count-model separately, which are both relevant for interpretation. The regression coefficients of the zero-model indicate the effect size of the four variables (C1–C3 and covariable MEDITERRANEAN) for having at least one PDO in a given NUTS-3 region. The regression coefficients of the count-model provide information about their effect on the actual numbers of PDOs. The regression coefficient for the covariable MEDITERRANEAN indicates to what extent the presence (zero-model) and number (count-model) of PDOs are generally differing between Mediterranean and non-Mediterranean regions, irrespective of the components' effects. A significant component-MEDITERRANEAN interaction indicates that the individual effect of the respective component on PDOs is significantly different between the Mediterranean and non-Mediterranean countries.
Geographically Weighted Regression
The hurdle regression models helped to understand the influence of the three components on PDOs of different food categories. However, it did not consider the geographic distribution of PDOs in relation to each other. In theory, a regression model would be able to predict the outcome for unknown cases but that was not the intention nor the capacity of the hurdle models results. Because the hurdle model did not consider the values in a geographical sense (i.e., it does not include the information about a neighboring NUTS-3 region), and because we mapped the entirety of all 638 food PDOs, a predictive model was not what we aimed for by computing the hurdle models. In other words, there was no geographically explicit information about the relation between predicted and observed PDO frequency. To find out if certain types of PDOs were over-represented or under-represented in some regions of Europe, we applied a geographically weighted regression (GWR) in ArcGIS (under /spatial statistics toolbox/modeling spatial relationships). The GWR tool computed a local linear regression—so by using this tool we traded the hurdle model's ability to deal with zero-inflated data for the benefit of having the geographical information represented within the model. Again, the component scores were used as independent variables and the PDO score as the dependent variable. The GWR results yielded a local regression model for each NUTS-3 region. From the results, we then checked the local coefficients of determination (R2) which ranged between 0.1 in Northern Europe and 0.7 in the Mediterranean region. But more important we used the standardized residual values (StdResid) for making further interpretations. The standardized residual values were of particular interest because they told the difference between the observation (number of PDOs present) and the models' estimation (how many PDOs were expected to be present). We further used this value to visualize where PDOs of different food categories are over-represented or under-represented according to the GWR model.
Results
Interpretation of the Principal Components
We interpreted the three revealed components in terms of their social-ecological landscape features, based on the variables with strong positive or strong negative loadings (Table 3). The visualizations below (Figures 2–4) showcase NUTS-3 regions that particularly contributed to the positive (highest quintile) or negative (lowest quintile) expressions of the respective component and its underlying interpretation. In order of declining explanatory power, the three components are described as follows:
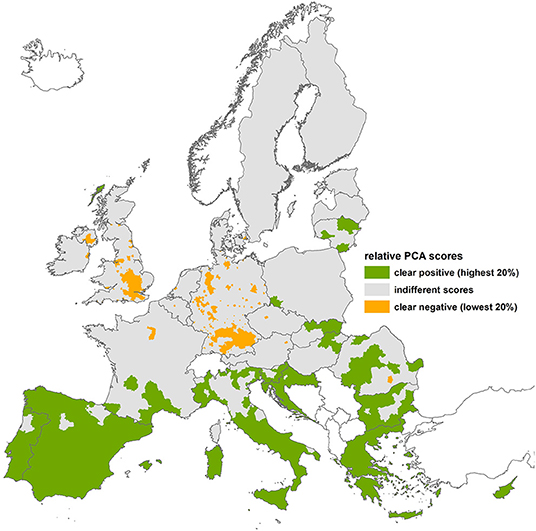
Figure 2. Relative scores of the first component, showing NUTS-3 regions that strongly contribute to the positively (green) loaded variables of high ecological values, or negatively (orange) loaded variables of socio-economic aspects, in contrast to the indifferent regions (gray). [negative = 1st quintile; positive = 5th quintile].
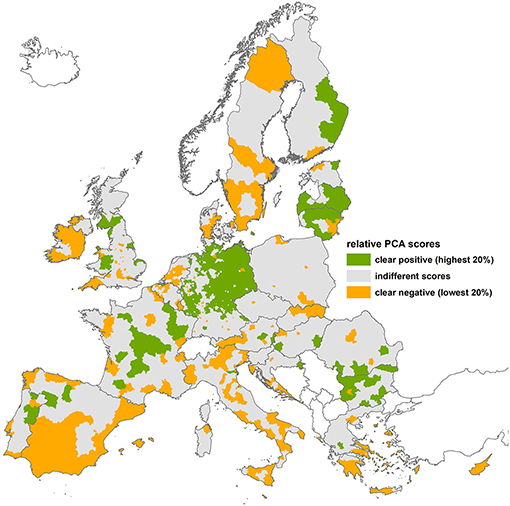
Figure 3. Relative scores of the second component, showing NUTS-3 regions that strongly contribute to the positively (green) loaded variables, or negatively (orange), loaded variables related to different aspects of structural change, in contrast to the indifferent regions (gray). [negative = 1st quintile; positive = 5th quintile].
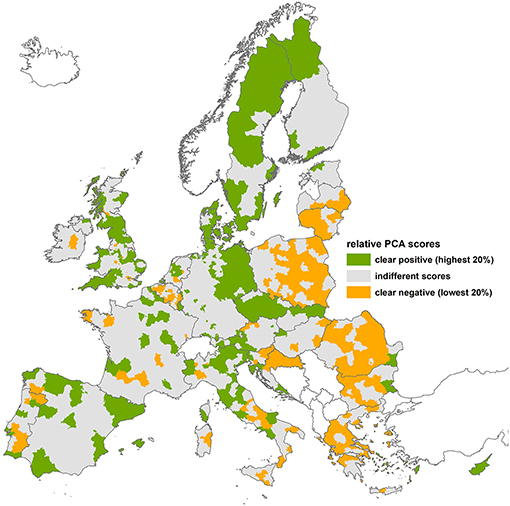
Figure 4. Relative scores of the third component, showing NUTS-3 regions that strongly contribute to the positively (green) loaded variables related to high cultural values, or negatively loaded variables (orange), in contrast to the indifferent regions (gray). [negative = 1st quintile; positive = 5th quintile].
Component 1—Landscapes of High Ecological Value
Component one explained most of the ecological relevant values, including the highest component loadings for HNV farming, Natura 2000, landcover richness, and seminatural farmland. At the same time, lower population densities, lower GDP per capita, youth unemployment, and negative migration rates had high loadings on this component too. Thus, we interpreted the first component as landscapes of high ecological values with above-average efforts in nature conservation but situated in socio-economic less favorable regions. Overall, the high ecological values component held the highest explanatory power by explaining more than 25% of the total variance of the dataset. The dark green areas in Figure 2 represented regions that contributed to the positively loaded variables of component one—correlated with high natural and ecological values. Those areas lie almost entirely within the Mediterranean countries. Small areas with strong negative component scores (orange regions) contributed to the negatively loaded variables of the unfavorable socio-economic aspects within component one and occurred mainly in Germany and South UK.
Component 2—Landscapes Influenced by Structural Change
Component two described the development of demographics and the level of structural change in a given region. High component loadings for median age and average farm sizes occurred along with medium to strong negative loadings for population density and migration rates. The high ecological and cultural values showed almost entirely negative loadings for this component. Therefore, we interpreted the second component as landscapes influenced by structural change (i.e., fewer but larger farms), going along with demographic decline and cultural deprivation. At the same time, the economic aspects were less concerning compared to component one. The structural change component explained 15% of the total variance of the dataset. The orange areas in Figure 3 contributed to the negatively loaded variables of component two, representing the demographic decline aspect of structural change. They were more frequent in the Mediterranean region, Sweden, Ireland, Benelux, and marginal regions of Eastern Europe. Green regions, contributing to the positively loaded variables within component two (associated with the age and farm size aspects of structural change) were mostly situated in the area of former Eastern Germany (GDR), central France, and the Baltic states.
Component 3—Landscapes of High Cultural-Touristic Values
Component three represented the cultural values of a given region as highlighted by strong positive loadings for UNESCO world heritage sites, tourism beds, and a diverse landcover. Youth unemployment loaded negatively on this component, although only strong for the Mediterranean sub-sample. Based on that, we interpreted the third component as landscapes of high cultural values which were situated in diverse landscapes with high touristic potentials and associated job opportunities. As the component with the least explanatory power, high cultural-touristic values still explained 12% of the total variance of the dataset. NUTS-3 regions with strong positive scores for component three (dark green areas) contributed to the positively loaded cultural and tourism variables (Figure 4). Logically, they could be found within the typical touristic regions of Europe (e.g., Mallorca, Madrid, Rome, Tuscany, Stockholm, Paris, Tyrol, Harz, South-eastern England, Greek Islands, or Cyprus). The negative aspects of component three appeared to be not relevant for a social-ecological interpretation—also the related component scores extended less far into the negative value range.
Hurdle Regressions Models Against PDO-Scores
We extracted the component scores of each case (1,348 NUTS-3 regions overall) and calculated five regression models against the PDO scores of each product category. Thereby, we treated the PDO score as the dependent variable and the component scores of the three landscape types as independent variables, and added the independent covariable “Mediterranean.” The hurdle approach differentiated between count-models (number of PDOs), and zero-models (presence of PDOs) for each of the five models. Table 4 displays all significant regression coefficients that resulted from the hurdle regression models (non-significant variables were removed in the final models and coefficients are therefore missing). Especially for component one, and partly for components two and three, the hurdle models revealed some interesting patterns. While the sample size of non-Mediterranean NUTS-3 regions was larger (1,001 regions), the amount of zeros was especially inflated there (771 regions without any registered PDO). On contrary, in the smaller sample size of Mediterranean NUTS-3 regions (347 regions), only 31 NUTS-3 regions without any registered PDOs occurred. Therefore, despite the smaller sample size, the effect of the covariable “Mediterranean” on PDOs' presence and numbers was significantly stronger than the effects of the variables based on three landscape types (Table 4). By isolating the effect of this covariable, it was possible to draw interesting insights from the regression coefficients (b*) of the other variables. Beyond that, applying the hurdle model as a reduced model with interactions, we found out for which combinations of components and product types there was a significant difference between the effects within, or without the Mediterranean region.
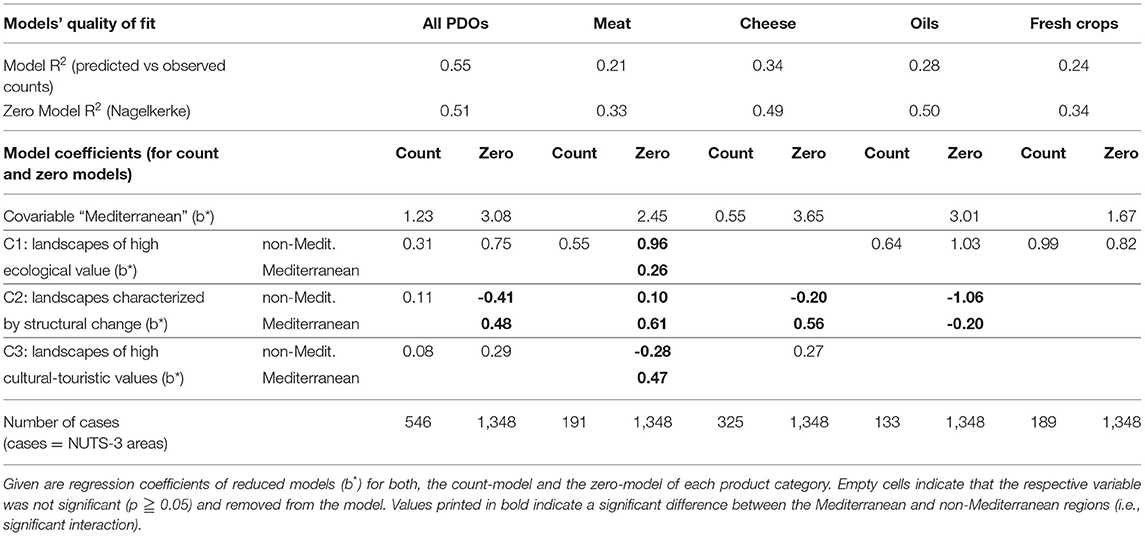
Table 4. Results from the hurdle model regression analyses, including a measure of model fit for the predictions of PDO product numbers for each hurdle model (R2 as the squared correlation between observed and predicted numbers), and a measure of model fit of the zero-model for the predicted probability of product occurrence (Nagelkerke R).
For all EU countries and product types combined, the count-model had a quality-of-fit of R2 = 0.55, which means our model (including the covariable “Mediterranean”) explains more than half of the variance in PDO numbers. Also, the corresponding zero-model explained more than half of the variance of PDOs' presence (Nagelkerke R2 = 0.51). For the four different PDO categories, the quality-of-fit ranged between R2 = 0.34 (“fresh crop” PDOs) and R2 = 0.21 (meat PDOs) (Table 4—upper part). For the PDO sub-categories, the zero-models had an even higher quality-of-fit (Nagelkerke R2). That means those four models explained the presence or absence of PDOs better than their actual numbers. The covariable “Mediterranean” appeared to be the strongest overall predictor for the presence of PDOs. The zero-regression coefficients were high for all PDOs combined (b* = 3.08), so being in the Mediterranean made it much more likely to have a PDO product in a NUTS-3 area. The values were similarly high for meat PDOs (b* = 2.45) and “oil and fat” PDOs (b* = 3.01), the highest for cheese PDOs (b* = 3.65), and the lowest for “fresh crop” PDOs (b* = 1.67).
Besides the covariable “Mediterranean,” component one was the variable explaining most of the variance in PDO numbers. With a count-regression coefficient b* = 0.31 for all PDOs combined and even higher count-coefficients for meat (b* = 0.55), “oils and fats” (b* = 0.64), and “fresh crops” (b* = 0.99), landscapes of high ecological values accounted for a significant increase in PDO numbers. The overall count-regression coefficients for component two (b* = 0.11), and component three (b* = 0.08) were smaller but still significant. For component two, the zero-models revealed significant differences between the variable's effect in the Mediterranean and non-Mediterranean countries. For all PDOs combined, PDO products in the non-Mediterranean countries decreased with an increasing C2 component (b* = −0.41, i.e., for landscapes characterized by structural change), while in Mediterranean countries, the number of PDOs even increased (b* = 0.48). A similar pattern with respect to the C2 component showed up for meat, cheese, and “oil fats” PDOs (Table 4).
Looking at the four separate models for the product categories, we found that especially for meat PDOs the zero-model coefficients were significantly different between the Mediterranean and non-Mediterranean regions. While for component one the effect was larger for the non-Mediterranean cases (b* = 0.96) than for the Mediterranean ones (b* = 0.26), it was the opposite for components two and three (Table 4). Further, we found that despite the large total number of PDO products, the number of cheese PDOs could not be explained by the component scores. Only the covariable “Mediterranean” had a significant positive effect on the counts. Further, only a small positive effect of high cultural-touristic values (C3) on PDOs' presence could be found (b* = 0.27), and as reported above, a diverging effect of variable C2 between non-Medit (b* = −0.20) and Medit. areas (b* = 0.56). The count-models for “oil and fat” PDOs as well as “fresh crops” were only significant for variable C1 but reported the highest regression coefficients of all count-models. It is further noteworthy that “oil and fat” PDOs' presence (zero-model) was negatively related to landscapes characterized by structural change (C2), although with a significant difference between non-Mediterranean (b* = −1.06) and Mediterranean (b* = −0.20) regions.
Geographically Weighted Regression
In addition to the purely mathematical regression model presented above, we calculated a geographically weighted regression model based on the spatial dataset of the PDOs and the component scores for each NUTS-3 region. The local coefficient of determination R2 (quality-of-fit) revealed a clear gradient running from southwestern Europe with the highest quality-of-fit (R2 = 0.7) to north-eastern Europe with R2 as low as 0.1. It revealed above-average R2-values mainly for the Mediterranean countries plus Ireland and the southwest UK. As expected, the models' estimations for PDO presence, worked better in regions with more PDOs, thus having more data points to calculate the regression model. From the same GIS tool, we retrieved a locally calculated standard deviation, explaining where the observed number of PDOs differed from what the local regression model would suggest (Figure 5). Overall, the regions with more PDOs than suggested by the regression model turned out to be congruent with the European hotspots of PDO production and thus, proving the basic concept of the current model. However, the deviation patterns for particular product types may indicate an unused potential for PDO production but might also point toward missing model parameters. In total, there are many more regions where PDO production is strongly underestimated: As shown in Figure 5, dark green areas indicating that the observed values lie two standard deviations above the expected value were more frequent than regions where PDO production was strongly overestimated (i.e., dark orange areas indicating that the observed values lie two standard deviations below the model's estimation).
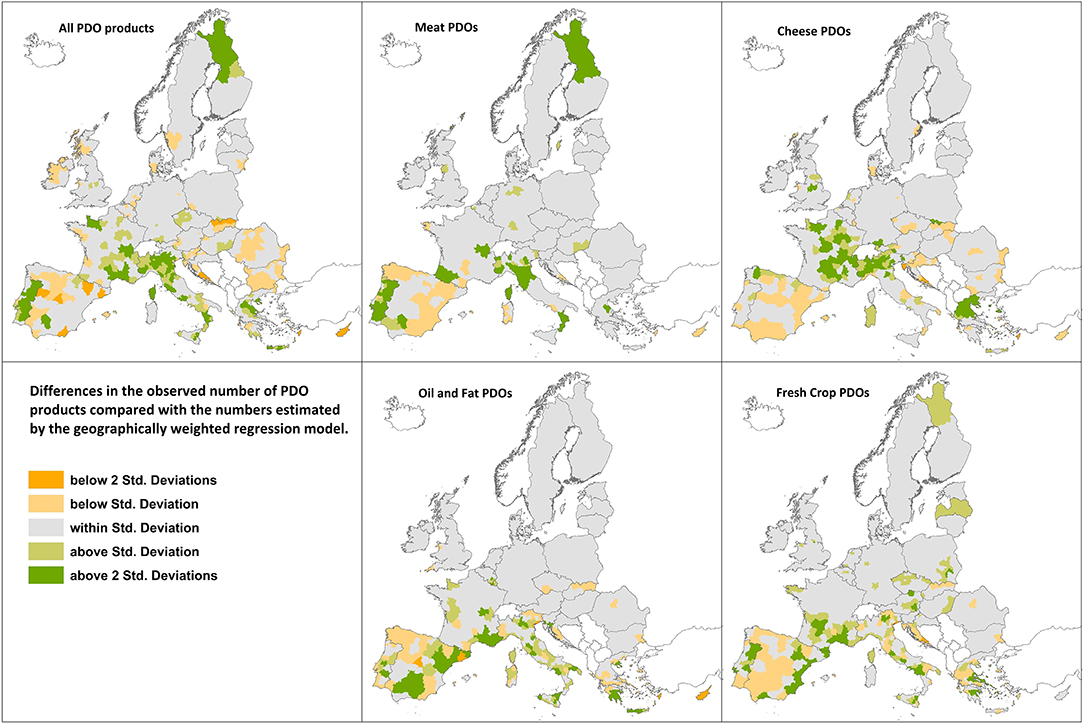
Figure 5. Difference between the observed and expected numbers of PDOs according to the geographically weighted regression model. The difference is displayed in terms of standard deviation and differentiated by PDO product types. This visualization shows, that depending on the product type, there are differences, where the regression under- or over-estimates the presence of PDOs.
Discussion
At a first look, the hurdle models revealed three noteworthy patterns regarding the PDO-landscape relationships. First, we found a clear positive relation between high-ecological values (component 1) and an increased number of PDOs. Second, structural change (component 2) had a significantly different influence on PDOs in the Mediterranean and non-Mediterranean countries. While it was associated with an increase of PDO presence in the Mediterranean, structural change was linked to a decrease of PDO presence in the non-Mediterranean countries. Third, the presence and numbers of meat PDOs were significantly different between the Mediterranean and non-Mediterranean countries as well. To analyze the regional differences properly, we introduced a covariable “Mediterranean” to account for the dominance of Mediterranean countries in PDO production. From the hurdle model, we used both, the zero-model values (analyzing the PDOs' presence), and the count-models (analyzing all cases with at least one PDO).
Landscape Characteristics in Relation to PDO Food Categories
To investigate differences among certain PDO product types (according to product categories of the PDO scheme), we calculated hurdle models for the four most frequent categories (meat, cheese, oils and fats, and fresh crops) against the respective numbers of PDOs. While PDOs in total appeared to benefit most from high ecological values and measures of conservation, the picture got more differentiated when looking at particular types of PDO food products, thus the interpretation got more nuanced:
(a) Meat PDOs
In contradiction to the overall picture, the occurrence of meat PDOs was positively linked to structural change (C2). At the same time, the occurrence of meat products was slightly positively linked to landscapes of cultural-touristic values (C3). The presence of non-Mediterranean meat PDOs was predicted much better by component one, than for Mediterranean meat PDOs. Further, according to the count-model, meat PDOs were less associated with the high ecological values (C1) than “oil and fat,” and “fresh crops” PDOs. These characteristics might imply that meat PDOs have a strong potential to help build up regional landscape marketing and to sustain traditional agro-economic activities within a region (Coutinho et al., 2021). Still, systems dominated by meat PDOs could suffer from ecological and socio-economic deficits. Thus, they could be supported, for example through agri-environmental programs, or with rural development strategies specifically in the Mediterranean countries. The negative linkage between the presence of PDO-labeled non-Mediterranean meat and cultural-touristic landscapes (C3) points toward a mismatch between the traditional cultural values of the PDO products and the current landscape management practices. On contrary, within the Mediterranean region, high cultural values (C3) were a good indicator for the presence of meat PDOs. This link might be explained by the importance that the Mediterranean diet had on landscape management over centuries (Padilla et al., 2012; Petrillo, 2012). Thus, we assume that Mediterranean meat PDOs could be role models for meat production in traditional and social-ecological valuable systems.
(b) Cheese PDOs
Despite cheese being the most frequently used category among PDO labels, our models showed the least explanatory power for cheese PDOs. The only significant coefficients for cheese PDOs told us, that—just as for meat PDOs—Mediterranean cheese PDOs were positively linked to landscapes characterized by structural change (C2). For cheese PDOs, the non-Mediterranean products were even slightly negatively associated with structural change landscapes (C2). Further, cultural-touristic values (C3) had a slightly positive influence on the presence of cheese PDOs. Considering the large total number of cheese PDOs (192 of 638 PDOs), at a first view, it seemed surprising that for this particular sub-sample the models revealed so little significant information. One explanation might be, that within the cheese category there are a few dominant products with extraordinarily high annual trading volumes (Chever et al., 2012) and large production areas. Thus the real-world influence of cheese PDOs might be dominated by mass-products like Feta, Parmigiano Reggiano, or Comte and therefore we were not able to identify strong linkages of cheese to particular social-ecological landscape characteristics. The top cheese PDO-producing countries are Greece, Italy, and France. The famous PDO-labeled cheese products (such as Feta, Parmigiano Reggiano, or Comte) are produced there and have high trading volumes (e.g., up to 200,000 tons annually for Parmiggiano Regiano). Therefore those products may be closer to industrial goods than landscape products (Chever et al., 2012). Small-scale cheese PDOs, which more often could be related to remote agricultural sites or mountainous areas presumably have little overall influence on landscape management. Also, it appears, that for cheese products it is more common to join a geographic indication label for the pure reason of earning the premium price, to keep existing businesses alive (Lamarque and Lambin, 2015).
(c) Oil and fat PDOs
“Oil and fat” PDOs followed the overall pattern of all PDOs combined as their presence was best explained by high ecological values (C1). Also here, the presence of non-Mediterranean products was strongly negatively linked to structural change (C2). Also, Mediterranean “oil and fat” PDOs were negatively linked to structural change (C2), but less strongly. This can probably be explained by the dominance of the Mediterranean countries in olive oil production (olive oils being the dominant product within this category). The cultural-touristic values (C3) were not significantly linked to PDO-labeled “oil and fat” products, which is surprising because olive oil products are, besides cheese and meat products, particularly famous for being PDO-labeled. They are heavily used for regional marketing and there have been scientific studies on this topic coining the term “olive oil tourism” (La Millán-Vazquez de Torre et al., 2017; Folgado-Fernández et al., 2019). Therefore, we assume a mismatch between the perceived cultural-touristic value of olive oil production and the real-world impact on touristic attractiveness. There are aesthetically valuable terraced olive landscapes, but the majority of olive production takes place at rather large and uniform plantations. For that reason, we suggest improving the PDO-landscape relationship by programs that counteract the abandonment of remote or less profitable sites. By making the production of real landscape-shaping products profitable, ecological and cultural values can be preserved at the same time (Egea and Pérez y Pérez, 2016).
(d) Fresh Crops and Vegetable PDOs
The model results for the PDO category “fruit, vegetables and cereals” (fresh crops) were of singular nature. It appeared that among all product categories “fresh crop” PDOs showed to strongest positive linkage with ecologically valuable landscapes (C1). In this category, no significant difference between Mediterranean and non-Mediterranean cases appeared. We explain those results with the crop-like management of products within this category and with their relatively low tendency to accumulate in hotspots or to form clusters (Figure 5). Nevertheless, having no significant coefficients for components two and three also means that there are no relevant negative associations of “fresh crop” PDOs with structural change (C2), neither with cultural-touristic values (C3). It appears, that “fresh crop” PDOs (compared to other product categories) are highly targeted to landscapes of high ecological values (C1), but randomly distributed with regard to the other two components. To make the value of “fresh crop” PDOs more holistic it seems necessary to improve their role in a cultural-touristic context and to make them more profitable for producers in remote rural regions (i.e., generating income). As PDO-labeled fruits, vegetables, and cereals, in particular, compete with organic-labeled products (Marescotti et al., 2020) it seems sensible to focus on re-valorizing those PDOs as culturally attractive assets. PDO-labeled “fresh crop” products should not try to compete with their mass-produced counterparts. If promoted better, they could be used as high-quality ingredients in local kitchens, and for premium-priced processed food.
PDO Hotspots—Potentials and Challenges
Within the EU, PDO products are much more prevalent in the Mediterranean countries and tend to form particularly pronounced hotspots in certain regions. In this study, we looked for the reasons behind this uneven distribution by analyzing which social-ecological landscape characteristics coincide with the production of PDOs. Besides the findings on product-type-dependent linkages with landscape characteristics, we also wanted to know where PDO products occurred both more or less often than estimated by our regression models. Figure 5 shows which regions in Europe seem to overperform or underperform in terms of PDO production, indicating accentuated distribution patterns for separate categories of PDO products. From this visualization of overperforming and underperforming regions, we draw two messages:
Acting on the PDOs' Uneven Distribution in Europe
Overall, the models revealed a relatively clear and uniform picture. Being in a Mediterranean region, had the largest positive effect on the presence of PDOs, and ecological valuable landscapes were positively linked to PDO production. On the contrary, landscapes characterized by structural change were, overall, negatively linked to the presence of PDOs. However, when looking at the count models' coefficients for the covariable “Mediterranean” the picture becomes more nuanced: It appears, that the number of meat PDOs is more strongly linked to the Mediterranean region than for any other product category. And while the pure presence of cheese PDOs (zero-model) is best explained by the covariable “Mediterranean,” the effect on the number of PDOs (count-model) is the lowest among all categories. Meanwhile, the number of “oil and fat” as well as “fresh crop” PDOs is not significantly influenced by the covariable “Mediterranean.” This points toward a highly uneven distribution of PDOs of different categories in Europe. The green and orange clusters in Figure 5 visualize this uneven distribution and display the differences among the four product categories. The observed clusters of overperforming regions might have emerged from traditional landscape management systems or production methods (Bérard and Marchenay, 2006). For example, the areas which overperform in terms of oil and fat PDOs are mostly situated along the Mediterranean coast—hosting the traditional landscapes of olive cultivation. Meanwhile, in northern Europe PDOs only play a small role in food production. Therefore, we claim that PDOs probably will never be evenly spread across Europe because of regional environmental advantages or historical-traditional differences.
The European Union considers the geographical indications (GI) scheme (including the PDOs), to be a supporting instrument for rural development (European Commission, 2020a). To do so, they not only need to incentivize sustainable practices within the existing production systems, but they also have to promote the geographical indication schemes—especially in the non-Mediterranean regions and markets. For example, we found that our regression model predicted at least some presence of cheese PDOs in southern Denmark (Figure 5). Instead, there are no PDOs registered in Denmark. This, however, cannot be explained with the absence of traditional food culture, but more reasonable with a low relevance of PDOs in the Danish market. Studies on Denmark find a general disinterest for PDOs from consumers and producers (Goudis and Skuras, 2021), and higher market shares of the competing organic products segment (European Commission, 2018, 2019). This example somehow proofs the concept and function of the geographically weighted regression model: Because given the frequent milk production in southern Denmark and the existence of well-known Danish PGI cheese products (e.g., Esrom or Danbo cheese), it appears realistic that also cheese PDOs could emerge from those landscapes. However, having the positive relationships of PDO production and landscape management in mind, rural regions could profit from strengthening the existent PDO products' situation or adopting the PDO label for existing traditional products (Escribano et al., 2020).
Using Plant-Based PDOs' for Improving Sustainability
Different sub-regions of the overall PDO hotspots are specialized in certain product types. For example, in France, northern Italy, and northern Greece, we found green clusters of overperforming areas in terms of cheese PDO production. Specifically for cheese, most of the produced volume appears to concentrate within very few high-turnover products related to industrial and intensive production systems. Meanwhile, overperforming areas of oil and fat PDOs, as well as fresh crops PDOs, are spread more widely. Given the surplus of “overperforming” regions, we assume that some of the PDO hotspot areas may operate close to their productive potential, which seems obvious given the limited spatial extent of any PDO (Vandecandelaere et al., 2018). This potential limitation might only be a product-specific limit within a certain region. For example, regions overperforming in terms of meat PDOs (such as central Portugal) might have additional potential for fresh crops PDOs. For incentivizing the registration of new PDO-labeled products, it appears sensible to focus on the plant-based categories, such as “oil and fat” or “fruits, vegetables, and cereals” (fresh crops), when transitioning toward multifunctional landscapes. So far, plant-based products were less attractive for being registered as PDOs because they are often sold as raw products or in a less processed form with lower added values. This could be improved by supporting plant-based products in general, or more specifically by indicating and promoting the use of raw PDO products in further processed foodstuff. Finally, more high-quality plant-based products are necessary to transform diets and agricultural production toward more healthy and sustainable systems (Röös et al., 2017; Willett et al., 2019; Gerten et al., 2020).
Limitations and Outlook
Although the selection of variables was meant to be comprehensive in a social-ecological sense, we cannot claim that the 12 initially selected variables fully represent the landscapes or regional systems, nor can they reflect all aspects of sustainability. That is because from the beginning our selection of variables was meant to specifically reflect social-ecological aspects of geographically protected food products and their respective landscapes of origin. Anyhow, for our aim to explore the relations between landscapes and products, the models worked well. The regression models' quality-of-fit was rather satisfying for such complex systems that we tried to model. We retrieved several significant regression coefficients and thereby were able to reveal tendencies that were plausible within the bigger picture.
For further research, we see two interesting pathways to follow. On one hand, it will be insightful to investigate the current Mediterranean PDO hotspots in-depth and to gain empirical field data about the landscape-product relationship, probably measured in terms of ecosystem services (Ghazoul et al., 2009; Belletti et al., 2015; Lamarque and Lambin, 2015). Regarding the existing PDOs, it appears necessary to analyze the current level of their sustainability and how sustainability efforts can be institutionalized within the European GI scheme (Kizos et al., 2017). So far, the amendments (i.e., updates) to PDO regulations submitted by the producer groups do not focus on environmental issues often but are mostly made to improve the economic situation (Quiñones-Ruiz et al., 2018). We recommend initiating a step-by-step transition of the PDO certification toward a sustainability label.
On the other hand, it would be helpful to better understand the reasons for the uneven distribution within Europe, exploring the influence of food cultural heritage and underlying social-ecological landscape characteristics. Also understanding the social and political circumstances under which PDOs are developed and registered seems crucial (Quiñones-Ruiz et al., 2016). To promote PDOs in Northern Europe as means of sustainable landscape management they need to target suitable landscapes. Thus, the explanatory models for PDO distribution need to be improved to identify high-potential landscapes for PDO production. A relevant overlapping with the HNVF concept seems reasonable but has to be investigated at a local scale. Given their unclear interaction with demographic and cultural aspects, we further recommend focusing research more on plant-based PDO products. While we acknowledge that PDO products cannot be “invented” from scratch but need a foundation in local food traditions and management practices, they should be adapted to changing market situations (Gugerell et al., 2017).
Preserving the “Geographical Origin” Idea
Relating to current policies, we want to highlight that the Farm to Fork strategy of the European Commission sets out to transform the European agricultural system into a sustainable food system and one explicit part of this strategy is the utilization of Geographical Indications (European Commission, 2020a). However, the specific meaning of that sustainability goal is not well-defined (Schebesta and Candel, 2020). As the PDOs' current legal definitions focus on regionality, food traditions, and landscape practices, those rules inherently—but not explicitly—incorporate notions of sustainable and ecologically sound production (Belletti et al., 2015; Egea and Pérez y Pérez, 2016). In this sense, PDOs represent a substantial and yet unused potential to contribute to the implementation of the European Green Deal with its Farm to Fork and biodiversity strategies. To keep up with this aspirational goal, it needs a science-based approach to analyze and monitor the sustainability efforts within PDO production. Otherwise, the PDO scheme faces the risk of a market-oriented commodification of its products (Quiñones-Ruiz et al., 2018; Marescotti et al., 2020).
While we assumed for large parts of this article that most PDO products are landscape-related and come from less intensive systems than their non-labeled counterparts, that is not true for every single registered product (Cozzi et al., 2019). Also concerning socio-economic sustainability indicators (e.g., generational renewal, or food transport miles) PDOs do not always perform better than comparable non-labeled products (Ferrer-Pérez and Gil, 2019). There is evidence that some existing products are not perfectly in line with the central idea of the basic PDO concept, either given their economic turnover, geographical extent, or lack of a landscape-quality relationship. For example, in Italy more than 80% of the annual turnover of GI products is achieved by only 10 brands (Higgins, 2018), there is a Czech spice “Ceský kmín” that can be produced in the whole country, and Feta cheese reaches an annual export volume of 400 million Euros, accounting for the majority of the turnover of all Greek GI products (European Commission, 2020b). Under this impression, we recommend a sustainability-oriented fitness check of the PDOs. This fitness check should refine the current requirements for labels, may adding sustainability criteria to the PDO legislation, and re-checking the eligibility and credibility of existing PDO products' landscape aspects.
Conclusion
With this study, we were able to highlight and differentiate the potential of PDOs to support sustainable landscape management. We found that PDOs appear to be a particularly suitable food labeling strategy in landscapes of high ecological values and landscapes with a strong representation of conservation areas. This confirms our first assumption that high environmental values favor the production of PDOs. Especially plant-based PDOs seem to interact positively with ecological valuable landscapes. Structural change is only clearly linked to the Mediterranean meat and cheese PDOs. Thus, our second assumption only holds true for this sub-sample. For plant-based PDO products, we did not observe this effect. Lastly, we consider our third assumption as proven, with two specifications added: We argue that Mediterranean PDO products are particularly good entry points to combine the ecological and socio-economic aspects of sustainable landscape management. Whereas for non-Mediterranean PDOs mainly the cultural links should be strengthened. Although the trends for different product categories were diverse, we argue that PDOs should be seen as helpful tools for holistic rural development policies.
Our findings underline the potential of the geographical indications scheme for implementing the Farm to Fork strategy and the European Green Deal. We could show that landscapes hosting PDO-labeled products can also contribute to the sustainable development agenda, without however claiming a direct causal linkage. To overcome this uncertainty, an additional sustainability “add-on regulation” for PDOs (for example PDO+) could guarantee that sustainability safeguards are met. To be labeled PDO+, a production system would need to meet a list of criteria specifying both sustainable management practices and landscape characteristics. The resulting sustainable PDOs could be promoted as a tool for implementing the Farm to Fork strategy and introduce an additional consumer preference for high-value products. As many landscapes which yield PDO-labeled products are already managed using sustainable practices, additional costs to farmers and administration could be kept low. Additionally, supporting policies (e.g., provided by the CAP) could particularly support these certified areas or exclude them from the “conditionality” for direct payments.
Meanwhile, socio-economic sustainability aspects are not yet addressed by this certification scheme. However, in regions with little to no registered products, PDO labeling can offer additional income opportunities in rural areas, allowing less intensive production methods to stay economically viable, and allowing management of cultural landscapes to become profitable for current and future generations. Given the strong existing relationship between PDOs and ecological valuable landscapes, these labels have a high potential for producing synergies across different sustainability dimensions including nature conservation, cultural values, regional identities, and rural income.
Data Availability Statement
The original contributions presented in the study are included in the article/Supplementary Material, further inquiries can be directed to the corresponding author.
Author Contributions
LF and YZ developed the overall concept of this article, selected the methodological approach, and have been in charge of data acquisition and mapping and also developed the academic discussion stemming from the results, including the scientific outlook and practical recommendations. MC-P and CP-L selected, refined, and computed the regression models, helped with the interpretation of the statistical results, and thereby contributed to the discussion of the results. All authors contributed to the article and approved the submitted version.
Conflict of Interest
The authors declare that the research was conducted in the absence of any commercial or financial relationships that could be construed as a potential conflict of interest.
Publisher's Note
All claims expressed in this article are solely those of the authors and do not necessarily represent those of their affiliated organizations, or those of the publisher, the editors and the reviewers. Any product that may be evaluated in this article, or claim that may be made by its manufacturer, is not guaranteed or endorsed by the publisher.
Acknowledgments
We are very thankful to Fabian Rimenez Rey who helped to create the PDO dataset. We are also indebted to three reviewers for their suggestions that greatly improved the article. This publication was financially supported by the Open Access funding program of the German Research Foundation and the Publication Fund of the University of Göttingen.
Supplementary Material
The Supplementary Material for this article can be found online at: https://www.frontiersin.org/articles/10.3389/fcosc.2021.752377/full#supplementary-material
References
Andersson, E., Nykvist, B., Malinga, R., Jaramillo, F., and Lindborg, R. (2015). A social-ecological analysis of ecosystem services in two different farming systems. Ambio 44 (Suppl. 1) S102–S112. doi: 10.1007/s13280-014-0603-y
Belletti, G., Marescotti, A., Sanz-Cañada, J., and Vakoufaris, H. (2015). Linking protection of geographical indications to the environment: evidence from the European Union olive-oil sector. Land Use Policy 48, 94–106. doi: 10.1016/j.landusepol.2015.05.003
Bérard, L., and Marchenay, P. (2006). Local products and geographical indications: taking account of local knowledge and biodiversity. Int. Soc. Sci. J. 58, 109–116. doi: 10.1111/j.1468-2451.2006.00592.x
Cameron, A. C., and Trivedi, P. K. (2013). Regression Analysis of Count Data. Cambridge: Cambridge University Press. doi: 10.1017/CBO9781139013567
Chever, T., Renault, C., Renault, S., and Romieu, V. (2012). Value of Production of Agricultural Products and Foodstuffs, Wines, Aromatised Wines and Spirits Protected by a Geographical Indication (GI): Final Report. Brussels: EU Publications.
Clark, L. F., and Kerr, W. A. (2017). Climate change and terroir: the challenge of adapting geographical indications. J. World Intellect. Prop. 20, 88–102. doi: 10.1111/jwip.12078
Coutinho, P., Simões, M., Pereira, C., and Paiva, T. (2021). Sustainable local exploitation and innovation on meat products based on the autochthonous bovine breed jarmelista. Sustainability 13:2515. doi: 10.3390/su13052515
Cozzi, E., Donati, M., Mancini, M. C., Guareschi, M., and Veneziani, M. (2019). “PDO parmigiano reggiano cheese in Italy,” in Sustainability of European Food Quality Schemes: Multi-Performance, Structure, and Governance of PDO, PGI, and Organic Agri-Food Systems, eds F. Arfini, and V. Bellassen (Cham: Springer International Publishing), 427–449. doi: 10.1007/978-3-030-27508-2_22
Egea, P., and Pérez y Pérez, L. (2016). Sustainability and multifunctionality of protected designations of origin of olive oil in Spain. Land Use Policy 58, 264–275. doi: 10.1016/j.landusepol.2016.07.017
Escribano, M., Gaspar, P., and Mesias, F. J. (2020). Creating market opportunities in rural areas through the development of a brand that conveys sustainable and environmental values. J. Rural Stud. 75, 206–215. doi: 10.1016/j.jrurstud.2020.02.002
European Commission (2019). Organic farming in the EU: A fast growing sector. Brussels: European Commission.
European Commission (2020a). Farm to Fork Strategy - For a Fair, Healthy and Environmentally-Friendly Food System. Brussels: European Commission.
European Commission (2020b). Study on Economic Value of EU Quality Schemes, Geographical Indications (GIs) and Traditional Specialities Guaranteed (TSGs): Final Report. Brussels: European Commission.
European Council (1992). Council Regulation (EEC) No 2081/92 of 14 July 1992 on the Protection of Geographical Indications and Designations of Origin for Agricultural Products and Foodstuffs. Brussels: European Council.
European Council (2012). Regulation (EU) No 1151/2012 of the European Parliament and of the Council of 21 November 2012 on Quality Schemes for Agricultural Products and Foodstuffs: L 343. Brussels: European Council.
Ferrer-Pérez, H., and Gil, J. M. (2019). “PGI Ternasco de Aragón Lamb in Spain,” in Sustainability of European Food Quality Schemes: Multi-Performance, Structure, and Governance of PDO, PGI, and Organic Agri-Food Systems, eds F. Arfini, and V. Bellassen (Cham: Springer International Publishing), 355–376. doi: 10.1007/978-3-030-27508-2_19
Flinzberger, L., Zinngrebe, Y., and Plieninger, T. (2020). Labelling in Mediterranean agroforestry landscapes: a Delphi study on relevant sustainability indicators. Sustain. Sci. 15, 1369–1382. doi: 10.1007/s11625-020-00800-2
Folgado-Fernández, J. A., Campón-Cerro, A. M., and Hernández-Mogollón, J. M. (2019). Potential of olive oil tourism in promoting local quality food products: A case study of the region of Extremadura, Spain. Heliyon 5:e02653. doi: 10.1016/j.heliyon.2019.e02653
Fournier, L.-S., and Michel, K. (2017). “Mediterranean food as cultural property? Towards an anthropology of geographical indications,” in Taste | Power | Tradition, eds. S. May, K. L. Sidali, A. Spiller, and B. Tschofen (Göttingen: Göttingen University Press), 77–86.
Gerten, D., Heck, V., Jägermeyr, J., Bodirsky, B. L., Fetzer, I., Jalava, M., et al. (2020). Feeding ten billion people is possible within four terrestrial planetary boundaries. Nat. Sustain. 495:305. doi: 10.1038/s41893-019-0465-1
Ghazoul, J., Garcia, C., and Kushalappa, C. (2011). “Landscape labelling approaches to PES: bundling services, products and stewards,” in Payments for Ecosystem Services and Food Security, eds D. Ottaviani, and N. E.-H. Scialabba (Rome: FAO), 171–204.
Ghazoul, J., Garcia, C., and Kushalappa, C. G. (2009). Landscape labelling: a concept for next-generation payment for ecosystem service schemes. For. Ecol. Manag. 258, 1889–1895. doi: 10.1016/j.foreco.2009.01.038
Goudis, A., and Skuras, D. (2021). Consumers' awareness of the EU's protected designations of origin logo. Br. Food J. 123, 1–18. doi: 10.1108/BFJ-02-2020-0156
Gugerell, K., Uchiyama, Y., Kieninger, P. R., Penker, M., Kajima, S., and Kohsaka, R. (2017). Do historical production practices and culinary heritages really matter? Food with protected geographical indications in Japan and Austria. J. Ethnic Foods 4, 118–125. doi: 10.1016/j.jef.2017.05.001
Higgins, D. M.. (2018). Brands, Geographical Origin, and the Global Economy. Cambridge: Cambridge University Press. doi: 10.1017/9781139507059
Jackman, S.. (2020). pscl: Classes and Methods for R Developed in the Political Science Computational Laboratory. R package version 1.5.5. Sydney, NSW: United States Studies Centre.
Kizos, T., Koshaka, R., Penker, M., Piatti, C., Vogl, C. R., and Uchiyama, Y. (2017). The governance of geographical indications. Br. Food J. 119, 2863–2879. doi: 10.1108/BFJ-01-2017-0037
Kizos, T., and Vakoufaris, H. (2009). Alternative agri-food geographies? geographic indications in Greece. Tijdschrift voor economische en sociale geografie 102, 220–235. doi: 10.1111/j.1467-9663.2010.00612.x
La Millán-Vazquez de Torre, M. G., Arjona-Fuentes, J. M., and Amador-Hidalgo, L. (2017). Olive oil tourism: promoting rural development in Andalusia (Spain). Tourism Manag. Perspect. 21, 100–108. doi: 10.1016/j.tmp.2016.12.003
Lamarque, P., and Lambin, E. F. (2015). The effectiveness of marked-based instruments to foster the conservation of extensive land use: the case of Geographical Indications in the French Alps. Land Use Policy 42, 706–717. doi: 10.1016/j.landusepol.2014.10.009
Mann, C., and Plieninger, T. (2017). The potential of landscape labelling approaches for integrated landscape management in Europe. Landscape Res. 42, 904–920. doi: 10.1080/01426397.2017.1335863
Marescotti, A., Quiñones-Ruiz, X. F., Edelmann, H., Belletti, G., Broscha, K., Altenbuchner, C., et al. (2020). Are protected geographical indications evolving due to environmentally related justifications? An analysis of amendments in the fruit and vegetable sector in the European Union. Sustainability 12:3571. doi: 10.3390/su12093571
May, S. (2016). Ausgezeichnet! - Zur Konstituierung kulturellen Eigentums durch geografische Herkunftsangaben. Göttingen: Universitätsverlag Göttingen. doi: 10.17875/gup2016-1005
Mullahy, J.. (1986). Specification and testing of some modified count data models. J. Econom. 33, 341–365. doi: 10.1016/0304-4076(86)90002-3
Nagelkerke, N. J. D. (1991). A note on a general definition of the coefficient of determination. Biometrika 78, 691–692. doi: 10.1093/biomet/78.3.691
Oteros-Rozas, E., Ruiz-Almeida, A., Aguado, M., González, J. A., and Rivera-Ferre, M. G. (2019). A social-ecological analysis of the global agrifood system. PNAS. 116, 26465–26473. doi: 10.1073/pnas.1912710116
Padilla, M., Capone, R., and Palma, G. (2012). “Sustainability of the foodchain from field to plate: The vase of the Mediterranean diet,” in Sustainable Diets and Biodiversity: Directions and Solutions for Policy, Research and Action, eds B. A. Burlingame, and S. Dernini (Rome: FAO), 230–240.
Pe'er, G., Bonn, A., Bruelheide, H., Dieker, P., Eisenhauer, N., Feindt, P. H., et al. (2020). Action needed for the EU common agricultural policy to address sustainability challenges. People Nat. 2:305–316. doi: 10.1002/pan3.10080
Petrillo, P. L.. (2012). “Biocultural diversity and the mediterranean diet,” in Sustainable Diets and Biodiversity: Directions and Solutions for Policy, Research and Action, eds B. A. Burlingame, and S. Dernini (Rome: FAO), 222–229.
Quiñones-Ruiz, X. F., Forster, H., Penker, M., Belletti, G., Marescotti, A., Scaramuzzi, S., et al. (2018). How are food geographical indications evolving? – an analysis of EU GI amendments. Br. Food J. 120, 1876–1887. doi: 10.1108/BFJ-02-2018-0087
Quiñones-Ruiz, X. F., Penker, M., Belletti, G., Marescotti, A., Scaramuzzi, S., Barzini, E., et al. (2016). Insights into the black box of collective efforts for the registration of geographical indications. Land Use Policy 57, 103–116. doi: 10.1016/j.landusepol.2016.05.021
Röös, E., BajŽelj, B., Smith, P., Patel, M., Little, D., and Garnett, T. (2017). Protein futures for Western Europe: potential land use and climate impacts in 2050. Reg. Environ. Change 17, 367–377. doi: 10.1007/s10113-016-1013-4
Schebesta, H., and Candel, J. J. L. (2020). Game-changing potential of the EU's Farm to Fork Strategy. Nat. Food 1, 586–588. doi: 10.1038/s43016-020-00166-9
Tashiro, A., Uchiyama, Y., and Kohsaka, R. (2019). Impact of geographical indication schemes on traditional knowledge in changing agricultural landscapes: an empirical analysis from Japan. J. Rural Stud. 68, 46–53. doi: 10.1016/j.jrurstud.2019.03.014
Török, Á., and Moir, H. V. J. (2018). The market size for GI food products – evidence from the empirical economic literature. Stud. Agr. Econ. 120, 134–142. doi: 10.7896/j.1816
Vakoufaris, H., Belletti, G., Kizos, T., and Marescotti, A. (2014). “Protected geographical indications and the landscape: towards a conceptual framework,” in Paper Prepared for the 15th Council of Europe Meeting of the Workshops for the implementation of the European Landscape Convention ‘Sustainable Landscapes and Economy: on the inestimable natural and human value of the landscape (Ürgüp).
Vandecandelaere, E., Teyssier, C., Barjolle, D., Jeanneaux, P., Fournier, S., and Beucherie, O. (2018). Strengthening sustainable food systems through geographical indications: An analysis of economic impacts. Directions in investment report, Rome. Available online at: http://www.fao.org/3/a-i8737en.pdf
Willett, W., Rockström, J., Loken, B., Springmann, M., Lang, T., Vermeulen, S., et al. (2019). Food in the Anthropocene: the EAT–Lancet Commission on healthy diets from sustainable food systems. Lancet 393, 447–492. doi: 10.1016/S0140-6736(18)31788-4
Keywords: geographical indications, labeling, landscape labels, cultural landscapes, high nature value farming, principal component analysis, Protected Designation of Origin, Farm to Fork strategy
Citation: Flinzberger L, Cebrián-Piqueras MA, Peppler-Lisbach C and Zinngrebe Y (2022) Why Geographical Indications Can Support Sustainable Development in European Agri-Food Landscapes. Front. Conserv. Sci. 2:752377. doi: 10.3389/fcosc.2021.752377
Received: 02 August 2021; Accepted: 07 December 2021;
Published: 05 January 2022.
Edited by:
Christos Mammides, Frederick University, CyprusReviewed by:
Hristos Vakoufaris, Hellenic Ministry of Rural Development and Food, GreeceThanasis Kizos, University of the Aegean, Greece
Štefan Bojnec, University of Primorska, Slovenia
Copyright © 2022 Flinzberger, Cebrián-Piqueras, Peppler-Lisbach and Zinngrebe. This is an open-access article distributed under the terms of the Creative Commons Attribution License (CC BY). The use, distribution or reproduction in other forums is permitted, provided the original author(s) and the copyright owner(s) are credited and that the original publication in this journal is cited, in accordance with accepted academic practice. No use, distribution or reproduction is permitted which does not comply with these terms.
*Correspondence: Lukas Flinzberger, bHVrYXMuZmxpbnpiZXJnZXJAdW5pLWdvZXR0aW5nZW4uZGU=