Abstract
This paper presents a methodology combining Network Science (NS) and Explainable Machine Learning (XML) that could hypothetically uncover shared principles across seemingly disparate scientific domains. As an example, it presents how the approach could be applied to four fields: materials science, neuroscience, social science, and cosmology. The study focuses on criticality, a phenomenon associated with the transition of complex systems between states, characterized by sudden and significant behavioral shifts. By proposing a five-step methodology—ranging from relational data collection to cross-domain analysis with XML—the paper offers a hypothetical framework for potentially identifying criticality-related features in these fields and transferring insights across disciplines. The results of domains cross-fertilization could support practical applications, such as improving neuroprosthetics and brain-machine interfaces by leveraging criticality in materials science and neuroscience or developing advanced materials for space exploration. The parallels between neural and social networks could deepen our understanding of human behavior, while studying cosmic and social systems may reveal shared dynamics in large-scale, interconnected structures. A key benefit could be the possibility of using transfer learning, that is XML models trained in one domain might be adapted for use in another with limited data. For instance, if common aspects of criticality in neuroscience and cosmology are identified, an algorithm trained on brain data could be repurposed to detect critical states in cosmic systems, even with limited cosmic data. This interdisciplinary approach advances theoretical frameworks and fosters practical innovations, laying the groundwork for future research that could transform our understanding of complex systems across diverse scientific fields.
1 Introduction
“Things are linked by invisible ties, you cannot pick a flower without disturbing a star.” – Galileo Galilei.
Throughout the centuries, humanity has consistently sought to find connections between various phenomena to uncover underlying universal principles. This desire for cohesion has driven scientific research and philosophical reflection, with historical examples such as the ancient Greeks’ interest in the arché and Newton’s laws unifying celestial and terrestrial motion. The search for a “theory of everything” in physics represents the latest effort to unite all the fundamental forces and particles of the universe into a single formulation (Hawking, 2006; Huang et al., 2018; Kirk et al., 1983; Wilson, 1999).
Despite the desire to uncover unifying principles, progress in this area has been limited, primarily due to the lack of adequate theoretical and computational tools (Holland, 1995; Mitchell, 2009). However, in recent decades, significant changes have occurred. The rise of interdisciplinary collaboration across scientific fields has fostered a powerful synergy, advancing innovative theoretical frameworks and computational methodologies. The complex systems approach, central to this development, focuses on understanding the interactions and emergent behaviors of system components rather than isolating them (Parisi, 1999; Ladyman et al., 2013; Estrada, 2024). This contrasts with the reductionist method, which seeks to explain phenomena by breaking them down into their smallest parts. While reductionism excels in studying individual components, the complex systems approach abstracts fundamental principles governing diverse systems, regardless of context, providing deeper and more unified models (Denning, 2017; Zorzo et al., 2024).
In this scenario, two foundational tools - network science (NS) and machine learning (ML) - have the potential, when effectively integrated, to significantly advance the discovery of shared principles across diverse domains. NS focuses on studying complex systems modeled as networks, which consist of nodes (representing entities or elements) and edges (representing the connections or relationships between nodes). This framework allows us to analyze the structure, dynamics, and behavior of interconnected systems across various fields. By representing entities and their interactions as nodes and edges, network science enables researchers to apply graph theory to reveal common patterns and principles that transcend individual disciplines (Iñiguez et al., 2020; Das and Soylu, 2023). For example, it has been applied across a wide range of domains—including materials science, cosmology, social sciences, biology, and technology—to analyze phenomena such as phase transitions, information flow, disease transmission, social dynamics, and technological innovation (Patel et al., 2024; Choudhary and DeCost, 2021; Batzner et al., 2022; Aroboto et al., 2023; Batatia et al., 2025; Strey et al., 2023; Artime et al., 2024; Pósfai and Barabási, 2016; Rosato et al., 2008). ML is a key aspect of Artificial Intelligence (AI), enabling systems to perform tasks requiring human-like intelligence, such as learning and problem-solving. ML could help researchers to extract insights from diverse data, uncovering hidden patterns and potential universal principles across various fields. It enables the automated discovery of correlations, associations, and causal relationships, facilitating cross-domain comparisons (Khetani et al., 2023; Longo et al., 2024). This paper focuses on Explainable ML systems (XML) as they offer several key advantages, including greater transparency, enabling users to understand model decisions and build trust (Angelini et al., 2024; D’Amore et al., 2024; Islam et al., 2022; Linardatos et al., 2020; Guidotti et al., 2019b; Bodria et al., 2023). XML ability to analyze feature importance is especially valuable for comparing different domains. NS and XML offer complementary approaches for studying shared principles across different domains through computer simulations and big data analytics. By integrating these methodologies, researchers can harness the strengths of each to address interdisciplinary challenges, uncover hidden patterns, and deepen our understanding of complex systems in science and beyond.
This article introduces a highly interdisciplinary methodological approach that, for the first time, combines NS and XML to explore the possibility of uncovering shared organizational and functional principles across scientific domains. As an example, it discusses how the methodology could be applied to four seemingly unrelated areas: atomic structures in materials science, neuroscience, social science, and cosmology. These four domains were chosen because they represent distinct yet fundamental scales of organization, ranging from the microscopic to the cosmic. By examining atomic structures, we gain insights into the fundamental building blocks of matter. Neuroscience allows us to explore complex biological systems and cognitive processes. Social science offers a lens into the behavior of human networks, while cosmology extends our understanding to the vast structures of the universe. Despite their differences, these domains could share underlying patterns and principles that reveal universal organizational dynamics, making them ideal for comparative analysis. The study focuses on criticality, a crucial concept for understanding how complex systems transition between states, why they exhibit sudden shifts in behavior, and how universal patterns emerge across different scales. Criticality, a phenomenon extensively studied, serves as a representative phenomenon for analyzing the dynamics of complex systems.
The integration of NS and XML could represent a significant methodological advancement, offering new insights into cross-domain similarities that have not been previously explored in the literature. By applying this approach, the paper seeks to go beyond existing studies and provide a deeper understanding of the fundamental organizational principles shared across these domains, thus offering both a fresh research perspective and new contributions to the field. The significance of our research lies in its potential to foster unprecedented collaboration across disciplinary boundaries, paving the way for innovative discoveries. A key advantage of identifying common principles across domains is the use of transfer learning, an ML technique that adapts models from one domain to another, reducing the need for extensive training data (Pan and Yang, 2009; Weiss et al., 2016). In cases where data collection is challenging, such as in the observation of cosmic phenomena, transfer learning can exploit similarities between complex systems to enhance the efficiency of training. The proposed approach could also offer practical benefits by advancing theoretical understanding and enabling cross-domain applications. Insights from one field can inspire breakthroughs in another. For example, connections between atomic structures and brain activity might lead to advanced neurotechnology materials, while parallels between social and cosmic networks could inform models of collective behavior, impacting fields like sociology and astrophysics.
2 Criticality across different domains
Criticality refers to continuous (second-order) phase transitions, where a system undergoes a smooth but profound change in state characterized by diverging correlation lengths, scale invariance, and critical fluctuations. This is distinct from first-order transitions, which involve abrupt changes and latent heat, such as melting or boiling. Criticality occurs across fields, such as in materials science, where, near critical temperature or pressure, small fluctuations can cause significant changes, such as the emergence of superconductivity or superfluidity, showcasing criticality role in material behavior (Stanley, 1971; Nishimori and Ortiz, 2011; Petrucci et al., 2017; Parisi et al., 2017; Fultz, 2020). In neuroscience, phase transitions occur in neural dynamics, such as shifts between unconscious and conscious states or non-REM and REM sleep (Allegrini et al., 2015). Criticality emerges when small disturbances in neural networks cause large-scale changes, driving cognitive or brain state shifts. Alterations in criticality, rather than its complete loss, are linked to neurodegenerative disorders, where deviations from optimal critical states disrupt brain function (Beggs and Plenz, 2003; Beggs, 2008; Chialvo, 2010). In social science, phase transitions occur during sudden societal shifts or market changes, such as rapid smartphone adoption or financial crises, where small fluctuations in behavior or confidence trigger large transformations (Levy, 2005; Contucci et al., 2008; Fukami and Nakajima, 2011). In cosmic science, phase transitions include events like the early universe cooling after the Big Bang or gas clouds collapsing into stars. Criticality is key in these processes, where small energy density fluctuations near critical points shape the universe’s structure, influencing galaxy and star formation (Guardo et al., 2014; Barrow and Scherrer, 2018).
Criticality offers a powerful lens to explore interconnected phenomena across scales, from atoms to the brain, society, and the cosmos. It marks tipping points where systems undergo transformative changes, uncovering universal principles that govern complex behaviors. From atomic reorganization and neural shifts to societal changes and cosmic events, criticality shows how small fluctuations can trigger large-scale effects, revealing fundamental mechanisms that link diverse domains.
3 A five-steps computational method to study criticality across different domains
This section introduces a five-steps computational method for quantitatively analyzing the mechanisms governing criticality across materials science, neuroscience, social sciences, and cosmology. Figure 1 shows the proposed framework. The procedure is explained with theoretical and computational justifications for the choices made and examples illustrating its application to specific cases. While the method is applied to the case of criticality in this work, it is general and can be extended to investigate other shared phenomena.
FIGURE 1
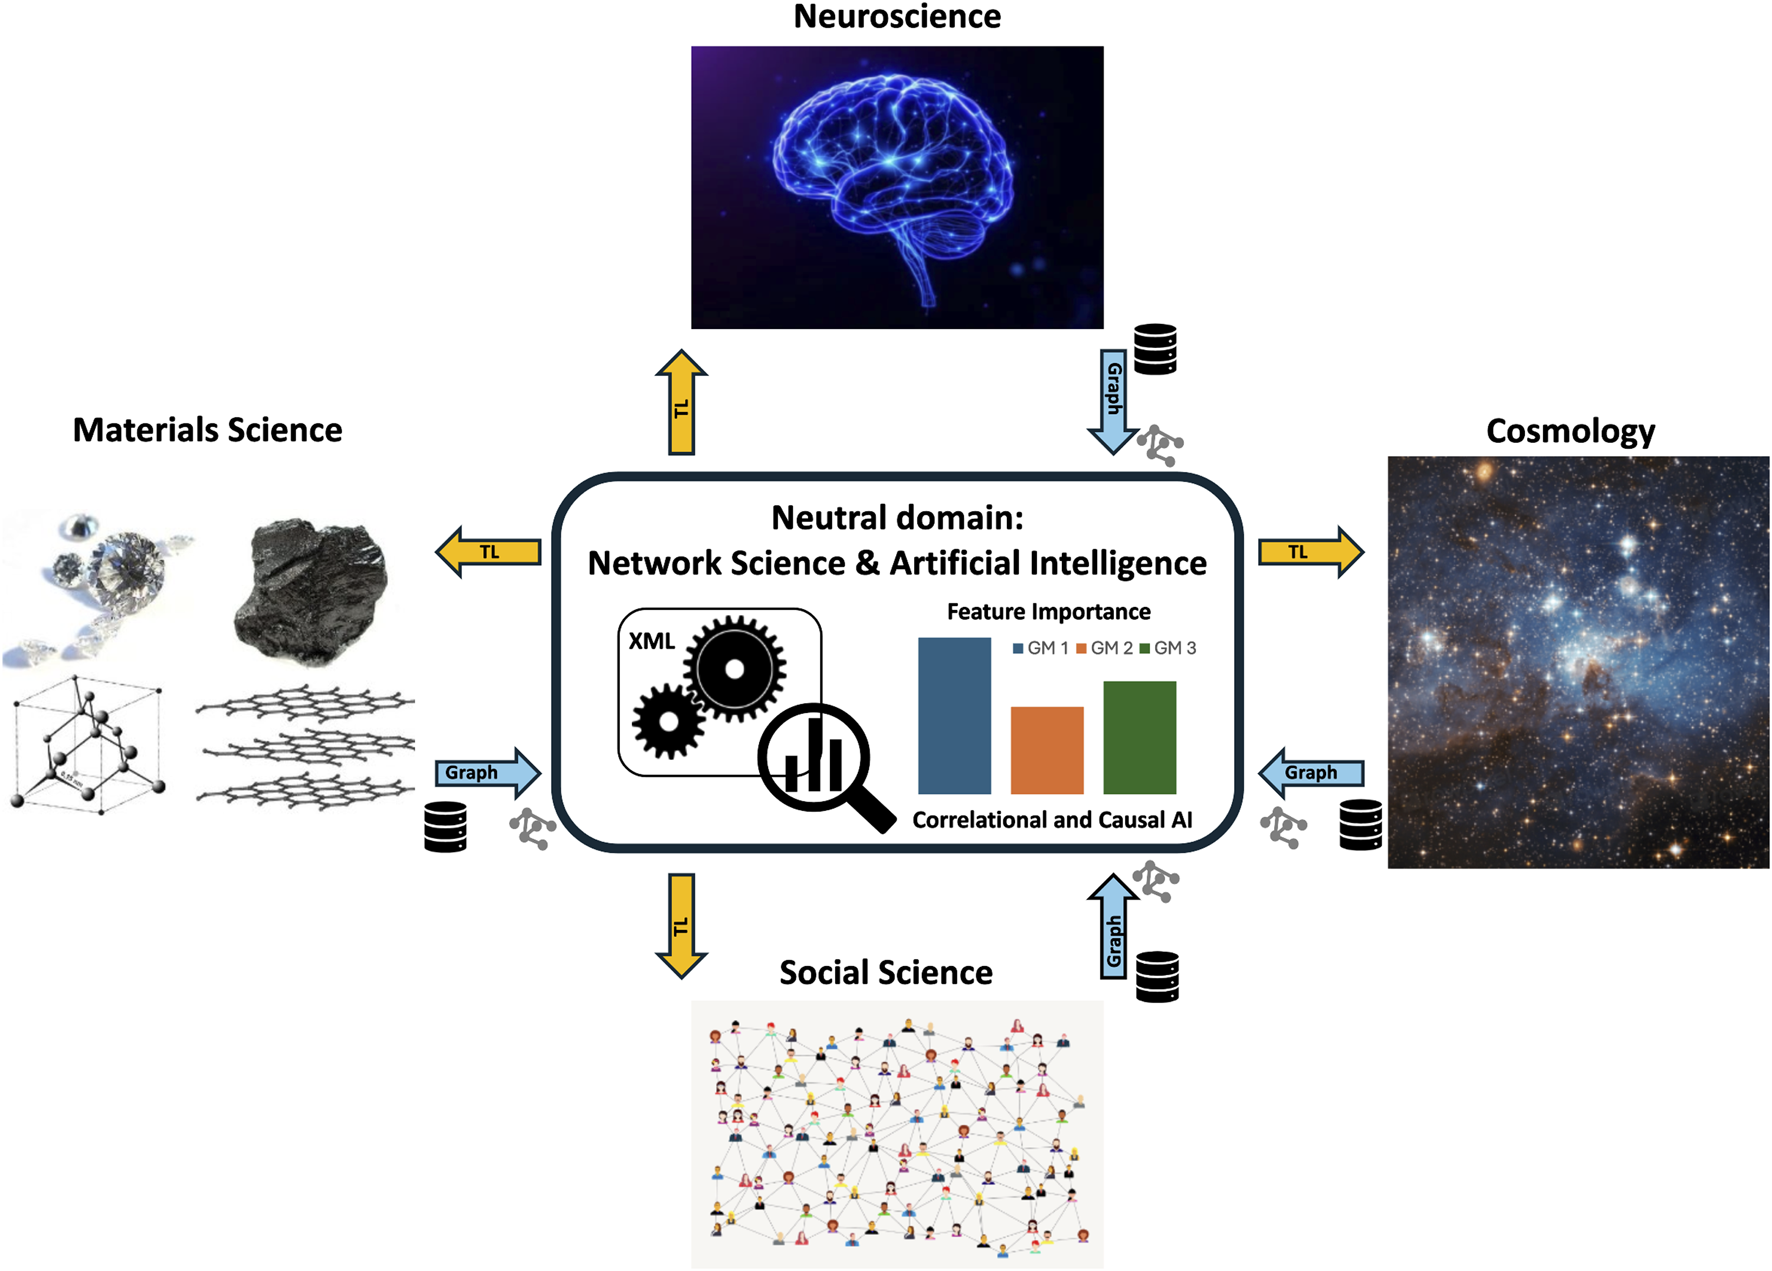
Proposed framework to unveil shared and organizational principles among seemingly unrelated domains. The approach can be unpacked in five steps: 1) Collection of domain-specific relational data (represented by the database icons); 2) Data transformation into a neutral domain via graph representation (blue arrows and graph icons); 3) Data inspection and labeling; 4) Explainable Machine Learning (XML) and feature importance analysis using Graph Metrics (GM1, GM2, GM3); 5) Translating insights from the neutral domain back to specific domains through Transfer Learning (TL) (yellow arrows). GM1, GM2, and GM3 are illustrative examples of graph metrics; the actual number and identity of relevant metrics may vary depending on the domain and dataset.
3.1 Step one: collecting relational data
The first step involves gathering data that describes relationships between elements in each domain. Large-scale ML datasets from numerical simulations across various physical systems could be valuable for accelerating research and for supporting the creation of multi-disciplinary foundation models (Ohana et al., 2024; The Multimodal Universe Collaboration et al., 2025). In materials science, relational data refers to the network of atoms in a crystalline structure, where nodes represent atoms and links represent chemical bonds, essential for analyzing stability, mechanical properties, and material stress response (Mrdjenovich et al., 2020; Shi et al., 2024). In neuroscience, relational data could map the human connectome, where nodes are neurons and links are synapses, aiding the study of cognition and neurological disorders (Sporns, 2011; Hegedűs and Grolmusz, 2025). In social sciences, it could capture connections within social networks, with nodes as people and links as interactions like friendships, useful for studying influence and group dynamics (Rossetti and Cazabet, 2018; Failla et al., 2024). In cosmology, relational data could describe the galaxy network, with nodes as galaxies and links as gravitational relationships, essential for understanding cosmic evolution (Strey et al., 2023; Zhou and Li, 2025).
Collecting relational data is crucial for comparing common phenomena across domains. One key benefit is tracking how interactions change over time (Milo et al., 2002) – such as the evolution of crystal structures, brain synapses, social group dynamics, or galaxies. Relational data also help analyze system functionality by showing how interactions shape overall behavior (Boccaletti et al., 2006). Graphs could represent complex structures, allowing for quantitative analysis of nodes and connections. This approach is crucial for Step Two of the proposed method (see below), which involves representing data from various domains using a system neutral to the origin of the data. A neutral mathematical formalism, such as graphs, allows the application of common theories and algorithms to analyze and compare cross-domain phenomena, facilitating the identification of universal principles that govern interactions in complex systems. For example, neural networks in the brain may share properties similar to social networks and galaxy networks, such as the presence of hubs (highly connected nodes) and power-law distributions (Pósfai and Barabási, 2016; Vazza and Feletti, 2020).
3.2 Step two: transforming specific domain data into a neutral domain
After collecting relational data from various domains, the next step is to represent this data using a neutral mathematical framework (blu arrows in Figure 1). This abstract framework is independent of the specific contexts of materials science, neuroscience, social science, or cosmology, enabling a standardized approach that could facilitate comparison and analysis. Several computational approaches can transform data from different domains into a common neutral framework. For example, Bayesian networks model probabilistic dependencies to capture causal relationships in systems like synaptic connections or social interactions (Friedman and Koller, 2003; Koller and Friedman, 2009). Agent-based models simulate actions and interactions to study emergent phenomena, such as collective behavior or structure formation (Bonabeau, 2002). Time series analysis tracks how variables evolve in dynamic systems, predicting future values (Fu, 2011), while PCA reduces dimensionality to highlight key components in large datasets, useful in fields like genetics or neuroscience (Greenacre et al., 2022). Together, these techniques provide complementary insights into relational data.
These approaches are well-suited for representing data across domains in a neutral format. This article will focus on graphs, mathematical structures made of nodes (elements of the system) and connections (relations between them). There are several compelling reasons for using graphs (Iñiguez et al., 2020; Das and Soylu, 2023). A first advantage of using graphs is the availability of a vast range of well-established algorithms and tools for network analysis. These include algorithms for community detection, centrality measures, and pattern recognition. Graphs are also highly scalable and flexible, representing systems at varying scales-from atomic interactions in materials to networks of galaxies in the universe. This scalability makes them applicable to several scenarios, offering greater flexibility than other computational methods. Finally, graphical visualization of networks is particularly effective for exploring and interpreting complex structures, providing a significant advantage over methods such as time series analysis or principal component analysis, which can be less intuitive to visualize.
Graphs have indices that describe their structural and functional properties. For example, the degree indicates the number of edges connected to a vertex, while order and size refer to the total number of vertices and edges. The diameter measures the maximum distance between two vertices, and the radius measures the minimum distance from a vertex. The clustering coefficient quantifies vertex neighbor interconnectivity, while path length refers to the average distance between all pairs of vertices in the graph. Researchers analyze criticality in graphs using various metrics which are pivotal to understanding phase transitions (Dorogovtsev et al., 2008). For example, the degree distribution of critical graphs often follows a power-law, with a few hubs having many connections and most nodes few. This behavior is typical of scale-free networks, which remain resilient to random node removal but become vulnerable when hubs are lost (Barabási, 2009). Figure 2 illustrates the transformation of four domain-specific relational datasets into neutral domains through graph representations. This process provides a foundation for exploring shared aspects across the domains.
FIGURE 2
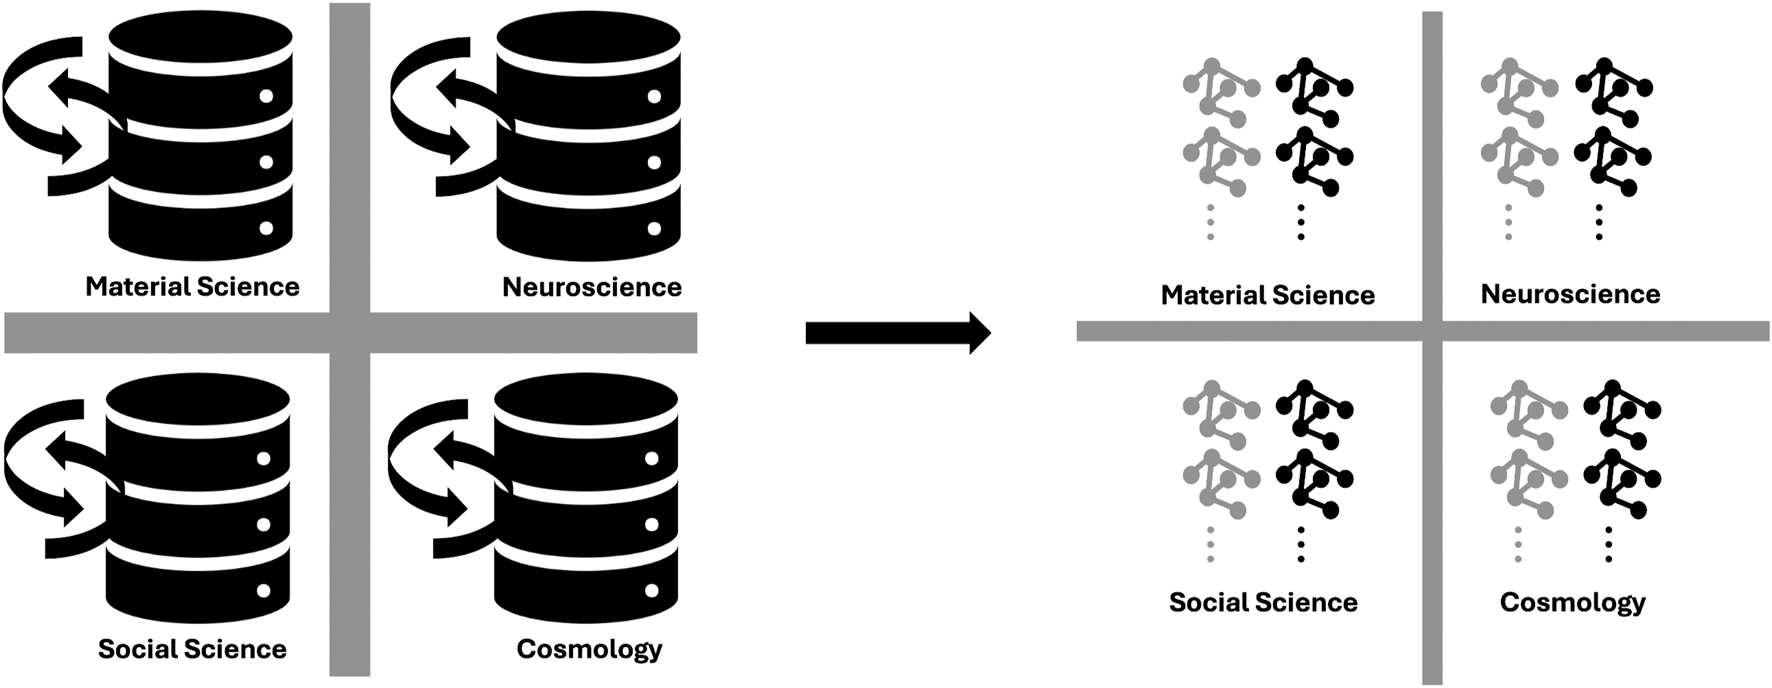
Transforming the four domain relational datasets (Step One, left) into their corresponding neutral domains using graph representations (Step Two, right). This transformation lays the groundwork for constructing a framework to explore common aspects across the different domains. The reduced thickness of the cross dividing the four domains in the neutral representation signifies the potential convergence in the study of them.
3.3 Step three: building datasets for training explainable machine learning with graph-based indices
This phase aims at constructing four datasets, each linking graph index values (graph metrics) from a given domain to two possible states: critical and non-critical. These datasets are used in the next stage to train a machine learning algorithm to classify graphs as either critical or non-critical based on their index values. Consider specific examples for each domain. In materials science, criticality refers to the point where a material experiences a drastic change in properties due to factors like temperature, pressure, or composition, as seen in phase transitions. For example, water solid-liquid and liquid-gas transitions near critical points (Bore and Paesani, 2023; Cheng et al., 2019). In superconducting materials, criticality occurs at the critical temperature, when a material transitions to a superconducting state (Tinkham, 2004; Annett, 2004; Flores-Livas et al., 2020). Data from atomistic configurations at critical and non-critical points can help construct graphs with indices reflecting these states. In neuroscience, criticality reflects proper brain function, while non-critical states are linked to pathological conditions (Chialvo, 2010; Zimmern, 2020a; Shi et al., 2022). Connectome data from healthy individuals represent a critical state, while data from neurodegenerative patients represent a non-critical state. Using data from healthy and diseased subjects, graphs can be constructed to represent critical and non-critical states, respectively. In social sciences, data from stable communities (critical state) and communities in crisis (non-critical state) generate graphs for analysis (Levy, 2005; Contucci et al., 2008; Fukami and Nakajima, 2011). Similarly, in cosmology, criticality relates to galaxy structures formation, while non-critical states represent equilibrium. Researchers can use observations of galaxy distribution in the extragalactic sky (Euclid Collaboration et al., 2024; Amendola et al., 2018) and set a critical density to distinguish the structures that will collapse (critical) from the one in equilibrium (non-critical) (Kravtsov and Borgani, 2012) and create corresponding graphs for further study. This approach allows us the creation of four datasets that associate the indices of graphs in a critical state with the label “critical state” and those in a non-critical state with the label “non-critical state” (Figure 3).
FIGURE 3
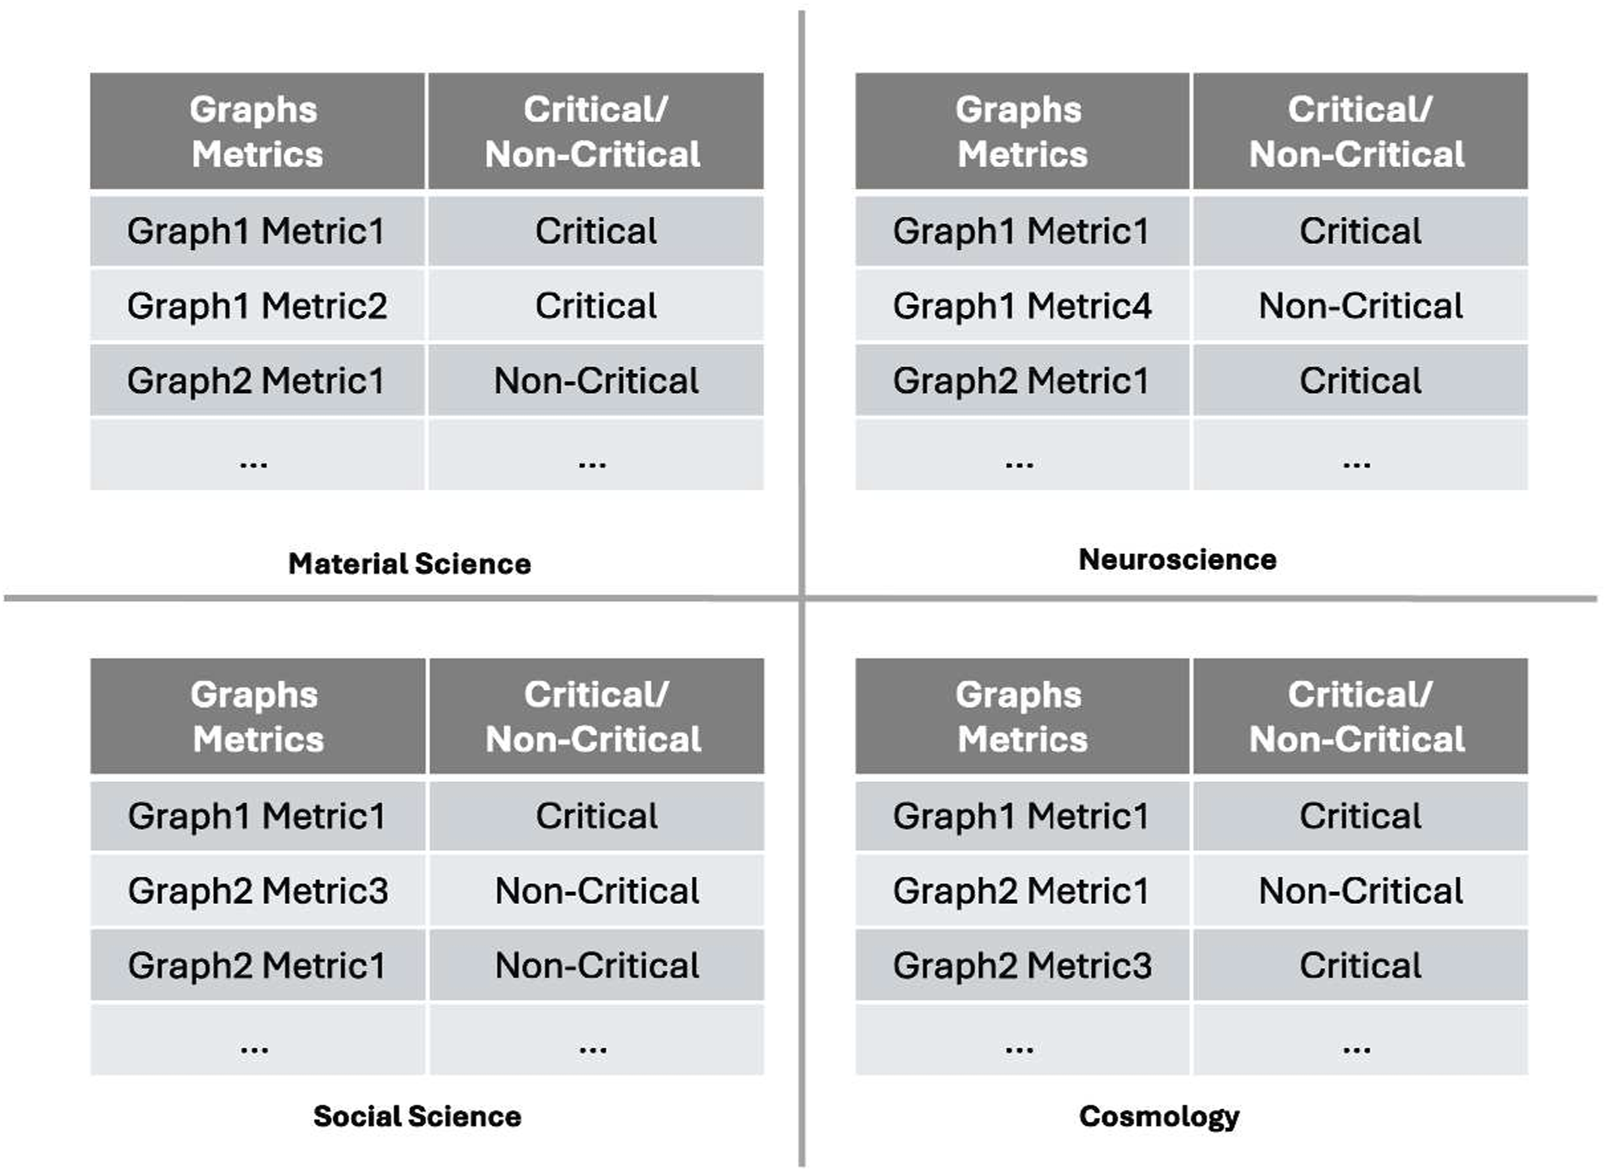
Datasets for training explainable machine learning using graph-based index values (graph metrics). These datasets link graph indices in a critical state to the label “Critical” and those in a non-critical state to the label “Non-Critical.” The thinner cross dividing the four domain datasets (compared to the thickness shown in Figure 2) highlights how the construction of these datasets represents a further step toward the potential convergence in the study of the four domains.
3.4 Step four: comparing criticality-related features across domains with explainable machine learning
It is possible to train XML classifiers with supervised learning to determine whether a system is in a critical or non-critical state based on the values of the graph indices. Explainable techniques can identify the most relevant features for each domain to establish the criticality of a system (Figure 4). Algorithms such as Extreme Gradient Boosting (XGBoost), known for its efficiency and accuracy in classification tasks, could be suitable for this purpose (Chen and Guestrin, 2016). SHAP (SHapley Additive exPlanations) values provide a robust and interpretable method for understanding feature importance, offering both global and local perspectives. While SHAP often provides a more complete picture, LIME (Local Interpretable Model-agnostic Explanations) is a valuable tool for specific use cases where its simplicity or particular visualization methods are preferred (Ribeiro et al., 2016; Lundberg and Lee, 2017).
FIGURE 4
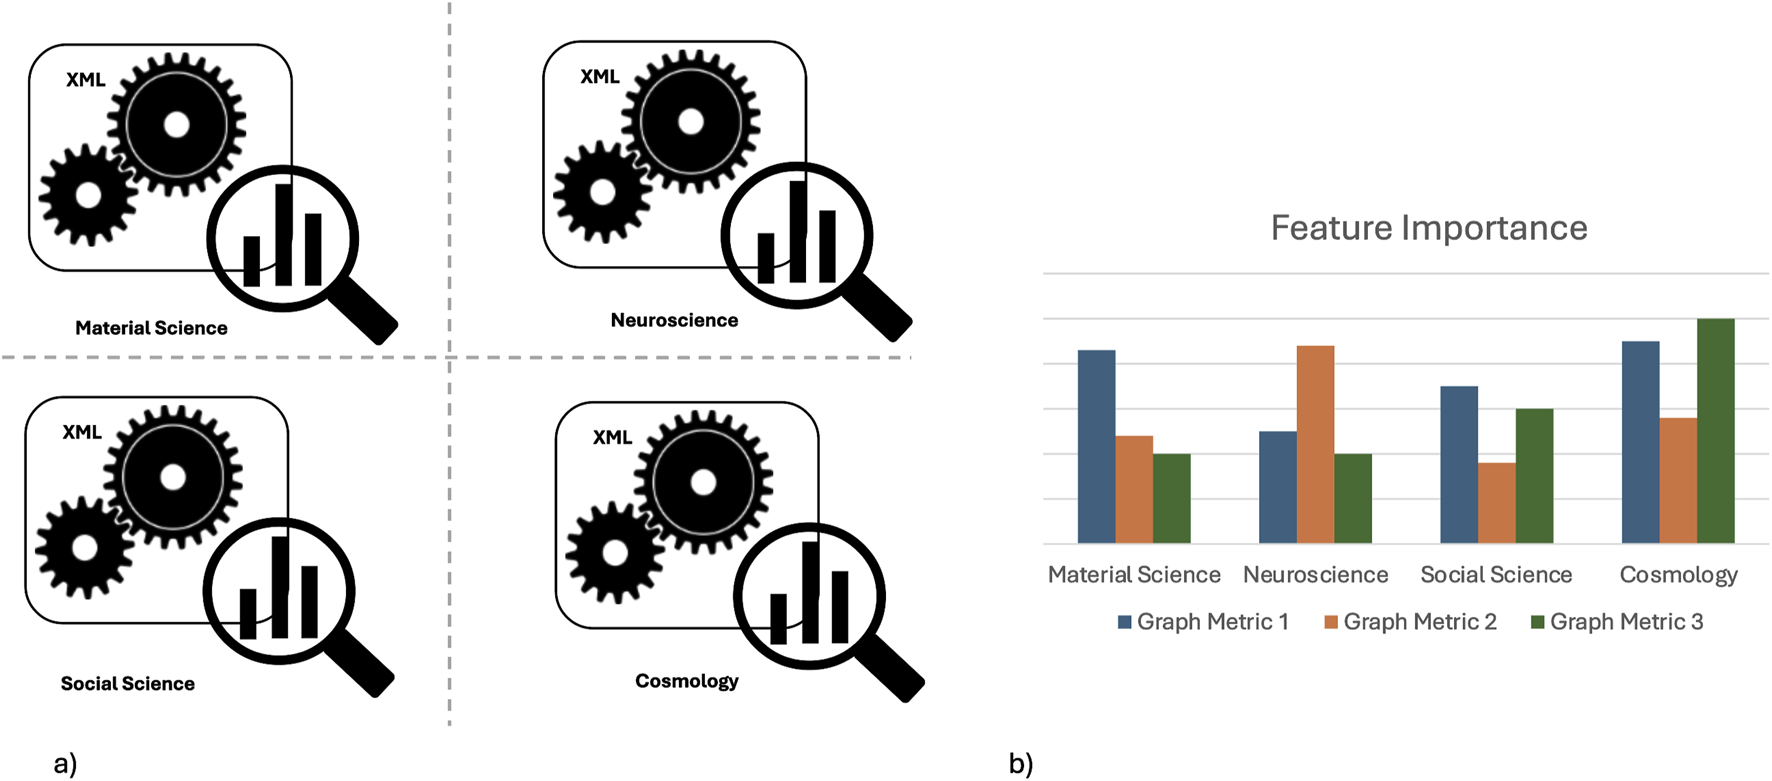
Comparing graph criticality-related features across domains with XML. In (a), four XML algorithms are applied to datasets obtained from Step Three, using graph-based index values (graph metrics) to train explainable models. The magnifying glass represents the use of explainable techniques like SHAP and LIME. The dashed cross dividing the four domains XML indicates how this step advances beyond Step Three, allowing comparisons across different domains. In (b), an hypothetical feature importance analysis highlights the graph metrics that are most critical for identifying key states across different domains. In the provided example, “Graph Metric 1” is assumed to be a significant feature for determining criticality in both material science and cosmology.
In materials science, XGBoost could classify graphs representing materials state as critical or non-critical, with SHAP identifying key structural features (e.g., atomic arrangement) that are most important in determining these states. LIME could further explain the model decisions for each sample, highlighting local arrangements of atoms or relevant variations of particular physical quantities that contribute to a non-critical state. In neuroscience, XGBoost could classify graph data from connectome analysis, with SHAP values identifying the most relevant neural connections (graph features) that differentiate between healthy (critical state) and diseased (non-critical state) individuals. LIME provides detailed, local explanations for model predictions, showing which connections most strongly influence the critical state for individual subjects. In social sciences, XGBoost could distinguish between stable (critical state) and crisis (non-critical state) communities using social interaction graphs. SHAP values could reveal the most influential interactions, such as connection density or the centrality of nodes, in determining criticality. LIME could provide detailed insights into model predictions, pinpointing specific social relationships that drive either stability or crisis in a community. In cosmology, data on the distribution of galaxies in extragalactic surveys, e.g., Euclid (Euclid Collaboration et al., 2024) could be used. XGBoost could analyze graph indices related to these distributions to classify observations as critical or equilibrium. SHAP values would identify the features of these fluctuations or distributions that most strongly indicate critical phenomena, such as the Big Bang or galaxy formation. LIME could further explain individual observations, highlighting which aspects of dark matter distributions significantly influence the critical vs non-critical classification.
In each of these examples, the use of XML tools provides deeper insights into the fundamental characteristics that define whether a state is critical or non-critical across various scientific domains. Importantly, this approach facilitates comparisons of the most significant features among different domains, helping to identify potential similarities.
In more detail, after identifying the most important graph metrics (features) for determining criticality across the four domains, it is possible to compare the results to identify possible similar dynamics that define when a system is in a critical or non-critical state (Figure 4b). This comparison can be done by studying feature correlations or analyzing causality. In the first approach, Correlational AI could identify statistical relationships between critical features across domains. However, correlation alone does not explain the direction or nature of these relationships. Causal AI goes beyond correlation to establish cause-and-effect links. Techniques such as causal inference and counterfactual reasoning clarify how changes in one variable directly impact another, providing deeper insights. These approaches complement each other. Correlational AI uncovers potential relationships, while Causal AI identifies the underlying causal mechanisms. This synergy proves valuable across domains, enabling the discovery of shared principles that drive criticality (Neuberg, 2003; Weinberg et al., 2024). For example, in neuroscience, Correlational AI might uncover relationships between neural connections and brain criticality, while in cosmology, it could reveal links between cosmic fluctuations and critical phenomena like structure formation. Causal AI can determine if similar causal mechanisms drive these transitions in both domains.
3.5 Step five: translating criticality insights from the neutral domain (graphs) to specific domains
This final step translates insights into the most important features for establishing criticality, derived from the neutral domain (graphs), into specific domains such as materials science, neuroscience, social sciences, and cosmology (orange arrows in Figure 1). By mapping key graph features to domain-specific elements, abstract criticality analysis results are transformed into practical interpretations, leading to actionable conclusions. For example, graph features like centrality and clustering coefficient correspond to specific properties in the original dataset. Centrality identifies key nodes – whether atoms in a crystal, neurons in a brain, people in a social network, or galaxies in a cosmic structure. The clustering coefficient reveals local interconnectedness, such as tightly bonded atoms, strongly connected neurons, close-knit social groups, or galaxy clusters. Mapping these graph metrics to domain-specific entities clarifies which metrics are critical for establishing domain-specific criticality. Linking these graph-based insights to domain-specific data bridges abstract analysis with real-world entities and their interactions. For example, if centrality is a key feature for determining criticality in neuroscience, neurons with high centrality may be crucial for cognitive processes, guiding interventions for neurodegenerative diseases. Similarly, if high connectivity between nodes is important for criticality in other domains, in materials science, central atoms with high connectivity may reveal key atomic bonds for material strength; in social sciences, individuals with high social centrality may be influential figures within a community; and in cosmology, central galaxies may offer insights into the gravitational dynamics of large-scale structures.
4 Computational feasibility and technical considerations
The practical implementation of the proposed methodology involves several key technical aspects that warrant detailed discussion, particularly regarding the selection of graph metrics, the scalability of XML models, and the computational cost of transfer learning across domains.
4.1 Selection criteria for graph metrics
Choosing appropriate graph metrics is fundamental for effective cross-domain analysis. To generate meaningful and comparable insights, the methodology emphasizes graph metrics that are interpretable and relevant across a broad range of disciplines—such as, in our case, materials science, neuroscience, social science, and cosmology—and suited to the specific phenomenon under investigation, which in our case is criticality. For example, key metrics could include clustering coefficient, average path length, degree distribution, and various centrality measures, all well supported by literature as markers of structural transitions near critical points (Jensen, 1998; Bigdeli et al., 2009; Gaur et al., 2019; Zimmern, 2020a; Ponti et al., 2021). Additional criteria guiding metric selection involve robustness to noise, the ability to discriminate between critical and non-critical states, computational efficiency on large-scale graphs, and empirical validation from previous studies within each domain. Furthermore, filtering out highly correlated metrics could improve XML performance while significantly reducing dataset dimensionality and computational overhead (see Section. 4.2). Expert knowledge plays a crucial role in the initial selection of metrics to ensure domain-specific relevance and scientific coherence. Applying these criteria ensures the approach preserves interpretability and reliability while supporting scalable analysis.
4.2 Scalability of graph and XML models
Scalability plays a critical role when dealing with a large collection of graphs, each potentially containing thousands of nodes and edges. To manage this complexity, the methodology relies on efficient graph processing techniques that allow reliable extraction of structural features without incurring excessive computational costs. Handling numerous or intricate graphs may require optimization methods such as batching, parallel execution, or selective feature computation, yet these demands generally remain within the capabilities of standard computing resources. On the XML side, the analysis operates on a compact set of graph-derived metrics, keeping the input dimensionality low. This focus enables interpretable and computationally efficient modeling, even across large or diverse datasets. To address issues of missing or unreliable data, the framework can incorporate imputation techniques and uncertainty quantification methods, enhancing robustness and ensuring more reliable model predictions in the presence of noise or incomplete information (Gupta and Gupta, 2019; Emmanuel et al., 2021).
4.3 Computational cost of transfer learning
Transfer learning facilitates knowledge sharing between domains by fine-tuning pre-trained models on target domain data, reducing the need for extensive retraining. The computational overhead depends largely on the similarity between source and target domains and the size of the datasets involved (Caccia et al., 2023). To manage costs, the methodology incorporates selective fine-tuning focused on key graph metrics identified through feature importance analysis, limiting training time while preserving cross-domain generalization. Additionally, domain adaptation techniques such as careful fine-tuning schedules and feature alignment help maintain the relevance of learned representations across domains with differing data distributions. Moreover, since the data is represented as graphs, the models can isolate and reuse specific structural patterns learned from one domain when analyzing another. This modular reuse means that instead of retraining the entire model from scratch, only relevant components or features require adjustment. Such an approach reduces computational effort and accelerates learning during adaptation to new domains, enhancing overall efficiency.
5 Exploiting cross-domain synergies
The proposed framework aims to generalize across disciplines, but a brief comparison with traditional methods used in each example domain helps clarify its distinct contribution. In materials science, conventional studies of phase transitions often rely on atomistic simulations—such as molecular dynamics or Monte Carlo methods—or thermodynamic models. While these offer high-fidelity representations, they are computationally intensive and tailored to specific physical systems (Tavenner et al., 2023; Łach, 2025). Abstracting material systems as interaction networks could enable the detection of structural patterns associated with critical behavior in a more generalizable and scalable form. Crucially, combining NS with XML could enhance this framework by providing not only predictive capabilities but also interpretability. XML models could identify which network features most influence phase behavior, offering insights that are both actionable and transferable across materials. This synergy could facilitate the development of lightweight, interpretable tools that complement traditional simulations while broadening the scope for cross-domain generalization. Brain activity is typically analyzed using statistical and signal processing techniques such as spectral analysis, dynamic causal modeling, or multivariate pattern analysis. While these methods yield valuable insights into specific neural processes, they seldom capture system-level organization or dynamics associated with criticality (Razi and Friston, 2016; Bahrami et al., 2023). The proposed approach shifts focus toward modeling brain function as a complex network, using graph-based features that characterize large-scale connectivity patterns. When combined with XML, this representation could enable interpretable analyses that highlight which structural properties most influence emergent neural behavior. This integrative methodology may support cross-domain generalization and contribute to identifying potential common principles underlying critical dynamics in both biological and artificial systems. Social systems are often explored through statistical models, agent-based simulations, or qualitative analysis. While NS has gained traction in this domain, its application typically remains confined to specific tasks such as community detection or information diffusion (Borgatti et al., 2009; Weisburd et al., 2024). The proposed framework takes a broader approach by leveraging generalizable graph features to enable structural comparisons across domains and identify shared patterns underlying complex social behaviors. By integrating NS with XML, the methodology may support predictive modeling while offering insights into which topological properties are most likely to influence system dynamics. This combination could enable interpretable and scalable analyses that extend beyond isolated use cases, potentially facilitating the identification of shared principles across social and other complex systems. Finally, large-scale simulations of the universe—such as N-body or lattice field models—serve as the standard tools for studying cosmic structure and phase transitions. These simulations are grounded in physical laws but do not typically support interpretability or cross-domain comparison (Bertschinger, 1998; Partmann et al., 2020). Representing cosmological systems as graphs may help identify structural markers (e.g., critical points) that resemble patterns observed in other complex systems. In addition, combining NS with XML could offer added interpretability and potential for generalization. While NS can highlight topological signatures of complex dynamics, XML techniques might help trace how specific features contribute to model predictions. This integrated approach may support hypothesis generation across domains and promote transparency—an important consideration when modeling phenomena as intricate and data-intensive as cosmology. From this comparative perspective, the proposed methodology has the potential to shift the focus from domain-specific optimization toward uncovering shared mechanisms—such as criticality—through unified NS representations and XML-based analysis.
This section highlights the potential benefits of identifying common principles across domains, which may enable transfer learning—a machine learning technique that adapts a model trained in one domain for use in a related one. This approach could potentially reduce training time and resource demands, especially when data is limited. For instance, recognizing critical states in cosmic systems with sparse data could be facilitated by first training a model on more accessible neuroscience data. Transfer learning would then adapt the model for application in cosmology, helping it detect critical states in less monitored systems.
Beyond this example, the proposed framework could provide a structured approach for identifying analogies between phenomena in seemingly unrelated fields. Detecting similar patterns of criticality through graph metrics—such as phase transitions in materials and neural activity in the brain—could help generate hypotheses about how structural features shape functional behavior across systems. These cross-domain parallels could potentially offer a foundation for designing interfaces that better align with the brain natural dynamics, enhancing both adaptability and performance. The key connection lies in the shared dynamics of criticality observed across domains, which could, for example, inform the design of neuroprosthetic devices by enhancing their timing and responsiveness. In this respect, studying how materials undergo phase transitions that alter electrical conductivity near critical points may support the development of biocompatible materials optimized for stable and efficient neural interfaces. Feature importance analysis can help identify the structural or functional properties that most influence criticality in both materials and neural networks. By manipulating these key features, it may become possible to modulate critical behavior in both systems, thereby enhancing the efficiency and stability of interactions between engineered materials and the brain, particularly near critical thresholds. Within this framework, causal AI could explore how properties like flexibility and biocompatibility influence neuroprosthetic integration near critical thresholds. Meanwhile, correlational AI could detect links between material microstructure and electrical performance, and in neuroscience, between material characteristics and neural tissue compatibility. Overall, these integrated insights could support the co-design of materials and devices tailored for reliable performance at key points of interaction. More broadly, the same approach could be extended to other domains—such as linking behavioral tipping points in society with neural state transitions, or comparing stress propagation in engineered structures with energy distribution during cosmological phase transitions—to leverage shared principles of criticality. This could enable a deeper understanding of how complex behaviors emerge and stabilize across fields.
6 Conclusion and future work
This paper explores an interdisciplinary, system-level approach that could potentially be used to uncover common principles across different scientific domains. As an example, the paper focuses on materials science, neuroscience, social science, and cosmology, with an emphasis on criticality. It combines NS and XML to propose a five-step method: gathering relational data, converting it into a neutral framework, building graph-based datasets, using XML to compare criticality across fields, and applying findings back to specific domains. This approach could potentially enable XML models to work in fields with limited data, such as applying neuroscience insights to detect critical states in cosmology.
In the future, extending explainability by incorporating rule-based and counterfactual-based explanations could enhance model interpretability, especially in complex domains (Guidotti et al., 2019a; Guidotti et al., 2021). This would broaden the scope beyond feature importance methods and shift towards a more comprehensive Explainable AI (XAI) framework, offering more intuitive and actionable insights, thus increasing transparency and trust across various applications (Samek et al., 2019; Guidotti et al., 2024). Additionally, exploring the integration of explainable machine learning (XML) techniques with graph-based neural networks—such as Graph Convolutional Networks and Graph Attention Networks—may offer valuable insights. Such a comparison could clarify trade-offs between interpretability and performance, and inform hybrid strategies that effectively balance explanatory depth with predictive accuracy (Khemani et al., 2024; Li et al., 2024).
By integrating NS and XML, the proposed framework offers a structured and interpretable approach for cross-domain analysis. While this study focused on four exemplary domains—materials science, neuroscience, social science, and cosmology—and on the phenomenon of criticality, the methodology is generalizable and designed to accommodate other scientific areas and complex phenomena. In particular, it can be extended to investigate additional emergent behaviors, such as synchronization, resilience, and adaptation, which are prevalent in many natural and artificial systems (Holland, 1992; Bar-Yam, 2002; Siegenfeld and Bar-Yam, 2020; Artime et al., 2024). Shared properties across domains—such as hierarchical organization, feedback loops, and nonlinear dynamics—give rise to complex behaviors including crystallization in materials, neural synchronization in the brain, and structure formation in the cosmos. Recognizing and systematically comparing these patterns through a unified analytical lens could drive breakthroughs not only in neurotechnology and materials science, but also in fields like ecology, epidemiology, and economics, ultimately fostering both theoretical insight and practical innovation through interdisciplinary collaboration. Future research will focus on implementing and testing the framework on real-world datasets (Strey et al., 2023; Failla et al., 2024; Ohana et al., 2024; The Multimodal Universe Collaboration et al., 2025; Batatia et al., 2025). Initial experiments on selected domain-specific data could provide evidence of practical performance and manageable computational requirements. However, quantitative benchmarking across diverse datasets, systematic performance evaluation, and scalability testing will be essential to validate the framework robustness and generalizability. For example, comparing the model ability to identify critical states against established benchmarks—such as known phase transition models in materials science or cosmological simulations—could help assess the scientific validity of the detected patterns. This next phase will be key to establishing the practical viability of the approach in applied scientific and engineering contexts.
Statements
Data availability statement
The original contributions presented in the study are included in the article/supplementary material, further inquiries can be directed to the corresponding author.
Author contributions
DC: Conceptualization, Formal Analysis, Investigation, Methodology, Project administration, Resources, Supervision, Validation, Visualization, Writing – original draft, Writing – review and editing. AM: Validation, Writing – review and editing. GR: Validation, Writing – review and editing. AB: Validation, Writing – review and editing. GF: Resources, Validation, Writing – review and editing.
Funding
The author(s) declare that financial support was received for the research and/or publication of this article. Funded by the European Union -Next Generation EU -NRRP M6C2 -Investment 2.1 Enhancement and strengthening of biomedical research in the NHS and by FISM -Fondazione Italiana Sclerosi Multiplacod. 2022/R-Multi/040 and financed or co-financed with the “5 per mille” public funding.
Conflict of interest
Author DC was employed by AI2Life s.r.l., Innovative Start-Up, ISTC-CNR Spin-Off.
The remaining authors declare that the research was conducted in the absence of any commercial or financial relationships that could be construed as a potential conflict of interest.
Generative AI statement
The author(s) declare that no Generative AI was used in the creation of this manuscript.
Publisher’s note
All claims expressed in this article are solely those of the authors and do not necessarily represent those of their affiliated organizations, or those of the publisher, the editors and the reviewers. Any product that may be evaluated in this article, or claim that may be made by its manufacturer, is not guaranteed or endorsed by the publisher.
References
1
Allegrini P. Paradisi P. Menicucci D. Laurino M. Piarulli A. Gemignani A. (2015). Self-organized dynamical complexity in human wakefulness and sleep: different critical brain-activity feedback for conscious and unconscious states. Phys. Rev. E. Stat. Nonlin. Soft. Matter. Phys.92, 032808. 10.1103/physreve.92.032808
2
Amendola L. Appleby S. Avgoustidis A. Bacon D. Baker T. Baldi M. et al (2018). Cosmology and fundamental physics with the Euclid satellite. Living Rev. Relativ.21, 2. 10.1007/s41114-017-0010-3
3
Angelini G. Malvaso A. Schirripa A. Campione F. D’Addario S. L. Toschi N. et al (2024). Unraveling sex differences in Parkinson’s disease through explainable machine learning. J. Neurological Sci.462, 123091. 10.1016/j.jns.2024.123091
4
Annett J. (2004). Superconductivity, superfluids and condensates. In: Oxford Master Series in Physics. Oxford, England: OUP Oxford.
5
Aroboto B. Chen S. Hsu T. Wood B. C. Jiao Y. Chapman J. (2023). Universal and interpretable classification of atomistic structural transitions via unsupervised graph learning. Appl. Phys. Lett.123, 094103. 10.1063/5.0156682
6
Artime O. Grassia M. De Domenico M. Gleeson J. P. Makse H. A. Mangioni G. et al (2024). Robustness and resilience of complex networks. Nat. Rev. Phys.6, 114–131. 10.1038/s42254-023-00676-y
7
Bahrami M. Laurienti P. J. Shappell H. M. Simpson S. L. (2023). Brain network analysis: a review on multivariate analytical methods. Brain. Connect.13, 64–79. 10.1089/brain.2022.0007
8
Barabási A. L. (2009). Scale-free networks: a decade and beyond. Science325, 412–413. 10.1126/science.1173299
9
Barrow J. D. Scherrer R. J. (2018). Constraining density fluctuations with big bang nucleosynthesis in the era of precision cosmology. Phys. Rev. D.98, 043534. 10.1103/physrevd.98.043534
10
Bar-Yam Y. (2002). General features of complex systems. Knowl. Manag. Organ. Intell. Learn. Complex.1, 43–95.
11
Batatia I. Batzner S. Kovács D. P. Musaelian A. Simm G. N. C. Drautz R. et al (2025). The design space of e(3)-equivariant atom-centred interatomic potentials. Nat. Mach. Intell.7, 56–67.
12
Batzner S. Musaelian A. Sun L. Geiger M. Mailoa J. P. Kornbluth M. et al (2022). E(3)-equivariant graph neural networks for data-efficient and accurate interatomic potentials. Nat. Commun.13, 2453. 10.1038/s41467-022-29939-5
13
Beggs J. M. (2008). The criticality hypothesis: how local cortical networks might optimize information processing. Phil. Trans. R. Soc. A.366, 329–343. 10.1098/rsta.2007.2092
14
Beggs J. M. Plenz D. (2003). Neuronal avalanches in neocortical circuits. J. Neurosci.23, 11167–11177. 10.1523/jneurosci.23-35-11167.2003
15
Bertschinger E. (1998). Simulations of structure formation in the universe. Annu. Rev. Astronomy Astrophysics36, 599–654. 10.1146/annurev.astro.36.1.599
16
Bigdeli A. Tizghadam A. Leon-Garcia A. (2009). Comparison of network criticality, algebraic connectivity, and other graph metrics. In: Proceedings of the 1st annual workshop on simplifying complex network for practitioners; 2009 July 01; Venice, Italy. New York, NY: Association for Computing Machinery. p. 1–6.
17
Boccaletti S. Latora V. Moreno Y. Chavez M. Hwang D. U. (2006). Complex networks: structure and dynamics. Phys. Rep.424, 175–308. 10.1016/j.physrep.2005.10.009
18
Bodria F. Giannotti F. Guidotti R. Naretto F. Pedreschi D. Rinzivillo S. (2023). Benchmarking and survey of explanation methods for black box models. Data Min. Knowl. Discov.37, 1719–1778. 10.1007/s10618-023-00933-9
19
Bonabeau E. (2002). Agent-based modeling: methods and techniques for simulating human systems. Proc. Natl. Acad. Sci.99, 7280–7287. 10.1073/pnas.082080899
20
Bore S. L. Paesani F. (2023). Realistic phase diagram of water from “first principles” data-driven quantum simulations. Nat. Commun.14, 3349. 10.1038/s41467-023-38855-1
21
Borgatti S. P. Mehra A. Brass D. J. Labianca G. (2009). Network analysis in the social sciences. science323, 892–895. 10.1126/science.1165821
22
Caccia M. Galashov A. Douillard A. Rannen-Triki A. Rao D. Paganini M. et al (2023). Towards compute-optimal transfer learning. New York, NY: Cornell University. arXiv preprint arXiv:2304.13164.
23
Chen T. Guestrin C. (2016). Xgboost: a scalable tree boosting system. In: Proceedings of the 22nd ACM SIGKDD international conference on knowledge discovery and data mining; 2016 August 13–17; San Francisco, California. New York, NY: Association for Computing Machinery. p. 785–794.
24
Cheng B. Engel E. A. Behler J. Dellago C. Ceriotti M. (2019). Ab initio thermodynamics of liquid and solid water. Proc. Natl. Acad. Sci.116, 1110–1115. 10.1073/pnas.1815117116
25
Chialvo D. R. (2010). Emergent complex neural dynamics. Nat. Phys.6, 744–750. 10.1038/nphys1803
26
Choudhary K. DeCost B. (2021). Atomistic line graph neural network for improved materials property predictions. npj Comput. Mater.7, 185. 10.1038/s41524-021-00650-1
27
Contucci P. Gallo I. Menconi G. (2008). Phase transitions in social sciences: two-population mean field theory. Int. J. Mod. Phys. B22, 2199–2212. 10.1142/s0217979208039423
28
D’Amore F. M. Moscatelli M. Malvaso A. D’Antonio F. Rodini M. Panigutti M. et al (2025). Explainable machine learning on clinical features to predict and differentiate alzheimer’s progression by sex: toward a clinician-tailored web interface. J. Neurological Sci.468, 123361. 10.1016/j.jns.2024.123361
29
Das R. Soylu M. (2023). A key review on graph data science: the power of graphs in scientific studies. Chemom. Intelligent. Laboratory. Syst.240, 104896. 10.1016/j.chemolab.2023.104896
30
Denning P. J. (2017). Computational thinking in science. Am. Sci.105, 13–17. 10.1511/2017.124.13
31
Dorogovtsev S. N. Goltsev A. V. Mendes J. F. (2008). Critical phenomena in complex networks. Rev. Mod. Phys.80, 1275–1335. 10.1103/revmodphys.80.1275
32
Emmanuel T. Maupong T. Mpoeleng D. Semong T. Mphago B. Tabona O. (2021). A survey on missing data in machine learning. J. Big data8, 140–37. 10.1186/s40537-021-00516-9
33
Estrada E. (2024). What is a complex system, after all?Found. Sci.29, 1143–1170. 10.1007/s10699-023-09917-w
34
Euclid Collaboration Mellier Y. Abdurro'uf C. Acevedo Barroso J. A. Achúcarro A. Adamek J. et al (2024). Euclid. I. Overview of the euclid mission. New York, NY: Cornell University. arXiv e-prints. 10.48550/arXiv.2405.13491
35
Failla A. Cazabet R. Rossetti G. Citraro S. (2024). Describing group evolution in temporal data using multi-faceted events. Mach. Learn.113, 7591–7615. 10.1007/s10994-024-06600-4
36
Flores-Livas J. A. Boeri L. Sanna A. Profeta G. Arita R. Eremets M. (2020). A perspective on conventional high-temperature superconductors at high pressure: methods and materials. Phys. Rep.856, 1–78. 10.1016/j.physrep.2020.02.003
37
Friedman N. Koller D. (2003). Being bayesian about network structure. a bayesian approach to structure discovery in bayesian networks. Mach. Learn.50, 95–125. 10.1023/a:1020249912095
38
Fu T.-c. (2011). A review on time series data mining. Eng. Appl. Artif. Intell.24, 164–181. 10.1016/j.engappai.2010.09.007
39
Fukami T. Nakajima M. (2011). Community assembly: alternative stable states or alternative transient states?Ecol. Lett.14, 973–984. 10.1111/j.1461-0248.2011.01663.x
40
Fultz B. (2020). Phase transitions in materials. 2 edn. Cambridge, England: Cambridge University Press.
41
Gaur V. Yadav O. P. Soni G. Rathore A. P. S. (2019). A review of metrics, algorithms and methodologies for network reliability. In: 2019 IEEE international conference on industrial engineering and engineering management (IEEM); 2019 December 15–18. Manhattan, NY: IEEE. p. 1129–1133.
42
Greenacre M. Groenen P. J. Hastie T. D’Enza A. I. Markos A. Tuzhilina E. (2022). Principal component analysis. Nat. Rev. Methods Prim.2, 100. 10.1038/s43586-022-00184-w
43
Guardo G. Greco V. Ruggieri M. (2014). Energy density fluctuations in early universe. Melville, NY: AIP Conference Proceedings, Vol. 1595. p. 224–227. 10.1063/1.4875317
44
Guidotti R. Monreale A. Giannotti F. Pedreschi D. Ruggieri S. Turini F. (2019a). Factual and counterfactual explanations for black box decision making. IEEE Intell. Syst.34, 14–23. 10.1109/mis.2019.2957223
45
Guidotti R. Monreale A. Pedreschi D. Giannotti F. (2021). Principles of explainable artificial intelligence. Cham, Switzerland: Springer. 10.1007/978-3-030-76409-8_2
46
Guidotti R. Monreale A. Ruggieri S. Naretto F. Turini F. Pedreschi D. et al (2024). Stable and actionable explanations of black-box models through factual and counterfactual rules. Data Min. Knowl. Discov.38, 2825–2862. 10.1007/s10618-022-00878-5
47
Guidotti R. Monreale A. Ruggieri S. Turini F. Giannotti F. Pedreschi D. (2019b). A survey of methods for explaining black box models. ACM Comput. Surv.51 (93), 1–42. 10.1145/3236009
48
Gupta S. Gupta A. (2019). Dealing with noise problem in machine learning data-sets: a systematic review. Procedia Comput. Sci.161, 466–474. 10.1016/j.procs.2019.11.146
49
Hawking S. W. (2006). The theory of everything: the origin and fate of the universe. London, UK: New Millennium Press.
50
Hegedűs D. Grolmusz V. (2025). The length and the width of the human brain circuit connections are strongly correlated. Cogn. Neurodynamics19, 21. 10.1007/s11571-024-10201-1
51
Holland J. H. (1992). Adaptation in natural and artificial systems: an introductory analysis with applications to biology. In: Control, and artificial intelligence. Cambridge, Massachusetts: MIT press.
52
Holland J. H. (1995). Hidden order: how adaptation builds complexity. Boston, Massachusetts: Addison Wesley.
53
Huang W. Li J. Edwards P. P. (2018). Mesoscience: exploring the common principle at mesoscales. Natl. Sci. Rev.5, 321–326. 10.1093/nsr/nwx083
54
Iñiguez G. Battiston F. Karsai M. (2020). Bridging the gap between graphs and networks. Commun. Phys.3, 88. 10.1038/s42005-020-0359-6
55
Islam M. R. Ahmed M. U. Barua S. Begum S. (2022). A systematic review of explainable artificial intelligence in terms of different application domains and tasks. Appl. Sci.12, 1353. 10.3390/app12031353
56
Jensen H. J. (1998). Self-organized criticality: emergent complex behavior in physical and biological systems. Cambridge, England: Cambridge University Press, Vol. 10.
57
Khemani B. Patil S. Kotecha K. Tanwar S. (2024). A review of graph neural networks: concepts, architectures, techniques, challenges, datasets, applications, and future directions. J. Big. Data.11, 18. 10.1186/s40537-023-00876-4
58
Khetani V. Gandhi Y. Bhattacharya S. Ajani S. N. Limkar S. (2023). Cross-domain analysis of ml and dl: evaluating their impact in diverse domains. Int. J. Intelligent Syst. Appl. Eng.11, 253–262.
59
Kirk G. S. Raven J. E. Schofield M. (1983). The presocratic philosophers: a critical history with a selection of texts. Cambridge, England: Cambridge University Press.
60
Koller D. Friedman N. (2009). Probabilistic graphical models: principles and techniques. Cambridge, Massachusetts: MIT press.
61
Kravtsov A. V. Borgani S. (2012). Formation of galaxy clusters. Annu. Rev. Astronomy Astrophysics. Form. Galaxy Clust.50, 353–409. 10.1146/annurev-astro-081811-125502
62
Łach Ł. (2025). Phase stability and transitions in high-entropy alloys: insights from lattice gas models, computational simulations, and experimental validation. Entropy27, 464. 10.3390/e27050464
63
Ladyman J. Lambert J. Wiesner K. (2013). What is a complex system?Eur. J. Philosophy Sci.3, 33–67. 10.1007/s13194-012-0056-8
64
Levy M. (2005). Social phase transitions. J. Econ. Behav. and Organ.57, 71–87. 10.1016/j.jebo.2003.11.013
65
Li H. Han Z. Sun Y. Wang F. Hu P. Gao Y. et al (2024). Cgmega: explainable graph neural network framework with attention mechanisms for cancer gene module dissection. Nat. Commun.15, 5997. 10.1038/s41467-024-50426-6
66
Linardatos P. Papastefanopoulos V. Kotsiantis S. (2020). Explainable ai: a review of machine learning interpretability methods. Entropy23, 18. 10.3390/e23010018
67
Longo L. Brcic M. Cabitza F. Choi J. Confalonieri R. Ser J. D. et al (2024). Explainable artificial intelligence (xai) 2.0: a manifesto of open challenges and interdisciplinary research directions. Inf. Fusion106, 102301. 10.1016/j.inffus.2024.102301
68
Lundberg S. M. Lee S.-I. (2017). A unified approach to interpreting model predictions. In: Proceedings of the 31st international conference on neural information processing systems; 2017 December 4–9; Long Beach, California. Red Hook, NY: Curran Associates Inc, Vol. 30.
69
Milo R. Shen-Orr S. Itzkovitz S. Kashtan N. Chklovskii D. Alon U. (2002). Network motifs: simple building blocks of complex networks. Science298, 824–827. 10.1126/science.298.5594.824
70
Mitchell M. (2009). Complexity: a guided tour. Oxford, England: Oxford University Press.
71
Mrdjenovich D. Horton M. K. Montoya J. H. Legaspi C. M. Dwaraknath S. Tshitoyan V. et al (2020). Propnet: a knowledge graph for materials science. Matter2, 464–480. 10.1016/j.matt.2019.11.013
72
Neuberg L. G. (2003). Causality: models, reasoning, and inference, by judea pearl, cambridge university press, 2000. Econ. Theory19, 675–685. 10.1017/s0266466603004109
73
Nishimori H. Ortiz G. (2011). Elements of phase transitions and critical phenomena. Oxford, England: Oxford University Press.
74
Ohana R. McCabe M. Meyer L. T. Morel R. Agocs F. J. Beneitez M. et al (2024). The well: a large-scale collection of diverse physics simulations for machine learning. In: The thirty-eight conference on neural information processing systems datasets and benchmarks track; 2024 December 10–15; Vancouver BC Canada. Red Hook, NY: Curran Associates Inc.
75
Pan S. J. Yang Q. (2010). A survey on transfer learning. IEEE Trans. Knowl. Data Eng.22, 1345–1359. 10.1109/TKDE.2009.191
76
Parisi G. (1999). Complex systems: a physicist’s viewpoint. Phys. A Stat. Mech. its Appl.263, 557–564. 10.1016/S0378-4371(98)00524-X
77
Parisi G. Procaccia I. Rainone C. Singh M. (2017). Shear bands as manifestation of a criticality in yielding amorphous solids, Proc. Natl. Acad. Sci. U. S. A.114, 5577–5582. 10.1073/pnas.1700075114
78
Partmann C. Fidler C. Rampf C. Hahn O. (2020). Fast simulations of cosmic large-scale structure with massive neutrinos. J. Cosmol. Astropart. Phys.2020, 018. 10.1088/1475-7516/2020/09/018
79
Patel A. C. Sinha S. Palermo G. (2024). Graph theory approaches for molecular dynamics simulations. Q. Rev. Biophysics57, e15. 10.1017/S0033583524000143
80
Petrucci R. Herring F. Madura J. Bissonnette C. (2017). General chemistry: principles and modern applications. London, UK: Pearson Education.
81
Ponti A. Candelieri A. Giordani I. Archetti F. (2021). Probabilistic measures of edge criticality in graphs: a study in water distribution networks. Appl. Netw. Sci.6, 81. 10.1007/s41109-021-00427-x
82
Pósfai M. Barabási A. L. (2016). Network science. Cambridge, England: Cambridge University Press.
83
Razi A. Friston K. J. (2016). The connected brain: causality, models, and intrinsic dynamics. IEEE Signal Process. Mag.33, 14–35. 10.1109/msp.2015.2482121
84
Ribeiro M. T. Singh S. Guestrin C. (2016). “why should i trust you?”: explaining the predictions of any classifier. In Proceedings of the 22nd ACM SIGKDD international conference on knowledge discovery and data mining. New York, NY: Association for Computing Machinery. p. 1135–1144.
85
Rosato V. Issacharoff L. Meloni S. Caligiore D. Tiriticco F. (2008). Is the topology of the internet network really fit to sustain its function?Phys. A Stat. Mech. its Appl.387, 1689–1704. 10.1016/j.physa.2007.10.065
86
Rossetti G. Cazabet R. (2018). Community discovery in dynamic networks: a survey. ACM Comput. Surv. (CSUR)51, 1–37. 10.1145/3172867
87
Samek W. Wiegand T. Müller K.-R. (2019). Explainable AI: interpreting, explaining and visualizing deep learning. Cham, Switzerland: Springer.
88
Shi J. Kirihara K. Tada M. Fujioka M. Usui K. Koshiyama D. et al (2021). Criticality in the healthy brain. Front. Netw. Physiology1, 755685. 10.3389/fnetp.2021.755685
89
Shi X. Zhou L. Huang Y. Wu Y. Hong Z. (2024). A review on the applications of graph neural networks in materials science at the atomic scale. Mater. Genome Eng. Adv.2, e50. 10.1002/mgea.50
90
Siegenfeld A. F. Bar-Yam Y. (2020). An introduction to complex systems science and its applications. Complexity2020, 1–16. 10.1155/2020/6105872
91
Sporns O. (2011). The human connectome: a complex network. Ann. N. Y. Acad. Sci.1224, 109–125. 10.1111/j.1749-6632.2010.05888.x
92
Stanley H. E. (1971). Introduction to phase transitions and critical phenomena. In: International series of monographs on physics. Oxford, England: Oxford University Press.
93
Strey S.-G. Castronovo A. Elumalai K. (2023). Graph theoretic approach identifies critical thresholds at which galaxy filamentary structures form. New York, NY: Cornell University. arXiv preprint arXiv:2310.20184
94
Tavenner J. P. Mendelev M. I. Lawson J. W. (2023). Molecular dynamics based kinetic Monte Carlo simulation for accelerated diffusion. Comput. Mater. Sci.218, 111929. 10.1016/j.commatsci.2022.111929
95
The Multimodal Universe Collaboration Angeloudi E. Audenaert J. Bowles M. Boyd B. M. Chemaly D. (2025). Multimodal universe: enabling large-scale machine learning with 100tbs of astronomical scientific data. New York, NY: Cornell University. Available online at: https://github.com/MultimodalUniverse/MultimodalUniverse.
96
Tinkham M. (2004). Introduction to superconductivity. Mineola, New York: Dover Books on Physics Series (Dover Publications.
97
Vazza F. Feletti A. (2020). The quantitative comparison between the neuronal network and the cosmic web. Front. Phys.8, 525731. 10.3389/fphy.2020.525731
98
Weinberg A. I. Premebida C. Faria D. R. (2024). Causality from bottom to top: a survey. New York, NY: Cornell University. arXiv preprint arXiv:2403.11219
99
Weisburd D. Wolfowicz M. Hasisi B. Paolucci M. Andrighetto G. (2024). Using agent based modelling to advance evaluation research in radicalization and recruitment to terrorism: prospects and problems. Stud. Confl. Terror., 1–24. 10.1080/1057610x.2024.2361956
100
Weiss K. Khoshgoftaar T. M. Wang D. (2016). A survey of transfer learning. J. Big Data3, 9–40. 10.1186/s40537-016-0043-6
101
Wilson E. O. (1999). Consilience: the unity of knowledge. NewYork,NY: Vintage, Vol. 31.
102
Zhou J. Li G.-X. (2025). Evolution of molecular clouds on galaxy-cloud scale revealed by gravitational network analysis: high-mass clouds may deplete nearby gas via accretion or merging. Mon. Notices R. Astronomical Soc.537, 2630–2634. 10.1093/mnras/staf199
103
Zimmern V. (2020a). Why brain criticality is clinically relevant: a scoping review. Front. Neural Circuits14, 54. 10.3389/fncir.2020.00054
104
Zorzo A. F. Motta C. L. R. D. Ribeiro L. Granville L. Z. (2024). Computing everywhere, for everyone, at any level. Commun. ACM67, 80–82. 10.1145/3653308
Summary
Keywords
artificial intelligence, complex systems, criticality, cross-domain knowledge transfer, interdisciplinary approaches to complex systems, phase transitions, shared principles across scientific disciplines, theory of everything
Citation
Caligiore D, Monreale A, Rossetti G, Bongiorno A and Fisicaro G (2025) Exploring interconnections among atoms, brain, society, and cosmos with network science and explainable machine learning. Front. Complex Syst. 3:1604132. doi: 10.3389/fcpxs.2025.1604132
Received
01 April 2025
Accepted
18 June 2025
Published
30 June 2025
Volume
3 - 2025
Edited by
Panos Argyrakis, Aristotle University of Thessaloniki, Greece
Reviewed by
Sabina Rossi, Ca’ Foscari University of Venice, Italy
Ioannis P. Antoniades, Aristotle University of Thessaloniki, Greece
Updates
Copyright
© 2025 Caligiore, Monreale, Rossetti, Bongiorno and Fisicaro.
This is an open-access article distributed under the terms of the Creative Commons Attribution License (CC BY). The use, distribution or reproduction in other forums is permitted, provided the original author(s) and the copyright owner(s) are credited and that the original publication in this journal is cited, in accordance with accepted academic practice. No use, distribution or reproduction is permitted which does not comply with these terms.
*Correspondence: Daniele Caligiore, daniele.caligiore@istc.cnr.it
Disclaimer
All claims expressed in this article are solely those of the authors and do not necessarily represent those of their affiliated organizations, or those of the publisher, the editors and the reviewers. Any product that may be evaluated in this article or claim that may be made by its manufacturer is not guaranteed or endorsed by the publisher.