 Clemens Ehm
 Dietmar Stephan
- Department of Civil Engineering, Building Materials and Construction Chemistry, Technische Universität Berlin, Berlin, Germany
Fluorescent tubes, a continuous source of UVA radiation, are increasingly being replaced by ultraviolet light-emitting diodes (UV LEDs or UVEDs), which emit an almost discrete spectrum (5 nm bandwidth). This creates both problems and opportunities from a photocatalytic point of view. In this paper, we report the influence of UVED radiation on the performance of an industrially produced TiO2 photocatalytic coating by measuring the degradation of nitrogen oxide (NO) and toluene (C6H5CH3) from a test atmosphere in a laboratory test setup. The influence of four commercially available UVED types (365 nm, 385 nm, 395 nm, and 415 nm) on the performance of a commonly used photocatalyst was compared. In a subsequent investigation, we switched from continuous to pulse-modulated LED operation and investigated its influence on the photocatalytic activity of the assembly. We could show that UVEDs are suitable replacements for fluorescent lamps when carefully chosen to the absorption spectrum of the used photocatalyst. In addition, the pulse width and pulse frequency modulation of the LED current show non-linear correlations with the resulting photocatalytic activity. The activity remains unexpectedly high with short pulse widths and low frequencies. By adjusting the control of the UVEDs accordingly, much energy can thus be saved during operation without reducing the catalytic activity.
1 Introduction
Photocatalysts are semiconductor materials that convert electromagnetic radiation into chemically usable energy. In the case of Anatase Titanium Dioxide (TiO2) used in this paper, UVA photons above the energy of 3.2 eV cause an electron-hole pair, leading to chemical oxidative or reductive reaction cascades (Zhu and Wang, 2017). A widely researched application of the chemical energy provided by this effect is the degradation of airborne pollutants of organic and inorganic nature (Venkata Laxma Reddy et al., 2011). As test gases for degradation experiments, toluene (C6H5CH3) and nitric (II) oxide (NO) are determined in the considerations of this paper. Both toluene and NO are common air pollutants that can have biogenic origins but are emitted mainly by anthropogenic sources at concerning levels (Rasmussen and Khalil, 1983; Tian et al., 2020).
Outdoors, the UVA fraction of the solar radiation supplies enough photons in the absorption spectrum of TiO2 to drive photocatalytic reactions (Park et al., 2022). Indoors or specifically inside photocatalytic reactors, an artificial source of UVA photons is needed (Zaleska et al., 2010). For a long time, fluorescent tubes were used to supply the required UVA irradiation (Deutsches Institut für Normung, 2018). Due to law regulations on mercury lamps in the EU and other nations and a steady price drop in ultraviolet emitting diodes (UVEDs) with wavelengths in the UVA range, fluorescent tube emitters vanish more and more from the European market and get replaced by LEDs (Office P. VERORDNUNG, 2008). As the fluorescent tubes will soon no longer be available, photocatalysis projects must switch to UVED as irradiation sources (Muramoto et al., 2014; Mittal et al., 2019; Luo et al., 2020).
Other studies have shown that both emitter types can achieve an equally strong photocatalytic effect while emitting a comparable number of photons (Tokode et al., 2015). The electrical equipment for the operation of UVEDs and fluorescent lamps differs fundamentally. Fluorescent lamps are primarily driven with an inductive choke on AC mains voltage; UVEDs use an electronically controlled direct current (Kuo et al., 2016). The electronic to control the UVED current can also be used to reduce the radiation output with pulse width modulation (PWM) (Sun et al., 2012). PWM uses a sudden switch between the on-state (photon emission) and off-state (no photon emission) of the LED, whereas the pulse width describes how a single PWM time is split between the on-state and off-state. With pulse width dimming, both the pulse width and the frequency can be varied. The latter can be varied while keeping the pulse width constant at 50/50 on/off, called pulse frequency modulation (PFM). An exemplary illustration of a PWM and PFM modulated current can be found in Figure 1. From a chemical point of view, the question is what influence the period of PWM and frequency of PFM have on photocatalytic efficiency. It is conceivable that the reaction cascades triggered by photocatalysis under periodic UV illumination exhibit desirable turnover rates. This could save energy and provide a simple way to optimize the process by introducing PWM or PFM as regulation variables.
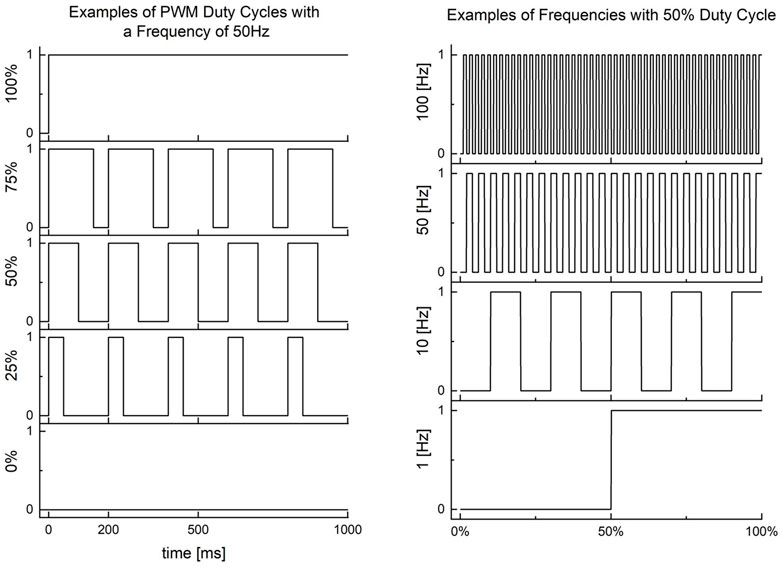
FIGURE 1. Illustraion of PFM and PWM modulation.
While fluorescent tubes produce a broad spectrum of UVA-frequencies with a continuous photon flow, UVEDs emit a narrow bandwidth of about 5 nm peak width at half-height with a photon emission flow limited to the on-state sections of the PWM. Furthermore, the emission frequency of the UVEDs can be precisely controlled during production. Several UVEDs irradiating in the UVA spectrum are available on the market. The absorption of a common TiO2 photocatalyst, as can be seen in Figure 11, hits a maximum between 370 and 300 nm; therefore, matching UVEDs have to be selected. For this paper, we tested four UVED types with emission spectra of 365 nm, 385 nm, 395 nm and 415 nm in the UVA area.
To avoid hindering the photocatalytic reaction by the formation of a diffusion layer on the catalyst surface, a permeable foam material was used as a support matrix for the photocatalyst, providing both a considerable reduction of the diffusion layers width by the induction of turbulent flow and a significant increase of the reaction surface per volume unit. The test atmosphere flowed through the foam material, which was irradiated from one side.
Other studies have already worked on the operation of LEDs with and without PWM and PFM methods in photocatalysis. In contrast to our study, pure photocatalysts were considered here (Hou and Ku, 2013). In addition, high-frequency modulation was particularly interesting since reaction rates in denser environments such as aqueous solutions are much higher than in atmospheric conditions (Dai et al., 2013; Korovin et al., 2015; Tokode et al., 2016; Dilissen et al., 2019; Liang et al., 2019).
2 Materials and methods
2.1 Foam carrier with TiO2 photocatalyst coating
TiO2 is a widely used white pigment. For past decades, its photocatalytic properties were considered undesirable as they can cause a degradation of the paint matrix and other color pigments, limiting use time and resilience. Nowadays, the potential of oxides to degrade organic and inorganic pollutants has been investigated by many studies, seeking suitable carrier matrices and use cases. This study uses an acrylic foam of 3 cm thickness and a pore density of five pores per inch (ppi) as carrier material. The photocatalyst is applied by dip coating the foam and then drying. The coating used for the measurements, named LR160/3, is an Acrylic/silicone resin combination with KronoClean 7000 as the photocatalytically active component. In laboratory tests according to ISO 22197-1 (DIN Normenausschuss Materialprüfung, 2018) and ISO 22197-3 (ISO, 2019), deposition rates of up to 4.4 cm/s for NO and 0.5 cm/s for toluene could be observed. It was developed and tested for high stability and high degradation rates in laboratory tests in a project called PhRIschluft, funded by the German Federal Ministry for Economic Affairs and Climate Action.
After long-term stability tests by weathering for more than 12 months, the material combination showed ongoing high photocatalytic deposition rates. The coated and uncoated foam is shown in Figure 2. For additional information about the coating, please see the Final Report of the project (Licht et al., 2021) and the publications on the coating, which are being created at the moment.
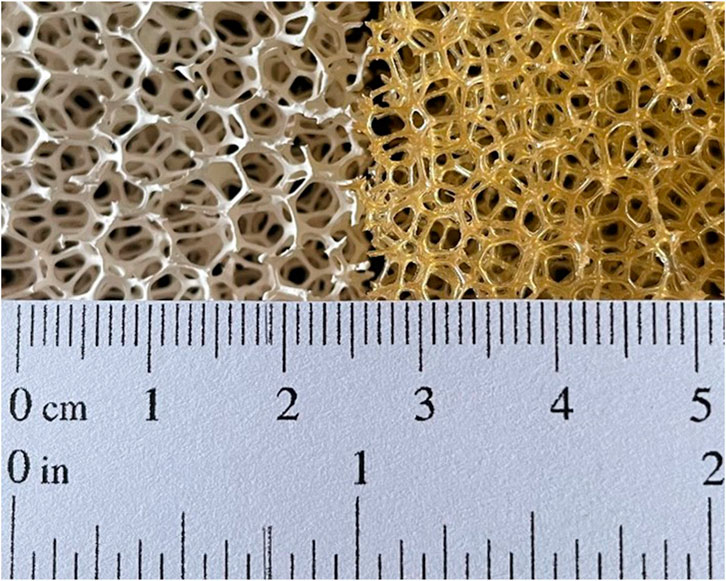
FIGURE 2. Samples of the used foam coated (left) and uncoated (right).
2.2 Measurement equipment
The reactor, shown in Figure 3 used to determine photocatalytic activity in this study is designed to test permeable materials (see Figure 2). It is encapsulated to prevent any radiation from the surroundings from entering the reaction chamber to keep environmental influences out. The setup enables the user to control the PWM, PFM, toluene and NO inlet concentrations and the volume flow rate. The experimental parameters were set as shown in Table 1.

FIGURE 3. Picture of the Foam Reactor with attached Supply Tubes and Electronics for Ambient Sensors and Irradiation.
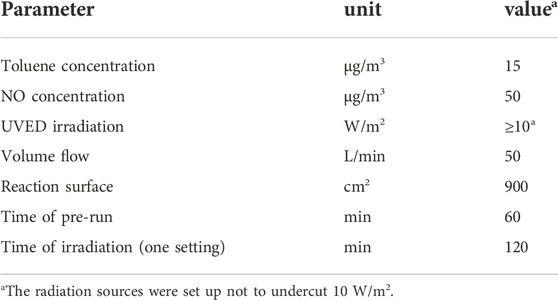
TABLE 1. Parameter set for the degradation tests.
A schematic overview of the used test system can be found in Figure 4. Synthetic air was passed through an activated carbon filter and a membrane dryer to rule out contamination of the reaction chamber or undesired reactions. The airflow was split and passed through a wash bottle, creating separate air flows for dry and humid air. Using mass flow controllers (MFC), it was possible to mix an exact humidity of 50% rH by changing the ratio of both streams at the re-mixing point. Toluene and NO levels were then set with an injector pump or a MFC, respectively. To achieve the necessary low concentrations in the test atmosphere, toluene was injected via a microliter pump as an almost saturated aqueous solution (450 mg/L). The airflow was forced through the x-y-plane of a 5 ppi foam (100.100.30 mm³), and UV irradiation was produced by UVED and low-pressure mercury fluorescent tube directed at the x-y-plane as well (see further details in the description of the irradiation setup). NO levels at the reaction chambers outlet were continuously monitored by a photoluminescent detector (HORIBA APNA 370), while toluene concentrations were determined in intervals, integrating over 30 min by continuously sampling thermodesorption gas chromatography (Synspec GC955).
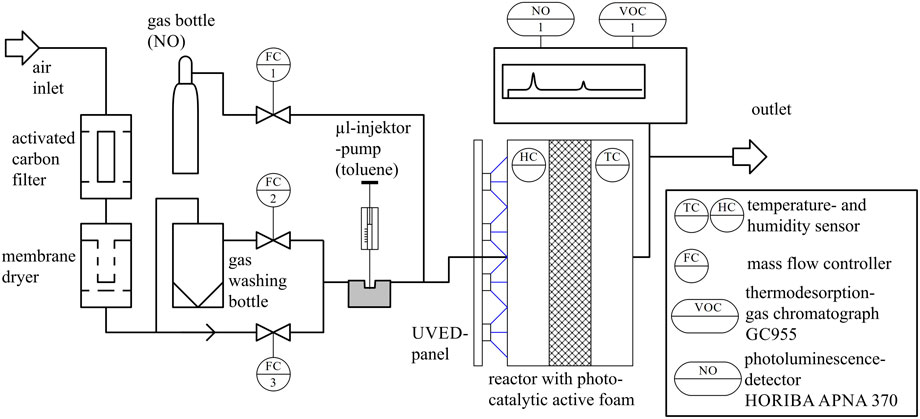
FIGURE 4. Experimental setup for toluene and NO degradation measurements.
The UVED panel was designed for a uniform (±5%) irradiation of the sample surface in the reactor. All four UVED types were chosen and arranged to maintain an irradiation intensity of 10–12 W/m2 for each wavelength (see Figure 5). As a result, the reactions in the excess state concerning photons remained similar to laboratory tests like ISO 22197-1 (DIN Normenausschuss Materialprüfung, 2018). UVEDs were connected in serial groups of 6 diodes of the same type. Each series was driven by a control circuit, as shown in Figure 6, consisting of a switch (transistor + resistor connected to “PWM in”) and a AL5890 LED driver. The driver stabilizes the current to ensure a constant radiation intensity towards the reaction chamber. The “PWM in” input was implemented by a frequency generator in rectangular frequency mode for measurements with PWM or PFM. Otherwise, the Input was connected to + 5 V. To perform comparative measurements with fluorescent lamps, the UVED board was removed from the reactor, and a conventional UVA-radiator like mentioned ISO 22197-1 (DIN Normenausschuss Materialprüfung, 2018) (aluminum housing with 2 Philips Cleo 18 W fluorescent tubes) was attached to achieve comparable radiation conditions of 10 W/m2 on the surface of the foam material.
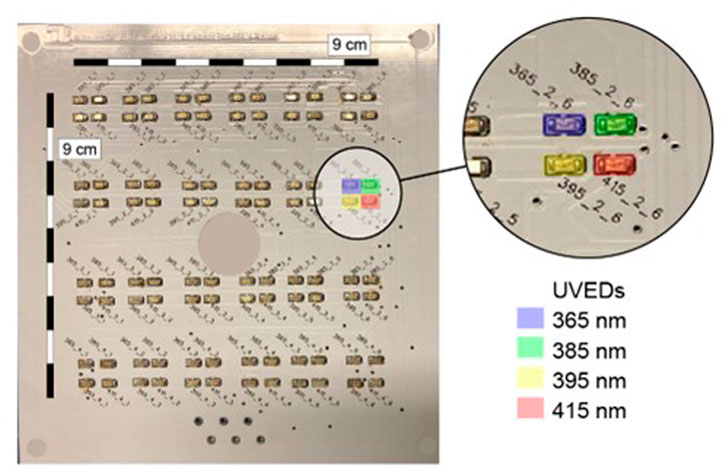
FIGURE 5. Picture of the UVED panel with the schematics of the emitter placement.
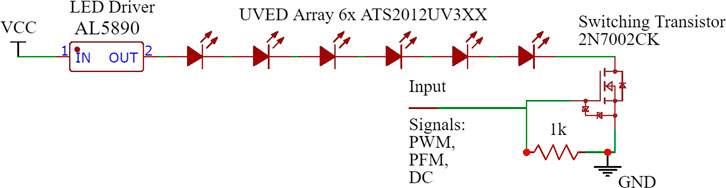
FIGURE 6. Electrical circuit for the operation of the UVEDs.
To verify the PWM and PFM control capabilities, the test setup shown in Figure 7 was built. To independently measure the radiation produced by the UVED panel, a photodiode (SG-Lux SG01M-D18) was placed in the irradiation field of the UVED board. The diode was connected to an oscilloscope to measure the induced photovoltaic voltage. This voltage represents the UVED radiation output and can be measured with a time resolution of 0.01 µs.
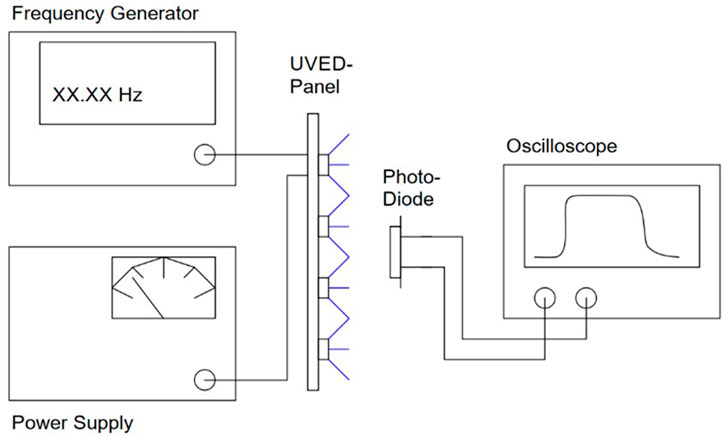
FIGURE 7. Measurement set up to verify the function of the PWM and PFM control electronics.
Two groups of diagrams are shown in Figure 8, a low frequency (0.4 Hz) and a high frequency (22 kHz) test. The PWM input voltage for switching the UVEDs is named exciter voltage, while the diodes output voltage is named response voltage. The diagrams show that in the range of the frequencies used in all mentioned tests, a distinct light pulse is produced for every excitation pulse. The response pulse for the 22 kHz frequency is considered the highest frequency useable with this setup. Since the response function at even higher frequencies consisted solely of rising and falling edges, a defined switching time of the UVED boards could no longer be guaranteed. The behavior could be due to the capacitance of the photodiode used, thus the UVED board most likely operates sufficiently at even higher frequencies. However, this could not be verified.
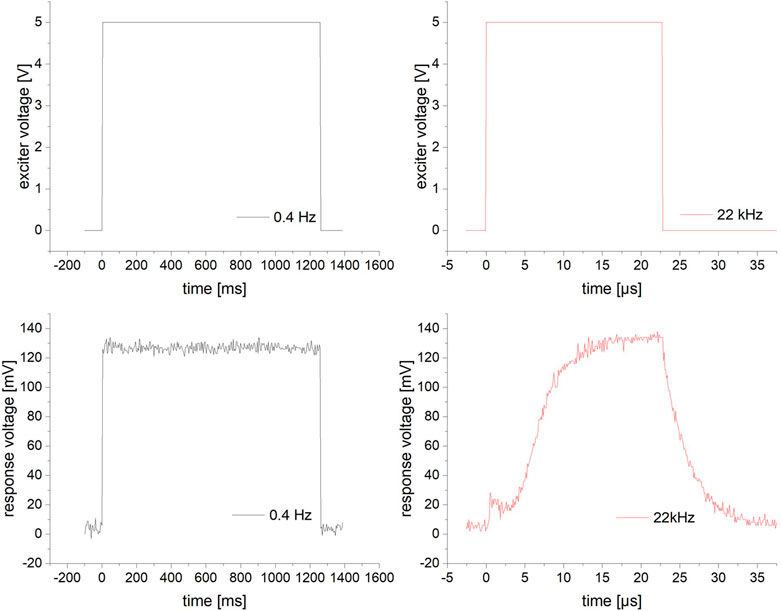
FIGURE 8. Exciter and response voltage of the PWM validation circuit for slow (0.4 Hz) excitation on the left and fast excitation (22 kHz) on the right.
2.3 Measurement program
2.3.1 Comparing fluorescent lamps and UV diode emitter performance
In this series of tests, degradation measurements were performed under constant parameters, as described in Table 1, except for the radiation source. The UVEDs and the fluorescent lamps were continuously activated, as described before. In addition, the emission curves of all UV sources were taken by spectroscope and compared with the frequency-depending absorption of the tested foam.
2.3.2 Modulation of pulse width (PWM)
In this test series, the parameters from Table 1 were used and kept constant. The radiation was produced by the 365 nm UVEDs, with a variation in pulse width and constant PWM frequency. The LED driving current was modulated with an exciter frequency of 10 kHz while the pulse width was varied from 0% (UVED permanently off) to 100% (UVED permanently on).
2.3.3 Modulation of pulse frequency (PFM)
In this test series, the parameters from Table 1 were used and kept constant. The radiation was generated by the 365 nm UVEDs, with a constant pulse width of 50% and a variation in the pulse frequency. The LED driving current was modulated with an exciter signal pulse width of 50%, which corresponds to a comparable constant illumination of 5 W/m2. The pulse frequency was varied between 10 mHz and 10 kHz.
3 Results
3.1 Comparing fluorescent lamps and UV emitting diode performance
The diagrams in Figures 9, 10 show scatter plots of deposition rates in the photocatalytic reactor system for a fluorescent UVA tube (fl.tube) and the four UVED types. All deposition rates were determined from 7 independent measurements for each UV source for toluene and NO, respectively. The deposition rate is distinctly higher for NO than for toluene. Deposition rates for the 365 nm UVED were comparable to the fl. tube for both pollutants. The mean values for the fl. lamp and for the UVED 365 (Table 2) were comparably high, while the fl. tube showed higher scattering for toluene measurements. The UVEDs with wavelengths of 385 nm, 395 nm and 415 nm generated significantly less photocatalytic activity in each case.
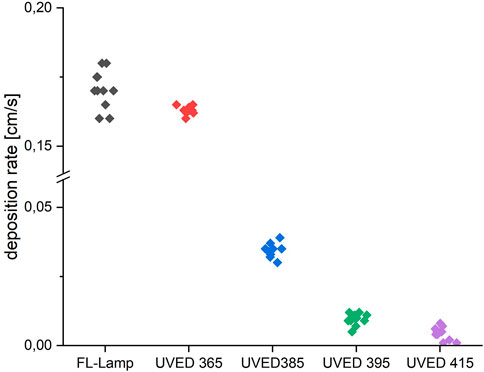
FIGURE 9. Deposition rates for toluene degradation with different UVA emitters and a fluorescent tube. The radiation intensity was kept at 10 W/m2 for each emitter type. The UVEDs, as well as the fluorescent tube, were operated with a continuous current.
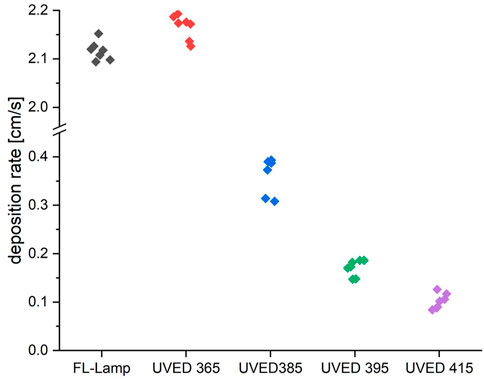
FIGURE 10. Deposition rates for NO degradation with different UVEDs and a fluorescent tube. The radiation intensity was kept at 10 W/m2 for each emitter type. The UVEDs, as well as the fluorescent tube, were operated with a continuous current.

TABLE 2. Mean values for the degradation of toluene and NO.
The photocatalytic deposition rates correlate with the absorbance spectrum of the photocatalytic material. This has already been hinted by the results shown in Figure 11, where the measured absorbance of the photocatalyst on the foam carrier is outlined and overlaid with the measured emission spectra for all five emitter types. The absorbance became minimal (<0.8) for wavelengths >400 nm and maximal (>2.0) for wavelengths <375 nm. While the emission spectrum of UVED 385 was in the area of higher absorbance, only UVED 365 was entirely in the range of maximum absorbance and, therefore, most suitable for the application.
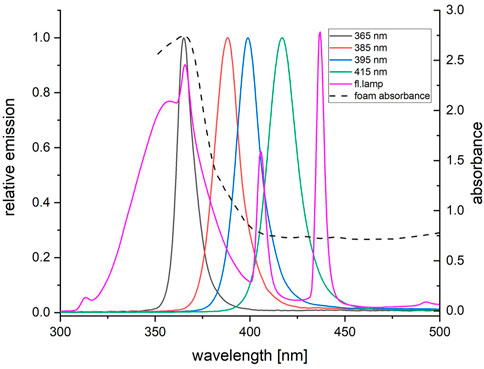
FIGURE 11. Relative emission vs. wavelength of the four used UVEDs and the fluorescent tube in comparisonto the spectral absorbance of the TiO2 coating applied on the foam carrier.
3.2 Variation of pulse width (PWM)
Beginning with a PWM of 0%, a deposition rate of 0 was observed for both pollutants. The deposition rate rises with increasing PWM duty-cycle until the latter reaches 37 %, where a plateau was reached, which lasted up to a PWM of 100 %. Consistent with the measurements in 4.1, a maximum deposition rate of 0.16 cm/s was obtained for toluene and 2.15 cm/s for NO. The results for the pulse width variation are shown in Figure 12.
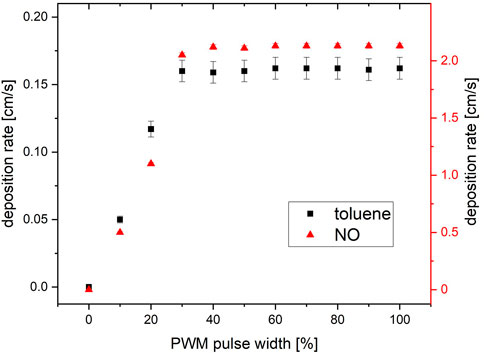
FIGURE 12. The sweep of pulse width and resulting deposition rate for the degradation of toluene and NO. At 100% pulse width, 10 W/m2 365 nm irradiation was determined on the catalyst surface.
3.3 Variation of pulse frequency (PFM)
The variation of pulse frequency was performed starting at the high frequencies and continuously dropping to lower ones. With a constant pulse width of 50%, the frequencies were changed from 10 kHz to 10 mHz. The deposition rate for toluene and NO remained constant until a threshold of around 1 Hz. A significant drop (>5%) in the deposition rate was observed for NO for ≤0.8 Hz and for toluene for ≤0.3 Hz. Consistent with the measurements in 4.1 and 4.2, a maximum deposition rate of 0.16 cm/s was obtained for toluene and 2.15 cm/s for NO. The results for the pulse width variation are shown in Figure 13.
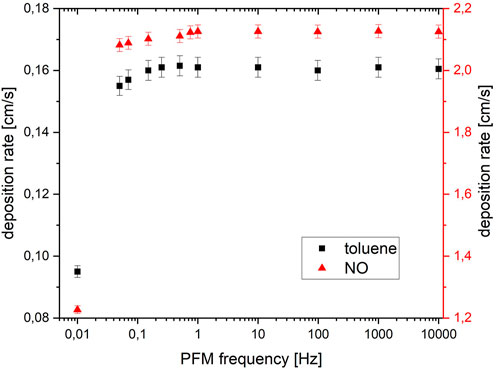
FIGURE 13. Deposition rates for the degradation of toluene and NO as a function of frequency modulation.
4 Discussion
The test results from chapter 4.1, in which different irradiation sources were compared, show comprehensible results. The expected dependence of the wavelength of the UVED on the activity of a photocatalytic system was shown. The emission spectrum of the UVEDs used is the most critical parameter as the emission band is very narrow compared to the fluorescent lamp type. However, photocatalytic activity was detected for all UVED types investigated, even if it was significantly below the most effective wavelength of 365 nm. In previous studies, it was shown that multiple factors act on the activity of photocatalyst systems, which are difficult to detect individually. Nevertheless, a certain dependence between the photocatalytic activity and the light absorption properties of a substance can be established (Calza et al., 2018). It should be noted that the measurements in this publication are of mixed systems and not pure photocatalysts. Accordingly, the absorption is a sum value of the absorptions of all matrix materials and not of pure photocatalysts, so the absorbed photons are converted into heat to an even greater extent than the photocatalyst into an excited state compared to pure photocatalysts. The comparison of the emission bands of different UVEDs with the absorption curves of the catalyst systems can therefore give a first, approximate indication of the activities to be expected. However, this cannot replace a proper measurement of the photocatalytic activities but can at best weed out UVEDs from a batch under consideration as unsuitable, allowing to limit the subsequent more complex activity determinations. If the adsorption curve of a material overlaps with several UVED emission bands, a combination of different UVED types can be considered.
Furthermore, we could show that increasing the irradiation time by raising the PWM ratio has a linear effect of increasing the deposition rates until saturation is reached. Above this threshold, a further increase does not have an additional effect on the degradation. As was demonstrated in the experiments, this observation can only be confirmed for sufficiently high pulse modulation frequencies above 1 Hz (toluene) resp. 10 Hz (NO). This differs from the work of Liang et al. (2019) as they did not find a saturation point while changing the PWM duty cycle in aqueous systems. On the one hand, this difference could be due to a high diffusion rate in liquids compared to air, and thus high mass flows to the catalyst surface. On the other hand, the reaction rates for the decomposition of the reactive oxygen species formed on the surface could be significantly higher in a liquid environment. Other studies show in contrast, that while increasing the intensity of unmodulated irradiation (at low intensities of 0–20 W/m2) an increasing of the photoatalytic activity follows (Dillert et al., 2013; Enesca and Isac, 2020). This shows that this effect is also known for continuous irradiation scenarios and cannot to be achieved exclusively by PWM modulation.
A variation of the pulse frequency also showed an effect on the photocatalytic degradation rate. The deposition rate increased from unexpectedly low frequencies of 10 mHz and remaind largely constant after exceeding a threshold within the measured frequency range. For toluene, the threshold of 0.3 Hz and for NO, a threshold of 0.8 Hz was observed. For even lower frequencies, a significant drop in the degradation rate was found. Several buffer effects could be the cause of this behavior. Depending on the reaction rate of the reactions downstream of the photon capture, the triggered radicals or intermediates could be available for some time as a reservoir for ongoing reactions. FT-IR studies with high temporal resolution could provide further insights. The different threshold frequencies for toluene and NO indicate a material-specific phenomenon. One of the reasons beside different complex degradation pathways could be the different diffusion behaviour of the two sample pollutants. With the diffusion constants of 0.079 cm2/s (toluene) and 0.21 cm2/s (NO) in air at 20°C (Environmental Modeling Community of Practice, 2022), an estimated diffusion way of 0.5 mm in the porous foam material and the idealized assumption that on the catalyst surface the pollutant molecule concentration is zero, about 300 times fewer toluene molecules diffuse to the catalysts surface per unit of time and area than NO molecules. This may be another explanation for the saturation of the activity at a lower frequency, as the toluene molecules take longer to refill the empty spots on the catalysts surface after a period of irradiation and photocatalytic decomposition. The longer this refilling time is, the lower the irradiation frequency can be.
The results of Hou and Ku (2013) could be confirmed in our experiments. With high PFM at high PWM rates, more efficient use of the photons generated is achieved. Assuming a PWM operation of the LEDs to degrade NO at the threshold of maximum photocatalytic activity, the following savings can be achieved in comparison to constant-current driven LEDs:
With a pulse width of 37%, the power consumption of the system drops by 63% of the electrical power required for continuous operation while keeping the photocatalytic degradation at a constant rate.
The efficiency thus increases by a factor of 2.7. With an average radiant power of the used LEDs of 13 mW at a power consumption of 70 mW per square meter of photocatalytic surface (10 W/m2/0.013 Wopt·0,07 Wel), 53 W electricity is needed. The 1-year related (8760 h×53 W) 464 kWh are reduced to 172 kWh.
The lifespan of the LEDs is directly related to their operating time under otherwise comparable environmental conditions (mainly with sufficient cooling). The LEDs, in this case, achieve an average time to fail of 10,000 h under continuous operation. With a PWM of 37%, the continuous reactor operation can be extended from 13 months to 3 years.
In subsequent studies, it should be investigated to what extent known photocatalytic degradation rates of other air pollutant molecules change the cut-off frequency of LED operation. Furthermore, it should also be investigated how a reduced volume flow through the foam carrier influences the cut-off frequencies via the formation of larger diffusion zones and whether this results in a significant decrease in reactor performance.
5 Conclusion
The operation of photocatalytic reactors can be optimised by using UV LEDs to be a serious competitor to other air cleaning systems. All the influencing variables considered (wavelength of the LEDs used, frequency duty cycle of the irradiation) contribute to the efficient operation of an air purification photocatalysis reactor.
The selection of the appropriate wavelengths for the catalyst system is of utmost importance. If the excitation frequency of the narrow emission band of the LEDs used does not match the absorption band of the photocatalyst system, its efficiency will drop to zero in the worst case.
The shaping of the LED irradiation can lift the energy efficiency even further. In our experiments, slow light pulses (0.8 Hz, 37% pulse width) were sufficient for both NO and toluene to produce consistently high photocatalytic degradation rates in an otherwise identical reactor setup—compared to continuously illuminated LEDs. The results of this study show the same trends for the two test substances, with increasing frequency of the PFM, up to a substance-specific limit, the degradation rate of a pollutant rises. After this limit the degradation rate remains constant, which lowers the photon efficiency increasingy. This behavior also applies for experiments with a increasing duty cycle of the PWM.
The toluene degradation rate dropped at lower PFM frequencies and at a lower duty cycle of PWM compared to NO. This hints the possibility of optimizing each reactor energetically for the specific contaminant that is to be removed in a particular application.
Data availability statement
The raw data of this study are available from the authors upon reasonable request.
Author contributions
Conceptualization, DS and CE; methodology, CE; software, CE; validation, DS; formal analysis, CE; investigation, CE; resources, DS; data curation, CE; writing—original draft preparation, CE; writing, review and editing, DS; visualization, CE; supervision, DS; project administration, DS; funding acquisition, DS. All authors have read and agreed to the published version of the manuscript.
Funding
This research was funded by the Federal Ministry of Economics and Technology of Germany (BMWI), grant number 13XP5072D. We acknowledge support by the German Research Foundation and the Open Access Publication Fund of TU Berlin.
Acknowledgments
The authors thank the project partners for providing the coating materials and coating the foam mats.
Conflict of interest
The authors declare that the research was conducted in the absence of any commercial or financial relationships that could be construed as a potential conflict of interest.
Publisher’s note
All claims expressed in this article are solely those of the authors and do not necessarily represent those of their affiliated organizations, or those of the publisher, the editors and the reviewers. Any product that may be evaluated in this article, or claim that may be made by its manufacturer, is not guaranteed or endorsed by the publisher.
References
Calza, P., Minella, M., Demarchis, L., Sordello, F., and Minero, C. (2018). Photocatalytic rate dependence on light absorption properties of different TiO2 specimens. Catal. Today 340, 12–18. doi:10.1016/j.cattod.2018.10.013
Claes, T., Dilissen, A., Leblebici Enis, M., and Van Gerven, T. (2019). Translucent packed bed structures for high throughput photocatalytic reactors. Chem. Eng. J. 361, 725–735. doi:10.1016/j.cej.2018.12.107
Dai, K., Lu, L., and Dawson, G. (2013). Development of UV-LED/TiO2 device and their application for photocatalytic degradation of methylene blue. J. Mat. Eng. Perform. 22, 1035–1040. doi:10.1007/s11665-012-0344-7
Deutsches Institut für Normung (2018). Deutsches Institut für Normung. ine ceramics (advanced ceramics, advanced technical ceramics) - test method for air-purification performance of semiconducting photocatalytic materials - Part 1: Removal of nitric oxide. Berlin, Germany: Beuth-Verlag, 22197–22202.
Dillert, R., Engel, A., Große, J., Lindner, P., and Bahnemann, D. W. (2013). Light intensity dependence of the kinetics of the photocatalytic oxidation of nitrogen(II) oxide at the surface of TiO2. Phys. Chem. Chem. Phys. 15 (48), 20876. doi:10.1039/c3cp54469a
DIN Normenausschuss Materialprüfung (2018). Fine ceramics (advanced ceramics, advanced technical ceramics) – test method for air-purification performance of semiconducting photocatalytic materials – Part 1: Removal of nitric oxide (ISO 22197-1:2016).
Enesca, A., and Isac, L. (2020). The influence of light irradiation on the photocatalytic degradation of organic pollutants. Materials 13, 2494. doi:10.3390/ma13112494
Environmental Modeling Community of Practice (2022). Environmental modeling community of Practice. Athens, Georgia, USA: EPA, US Environmental Protection Agency. Available at: https://www3.epa.gov/ceampubl/learn2model/part-two/onsite/estdiffusion-ext.html.
Hou, W-M., and Ku, Y. (2013). Photocatalytic decomposition of gaseous isopropanol in a tubular optical fiber reactor under periodic UV-LED illumination. J. Mol. Catal. A Chem. 374-375, 7–11. doi:10.1016/j.molcata.2013.03.016
ISO (2019). Fine ceramics (advanced ceramics, advanced technical ceramics) - test method for air-purification performance of semiconducting photocatalytic materials Part 3: Removal of toluene.
Korovin, E., Selishchev, D., Besov, A., and Kozlov, D. (2015). UV-LED TiO2 photocatalytic oxidation of acetone vapor: Effect of high frequency controlled periodic illumination. Appl. Catal. B Environ. 163, 143–149. doi:10.1016/j.apcatb.2014.07.034
Kuo, T-H., Liang, T. J., and Wu, W-J. (2016). Design and implementation of a LED driver with current balancing 2016 IEEE 8th International Power Electronics and Motion Control Conference (IPEMC-ECCE Asia), Hefei, P.R. China, 22-26 May 2016 (Piscataway, NJ: IEEE), 1.
Liang, R., van Leuwen, J. C., Bragg, L. M., Arlos, M. J., Li Chun Fong, L. C., Schneider, O. M., et al. (2019). Utilizing UV-LED pulse width modulation on TiO2 advanced oxidation processes to enhance the decomposition efficiency of pharmaceutical micropollutants. Chem. Eng. J. 361, 439–449. doi:10.1016/j.cej.2018.12.065
Licht, D., Straberger, H-J., Ehm, C., Bauder, C., and Feilen, A. (2021). Photokatalytisch aktive beschichtungen auf filtermaterialien für die luftreinigung von schadstoffbelasteten innenräumen : Schlussbericht. Available at: https://www.tib.eu/de/suchen/id/TIBKAT%3A1810105765.
Luo, G., Liu, H., Li, W., and Lyu, X. (2020). Automobile exhaust removal performance of pervious concrete with nano TiO2 under photocatalysis. Nanomater. (Basel) 10, 2088. doi:10.3390/nano10102088
Mittal, A., Sharma, S., Kumari, V., Yadav, S., Chauhan, N. S., and Kumar, N. (2019). Highly efficient, visible active TiO2/CdS/ZnS photocatalyst, study of activity in an ultra low energy consumption LED based photo reactor. J. Mat. Sci. Mat. Electron. 30, 17933–17946. doi:10.1007/s10854-019-02147-6
Muramoto, Y., Kimura, M., and Nouda, S. (2014). Development and future of ultraviolet light-emitting diodes: UV-LED will replace the UV lamp. Semicond. Sci. Technol. 29, 084004. doi:10.1088/0268-1242/29/8/084004
Office P. VERORDNUNG (2008). Office P. VERORDNUNG (EU) 2017/852 DES EUROPÄISCHEN PARLAMENTS UND DES RATES - vom 17, 1102. Mai 2017 - über Quecksilber und zur Aufhebung der Verordnung (EG) Nr.
Park, H-J., Hossain, S. M., Choi, K., Shon, H-K., and Kim, J-H. (2022). A study on the evaluation methods of nitrogen oxide removal performance of photocatalytic concrete for outdoor applications. Catalysts 12, 846. doi:10.3390/catal12080846
Rasmussen, R. A., and Khalil, M. A. K. (1983). Atmospheric benzene and toluene. Geophys. Res. Lett. 10, 1096–1099. doi:10.1029/GL010i011p01096
Sun, J. (2012). “Pulse-width modulation,” in Dynamics and control of switched electronic systems. Editors F. Vasca, and L. Iannelli (London: Springer London), 25–61.
Tian, H., Xu, R., Canadell, J. G., Thompson, R. L., Winiwarter, W., Suntharalingam, P., et al. (2020). A comprehensive quantification of global nitrous oxide sources and sinks. Nature 586, 248–256. doi:10.1038/s41586-020-2780-0
Tokode, O., Prabhu, R., Lawton, L. A., and Robertson, P. K. (2016). Controlled periodic illumination in semiconductor photocatalysis. J. Photochem. Photobiol. A Chem. 319-320, 96–106. doi:10.1016/j.jphotochem.2015.12.002
Tokode, O., Prabhu, R., Lawton, L. A., and Robertson, P. K. (2015). “UV LED sources for heterogeneous photocatalysis,” in Environmental photochemistry Part III. Editors D. W. Bahnemann, and P. K. Robertson (Berlin, Heidelberg: Springer Berlin Heidelberg), 159–179.
Venkata Laxma Reddy, P., Kim, K-H., and Kim, Y-H. (2011). A review of photocatalytic treatment for various air pollutants. ajae. 5, 181–188. doi:10.5572/ajae.2011.5.3.181
Zaleska, A., Hanel, A., and Nischk, M. (2010). Photocatalytic air purification. ENG 4, 200–216. –16. doi:10.2174/187221210794578637
Keywords: photocatalysis, LED, UVA, TiO2, CPI, UVED, photocatalytic activity
Citation: Ehm C and Stephan D (2022) The influence of pulse modulated UV LEDs of different wavelengths on the photocatalytic degradation of atmospheric toluene and NO. Front. Catal. 2:1072692. doi: 10.3389/fctls.2022.1072692
Received: 17 October 2022; Accepted: 28 November 2022;
Published: 12 December 2022.
Edited by:
Jian Zhu, Shanghai Normal University, ChinaReviewed by:
Ghulam Abbas Ashraf, Zhejiang Normal University, ChinaJonathan Zacharias Bloh, DECHEMA Forschungsinstitut (DFI), Germany
Copyright © 2022 Ehm and Stephan. This is an open-access article distributed under the terms of the Creative Commons Attribution License (CC BY). The use, distribution or reproduction in other forums is permitted, provided the original author(s) and the copyright owner(s) are credited and that the original publication in this journal is cited, in accordance with accepted academic practice. No use, distribution or reproduction is permitted which does not comply with these terms.
*Correspondence: Dietmar Stephan, c3RlcGhhbkB0dS1iZXJsaW4uZGU=