 Shivani Parikh1,2†
 Kelly Henderson3Rahul Gondalia2
 Leanne Kaye2
 Esther Remmelink4Alesha Thompson5
 Meredith Barrett2*†
- 1Harvard T. H. Chan School of Public Health, Environmental Health, Boston, MA, United States
- 2ResMed Inc., Science Center, San Diego, CA, United States
- 3Propeller Health, User Research, San Francisco, CA, United States
- 4Propeller Health, Data Analytics, San Francisco, CA, United States
- 5Council of State and Territorial Epidemiologists, Programs, Atlanta, GA, United States
Environmental exposures and socioeconomic status (SES) are associated with asthma and chronic obstructive pulmonary disease (COPD) morbidity and mortality. Despite efforts to reduce the impact of environmental exposures through regulation and education, knowledge gaps remain. We sought to understand how adults with asthma and COPD perceive and seek information about environmental factors, and how these responses varied by disease or socioeconomic characteristics. Participants with self-reported asthma or COPD enrolled in a digital platform for respiratory disease self-management, consisting of sensors to track medication use and a companion smartphone app, completed an electronic survey exploring perceptions of environmental factors. Using mixed-method analyses, we evaluated differences in responses by disease (asthma vs. COPD), education (≤ vs. > some college), annual household income (< vs. ≥ $50,000), and mean annual residential air pollutant exposure (> vs. ≤80th percentile). Survey responses from 698 participants [500 asthma (72%) and 198 COPD (28%)] were analyzed. A high percentage of participants perceived that environmental factors could influence their symptoms, including: pollen (93% for asthma vs. 86% for COPD), mold (89 vs. 85%), second-hand smoke (89 vs. 83%), and air pollution (84% for both). Participants reported seeking environmental information daily from an average of three sources, preferring mobile apps and television (TV) programs. Significant differences were identified by disease.
Conclusion: Participants with asthma and COPD perceive a relationship between their respiratory symptoms and their environment and regularly seek out environmental information. This information can help inform digital health development for respiratory education and self-management.
Introduction
Chronic respiratory diseases, including asthma and chronic obstructive pulmonary disease (COPD), are among the leading causes of morbidity and mortality worldwide (1). In the US, asthma affects 25 million people (2), while COPD affects 16 million people (3); both lead to significant social burden with over 30 million days of missed work and school estimated (4, 5). Environmental factors such as air pollution have been associated with respiratory mortality (6, 7) and worsening of symptoms including cough, dyspnea, and wheeze (8).
These respiratory disease burdens disproportionately affect minority and socioeconomically-disadvantaged populations, who are more likely to be exposed to poorer air quality and experience higher respiratory prevalence and morbidity (9). Asthma prevalence is higher in adults with household incomes 100% below the federal poverty level (FPL) (10.8%) than in those with incomes >450% of the FPL (6.5%) (10), and mortality is negatively associated with both education and income (11). Similarly, COPD prevalence is higher in adults with household incomes below the FPL (8.3%) than in those with incomes >200% of the FPL (4.3%), and disease severity is negatively associated with socioeconomic status (SES) (12).
Education about environmental factors is recommended by national clinical guidelines as a component of regular asthma management (13). Education may improve self-management among chronic respiratory disease patients of all SES levels by reducing health literacy barriers, which could lead to reductions in symptoms, healthcare utilization, and absenteeism (9, 14). Early evidence suggests digital health may serve a role in providing education to people with respiratory disease (15); however, further research is needed to design content delivery in usable and convenient ways that can serve users from different socioeconomic strata with varying levels of health literacy (16).
In order to better understand perceptions of environmental factors among participants with asthma and COPD, this study aimed to evaluate: (1) preferred sources for information about environmental factors; (2) knowledge and perceived impact of environmental exposures on symptoms; and (3) perceived agency to limit environmental impact on symptoms. Lastly, we aimed to assess how these perceptions varied by disease, education, income and mean air pollutant exposure.
Methods
Participant Recruitment and Enrollment
Existing users of a digital health platform for respiratory management (Propeller Health, CA, USA) were invited to participate in an online survey through an email invitation. Participants self-reporting either asthma or COPD, ≥18 years, residing in the US, and who self-enrolled online between December 2017 and June 2019, largely within Facebook campaigns, were eligible. Participants who had at least one sensor data transmission (“sync”) in their first 30 days on the platform were included. Eligible participants provided electronic consent before taking the survey, and those who completed the survey were entered into a raffle for a $150 Amazon gift card. The study protocol was approved by the Copernicus Independent Review Board (Protocol # 20191728).
The Digital Health Platform
The digital platform, consisting of a small electronic medication monitor (EMM) and an accompanying smartphone application (“app”), passively collects inhaler use data from users with asthma and/or COPD. The EMM attaches to a participant's inhaler medication, captures the date and time of each inhaler use, and provides objective information about adherence to controller medications and use of rescue medications. The EMM then relays these data (“syncs”) to a paired smartphone, which captures the geographic location of use. In the platform, each rescue medication use event is also assigned local environmental exposure levels for five criteria air pollutants [fine particulate matter (particles <2.5 μm in diameter; PM2.5), coarse particulate matter (particles <10 μm in diameter; PM10), ozone (O3), nitrogen dioxide (NO2), and sulfur dioxide (SO2)] and weather conditions (e.g., temperature, precipitation, pressure, and visibility). These data are then used to create personalized reminders, feedback and education in the app.
Three specific components of the app communicate information about environmental conditions that are relevant to asthma and COPD (Figure 1). For users with asthma, the Asthma Forecast utilizes an individual's past record of rescue medication use to predict whether they may use rescue medication on a specific day as a function of the current environmental conditions in their location (Figure 1A). Users with asthma may also receive push notifications when the Asthma Forecast transitions to “poor” or “good” in their area (Figure 1B). Trigger tracking and trends are based upon users' self-reported triggers that they perceive may be associated with their symptoms (Figure 1C). A subset of in-app education cards present content on environmental conditions relating to asthma or COPD (Figure 1D).
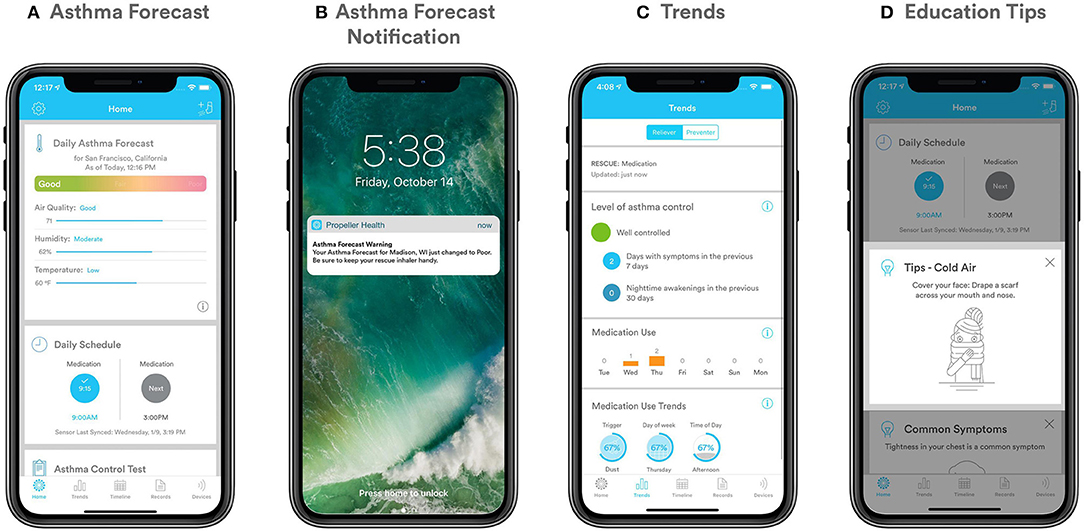
Figure 1. (A–D) Personalized components of the app (A) Asthma Forecast; (B) Asthma Forecast notification; (C) Trigger tracking and trends; (D) Education cards.
Measures and Outcomes
Participants self-reported their demographic information (gender, race, age) and components of their SES (highest education level achieved and annual household income). Annual mean air pollutant concentrations including PM2.5, PM10, O3, NO2, and SO2 were assigned to each participant based on residential zip code using data downloaded from the U.S. Environmental Protection Agency's (US EPA) Air Quality System for 2018. Controller medication adherence (number of puffs taken divided by the number of puffs prescribed per day, capped at 100%) and total rescue medication use (puffs per person per day) were assessed using data collected by the EMM.
Self-reported questionnaires for asthma [Asthma Control Test (ACT)] (17) and COPD [COPD Assessment Test (CAT)] (18) were administered monthly through the Propeller app. An ACT score of <20 indicates uncontrolled asthma and a CAT score of >20 indicates greater COPD burden.
A 25-question asthma survey and a 20-question COPD survey were developed to assess preferred sources for information about environmental factors, knowledge and perceptions of environmental factors, and sense of agency in mitigating the impact of these factors (see full surveys in Supplemental Material 1). Answer categories were chosen based on the literature. Participants were able to select multiple answer categories for certain questions and were able to write in an unlisted option, but combinations of responses and open-ended responses were not assessed herein. The survey was delivered via email and data were collected via a HIPAA-compliant platform (Survey Monkey).
Statistical Analyses
Survey results were analyzed for participants who completed the survey using R version 4.0.2 (19). Four closed-ended questions were analyzed by calculating the frequency at which each possible response was selected and conducting statistical analyses to assess differences in responses by participant characteristics, including t-tests for continuous variables and chi-squared tests for categorical variables. Logistic regressions were used to estimate the relationship between disease (COPD vs. asthma) and each study outcome. All models adjusted for age, gender, app use at 180 days (a proxy for app engagement), education, and income. Analyses comparing COPD and asthma were restricted to participants at least 40 years of age in order to standardize across age-based differences. Models were stratified by asthma and COPD to estimate disease-specific associations between education (< vs. ≥ college degree), income (< vs. ≥$50,000), and annual mean air pollution exposure (≤ vs. >80th percentile) with each response, while adjusting for age, gender, and app use at 180 days. The threshold for statistical significance was α = 0.05.
Results
Population Description
The analysis included 698 participants, including 500 with asthma (72%) and 198 with COPD (28%), which represented a 13% email open rate and a 99% survey completion rate across both surveys (including all demographic questions) (Table 1). Participants were predominantly female (79.0% for asthma, 56.1% for COPD) and White (80.4% for asthma, 88.4% for COPD). A larger percentage of participants with COPD had an annual household income <$50,000 (68.2 vs. 46.4% for asthma) and less than a college degree (82.3 vs. 58.8%). Among asthma participants, 82.6% (n = 413) had uncontrolled asthma as defined by ACT. Among COPD participants, 33.8% (n = 67) had higher impact COPD as defined by CAT. Annual mean pollutant exposures are reported in Table 1 and Supplementary Table S1.
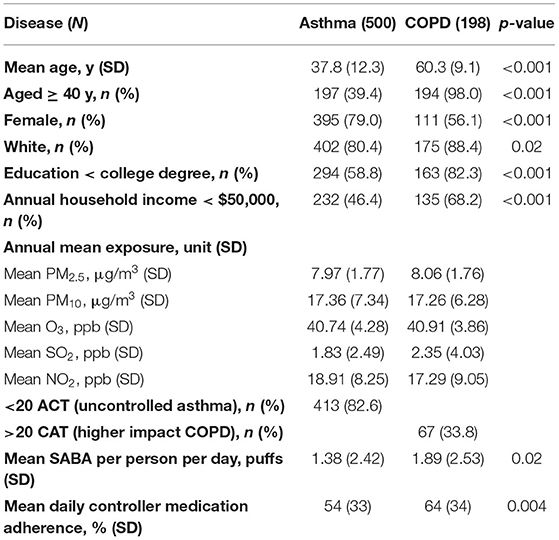
Table 1. Population characteristics.
Preferred Sources for Environmental Information
The survey assessed whether and how participants seek information about daily changes in air pollution (Figure 2): 95% of participants with asthma and 98% of those with COPD indicated that they sought information daily using at least one source. Participants reported an average of 3 preferred sources, with the most frequently used being the Propeller Asthma Forecast in the app (asthma only), mobile apps, and TV, in that order.
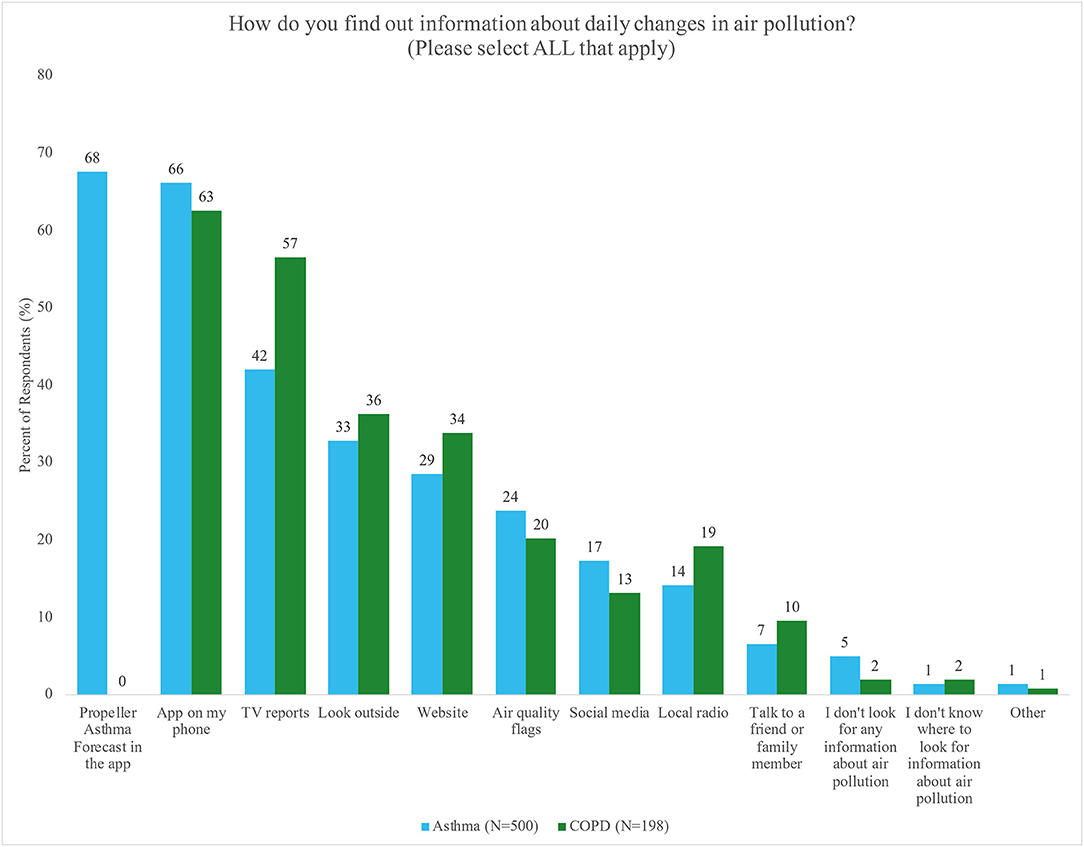
Figure 2. Percent of respondents with asthma (blue) or COPD (green) who reported preferred sources for seeking information about daily changes in air pollution. Participants could select more than one answer.
Asthma and COPD participants reported differences in preferred sources (Table 2). Participants with COPD were more likely to seek out information about air pollution than participants with asthma across multiple sources, including: mobile apps [OR = 1.89, 95% CI (1.05, 3.39), p = 0.03], TV reports [OR = 1.83, 95% CI (1.04, 3.21), p = 0.04], social media [OR = 2.28, 95% CI (0.95, 5.44), p = 0.06], looking outside [OR = 2.77, 95% CI (1.49, 5.17), p = 0.001], and talking to a friend or family member [OR = 15.00, 95% CI (2.54, 88.60), p = 0.003]. Furthermore, participants with COPD had lower odds of not seeking information about air pollution than participants with asthma. Significant differences by air pollution exposure and education were inconsistent, and there were no significant differences by income (Supplementary Tables S2–S6).
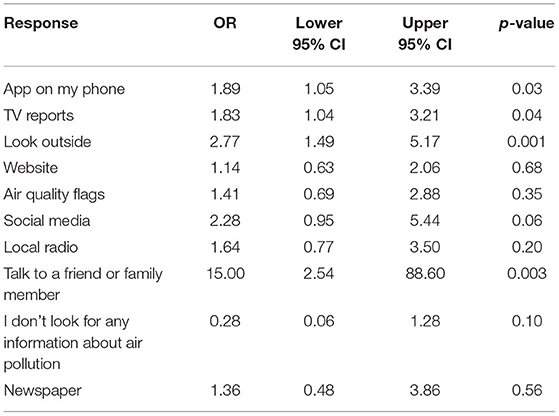
Table 2. Odds ratio (OR) of preferred sources for air pollution information as reported by participants with COPD vs. asthma.
Knowledge and Perceptions of Environmental Influence
The survey assessed whether or not participants perceived an influence of several environmental factors on their symptoms (Figures 3A,B). Participants perceived that pollen (93% for asthma vs. 86% for COPD), mold (89 vs. 85%), second-hand smoke (89 vs. 83%), air pollution (AQI) (84% for both), smoking (80 vs. 82%) and pet dander (62 vs. 58%) influenced their symptoms.
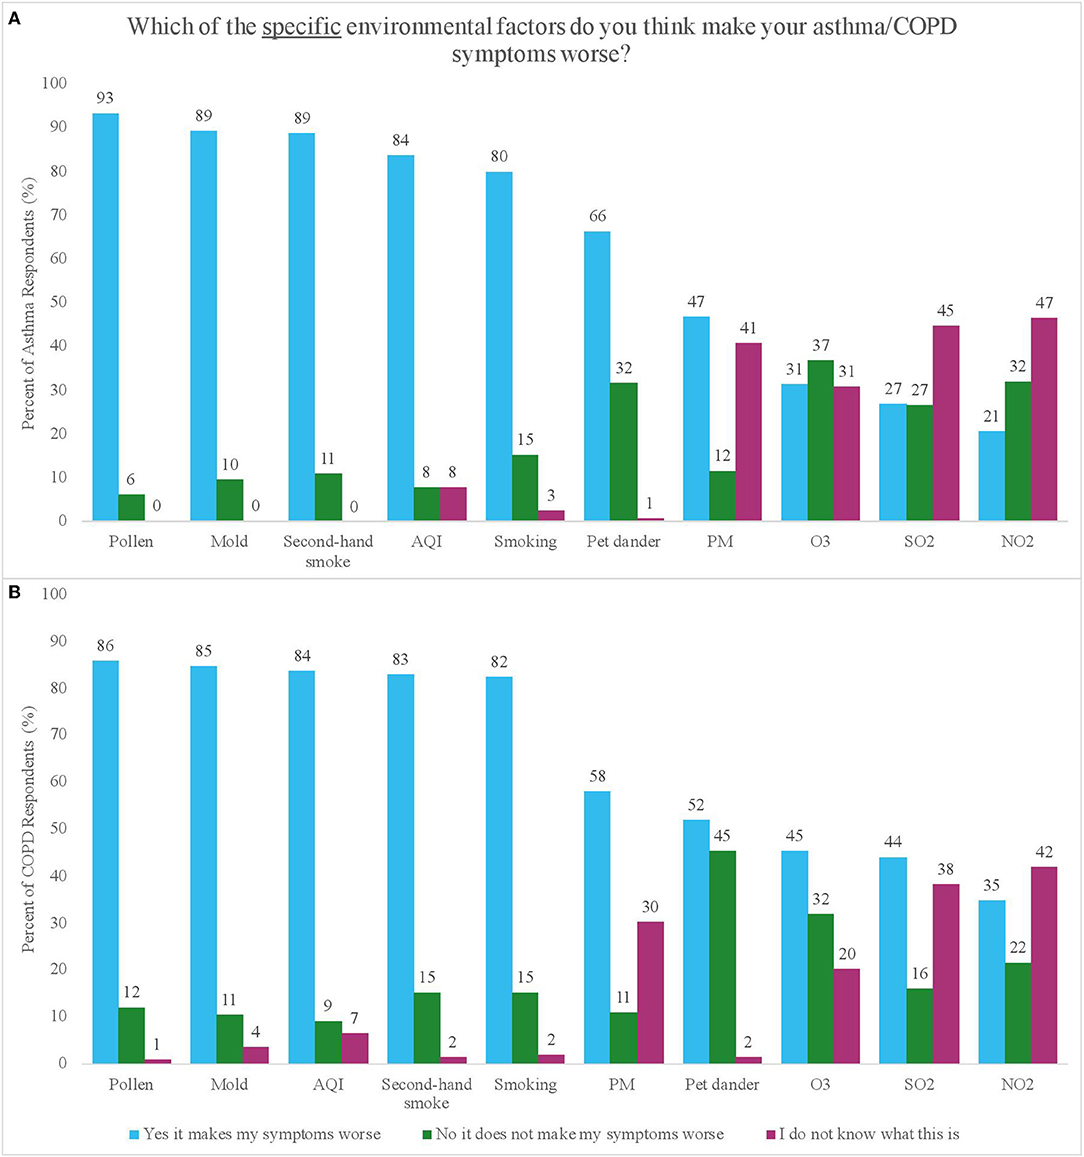
Figure 3. (A,B) Percent of respondents with asthma (A) and COPD (B) who reported perceiving or not perceiving an impact of different environmental factors on their symptoms, as well as the percentage of respondents who reported not knowing what the factor was.
Among COPD participants who perceived knowing what PM was (defined as answering either “yes this makes my symptoms worse” or “no this does not make my symptoms worse” vs. “I do not know what this is”), income was significantly associated with the way they perceived PM impacting their symptoms, where the odds of believing that PM affected their symptoms were eight times higher in participants with low (vs. high) income levels [OR = 7.76, 95% CI (2.41, 24.99), p = 0.001] (Supplementary Table S16). There were some significant differences in whether specific air pollutants were perceived to impact symptoms by disease, education, and exposure, however these results were inconsistent (Supplementary Tables S7–S10).
We evaluated perceived knowledge about environmental factors by examining the frequency with which participants responded, “I do not know what this is,” for each environmental factor (Figures 3A,B). A small percentage of participants (asthma vs. COPD) reported not knowing what pollen (0 vs. 1%), mold (0 vs. 4%), second-hand smoke (0 vs. 2%), and AQI (8 vs. 7%) were, but a larger percentage reported not knowing what PM (41 vs. 30%), O3 (31 vs. 20%), SO2 (45 vs. 38%), and NO2 (47 vs. 42%) were. There were no significant differences in knowledge of specific pollutants (PM, O3, NO2, and SO2) by disease, education, income, or exposure (Supplementary Tables S11–S15).
Sense of Agency to Practice Self-Management
The survey assessed how strongly participants felt that they could do something to “reduce or limit the impact of air pollution, weather, or pollen” on their symptoms. The majority of participants agreed (61% asthma vs. 64% COPD) that they could do something to limit the impact of environmental factors (Figure 4).
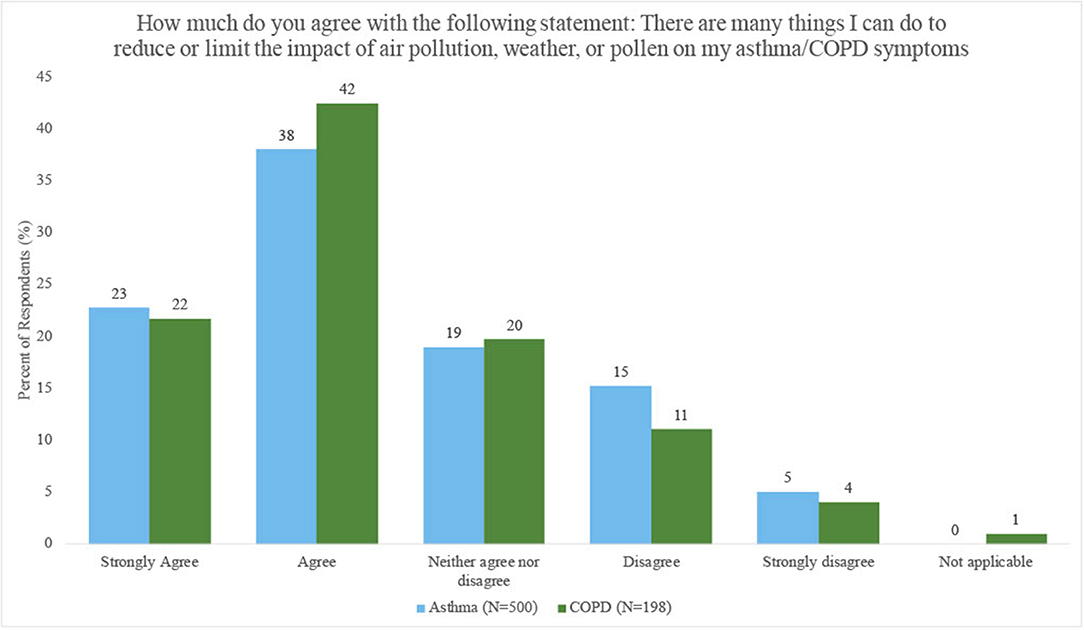
Figure 4. Percent of respondents with asthma and COPD who perceived they could limit or reduce the impact of air pollution, weather, or pollen on their symptoms.
Participants exposed to high (vs. low) levels of PM2.5 were less likely to agree that they could limit the impact of environmental factors on their symptoms [OR = 0.61, 95% CI (0.35, 1.08), p = 0.09; COPD OR = 0.45, 95% CI (0.20, 1.08), p = 0.08], but the odds of feeling agency were higher in participants exposed to high (vs. low) levels of O3 [OR = 1.71, 95% CI (0.97, 3.02), p = 0.06; COPD OR = 2.31, 95% CI (0.80, 6.64), p = 0.12], however results were not statistically significant. Results were not consistent or statistically significant across other air pollutants (Supplementary Table S19). There were no significant differences by disease, education or income (Supplementary Tables S16–S18).
The survey assessed specific actions participants might take to reduce exposure and mitigate symptoms. When participants with asthma were asked, “On days when you see that the Propeller Asthma Forecast is poor, which of the following actions might you take?” Participants could select multiple answers. The top five most frequent actions included: “bring my rescue inhaler with me when I go out” (78%), “stay inside and avoid going outside as much as possible” (61%), “try to avoid my known outdoor triggers” (58%), “turn on AC/heat” (45%), and “shut windows/doors” (38%) (Supplementary Figure S1). Participants with asthma with low (vs. high) education levels were more likely to take the following actions: “bring my rescue inhaler with me when I go out” [OR = 1.53, 95% CI (0.94, 2.49), p = 0.08], “bring it up with my doctor” [OR = 2.81, 95% CI (0.99, 7.95), p = 0.05], and “talk with my family and friends” [OR = 2.39, 95% CI (0.89, 6.41), p = 0.08], (Supplementary Table S21). Significant differences by income and exposure were inconsistent (Supplementary Tables S22, S23).
Discussion
This study is one of the first to evaluate perceptions of environmental impact among participants with asthma and COPD using a self-management digital health platform. Findings show that participants with asthma and COPD perceive an impact of multiple environmental factors on their respiratory disease symptoms, and they seek out environmental information daily through a variety of sources, with a preference for mobile apps and TV. Participants with COPD were more likely than those with asthma to seek information from a variety of sources. While most respondents were familiar with environmental factors such as mold, pollen and air pollution as defined by the AQI, specific air pollutants were far less familiar.
Preferred Sources for Environmental Information
Almost all participants reported seeking information about air pollution daily. This finding is supported with Health Information-Seeking Behavior (HISB) literature, which explores the contextual factors that influence how individuals obtain information to better understand their health (20, 21). Disease severity has been associated with more active HISB (22). In this study, a majority of participants with asthma were not controlled at enrollment (82.6% ACT score <20) and one third of participants with COPD experienced high disease burden at enrollment (33.8% CAT score > 20), which may have encouraged the more active HISB seen within participants in this study. As seen in the literature, HISB can lead to improved knowledge, self-management, empowerment and symptoms (21, 22). Evaluating the impact of HISB on clinical outcomes was outside the scope of this study, but should be evaluated in future studies.
Participants with COPD were more likely to seek information about air pollution than those with asthma, and around twice as likely to rely on mobile apps, TV reports, and social media, despite older mean age. This pattern may reflect the progressive, daily impact of COPD on people's lives. Additionally, older (23) and lower-SES populations (24) tend to watch TV more frequently than their respective counterparts.
Participants sought air pollution information from an average of 3 sources. Similar findings have been reported in other populations where patients used 3–6 health information resources (25, 26) in order to validate their information (20). The use of any source will be influenced by its accessibility and credibility, which may vary for different populations (20).
Digital sources of information were popular among the majority of participants, likely driven by the convenience of on-demand, updated information. Hesse et al. (27) reported that although most patients wanted to go to physicians for health information, they actually went to the internet first, likely due to availability and convenience. In a study of 176 patients with COPD, Stellefson et al. (28) found that most used digital modalities to find health information, with no age-related differences. It was hypothesized that increased mobile device ownership may transition self-management of chronic diseases to mobile apps (28). Although these studies are part of a growing body of literature exploring the use of digital communication tools for self-management, many are limited in robustness or population representativeness, and more research is required to draw conclusions (28).
Knowledge and Perceptions of Environmental Influence
Participants with asthma and COPD strongly perceived that environmental factors like ambient outdoor exposure, including pollen and air pollution, impacted their symptoms. Interestingly, most asthma (84%) and COPD participants (84%) were aware of air pollution (as defined by AQI) but were far less familiar with individual pollutants including PM, O3, NO2, and SO2. Studies have shown that increased awareness of AQI leads to greater risk perception of air pollution, which has been associated with better self-management in patients with chronic respiratory disease (29–32). For example, Wen et al. (29) reported that up to 75% of adults with asthma would change their outdoor activity patterns as a result of AQI alerts. Therefore, communicating information about AQI levels may help to mitigate exposure. However, in order to practice more targeted self-management strategies, it may be important to educate patients with asthma and COPD about specific air pollutants that may impact their health (33). For example, perceiving that O3 exposure negatively impacts chronic respiratory disease and knowing that O3 levels are highest during high-traffic, high-sunlight hours could help someone avoid the outdoors during those times (34). More focused efforts to provide education about specific air pollutants should therefore be made, but must balance detailed information with ease of presentation and usability.
Interestingly, participants perceived pollen as influencing symptoms in participants with both asthma and COPD, even though there is limited evidence documenting an allergic phenotype in COPD. Jamieson et al. (35) found that allergic status was associated with a higher risk of cough, wheeze, and exacerbations requiring treatment or an acute healthcare visit in a subset of people with COPD. However, further research is needed to define the allergic phenotype of COPD and understand its impact on COPD symptoms. Additionally, a higher percentage of participants perceived pollen and mold to influence their symptoms compared to smoking or secondhand smoke, which is unexpected given the strong evidence linking tobacco to these health outcomes compared to the limited evidence for pollen and mold. While it is possible that participants in this sample do not smoke or live in a home with smokers, we did not collect this information.
Sense of Agency to Practice Self-Management
Most participants believed that they could limit or reduce the impact of environmental factors on their symptoms. This may be a function of knowledge of the disease or environmental factors, confidence in self-management, or participant characteristics. Improved understanding of how respiratory disease can be influenced by environmental factors may help to increase confidence in reducing their impact.
Self-management strategies like mitigation and avoidance of triggers and irritants are recommended as an effective way to improve health outcomes in asthma and COPD (34–37). In this study, the top five most frequent actions reported by participants with asthma in response to a “poor” Propeller Asthma Forecast all have been cited as examples of effective self-management strategies. Interestingly, some significant differences were found by education level, wherein asthma participants with lower education levels were more likely to bring their rescue inhaler when going out and discuss the “poor” reading with a doctor, family, and friends.
Limitations
The findings from this study should be considered within the context of several limitations. The survey relied on self-reported data from self-selected digital health platform users and self-selected survey respondents who were possibly more engaged in their disease management and more open to digital health, thereby introducing selection bias. Differences in important factors such as education, income, race, and language between digital health users and non-users as well as survey responders and non-responders could not be assessed because of limited information availability. Lack of differences seen in this analysis across levels of education and income may be due to the homogeneity of the study population, which was overwhelmingly White and female. Additionally, low-SES populations may have faced barriers to participation in this survey since having access to email and a smartphone was required to be eligible for this study, thereby possibly introducing additional bias. Survey design and wording may have influenced the way in which respondents answered questions, and therefore findings should be confirmed with validated scales.
Conclusions
In conclusion, this study found that participants with asthma and COPD strongly perceive a relationship between their respiratory symptoms and their environment and regularly seek out environmental information daily from apps and TV. These findings can inform digital health app development by further describing the frequency (e.g., daily vs. hourly), type (pollen, weather and air pollution), delivery (app vs. social media), visualization and level of detail (e.g., AQI vs. specific pollutant) of information that users seek to guide their self-management for respiratory disease. For instance, utilizing mobile apps to educate patients in visual, concise and compelling ways about how environmental factors influence respiratory disease may be an effective and acceptable education strategy for both people with asthma and COPD. Additionally, providing a reliable and convenient source of environmental information daily within the app, and drawing the connection to associations with respiratory symptoms, such as through the Asthma Forecast, can provide actionable information for their daily self-management and may enhance feelings of agency. Results from this study can inform the refinement of these app experiences. However, these topics are understudied and further research is needed.
Data Availability Statement
The medication use and survey response data that supported this study are not publicly available because they are considered Protected Health Information (PHI) under the Health Insurance Portability and Accountability Act of 1996 (HIPAA) in the US, and as such are only accessible under specific authorization of access following HIPAA guidelines. The air pollution data can be accessed at the EPA Air Quality Management System (https://www.epa.gov/aqs). Requests to access the datasets should be directed to bWVyZWRpdGguYmFycmV0dEByZXNtZWQuY29t.
Ethics Statement
The studies involving human participants were reviewed and approved by the Copernicus Independent Review Board (Protocol # 20191728). The patients/participants provided their written informed consent to participate in this study.
Author Contributions
KH, RG, LK, and MB conceived of the research idea and contributed to data collection. KH and MB obtained research funding. SP, RG, and ER conducted the analyses. SP, MB, and RG wrote the manuscript. All authors interpreted the results, critically reviewed the manuscript, edited, and approved the submitted version.
Funding
This research was supported in part by Cooperative Agreement Number 5U38OT000143-05 awarded to the Council of State and Territorial Epidemiologists (CSTE) by the Centers for Disease Control and Prevention (CDC) and Climate and Health Program's Center for State, Tribal, Local, and Territorial (CSTLTS) Grant.
Author Disclaimer
The contents of the report are solely the responsibility of the authors and do not necessarily represent the official position of the CDC.
Conflict of Interest
KH, RG, and ER were employees of Propeller Health during the work and received salary and stock options. RG was employed by ResMed Inc. LK and MB were Propeller employees previously and are currently employees of ResMed, which acquired Propeller Health and receive salary, stock, and have pending intellectual property filings related to Propeller products. SP was a part-time employee at ResMed during the development of the manuscript. MB had full access to all data in this study and takes complete responsibility for the integrity of its analysis. AT was employed by Council of State and Territorial Epidemiologists.
Publisher's Note
All claims expressed in this article are solely those of the authors and do not necessarily represent those of their affiliated organizations, or those of the publisher, the editors and the reviewers. Any product that may be evaluated in this article, or claim that may be made by its manufacturer, is not guaranteed or endorsed by the publisher.
Acknowledgments
We thank Claudia Brown and Paul Schramm at the CDC and the CSTE Climate and Health Equity working group, for feedback on the results.
Supplementary Material
The Supplementary Material for this article can be found online at: https://www.frontiersin.org/articles/10.3389/fdgth.2022.748400/full#supplementary-material
References
1. Soriano JB, Abajobir AA, Abate KH, Abera SF, Agrawal A, Ahmed MB, et al. Global, regional, and national deaths, prevalence, disability-adjusted life years, and years lived with disability for chronic obstructive pulmonary disease and asthma, 1990–2015: a systematic analysis for the Global Burden of Disease Study 2015. Lancet Respir Med. (2017) 5:691–706. doi: 10.1016/S2213-2600(17)30293-X
2. National Center for Health Statistics. FastStats: Asthma. Centers for Disease Control and Prevention (2019). Available online at: https://www.cdc.gov/nchs/fastats/asthma.htm (accessed December 10, 2019).
3. Centers for Disease Control Prevention. Chronic Obstructive Pulmonary Disease (COPD): Data and Statistics. Centers for Disease Control and Prevention (2019). Available online at: https://www.cdc.gov/copd/data.html (accessed March 5, 2020).
4. Nurmagambetov T, Kuwahara R, Garbe P. The economic burden of asthma in the United States, 2008-2013. Ann Am Thorac Soc. (2018) 15:348–56. doi: 10.1513/AnnalsATS.201703-259OC
5. Centers for Disease Control Prevention. Chronic Obstructive Pulmonary Disease (COPD): COPD Costs. Centers for Disease Control and Prevention (2019). Available online at: https://www.cdc.gov/copd/infographics/copd-costs.html (accessed October 26, 2020).
6. Liu Y, Pan J, Zhang H, Shi C, Li G, Peng Z, et al. Short-term exposure to ambient air pollution and asthma mortality. Am J Respir Crit Care Med. (2019) 200:24–32. doi: 10.1164/rccm.201810-1823OC
7. Li M-H, Fan L-C, Mao B, Yang J-W, Choi AMK, Cao W-J, et al. Short-term exposure to ambient fine particulate matter increases hospitalizations and mortality in COPD: a systematic review and meta-analysis. Chest. (2016) 149:447–58. doi: 10.1378/chest.15-0513
8. Thurston GD, Balmes JR, Garcia E, Gilliland FD, Rice MB, Schikowski T, et al. Outdoor air pollution and new-onset airway disease. An official American thoracic society workshop report. Ann Am Thorac Soc. (2020) 17:387–98. doi: 10.1513/AnnalsATS.202001-046ST
9. Woods ER. Community asthma initiative to improve health outcomes and reduce disparities among children with asthma. MMWR Suppl. (2016) 65:11–20. doi: 10.15585/mmwr.su6501a4
10. Centers for Disease Control Prevention. Asthma: Most Recent National Asthma Data. Centers for Disease Control and Prevention (2020). Available online at: https://www.cdc.gov/asthma/most_recent_national_asthma_data.htm (accessed December 7, 2020).
11. Grant EN, Lyttle CS, Weiss KB. The relation of socioeconomic factors and racial/ethnic differences in US asthma mortality. Am J Public Health. (2000) 90:1923–5. doi: 10.2105/AJPH.90.12.1923
12. National Center for Health Statistics. Data Briefs: Chronic Obstructive Pulmonary Disease Among Adults Aged 18 and Over in the United States, 1998-2009. June 2011. Centers for Disease Control and Prevention (2019). Available online at: https://www.cdc.gov/nchs/products/databriefs/db63.htm (accessed March 15, 2020).
13. National Heart Lung and Blood Institute. Expert Panel Report 3: Guidelines for the Diagnosis and Management of Asthma. Bethesda (MD): U.S. Department of Health and Human Services; National Heart Lung, and Blood Institute; National Asthma Education and Prevention Program (US). National Heart, Lung, and Blood Institute (2007).
14. Kiser K, Jonas D, Warner Z, Scanlon K, Shilliday BB, DeWalt DA. A randomized controlled trial of a literacy-sensitive self-management intervention for chronic obstructive pulmonary disease patients. J Gen Intern Med. (2012) 27:190–5. doi: 10.1007/s11606-011-1867-6
15. Barrett M, Combs V, Su JG, Henderson K, Tuffli M, AIR Louisville Collaborative, et al. AIR louisville: addressing asthma with technology, crowdsourcing, cross-sector collaboration, and policy. Health Aff Proj Hope. (2018) 37:525–34. doi: 10.1377/hlthaff.2017.1315
16. Merchant R, Inamdar R, Henderson K, Barrett M, Su JG, Riley J, et al. Digital health intervention for asthma: patient-reported value and usability. JMIR MHealth UHealth. (2018) 6:e133. doi: 10.2196/mhealth.7362
17. American Thoracic Society Sleep Respiratory Neurobiology. Sleep Related Questionnaires: Asthma Control Test (ACT). American Thoracic Society. Available online at: https://www.thoracic.org/members/assemblies/assemblies/srn/questionaires/act.php (accessed April 22, 2020).
18. American Thoracic Society Sleep Respiratory Neurobiology. Sleep Related Questionnaires: COPD Assessment Test (CAT). Available online at: https://www.thoracic.org/members/assemblies/assemblies/srn/questionaires/copd.php (accessed April 22, 2020).
19. R: The R Project for Statistical Computing. Available online at: https://www.r-project.org/ (accessed November 4, 2020).
20. Lambert SD, Loiselle CG. Health information—seeking behavior. Qual Health Res. (2007) 17:1006–19. doi: 10.1177/1049732307305199
21. Jacobs W, Amuta AO, Jeon KC. Health information seeking in the digital age: an analysis of health information seeking behavior among US adults. Alvares C, editor. Cogent Soc Sci. (2017) 3:1302785. doi: 10.1080/23311886.2017.1302785
22. Martinez CH, St Jean BL, Plauschinat CA, Rogers B, Beresford J, Martinez FJ, et al. Internet access and use by COPD patients in the National Emphysema/COPD Association Survey. BMC Pulm Med. (2014) 14:66. doi: 10.1186/1471-2466-14-66
23. Depp CA, Schkade DA, Thompson WK, Jeste DV. Age, affective experience, and television use. Am J Prev Med. (2010) 39:173–8. doi: 10.1016/j.amepre.2010.03.020
24. Nielsen. The Total Audience Report: Q3 2015. Nielsen. Available online at: https://www.nielsen.com/us/en/insights/report/2015/the-total-audience-report-q3-2015 (accessed June 3, 2020).
25. Savolainen R. Source preferences in the context of seeking problem-specific information. Inf Process Manag. (2008) 44:274–93. doi: 10.1016/j.ipm.2007.02.008
26. Cutilli C. Seeking health information: what sources do your patients use? Orthop Nurs Natl Assoc Orthop Nurses. (2009) 29:214–9. doi: 10.1097/NOR.0b013e3181db5471
27. Hesse BW, Nelson DE, Kreps GL, Croyle RT, Arora NK, Rimer BK, et al. Trust and sources of health information: the impact of the internet and its implications for health care providers: findings from the first health information national trends survey. Arch Intern Med. (2005) 165:2618–24. doi: 10.1001/archinte.165.22.2618
28. Stellefson ML, Shuster JJ, Chaney BH, Paige SR, Alber JM, Chaney JD, et al. Web-based health information seeking and eHealth literacy among patients living with chronic obstructive pulmonary disease (COPD). Health Commun. (2018) 33:1410–24. doi: 10.1080/10410236.2017.1353868
29. Wen X-J, Balluz L, Mokdad A. Association between media alerts of air quality index and change of outdoor activity among adult asthma in six states, BRFSS, 2005. J Community Health. (2009) 34:40–6. doi: 10.1007/s10900-008-9126-4
30. Mirabelli MC, Boehmer TK, Damon SA, Sircar KD, Wall HK, Yip FY, et al. Air quality awareness among U.S. adults with respiratory and heart disease. Am J Prev Med. (2018) 54:679–87. doi: 10.1016/j.amepre.2018.01.037
31. Loh P, Sugerman-Brozan J, Wiggins S, Noiles D, Archibald C. From asthma to AirBeat: community-driven monitoring of fine particles and black carbon in Roxbury, Massachusetts. Environ Health Perspect. (2002) 110(Suppl. 2):297–301. doi: 10.1289/ehp.02110s2297
32. Minkler M, Vásquez VB, Shepard P. Promoting environmental health policy through community based participatory research: a case study from Harlem, New York. J Urban Health. (2006) 83:101–10. doi: 10.1007/s11524-005-9010-9
33. Beaumont R, Hamilton RS, Machin N, Perks J, Williams ID. Social awareness of air quality information. Sci Total Environ. (1999) 235:319–29. doi: 10.1016/S0048-9697(99)00215-6
35. Jamieson DB, Matsui EC, Belli A, McCormack MC, Peng E, Pierre-Louis S, et al. Effects of allergic phenotype on respiratory symptoms and exacerbations in patients with chronic obstructive pulmonary disease. Am J Respir Crit Care Med. (2013) 188:187–92. doi: 10.1164/rccm.201211-2103OC
36. Gautier C, Charpin D. Environmental triggers and avoidance in the management of asthma. J Asthma Allergy. (2017) 10:47–56. doi: 10.2147/JAA.S121276
Keywords: environmental exposures, asthma, COPD, SES, digital health, self-management, smartphone app, health information
Citation: Parikh S, Henderson K, Gondalia R, Kaye L, Remmelink E, Thompson A and Barrett M (2022) Perceptions of Environmental Influence and Environmental Information-Seeking Behavior Among People With Asthma and COPD. Front. Digit. Health 4:748400. doi: 10.3389/fdgth.2022.748400
Received: 27 July 2021; Accepted: 06 April 2022;
Published: 03 May 2022.
Edited by:
Dean Ho, National University of Singapore, SingaporeReviewed by:
Paraskevi Papadopoulou, American College of Greece, GreeceTerri Elizabeth Workman, George Washington University, United States
Copyright © 2022 Parikh, Henderson, Gondalia, Kaye, Remmelink, Thompson and Barrett. This is an open-access article distributed under the terms of the Creative Commons Attribution License (CC BY). The use, distribution or reproduction in other forums is permitted, provided the original author(s) and the copyright owner(s) are credited and that the original publication in this journal is cited, in accordance with accepted academic practice. No use, distribution or reproduction is permitted which does not comply with these terms.
*Correspondence: Meredith Barrett, bWVyZWRpdGguYmFycmV0dEByZXNtZWQuY29t
†These authors have contributed equally to this work and share first authorship