Abstract
Background:
The adoption of health technologies is key to empower research participants and collect quality data. However, the acceptance of health technologies is usually evaluated in patients or healthcare practitioners, but not in clinical research participants.
Methods:
A 27-item online questionnaire was provided to the 11,695 members of a nutrition clinical research participant database from the Nantes area (France), to assess (1) participants' social and demography parameters, (2) equipment and usage of health apps and devices, (3) expectations in research setting and (4) opinion about the future of clinical research. Each item was described using frequency and percentage overall and by age classes. A global proportion comparison was performed using chi-square or Fisher-exact tests.
Results:
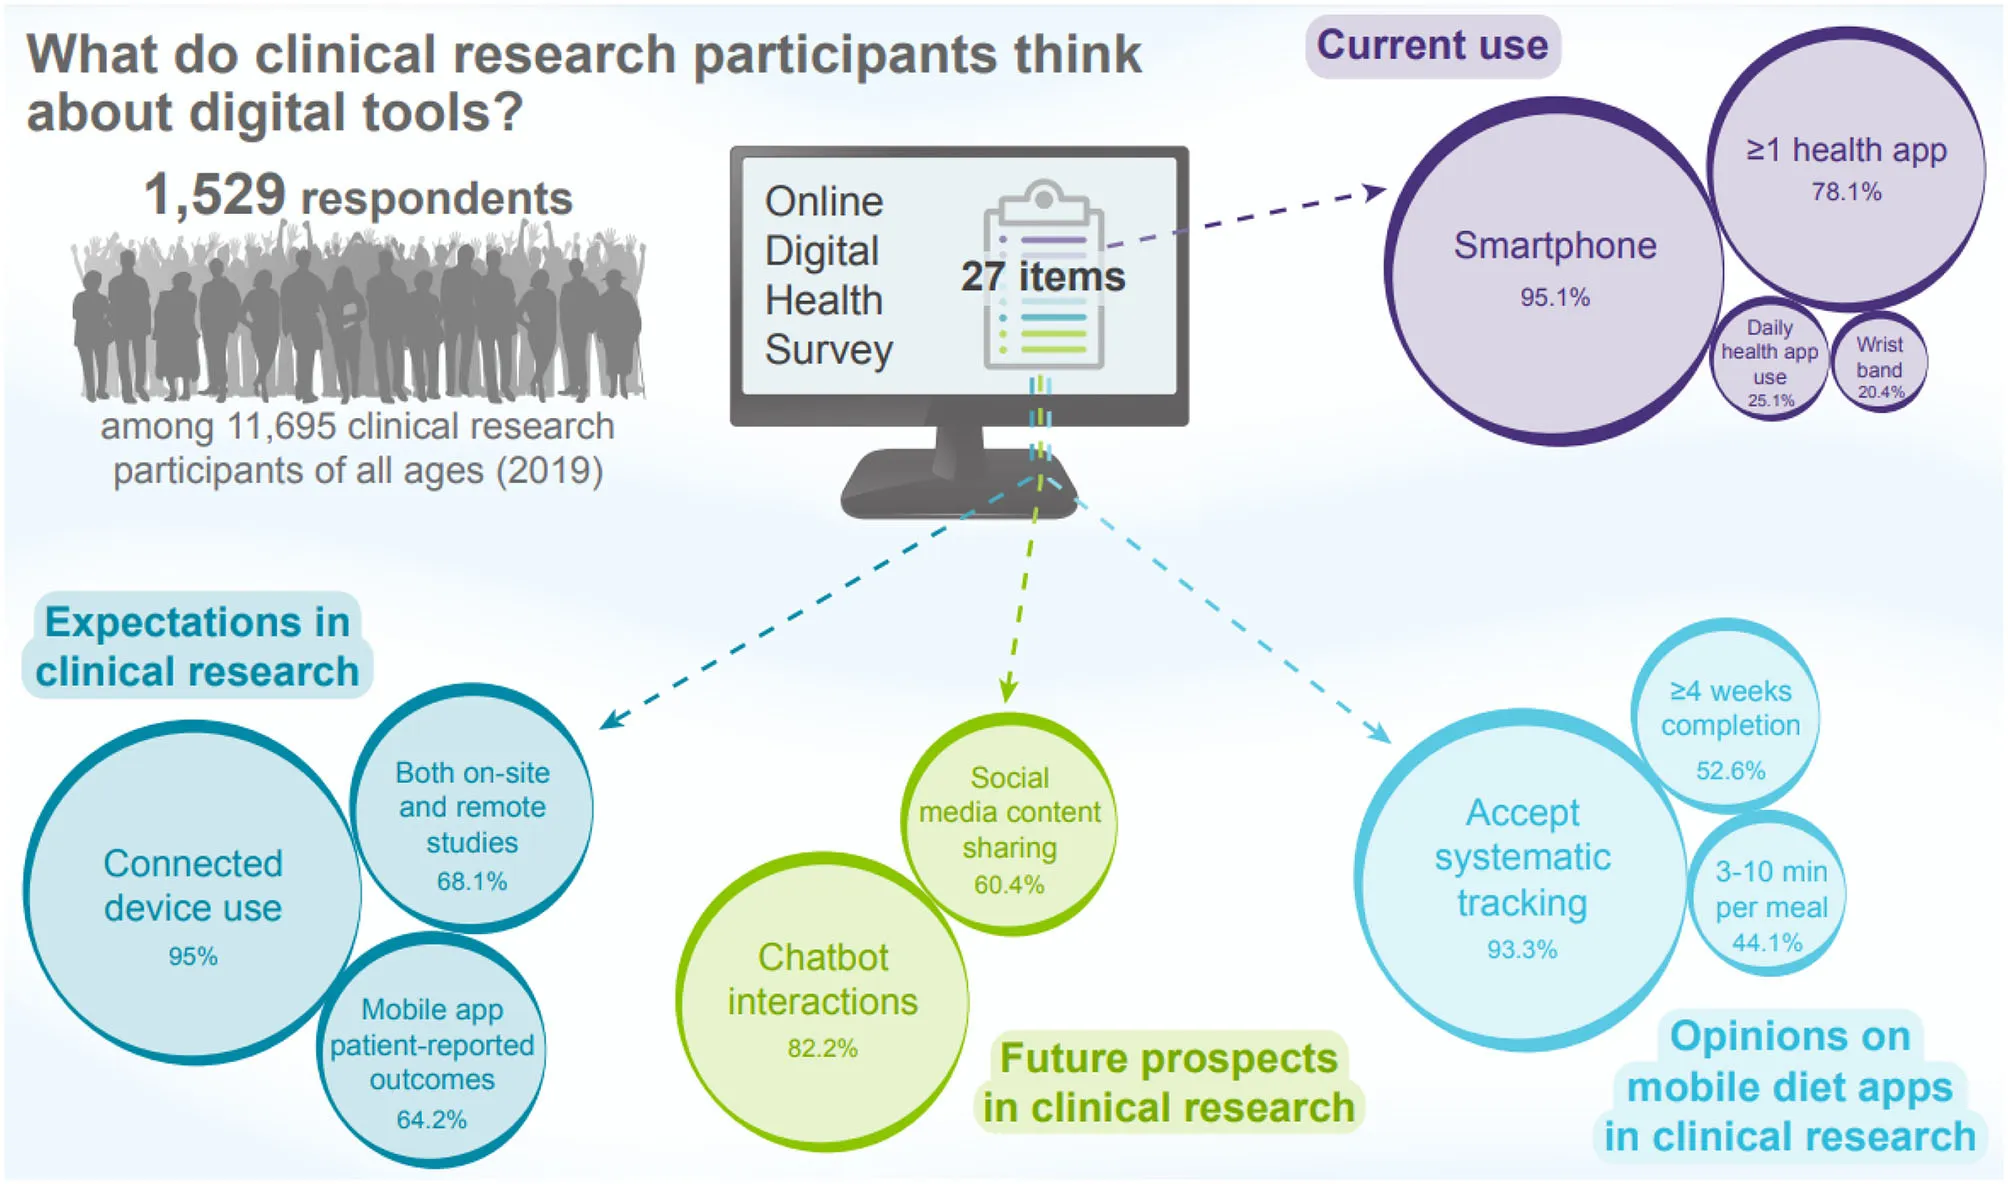
A total of 1529 respondents (81.0% women, 19.0% men) completed the survey. Main uses of health apps included physical activity tracking (54.7%, age-related group difference, p < 0.001) and food quality assessment (45.7%, unrelated to age groups). Overall, 20.4% of respondents declared owning a connected wristband or watch. Most participants (93.8%) expected the use of connected devices in research. However, protection of personal data (37.5%), reliability (35.5%) and skilled use of devices (28.5%) were perceived as the main barriers. Most participants (93.3%) would agree to track their food intake using a mobile app, and 80.5% would complete it for at least a week while taking part in a clinical study. Only 13.2% would devote more than 10 min per meal to such record. A majority (60.4%) of respondents would accept to share their social media posts in an anonymous way and most (82.2%) of them would accept to interact with a chatbot for research purposes.
Conclusions:
Our cross-sectional study suggests that clinical study participants are enthusiastic about all forms of digital health technologies and participant-centered studies but remain concerned about the use of personal data. Repeated assessments are suggested to evaluate the research participant's interest in technologies following the increase in use and demand for innovative health services during the pandemic of COVID-19.
Attitudes and expectations of clinical research participants towards digital health and mobile dietary assessment tools: Main results of a cross-sectional survey study.
Introduction
Patients and Health Care Workers Attitudes Toward Digital Health
There is an increasing use and demand in health technologies going hand in hand with hardware penetration in the global population (1) and the overall automation of daily life, expected to improve society, economy and quality of life (2). While public awareness in digital health is rising (3), attitudes toward health technologies may vary, as some users can be interested in managing appointments and the self-tracking of fitness, diet (4), or vital signs (3, 5) as reflected by recent surveys (3, 4). Recently, patients reported the frequent use of health technologies, including websites (while decreasing), mobile apps, electronic medical records, with a noticeable trend for wearable and smart devices as well as social media (3). Intention to use such technologies has been assessed in samples of patients (6–8), students (9), health workers (10) and in multiple groups at the same time (11–13) to identify demographic or socio-economic determinants of the successful implementation of health technologies. However, these determinants are not usually evaluated in groups of clinical study participants specifically, and it is not known whether the recent trends associated with the use of health technologies are consistent with expectations from research participants in clinical settings.
The Specific Case of Clinical Research Participants
Volunteering for a clinical study is a personal choice (14), which can be driven by the potential of benefiting personally as well as the possibility to help others (15): Despite the risks associated with the exposure to novel methods and solutions, research participants remain motivated by a desire to contribute to science (16). We can therefore expect that study participants are keen to complete study-specific surveys, monitor their vital signs, or share their health information with investigators. Patient empowerment has been defined by Affinito et al. as “the control of patients over their health and condition, as well as their ability to be more involved in their healthcare” (17). The digital transformation of healthcare allows patients to manage their conditions by facilitating diagnosis, prevention, and treatment (17–19). Therefore, the implementation of mobile technologies in clinical research represents an opportunity to facilitate and streamline the collection of quality data (20), inform clinical care and decision-making (21) while emancipating research participants (22). While participant engagement is getting more attention from sponsors (23), multiple tools may be implemented to collect more data and empower research participants. However, it was reported that the average number of protocol endpoints and procedures recently doubled in <10 years to support secondary and exploratory parameters (24). In a context of clinical research transformation supported by the use of technology, the overuse of tools or the use of inappropriate ones may bear the risks of unnecessary burden and lack of compliance, leading to missing or incorrect data and early dropout (21). Assessing participants' equipment and intention to use tech-enabled health solutions is key to ensuring the scientific validity of research studies. Still, only a few studies recently evaluated how health technologies are perceived among clinical study participants. One study recently evaluated the indicators of retention of a large sample of research participants in remote, digital setting (25). Some initiatives, like the Trial Feedback Questionnaire (26) were developed and may be used to gather participant feedbacks on the tools that are used in clinical studies. However, this questionnaire can only be used in a single indication or study at a time and after completion, preventing a proactive implementation in research settings (27). Meanwhile, quality and relevance of research can be improved by patient and public involvement in research, which is not systematically considered in research protocols (28).
Survey Objectives
As clinical research participants are conclusively affected by study designs and by the implementation of technologies (28), we considered them as our survey study population. Our objective was to evaluate their attitudes and expectations toward digital patient-generated health data and food tracking mobile apps and understand if their choices are associated with age groups.
Methods
Survey Design
Surveys are a cost-effective and non-interventional option to collect qualitative and semi-quantitative information to enable further research (29). An original survey was designed to understand expectations and concerns of clinical research participants toward digital health. A brief introduction was provided to describe the aims of the survey. The first section was designed to collect social and demography parameters. As research participants often have the possibility of bringing their own pocket-sized solutions instead of being provided with study-specific hardware, it was decided to investigate their equipment and their expectations in clinical research separately. Current equipment was assessed in a second section, while expectations in research settings were investigated in a third one. Furthermore, the appeal for rather advanced technologies which are not commonly used, such as sharing of social media posts and interactions with chatbots, is not frequently evaluated. As the sharing of such information can be perceived as controversial, those items were explored separately at the end of the questionnaire and was the purpose of a fourth section. Due to the limited published work investigating research participants interest and expectations toward in digital health, main items were designed to understand appeal for popular technologies (3–5), and understand concerns raised by their implementation in research. The use of free text was avoided as much as possible to focus on qualitative modalities. In this study, we referred to “connected devices” when assessing participant's interest in wearable and non-wearable smart health monitoring solutions.
Items of the survey were provided to members of the personnel affiliated to the sponsor and investigator to gather feedback during its design phase. The list of items was eventually narrowed down to a 27-item multiple-choice questionnaire (Additional File 1). To avoid underestimation of both expectations and especially concerns associated with the use of digital tools, it was decided not to limit the number of answers when selecting the modalities. Questions were formulated to limit ambiguity as much as possible.
Recruitment of Respondents
No health or personal data was collected as the survey items were designed to avoid the collection of sensitive or personally identifiable information. Participants were considered eligible to participate in this survey study if they were 18 years old or older, and currently screened or enrolled in a clinical study. Former clinical research participants were also considered eligible. No quota-based sampling was performed. A total of 11,695 members (8,386 women, 3,309 men) of a clinical research participant database (owned by Biofortis) from the Nantes region in France were contacted by email in May 2019 to read an information sheet and complete this anonymous questionnaire. The entire panel was contacted. The participating site, specialized in the conduct of nutrition clinical studies, was selected based on the research team's interest in the survey study and their ability to recruit a large sample of respondents from various age ranges and conditions, including healthy volunteers.
Participants completed an online version of the questionnaire hosted on Microsoft Forms (30) which allowed them to remain anonymous. No individually identifiable information or health data was collected, and no risk associated with data privacy was identified. Following a legal opinion from an independent expert consultant, this survey was not considered a clinical study requiring approval from an independent ethics committee. The survey was available online from the 23rd of May 2019 to the 1st of July 2019. No reminders were sent during this period.
Statistical Analyses
Each item of the survey was described using frequency and percentage overall and by age classes. For each item, a global proportion comparison was performed between the age classes using the chi-square test, or the Fisher-exact test if any expected cell count was inferior to 5 as an alternative to the chi-square test. In case of global effect, pairwise proportion comparisons between age classes were completed using chi-square test or Fisher-exact test accordingly. The results of comparisons were adjusted to account for multiple comparisons according to the Bonferroni-Holm method. All analyses were performed using SAS v9.4®. A margin error of 5% was used for statistical tests.
Results
Study Participants
All 11,695 members of the clinical research participants database (8,386 women, 3,309 men) were contacted to complete our survey. Among the 1,529 respondents who completed the survey, 81.0% were female (Figure 1). A share of 14.77% of women accepted to complete the survey (1239/8386), while 8.76% of men (290/3309) completed it. Most of respondents were aged 25–54 years old (64.9%) and lived in medium-size (10,000–50,000 inhabitants) and large cities (>50,000 inhabitants) (28.6 and 40.0%, respectively). While 35.4% of them had received primary education, 15.0% reached third level education. However, 11.1% declared having not received any formal education (Table 1).
Figure 1
Table 1
| Age class (years) | Total N = 1,529 | 18–24 | 25–34 | 35–44 | 45–54 | 55–64 | ≥65 |
|---|---|---|---|---|---|---|---|
| Number of respondents | – | 102 (6.7%) | 337 (22.0%) | 350 (22.9%) | 306 (20.0%) | 265 (17.3%) | 169 (11.1%) |
| Sex | |||||||
| Female | 1,238 (81.0%) | 88 (86.3%) | 274 (81.3%) | 290 (82.9%) | 243 (79.4%) | 211 (79.6%) | 132 (78.1%) |
| Male | 291 (19.0%) | 14 (13.7%) | 63 (18.7%) | 60 (17.1%) | 63 (20.6%) | 54 (20.4%) | 37 (21.9%) |
| Place of residence | |||||||
| Large city (over 50,000 inhabitants) | 612 (40.0%) | 57 (55.9%) | 137 (40.7%) | 117 (33.4%) | 122 (39.9%) | 112 (42.3%) | 67 (39.6%) |
| Medium-sized city (10,000–50,000 inhabitants) | 438 (28.6%) | 28 (27.5%) | 105 (31.2%) | 98 (28.0%) | 83 (27.1%) | 76 (28.7%) | 48 (28.4%) |
| Small city (2,000–10,000 inhabitants) | 380 (24.9%) | 15 (14.7%) | 78 (23.1%) | 106 (30.3%) | 79 (25.8%) | 61 (23.0%) | 41 (24.3%) |
| Village (<2,000 inhabitants) | 99 (6.5%) | 2 (2.0%) | 17 (5.0%) | 29 (8.3%) | 22 (7.2%) | 16 (6.0%) | 13 (7.7%) |
| Level of education | |||||||
| Primary education | 541 (35.4%) | 31 (30.4%) | 109 (32.3%) | 120 (34.3%) | 93 (30.4%) | 103 (38.9%) | 85 (50.3%) |
| Lower secondary education | 372 (24.3%) | 16 (15.7%) | 73 (21.7%) | 91 (26.0%) | 97 (31.7%) | 65 (24.5%) | 30 (17.8%) |
| Secondary education | 216 (14.1%) | 28 (27.5%) | 58 (17.2%) | 47 (13.4%) | 29 (9.5%) | 38 (14.3%) | 16 (9.5%) |
| Third level | 230 (15.0%) | 22 (21.6%) | 63 (18.7%) | 68 (19.4%) | 42 (13.7%) | 24 (9.1%) | 11 (6.5%) |
| No formal education | 170 (11.1%) | 5 (4.9%) | 34 (10.1%) | 24 (6.9%) | 45 (14.7%) | 35 (13.2%) | 27 (16.0%) |
Demography of respondents.
Smartphone Use, Expectations and Concerns
Most (95.1%) reported owning a smartphone, with the younger age-classes (18–44 years; 100% in the 18–24, 98.8% in the 25–34 and 98.8% in the 35–44) showing a marked difference with the oldest (45 and over; 93.8% in the 45–54, 91.7% in the 55–64 and 84.6% in the 65 and over) (p < 0.001).
Regarding the use of health-related mobile apps, 78.1% of participants declared using at least one of them and 54.6% declared using two or more of them. Statistically significant differences were observed between age groups (p < 0.001): 71.6% of the participants aged 18–24 and 64.5% aged 25–34 declared using at least two health-related mobile apps whereas they were 45.3% aged 55–64 and 32.2% aged 65 or over to report the same use. However, there was no between-age-groups difference regarding neither the frequency of use of such apps (p = 0.093) with a majority of participants (76.2%) using them at least once a week, nor the duration of use (p = 0.376) with a majority of participants declaring a duration of 1–5 min per use (56.6%).
The main expectation toward such apps was the ability to monitor their physical activity (54.7%) which was more prevalent (p < 0.001) in the participants up to 44 years (ranging from 57.6 to 63.7%) as compared to the oldest ones from 55 and over (ranging from 43.2 to 53.6%). The ability to assess food quality arrived second (45.7%) without between-age-group difference. About one third of the study participants pointed out weight loss monitoring, with a preference for the individuals up to 44 years (p < 0.001). Other marked expectations included maintaining/improving their health and sleep monitoring. The latter was age dependent (p < 0.001) as it appeared particularly important for the youngest participants (51% of the 18–24 years old) and not that much for the ones aged 65 and over (17.2%). Interestingly, few (7.8%) declared having no expectation, but the feature was more present in the oldest classes (p < 0.001). Details about other expectations are provided in Table 2.
Table 2
| Total | 18–24 years | 25–34 years | 35–44 years | 45–54 years | 55–64 years | 65 years or over | Global p-value | |
|---|---|---|---|---|---|---|---|---|
| A | B | C | D | E | F | |||
| Do you own a smartphone? | ||||||||
| N= 1,529 | N= 102 | N= 337 | N= 350 | N= 306 | N= 265 | N= 169 | ||
| No | 75 (4.9%) | 0 (0.0%) | 4 (1.2%) | 4 (1.1%) | 19 (6.2%) | 22 (8.3%) | 26 (15.4%) | <0.001 |
| Yes | 1454 (95.1%) | 102 (100.0%) | 333 (98.8%) | 346 (98.9%) | 287 (93.8%) | 243 (91.7%) | 143 (84.6%) | |
| Significant difference with other age class | – | D E F | D E F | D E F | A B C F | A B C | A B C D | |
| If yes, how many health-related mobile apps do you use? (Nutrition, physical activity, weight, sleep, health coaching, well-being, meditation, etc.) | ||||||||
| N= 1,454 | N= 102 | N= 333 | N= 346 | N= 287 | N= 243 | N= 143 | ||
| None | 318 (21.9%) | 9 (8.8%) | 42 (12.6%) | 63 (18.2%) | 70 (24.4%) | 75 (30.9%) | 59 (41.3%) | <0.001 |
| One | 341 (23.5%) | 20 (19.6%) | 76 (22.8%) | 84 (24.3%) | 65 (22.6%) | 58 (23.9%) | 38 (26.6%) | |
| Two or three | 614 (42.2%) | 51 (50.0%) | 162 (48.6%) | 154 (44.5%) | 122 (42.5%) | 87 (35.8%) | 38 (26.6%) | |
| Four or more | 181 (12.4%) | 22 (21.6%) | 53 (15.9%) | 45 (13.0%) | 30 (10.5%) | 23 (9.5%) | 8 (5.6%) | |
| Significant difference with other age class | – | D E F | D E F | E F | A B F | A B C | A B C D | |
| If you use at least one health-related mobile app, please specify how often you use it | ||||||||
| N= 1,136 | N= 93 | N= 291 | N= 283 | N= 217 | N= 168 | N= 84 | ||
| Less than once a month | 83 (7.3%) | 5 (5.4%) | 22 (7.6%) | 18 (6.4%) | 20 (9.2%) | 14 (8.3%) | 4 (4.8%) | 0.093 |
| 1–3 times a month | 188 (16.5%) | 23 (24.7%) | 46 (15.8%) | 41 (14.5%) | 43 (19.8%) | 16 (9.5%) | 19 (22.6%) | |
| Once a week | 243 (21.4%) | 18 (19.4%) | 69 (23.7%) | 59 (20.8%) | 35 (16.1%) | 39 (23.2%) | 23 (27.4%) | |
| 2–5 times a week | 337 (29.7%) | 31 (33.3%) | 83 (28.5%) | 85 (30.0%) | 66 (30.4%) | 49 (29.2%) | 23 (27.4%) | |
| At least once a day | 285 (25.1%) | 16 (17.2%) | 71 (24.4%) | 80 (28.3%) | 53 (24.4%) | 50 (29.8%) | 15 (17.9%) | |
| Significant difference with other age class | – | – | – | – | – | – | – | |
| On average, how much time do you spend on these health apps per use? | ||||||||
| N= 1,136 | N= 93 | N= 291 | N= 283 | N= 217 | N= 168 | N= 84 | ||
| <1 min | 123 (10.8%) | 11 (11.8%) | 28 (9.6%) | 26 (9.2%) | 24 (11.1%) | 28 (16.7%) | 6 (7.1%) | 0.376 |
| 1–5 min | 643 (56.6%) | 55 (59.1%) | 165 (56.7%) | 168 (59.4%) | 115 (53.0%) | 91 (54.2%) | 49 (58.3%) | |
| Over 5 min | 370 (32.6%) | 27 (29.0%) | 98 (33.7%) | 89 (31.4%) | 78 (35.9%) | 49 (29.2%) | 29 (34.5%) | |
| Significant difference with other age class | – | – | – | – | – | – | – | |
Smartphone use by age class.
Global p-value, when significant; Age classes, Significant difference with other age classes; N = number of participants per age class.
The most frequently expressed concern toward such apps was the frequency of advertisements (46.6%) irrespective of the age class of the respondents. Data protection (37.0%) and lack of reliability (23.7%) were also frequently expressed, both showing a difference in prevalence between age groups (p < 0.001 and p = 0.002, respectively). The youngest (18–24 years) participants were less concerned about personal data protection and more about reliability issues than their older counterparts. Details about other perceived issues are provided in Table 3.
Table 3
| Total | 18–24 years | 25–34 years | 35–44 years | 45–54 years | 55–64 years | 65 years or over | Global p-value | |
|---|---|---|---|---|---|---|---|---|
| A | B | C | D | E | F | |||
| What are your main expectations from mobile health apps? | ||||||||
| N= 1,529 | N= 102 | N= 337 | N= 350 | N= 306 | N= 265 | N= 169 | ||
| Assessing of your physical activity | 836 (54.7%) | 65 (63.7%) | 194 (57.6%) | 218 (62.3%) | 164 (53.6%) | 122 (46.0%) | 73 (43.2%) | <0.001 |
| Significant difference with other age class | – | E F | E F | E F | – | A B C | A B C | |
| Monitoring your energy intake | 430 (28.1%) | 34 (33.3%) | 95 (28.2%) | 112 (32.0%) | 83 (27.1%) | 68 (25.7%) | 38 (22.5%) | 0.181 |
| Significant difference with other age class | – | – | – | – | – | – | – | |
| Weight loss monitoring | 577 (37.7%) | 49 (48.0%) | 154 (45.7%) | 140 (40.0%) | 116 (37.9%) | 76 (28.7%) | 42 (24.9%) | <0.001 |
| Significant difference with other age class | – | E F | E F | E F | F | A B C | A B C D | |
| Maintaining/improving your health | 502 (32.8%) | 35 (34.3%) | 102 (30.3%) | 116 (33.1%) | 107 (35.0%) | 92 (34.7%) | 50 (29.6%) | 0.702 |
| Significant difference with other age class | – | – | – | – | – | – | – | |
| Monitoring your sleep | 474 (31.0%) | 52 (51.0%) | 115 (34.1%) | 119 (34.0%) | 94 (30.7%) | 65 (24.5%) | 29 (17.2%) | <0.001 |
| Significant difference with other age class | – | B C D E F | A F | A F | A F | A | A B C D | |
| Assessing the quality of your food | 698 (45.7%) | 50 (49.0%) | 151 (44.8%) | 168 (48.0%) | 140 (45.8%) | 127 (47.9%) | 62 (36.7%) | 0.195 |
| Significant difference with other age class | – | – | – | – | – | – | – | |
| A meditation tool | 272 (17.8%) | 22 (21.6%) | 62 (18.4%) | 66 (18.9%) | 55 (18.0%) | 47 (17.7%) | 20 (11.8%) | 0.362 |
| Significant difference with other age class | – | – | – | – | – | – | – | |
| Weight maintenance monitoring | 240 (15.7%) | 12 (11.8%) | 50 (14.8%) | 61 (17.4%) | 42 (13.7%) | 47 (17.7%) | 28 (16.6%) | 0.549 |
| Significant difference with other age class | – | – | – | – | – | – | – | |
| Period or pregnancy tracking | 216 (14.1%) | 48 (47.1%) | 92 (27.3%) | 64 (18.3%) | 12 (3.9%) | 0 (0.0%) | 0 (0.0%) | <0.001 |
| Significant difference with other age class | – | B C D E F | A C D E F | A B D E F | A B C E F | A B C D | A B C D | |
| No expectations | 120 (7.8%) | 4 (3.9%) | 17 (5.0%) | 8 (2.3%) | 27 (8.8%) | 34 (12.8%) | 30 (17.8%) | <0.001 |
| Significant difference with other age class | – | F | E F | D E F | C F | B C | A B C D | |
| Monitoring a chronic condition | 82 (5.4%) | 4 (3.9%) | 15 (4.5%) | 19 (5.4%) | 23 (7.5%) | 15 (5.7%) | 6 (3.6%) | 0.427 |
| Significant difference with other age class | – | – | – | – | – | – | – | |
| Weight gain monitoring | 81 (5.3%) | 8 (7.8%) | 17 (5.0%) | 25 (7.1%) | 15 (4.9%) | 8 (3.0%) | 8 (4.7%) | 0.245 |
| Significant difference with other age class | – | – | – | – | – | – | – | |
| What are your main concerns about using health–related mobile apps? | ||||||||
| N= 1,529 | N= 102 | N= 337 | N= 350 | N= 306 | N= 265 | N= 169 | ||
| The frequency of adverts | 713 (46.6%) | 56 (54.9%) | 154 (45.7%) | 171 (48.9%) | 142 (46.4%) | 119 (44.9%) | 71 (42.0%) | 0.370 |
| Significant difference with other age class | – | – | – | – | – | – | – | |
| Protection of your personal data | 566 (37.0%) | 22 (21.6%) | 112 (33.2%) | 140 (40.0%) | 127 (41.5%) | 94 (35.5%) | 71 (42.0%) | 0.002 |
| Significant difference with other age class | – | C D F | – | A | A | – | A | |
| Lack of reliability | 362 (23.7%) | 37 (36.3%) | 118 (35.0%) | 77 (22.0%) | 65 (21.2%) | 43 (16.2%) | 22 (13.0%) | <0.001 |
| Significant difference with other age class | – | C D E F | C D E F | A B | A B | A B | A B | |
| Location tracking | 311 (20.3%) | 19 (18.6%) | 66 (19.6%) | 91 (26.0%) | 60 (19.6%) | 46 (17.4%) | 29 (17.2%) | 0.080 |
| Significant difference with other age class | – | – | – | – | – | – | – | |
| The need to create a personal account | 282 (18.4%) | 20 (19.6%) | 64 (19.0%) | 66 (18.9%) | 45 (14.7%) | 54 (20.4%) | 33 (19.5%) | 0.574 |
| Significant difference with other age class | – | – | – | – | – | – | – | |
| Too time–consuming | 251 (16.4%) | 17 (16.7%) | 50 (14.8%) | 57 (16.3%) | 55 (18.0%) | 55 (20.8%) | 17 (10.1%) | 0.082 |
| Significant difference with other age class | – | – | – | – | – | – | – | |
| Poorly designed interface | 220 (14.4%) | 20 (19.6%) | 60 (17.8%) | 58 (16.6%) | 41 (13.4%) | 35 (13.2%) | 6 (3.6%) | <0.001 |
| Significant difference with other age class | – | F | F | F | F | F | A B C D E | |
| Does not meet your needs | 201 (13.1%) | 26 (25.5%) | 48 (14.2%) | 36 (10.3%) | 38 (12.4%) | 36 (13.6%) | 17 (10.1%) | 0.003 |
| Significant difference with other age class | – | C D F | – | A | A | – | A | |
| Not useful | 160 (10.5%) | 14 (13.7%) | 38 (11.3%) | 30 (8.6%) | 29 (9.5%) | 27 (10.2%) | 22 (13.0%) | 0.514 |
| Significant difference with other age class | – | – | – | – | – | – | – | |
Smartphone apps expectations and concerns by age class.
Global p-value, when significant; Age classes, Significant difference with other age classes; N = number of participants per age class.
Connected Watch/Wristband Use, Expectations and Concerns
Among participants to the survey, 20.4% declared using a connected watch or wristband, with a significant between-group difference (p = 0.050). Most of them declared using them for assessing physical activity (76.9%), monitoring sleep (39.4%), during sport (37.2%), for cardiovascular monitoring (32.4%) and receiving smartphone notifications (29.5%). Distribution of these uses were not different among the age classes of the participants, except for the latter (p = 0.008) for which respondents aged 65 years and over had no interest (4.3%).
The most frequent concerns regarding this type of device were concerns toward their price (46.2%) which was significantly more reported in the youngest classes than in the oldest (p < 0.001), and the lack of perceived usefulness (30.8%) which was more often reported in the oldest classes (p < 0.001). Results per age group and between-group differences are detailed in Table 4.
Table 4
| Total | 18–24 years | 25–34 years | 35–44 years | 45–54 years | 55–64 years | 65 years or over | Global p-value | |
|---|---|---|---|---|---|---|---|---|
| A | B | C | D | E | F | |||
| Do you use a connected watch or wristband? | ||||||||
| N= 1,529 | N= 102 | N= 337 | N= 350 | N= 306 | N= 265 | N= 169 | ||
| No | 1,217 (79.6%) | 86 (84.3%) | 266 (78.9%) | 266 (76.0%) | 236 (77.1%) | 217 (81.9%) | 146 (86.4%) | 0.050 |
| Yes | 312 (20.4%) | 16 (15.7%) | 71 (21.1%) | 84 (24.0%) | 70 (22.9%) | 48 (18.1%) | 23 (13.6%) | |
| Significant difference with other age class | – | – | – | – | – | – | – | |
| If yes, why? | ||||||||
| N= 312 | N= 16 | N= 71 | N= 84 | N= 70 | N= 48 | N= 23 | ||
| Assessing of your physical activity | 240 (76.9%) | 12 (75.0%) | 56 (78.9%) | 67 (79.8%) | 59 (84.3%) | 32 (66.7%) | 14 (60.9%) | 0.114 |
| Significant difference with other age class | – | – | – | – | – | – | – | |
| Monitoring your sleep | 123 (39.4%) | 6 (37.5%) | 32 (45.1%) | 32 (38.1%) | 32 (45.7%) | 18 (37.5%) | 3 (13.0%) | 0.110 |
| Significant difference with other age class | – | – | – | – | – | – | – | |
| Sports reasons | 116 (37.2%) | 5 (31.3%) | 35 (49.3%) | 34 (40.5%) | 23 (32.9%) | 15 (31.3%) | 4 (17.4%) | 0.069 |
| Significant difference with other age class | – | – | – | – | – | – | – | |
| Cardiovascular monitoring | 101 (32.4%) | 6 (37.5%) | 29 (40.8%) | 18 (21.4%) | 24 (34.3%) | 19 (39.6%) | 5 (21.7%) | 0.089 |
| Significant difference with other age class | – | – | – | – | – | – | – | |
| To receive smartphone notifications | 92 (29.5%) | 6 (37.5%) | 31 (43.7%) | 23 (27.4%) | 20 (28.6%) | 11 (22.9%) | 1 (4.3%) | 0.008 |
| Significant difference with other age class | – | – | F | – | – | – | B | |
| Weight loss monitoring | 69 (22.1%) | 4 (25.0%) | 20 (28.2%) | 19 (22.6%) | 17 (24.3%) | 5 (10.4%) | 4 (17.4%) | 0.316 |
| Significant difference with other age class | – | – | – | – | – | – | – | |
| Improving/maintaining your health | 65 (20.8%) | 2 (12.5%) | 17 (23.9%) | 18 (21.4%) | 20 (28.6%) | 8 (16.7%) | 0 (0.0%) | 0.070 |
| Significant difference with other age class | – | – | – | – | – | – | – | |
| Because of the device's appearance | 34 (10.9%) | 1 (6.3%) | 10 (14.1%) | 11 (13.1%) | 7 (10.0%) | 4 (8.3%) | 1 (4.3%) | 0.713 |
| Significant difference with other age class | – | – | – | – | – | – | – | |
| Monitoring a chronic condition | 2 (0.6%) | 0 (0.0%) | 1 (1.4%) | 0 (0.0%) | 1 (1.4%) | 0 (0.0%) | 0 (0.0%) | 0.756 |
| Significant difference with other age class | – | – | – | – | – | – | – | |
| What concerns you about using a connected watch or wristband? | ||||||||
| N= 1,529 | N= 102 | N= 337 | N= 350 | N= 306 | N= 265 | N= 169 | ||
| Price | 707 (46.2%) | 73 (71.6%) | 183 (54.3%) | 174 (49.7%) | 130 (42.5%) | 92 (34.7%) | 55 (32.5%) | <0.001 |
| Significant difference with other age class | – | B C D E F | A D E F | A E F | A B | A B C | A B C | |
| Not useful | 471 (30.8%) | 35 (34.3%) | 93 (27.6%) | 79 (22.6%) | 88 (28.8%) | 100 (37.7%) | 76 (45.0%) | <0.001 |
| Significant difference with other age class | – | – | F | E F | F | C | B C D | |
| Appearance | 262 (17.1%) | 18 (17.6%) | 61 (18.1%) | 70 (20.0%) | 48 (15.7%) | 47 (17.7%) | 18 (10.7%) | 0.168 |
| Significant difference with other age class | – | – | – | – | – | – | – | |
| Protection of your personal data | 249 (16.3%) | 11 (10.8%) | 43 (12.8%) | 57 (16.3%) | 50 (16.3%) | 56 (21.1%) | 32 (18.9%) | 0.056 |
| Significant difference with other age class | – | – | – | – | – | – | – | |
| Discomfort | 237 (15.5%) | 15 (14.7%) | 57 (16.9%) | 65 (18.6%) | 59 (19.3%) | 20 (7.5%) | 21(12.4%) | 0.001 |
| Significant difference with other age class | – | – | E | E | E | B C D | – | |
| Location tracking | 197 (12.9%) | 8 (7.8%) | 41 (12.2%) | 49 (14.0%) | 41 (13.4%) | 38 (14.3%) | 20 (11.8%) | 0.610 |
| Significant difference with other age class | – | – | – | – | – | – | – | |
| Battery life | 194 (12.7%) | 15 (14.7%) | 49 (14.5%) | 48 (13.7%) | 35 (11.4%) | 33 (12.5%) | 14 (8.3%) | 0.397 |
| Significant difference with other age class | – | – | – | – | – | – | – | |
| Weight | 87 (5.7%) | 5 (4.9%) | 18 (5.3%) | 24 (6.9%) | 17 (5.6%) | 15 (5.7%) | 8 (4.7%) | 0.926 |
| Significant difference with other age class | – | – | – | – | – | – | – | |
Connected watch/wristband use, expectations and concerns by age class.
Global p-value, when significant; Age classes, Significant difference with other age classes; N = number of participants per age class.
Expectations and Concerns Regarding These Connected Devices in Clinical Research
In the context of clinical research, 93.8% of participants were favorable to the use of connected (smart) objects with between-group differences (p < 0.001) with the youngest classes being more often inclined to use connected devices, irrespective of the type of device (p < 0.001 for weighting scales, smartwatches/wristbands, patches, plates and glasses). In the context of clinical research, the protection of personal data (37.5%) remained the main concern with the youngest class (18–24 years old) being significantly less often concerned than the oldest (p < 0.001). Other concerns included the reliability (35.5%) and the ability to use the device (28.5%), the former being more reported by the youngest study population (p < 0.001) and the latter by the oldest one (55 years and over, p > 0.001). These classes also more often dreaded the loss of human interaction and expressed more frequently concerns about the ease of use than the younger classes (p < 0.001 and p = 0.009 respectively). These results are presented in Figure 2.
Figure 2
During their participation in a clinical research, participants would mostly prefer having both on-site and remote conduct of a clinical study (68.1%), the oldest class preferring more often exclusive physical setting than the youngest (p < 0.001). The same significant tendency (p < 0.001) was noted regarding the best way to provide information regarding a clinical research protocol. Overall, respondents preferred a fun mobile app (50.2%) rather than paper explanation (25.0%) or video support and discussion with a professional (24.7%). The oldest class (65 years old and over) preferred paper explanations (43.8%) to mobile apps (36.7%). Regarding the way to report health-related data, mobile app questionnaire was preferred (64.2%) to computer questionnaire (29.0%) and paper questionnaire (6.8%) except in the oldest group in which computer questionnaire was preferred (58.6%) over the former (between age group difference: p < 0.001). Six out of ten participants would agree to share in a secure and anonymous system their social media content with research staff with significant difference between age groups (p < 0.001). Indeed, less than half of the respondents aged 65 years and over were inclined to share this content. Finally, 82.2% of participants would agree to interact with a chatbot and send their data to a member of the research team with notably the oldest class being less likely to agree than the others (p < 0.001). Results and responses per age group and between-group differences are detailed in Table 5.
Table 5
| Total | 18–24 years | 25–34 years | 35–44 years | 45–54 years | 55–64 years | 65 years or over | Global p-value | |
|---|---|---|---|---|---|---|---|---|
| A | B | C | D | E | F | |||
| Would you be willing to use a health-related connected object within the context of a clinical study? | ||||||||
| N= 1529 | N= 102 | N= 337 | N= 350 | N= 306 | N= 265 | N= 169 | ||
| No | 95 (6.2%) | 2 (2.0%) | 9 (2.7%) | 10 (2.9%) | 18 (5.9%) | 30 (11.3%) | 26 (15.4%) | <0.001 |
| Yes | 1434 (93.8%) | 100 (98.0%) | 328 (97.3%) | 340 (97.1%) | 288 (94.1%) | 235 (88.7%) | 143 (84.6%) | |
| Significant difference with other age class | – | E F | E F | E F | F | A B C | A B C D | |
| If yes, please specify which one(s) | ||||||||
| N= 1434 | N= 100 | N= 328 | N= 340 | N= 288 | N= 235 | N= 143 | ||
| Connected weighing scales | 1312 (91.5%) | 92 (92.0%) | 317 (96.6%) | 319 (93.8%) | 263 (91.3%) | 204 (86.8%) | 117 (81.8%) | <0.001 |
| Significant difference with other age class | – | – | D E F | E F | B F | B C | B C D | |
| Connected watch/wristband | 1306 (91.1%) | 94 (94.0%) | 311 (94.8%) | 323 (95.0%) | 262 (91.0%) | 208 (88.5%) | 108 (75.5%) | <0.001 |
| Significant difference with other age class | – | F | F | E F | F | C F | A B C D E | |
| Connected patch | 1,032 (72.0%) | 77 (77.0%) | 275 (83.8%) | 254 (74.7%) | 201 (69.8%) | 147 (62.6%) | 78 (54.5%) | <0.001 |
| Significant difference with other age class | – | F | C D E F | B E F | B F | B C | A B C D | |
| Connected plate | 1001 (69.8%) | 79 (79.0%) | 260 (79.3%) | 251 (73.8%) | 199 (69.1%) | 141 (60.0%) | 71 (49.7%) | <0.001 |
| Significant difference with other age class | – | E F | D E F | E F | B F | A B C | A B C D | |
| Connected glasses | 789 (55.0%) | 64 (64.0%) | 219 (66.8%) | 200 (58.8%) | 154 (53.5%) | 107 (45.5%) | 45 (31.5%) | <0.001 |
| Significant difference with other age class | – | E F | D E F | E F | B F | A B C F | A B C D E | |
| What concerns you about the use of connected objects in clinical research? | ||||||||
| N= 1529 | N= 102 | N= 337 | N= 350 | N= 306 | N= 265 | N= 169 | ||
| Protection of your personal data | 574 (37.5%) | 22 (21.6%) | 109 (32.3%) | 137 (39.1%) | 128 (41.8%) | 106 (40.0%) | 72 (42.6%) | 0.001 |
| Significant difference with other age class | – | C D E F | - | A | A | A | A | |
| Concerns that the tool will be unreliable | 543 (35.5%) | 54 (52.9%) | 147 (43.6%) | 137 (39.1%) | 96 (31.4%) | 77 (29.1%) | 32 (18.9%) | <0.001 |
| Significant difference with other age class | – | D E F | D E F | F | A B F | A B | A B C D | |
| Concerns about not being able to use the object | 436 (28.5%) | 20 (19.6%) | 75 (22.3%) | 88 (25.1%) | 89 (29.1%) | 91 (34.3%) | 73 (43.2%) | <0.001 |
| Significant difference with other age class | – | F | E F | F | F | B | A B C D | |
| Loss of human interaction | 371 (24.3%) | 26 (25.5%) | 70 (20.8%) | 66 (18.9%) | 73 (23.9%) | 77 (29.1%) | 59 (34.9%) | <0.001 |
| Significant difference with other age class | – | – | F | E F | – | C | B C | |
| Ease of use | 323 (21.1%) | 20 (19.6%) | 86 (25.5%) | 87 (24.9%) | 57 (18.6%) | 51 (19.2%) | 22 (13.0%) | 0.009 |
| Significant difference with other age class | – | – | F | F | – | – | B C | |
| Location tracking | 285 (18.6%) | 17 (16.7%) | 54 (16.0%) | 74 (21.1%) | 57 (18.6%) | 60 (22.6%) | 23 (13.6%) | 0.115 |
| Significant difference with other age class | – | – | – | – | – | – | – | |
| Impact on understanding | 234 (15.3%) | 18 (17.6%) | 46 (13.6%) | 51 (14.6%) | 47 (15.4%) | 43 (16.2%) | 29 (17.2%) | 0.861 |
| Significant difference with other age class | – | – | – | – | – | – | – | |
| Concerns of less efficient monitoring | 173 (11.3%) | 18 (17.6%) | 37 (11.0%) | 33 (9.4%) | 42 (13.7%) | 25 (9.4%) | 18 (10.7%) | 0.149 |
| Significant difference with other age class | – | – | – | – | – | – | – | |
| Reluctance from healthcare professionals | 124 (8.1%) | 12 (11.8%) | 30 (8.9%) | 24 (6.9%) | 22 (7.2%) | 25 (9.4%) | 11 (6.5%) | 0.493 |
| Significant difference with other age class | – | – | – | – | – | – | – | |
| In your opinion, what would be the best study format for conducting clinical studies? | ||||||||
| N= 1529 | N= 102 | N= 337 | N= 350 | N= 306 | N= 265 | N= 169 | ||
| Digital | 276 (18.1%) | 14 (13.7%) | 51 (15.1%) | 79 (22.6%) | 60 (19.6%) | 38 (14.3%) | 34 (20.1%) | <0.001 |
| Exclusively physical | 212 (13.9%) | 9 (8.8%) | 31 (9.2%) | 26 (7.4%) | 38 (12.4%) | 57 (21.5%) | 51 (30.2%) | |
| Digital and physical | 1041 (68.1%) | 79 (77.5%) | 255 (75.7%) | 245 (70.0%) | 208 (68.0%) | 170 (64.2%) | 84 (49.7%) | |
| Significant difference with other age class | – | F | E F | E F | F | B C | A B C D | |
| What would be the best way to provide information regarding a clinical research protocol? | ||||||||
| N= 1529 | N= 102 | N= 337 | N= 350 | N= 306 | N= 265 | N= 169 | ||
| Paper document with explanations from a professional | 383 (25.0%) | 17 (16.7%) | 68 (20.2%) | 64 (18.3%) | 75 (24.5%) | 85 (32.1%) | 74 (43.8%) | <0.001 |
| Video and discussion with a professional and/or a quiz on key points | 378 (24.7%) | 36 (35.3%) | 78 (23.1%) | 89 (25.4%) | 77 (25.2%) | 65 (24.5%) | 33 (19.5%) | |
| A fun mobile app | 768 (50.2%) | 49 (48.0%) | 191 (56.7%) | 197 (56.3%) | 154 (50.3%) | 115 (43.4%) | 62 (36.7%) | |
| Significant difference with other age class | – | F | E F | E F | F | B C | A B C D | |
| If you had to provide health-related data within the context of a clinical study, what would you consider the most appropriate format? | ||||||||
| N= 1529 | N= 102 | N= 337 | N= 350 | N= 306 | N= 265 | N= 169 | ||
| Paper questionnaire | 104 (6.8%) | 12 (11.8%) | 20 (5.9%) | 19 (5.4%) | 15 (4.9%) | 22 (8.3%) | 16 (9.5%) | <0.001 |
| Questionnaire on a mobile app | 982 (64.2%) | 74 (72.5%) | 271 (80.4%) | 268 (76.6%) | 183 (59.8%) | 132 (49.8%) | 54 (32.0%) | |
| Questionnaire on a PC | 443 (29.0%) | 16 (15.7%) | 46 (13.6%) | 63 (18.0%) | 108 (35.3%) | 111 (41.9%) | 99 (58.6%) | |
| Significant difference with other age class | – | D E F | D E F | D E F | A B C F | A B C F | A B C D E | |
| Would you agree to share, in a secure and anonymous manner, your social media content (Facebook, Twitter, Instagram, etc.) with research staff? | ||||||||
| N= 1529 | N= 102 | N= 337 | N= 350 | N= 306 | N= 265 | N= 169 | ||
| No | 606 (39.6%) | 33 (32.4%) | 115 (34.1%) | 128 (36.6%) | 118 (38.6%) | 123 (46.4%) | 89 (52.7%) | <0.001 |
| Yes | 923 (60.4%) | 69 (67.6%) | 222 (65.9%) | 222 (63.4%) | 188 (61.4%) | 142 (53.6%) | 80 (47.3%) | |
| Significant difference with other age class | – | F | E F | F | F | B | A B C D | |
| Would you be prepared to interact with an online chat system (chatbot) and send your recorded health information to a member of the research team? | ||||||||
| N= 1529 | N= 102 | N= 337 | N= 350 | N= 306 | N= 265 | N= 169 | ||
| No | 272 (17.8%) | 18 (17.6%) | 38 (11.3%) | 47 (13.4%) | 43 (14.1%) | 64 (24.2%) | 62 (36.7%) | <0.001 |
| Yes | 1257 (82.2%) | 84 (82.4%) | 299 (88.7%) | 303 (86.6%) | 263 (85.9%) | 201 (75.8%) | 107 (63.3%) | |
| Significant difference with other age class | – | F | E F | E F | E F | B C D F | A B C D E | |
Use of connected devices and social media enabled features in clinical research by age class.
Global p-value, when significant; Age classes, Significant difference with other age classes; N = number of participants per age class.
Focus on Food Tracking Apps
Most of participants (93.3%) declared being prepared to keep a systematic record of their food consumption using a mobile app, with the oldest agreeing less often than the youngest (p < 0.001). Among them, 80.5% would agree to complete such record for at least a week and 52.6% for 4 weeks or over with significant between-group difference (p = 0.010). Regarding the expected completion time, 38.1% of the respondents would agree to devote up to 3 min per meal, and 44.1% of the respondents would agree to devote up to 10 min per meal to such record, with no significant between-group difference (p = 0.070). Results and responses per age group and between-group differences are detailed in Table 6.
Table 6
| Total | 18–24 years | 25–34 years | 35–44 years | 45–54 years | 55–64 years | 65 years or over | Global p-value | |
|---|---|---|---|---|---|---|---|---|
| A | B | C | D | E | F | |||
| Would you be prepared to keep a systematic record of your food consumption using a mobile app? | ||||||||
| N= 1529 | N= 102 | N= 337 | N= 350 | N= 306 | N= 265 | N= 169 | ||
| No | 102 (6.7%) | 1 (1.0%) | 7 (2.1%) | 10 (2.9%) | 19 (6.2%) | 34 (12.8%) | 31 (18.3%) | <0.001 |
| Yes | 1427 (93.3%) | 101 (99.0%) | 330 (97.9%) | 340 (97.1%) | 287 (93.8%) | 231 (87.2%) | 138 (81.7%) | |
| Significant difference with other age class | – | E F | E F | E F | F | A B C | A B C D | |
| If yes, for how long would you be willing to complete this record? | ||||||||
| N= 1427 | N= 101 | N= 330 | N= 340 | N= 287 | N= 231 | N= 138 | ||
| <48 h | 42 (2.9%) | 5 (5.0%) | 7 (2.1%) | 11 (3.2%) | 7 (2.4%) | 10 (4.3%) | 2 (1.4%) | 0.010 |
| 48 h to 4 days | 91 (6.4%) | 6 (5.9%) | 17 (5.2%) | 24 (7.1%) | 13 (4.5%) | 19 (8.2%) | 12 (8.7%) | |
| 4 days to 1 week | 146 (10.2%) | 11 (10.9%) | 21 (6.4%) | 34 (10.0%) | 27 (9.4%) | 28 (12.1%) | 25 (18.1%) | |
| 1–2 weeks | 196 (13.7%) | 15 (14.9%) | 41 (12.4%) | 52 (15.3%) | 31 (10.8%) | 32 (13.9%) | 25 (18.1%) | |
| 2–4 weeks | 202 (14.2%) | 7 (6.9%) | 51 (15.5%) | 50 (14.7%) | 47 (16.4%) | 27 (11.7%) | 20 (14.5%) | |
| Over 4 weeks | 750 (52.6%) | 57 (56.4%) | 193 (58.5%) | 169 (49.7%) | 162 (56.4%) | 115 (49.8%) | 54 (39.1%) | |
| Significant difference with other age class | – | – | F | – | F | – | B D | |
| If yes, how much time would you be prepared to devote to this record per meal? | ||||||||
| N= 1427 | N= 101 | N= 330 | N= 340 | N= 287 | N= 231 | N= 138 | ||
| <1 min | 66 (4.6%) | 4 (4.0%) | 17 (5.2%) | 17 (5.0%) | 13 (4.5%) | 11 (4.8%) | 4 (2.9%) | 0.070 |
| 1– 3 min | 543 (38.1%) | 40 (39.6%) | 129 (39.1%) | 148 (43.5%) | 109 (38.0%) | 76 (32.9%) | 41 (29.7%) | |
| 3–10 min | 629 (44.1%) | 40 (39.6%) | 148 (44.8%) | 135 (39.7%) | 116 (40.4%) | 112 (48.5%) | 78 (56.5%) | |
| Over 10 min | 189 (13.2%) | 17 (16.8%) | 36 (10.9%) | 40 (11.8%) | 49 (17.1%) | 32 (13.9%) | 15 (10.9%) | |
| Significant difference with other age class | – | – | – | – | – | – | – | |
Tracking of food consumption in clinical research by age class.
Global p-value, when significant; Age classes, Significant difference with other age classes; N = number of participants per age class.
Discussion
Principal Findings
By considering clinical study participants as a specific population, we confirmed their appeal for wearables and health “in pocket” technologies in research setting. This inclination to use digital tools is consistent with recent results obtained in general population (31). We also confirmed the rising trends associated with the use of smartphone apps, smart devices, and social media in medical research, which were previously reported in surveys conducted in healthcare users (3). Additionally, we were able to better understand the research participants' interest in tools of uncertain appeal, including dietary assessment tools (by considering the expected completion time and total duration), sharing of social media information, as well as chatbot conversations. Even though participants' equipment and enthusiasm seemed more important in younger age groups, our results suggest that the interest of older age classes should not be underestimated: most of these respondents expect the use of more connected tools in research practice, whatever their age. Besides, our results show that the use of paper diaries was only preferred on rare occasions, suggesting that participants recruited with the use of online tools should be provided with mobile apps over computer or paper solutions. Indeed, we identified that mobile apps are expected to provide informed consent and track health data during study conduct. Among these options, the use of a mobile app as a food diary represents a good compromise to track food intake at the touch of a finger, if its completion time does not exceed 3 min per meal. The use of mobile apps as food diaries has already been identified as a way to reduce the time to report dietary data and improve its quality (32, 33). We also noted that participants' enthusiasm toward the use of more connected tools does not go hand in hand with the conduct of remote studies. If given a choice, participants confirmed that they would rather opt for a hybrid study design, relying on both on-site and digital conduct. This can be explained, in part, by the loss of human contact which was perceived by respondents as one of their concerns in case of the use of health technologies. Our results suggest that the conduct of fully remote studies should not be considered systematically. We also identified that the protection of personal data was the most frequently reported concern, suggesting that more efforts are needed to describe risks associated with the management of individual health data and the use of digital health solutions (34).
While participants highlighted the management of their personal data as their main concern, most of the respondents would agree to share their social media content with researchers. Health information is already shared by many web users on web forums and digital platforms (35, 36). The processing of online natural language has been identified as an opportunity to enable sentiment analysis (37) or assess quality of life (38) which can be used as a complement to conventional methods of heath information tracking (39) by considering environmental, psychological and lifestyle factors (40, 41). Interestingly, even more participants confirmed that they would agree to interact with a chatbot during the conduct of clinical studies. Chatbots, while extensively used to facilitate hospital admissions and anticipate health checkup to support decision-making, are not currently used in many research studies for data acquisition purposes. Part of the research fields include mental health studies (42), including trials (43), and are also considered in behavior change studies (44), pediatric studies (45) and to evaluate how they can improve the management of chronic diseases (46, 47). Considering the importance of patient engagement in research (23, 28), we believe that their enthusiasm toward social media features and chatbots should also be leveraged to optimize retention rate throughout study participation.
Strengths and Limitations
By conducting this survey study, we were able to obtain answers from many research participants interested in nutrition clinical studies, with an important variability in terms of age and level of education and the use of a detailed online questionnaire. To our knowledge, this is the first assessment of both equipment and expectations toward digital health and nutrition apps that was done by considering participants to nutrition clinical studies as a specific survey population. We believe that the findings of this cross-sectional survey study can serve as a starting point for repeated assessments in samples of clinical research participants to increase reproducibility in additional context and geographies. To that extent, our questionnaire is provided as Supplementary Material and may be used under Creative Commons license for non-commercial purposes (Additional File 1). While this survey mushroomed into an important dataset, comparison with prior work is however limited, as we could not identify prior research findings related to expectations toward digital heals and mobile dietary assessment tools obtained in samples of clinical research participants.
A main limitation of our study is the absence of quota-based sampling which would have facilitated further analyses in sub-groups of respondents. While feasible on a larger scale, the focus on clinical study participants as our study sample prevented the use of further screening efforts and of a larger sample of respondents. Ideally, variables including age, gender and chronic conditions could have been used to enable a quota-based sampling reflecting the French population characteristics. Another limitation of our study is the lack of information regarding the nature of chronic conditions. This information would be needed to further explore the relationship between specific indications, nutrition-related concerns, and expectations toward digital health in research settings. However, the type of chronic condition was considered as a sensitive health data for this online survey study, considering applicable data privacy regulations. Finally, the data acquisition method can also be associated with a willingness to participate in our survey study. As the respondents are participants in nutrition clinical studies who were invited to complete an online questionnaire, they can be more likely to provide study data, including nutrition information, with the use of digital tools. We therefore identified a risk of response bias when interpreting results related to the preferred way of providing health and nutrition data while taking part in a clinical study.
The successful implementation of participant-centered digital tools also relies on their endorsement by research sponsors and investigators. While our results suggest an important appeal of clinical research participant toward health technologies, the viewpoint of investigational sites personnel should also be assessed, as usage by health practitioners and may not necessarily correlate with positive assessment (11). Further work is therefore needed to continue to evaluate the drivers of successful implementation of digital health technologies based on acceptability of digital solutions by health practitioners (47). These drivers may include the availability of site staff to manage new tools and train participants and may be evaluated by conducting qualitative survey studies. Such studies may consider the opinion of both research staff and clinical study participants to identify the predictors of the implementation of digital health technologies (and associated bottlenecks) in clinical research settings.
The screening period should also be considered when interpreting our results, as enrolment was performed ahead of the COVID-19 worldwide outbreak. Despite the availability and democratization of novel health technologies in clinical practice ahead of this pandemic, some patients experienced telemedicine for the first time during this pandemic as confirmed by recent surveys (48). This surge was not only explained by concerns related to coronavirus disease, but also due to the increasing use and demand in telemedicine for behavioral health and chronic conditions to cope with the lack of conventional face to face appointments during the pandemic (49). Following the currently rising use and demand in telehealth services, we expect clinical study participants' appeal for digital health will continue to increase. Therefore, there is an opportunity to repeat our assessment regularly to better support the implementation of health technologies when designing clinical studies based on more recent results.
Conclusion
Our study suggests that clinical study participants are keen to use various forms of digital health tools in clinical research setting, including digital health apps, food tracking apps, social media information sharing and interactions with chatbots. However, we also identified that clinical study participants remain concerned about the management of their personal data, the reliability of digital health solutions and the loss of interactions with investigators. Specific attention to ensure a high level of data security and privacy in future clinical studies should contribute to an enhanced satisfaction and trust from the participants and consequently to a higher participation rate and the collection of quality data. We believe that these results will provide supportive details for investigators and sponsors to foster the conduct of more participant-centered studies. Further work is however needed to better understand the association between interest in technologies and specific chronic conditions. Repeated assessments are suggested, as clinical research participants' propensity for technology is expected to continue to evolve following the recent surge in use and demand for innovative health services during the pandemic of COVID-19.
Funding
This work was funded by Danone Nutricia Research.
Publisher's Note
All claims expressed in this article are solely those of the authors and do not necessarily represent those of their affiliated organizations, or those of the publisher, the editors and the reviewers. Any product that may be evaluated in this article, or claim that may be made by its manufacturer, is not guaranteed or endorsed by the publisher.
Statements
Data availability statement
The raw data supporting the conclusions of this article will be made available by the authors, without undue reservation.
Ethics statement
Ethical review and approval was not required for the study on human participants in accordance with the local legislation and institutional requirements. Written informed consent for participation was not required for this study in accordance with the national legislation and the institutional requirements.
Author contributions
FS, LQ, MK, FC, and GF: design of the work. HC and MK: subject enrolment and data acquisition. FC: analysis. FS, LQ, MK, FC, JE, HC, and GF: interpretation of data. FS and JE: manuscript draft. FS, LQ, FC, JE, HC, and GF: revision of the manuscript. All authors contributed to the article and approved the submitted version.
Acknowledgments
The authors wish to thank Jean-François Jeanne for the constructive discussions while designing the survey, Stéphane Deniau for mailing our survey, Mathilde Labro for her support for data management and programming of statistical analyses, and Sarah Moreira Milheiro for contributing to the design of the graphical abstract.
Conflict of interest
FS and LQ are the employees of Danone Nutricia Research. MK was affiliated to Danone Nutricia Research during the survey design and during data collection as an intern from the Faculty of Medicine and Pharmacy of Poitiers. GF received consultation fees from Danone Nutricia Research. Authors affiliated to Danone Nutricia Research were involved in study design, collection, analysis, interpretation of data, the writing of this article, and the decision to submit it for publication. The remaining authors declare that the research was conducted in the absence of any commercial or financial relationships that could be construed as a potential conflict of interest.
Supplementary material
The Supplementary Material for this article can be found online at: https://www.frontiersin.org/articles/10.3389/fdgth.2022.794908/full#supplementary-material
References
1.
SteinhublSRMuseEDTopolEJ. The emerging field of mobile health. Sci Transl Med. (2015) 7:283rv3. 10.1126/scitranslmed.aaa3487
2.
European commission. Attitudes Towards the Impact of Digitisation Automation on Daily Life. (2017). Available online at: https://ec.europa.eu/digital-single-market/en/news/attitudes-towards-impact-digitisation-and-automation-daily-life (accessed January 25, 2021).
3.
Accenture. 2018 Consumer Survey on Digital Health. Available online at: https://www.accenture.com/t20180306t103559z__w__/us-en/_acnmedia/pdf-71/accenture-health-2018-consumer-survey-digital-health.pdf (accessed January 25, 2021).
4.
HossainILimZZNgJJLKohWJWongPS. Public attitudes towards mobile health in Singapore: a cross-sectional study. Mhealth. (2018) 4:41. 10.21037/mhealth.2018.09.02
5.
AjanaB. Digital health and the biopolitics of the quantified self. Digit Health. (2017) 3:2055207616689509. 10.1177/2055207616689509
6.
GrasslNNeesJSchrammKSpratteJSohnCSchottTCet al. A web-based survey assessing the attitudes of health care professionals in Germany toward the use of telemedicine in pregnancy monitoring: cross-sectional study. JMIR Mhealth Uhealth. (2018) 6:e10063. 10.2196/10063
7.
JenssenBPMitraNShahAWanFGrandeD. Using digital technology to engage and communicate with patients: a survey of patient attitudes. J Gen Intern Med. (2016) 31:85–92. 10.1007/s11606-015-3517-x
8.
ManginDParascandaloJKhudoyarovaOAgarwalGBismahVOrrS. Multimorbidity, eHealth and implications for equity: a cross-sectional survey of patient perspectives on eHealth. BMJ Open. (2019) 9:e023731. 10.1136/bmjopen-2018-023731
9.
MontagniICariouTFeuilletTLangloisETzourioC. Exploring digital health use and opinions of university students: field survey study. JMIR Mhealth Uhealth. (2018) 6:e65. 10.2196/mhealth.9131
10.
YadaNHeadM. Attitudes toward health care virtual communities of practice: survey among health care workers. J Med Internet Res. (2019) 21:e15176. 10.2196/15176
11.
FlynnDGregoryPMakkiHGabbayM. Expectations and experiences of eHealth in primary care: A qualitative practice-based investigation. Int J Med Inform. (2009) 78:588–604. 10.1016/j.ijmedinf.2009.03.008
12.
WernhartAGahbauerSHaluzaD. eHealth and telemedicine: Practices and beliefs among healthcare professionals and medical students. PLoS ONE (2019) 14:e0213067. 10.1371/journal.pone.0213067
13.
MayerGGronewoldNAlvarezSBrunsBHilbelTSchultzJH. Acceptance and expectations of medical experts, students, and patients toward electronic mental health apps: cross-sectional quantitative and qualitative survey study. JMIR Ment Health. (2019) 6:e14018 10.2196/14018
14.
World medical association. World medical association declaration of helsinki: ethical principles for medical research involving human subjects. JAMA. (2013) 310:2191–4. 10.1001/jama.2013.281053
15.
SacristánJAAguarónAAvendaño-SoláCGarridoPCarriónJGutiérrezAet al. Patient involvement in clinical research: why, when, and how. Patient Prefer Adherence. (2016) 10:631–40. 10.2147/PPA.S104259
16.
WendlerDKrohmalBEmanuelEJGradyCESPRITGroup. Why patients continue to participate in clinical research. Arch Intern Med. (2008) 168:1294–9. 10.1001/archinte.168.12.1294
17.
AffinitoLFontanellaAMontanoNBrucatoA. How physicians can empower patients with digital tools. J Public Health. (2020). Available online at: https://link.springer.com/content/pdf/10.1007/s10389-020-01370-4.pdf
18.
European Union Law. Communication From the Commission to the European Parliament, the European Council, the Council, the European Economic and Social Committee and the Committee of the Regions on enabling the Digital Transformation of Health and Care in the Digital Single Market; Empowering Citizens and Building a Healthier Society. Available online at: https://eur-lex.europa.eu/legal-content/EN/TXT/?uri=COM%3A2018%3A233%3AFIN (accessed January 30, 2022)
19.
US Food Drug Administration. FDA Announces New Steps to Empower Consumers and Advance Digital Healthcare. Available online at: https://www.fda.gov/news-events/fda-voices/fda-announces-new-steps-empower-consumers-and-advance-digital-healthcare (accessed January 30, 2022)
20.
SteinhublSRWolff-HughesDLNilsenWIturriagaECaliffRM. Digital clinical trials: creating a vision for the future. NPJ Digit Med. (2019) 2:126. 10.1038/s41746-019-0203-0
21.
CalvertMKyteDDuffyHGheorgheAMercieca-BebberRIvesJet al. Patient-reported outcome (PRO) assessment in clinical trials: a systematic review of guidance for trial protocol writers. PLoS ONE. (2014) 9:e110216. 10.1371/journal.pone.0110216
22.
CoravosAGoldsackJCKarlinDRNebekerCPerakslisEZimmermanNet al. Digital medicine: a primer on measurement. Digit Biomark. (2019) 3:31–71. 10.1159/000500413
23.
LevitanBGetzKEisensteinELGoldbergMHarkerMHesterleeSet al. Assessing the financial value of patient engagement: a quantitative approach from CTTI's patient groups and clinical trials project. Ther Innov Regul Sci. (2018) 52:220–9. 10.1177/2168479017716715
24.
Clinical Trials Transformation Initiative. Tufts CSDD Reports Number of Endpoints Per Protocol Doubled Between 2004 and 2012. Available online at: https://www.ctti-clinicaltrials.org/news/tufts-csdd-reports-number-endpoints-protocol-doubled-between-2004-and-2012 (accessed May 05, 2021)
25.
PratapANetoECSnyderPStepnowskyCElhadadNGrantDet al. Indicators of retention in remote digital health studies: a cross-study evaluation of 100,000 participants. npj Digit Med. (2020) 3:21. 10.1038/s41746-020-0224-8
26.
BrohanEBonnerNTurnbullAKhanSDewitOThomasGet al. Development of a patient-led end of study questionnaire to evaluate the experience of clinical trial participation. Value Health. (2014) 17:A649. 10.1016/j.jval.2014.08.2358
27.
MansonSCBonnerNBennettBDewitOThomasG. Development, scoring and use of a patient questionnaire to measure the practical patient experience within oncology clinical trials. J Clin Oncol. (2015) 33:e20567. 10.1200/jco.2015.33.15_suppl.e20567
28.
AguayoGAGoetzingerCScibiliaRFischerASeuringTTranVet al. Methods to generate innovative research ideas and improve patient and public involvement in modern epidemiological research: Review, patient viewpoint, and guidelines for implementation of a digital cohort study. J Med Internet Res. (2021) 23:e25743. 10.2196/25743
29.
YaddanapudiSYaddanapudiLN. How to design a questionnaire. Indian J Anaesth. (2019) 63:335–7. 10.4103/ija.IJA_334_19
30.
Microsoft Forms. Available online at: https://forms.office.com/ (accessed January 25, 2021).
31.
Accenture. Digital Health Technology Vision. (2020). Available online at: https://www.accenture.com/us-en/insights/health/accenture-digital-health-technology-vision-2020 (accessed January 25, 2021).
32.
AmoutzopoulosBSteerTRobertsCCadeJEBousheyCJCollinsCEet al. Traditional methods new technologies - dilemmas for dietary assessment in large-scale nutrition surveys and studies: a report following an international panel discussion at the 9th international conference on diet and activity methods (ICDAM9), Brisbane, 3 September 2015. J Nutr Sci. (2018) 7:e11. 10.1017/jns.2018.4
33.
KhazenWJeanneJFDemaretzLSchäferFFagherazziG. Rethinking the use of mobile apps for dietary assessment in medical research. J Med Internet Res. (2020) 22:e15619. 10.2196/15619
34.
United States Federal Trade Commission. Does Your Health App Protect Your Sensitive Info? Available online at: https://www.consumer.ftc.gov/blog/2021/01/does-your-health-app-protect-your-sensitive-info (accessed January 25 2021).
35.
FoxSDugganM. Health Online. Pew Research Center. (2013). Available online at: http://www.pewinternet.org/2013/01/15/health-online-2013/ (accessed May 05 2021).
36.
NIH. National Cancer Institute. Health Information National Trends Survey. In the Last 12 Months, Have You Used the Internet for the Following Reason: Shared Health Information on Social Media Sites? Available online at: https://hints.cancer.gov/view-questions-topics/question-details.aspx?PK_Cycle=13&qid=1496 (accessed May 05, 2021).
37.
GabarronEDorronzoroERivera-RomeroOWynnR. Diabetes on Twitter: a sentiment analysis. J Diabetes Sci Technol. (2019) 13:439–44. 10.1177/1932296818811679
38.
FagherazziGRavaudP. Digital diabetes: perspectives for diabetes prevention, management and research. Diabetes Metab. (2019) 45:322–9. 10.1016/j.diabet.2018.08.012
39.
SamarasLGarcía-BarriocanalESiciliaM-A. Syndromic Surveillance Models Using Web Data: A Systematic Review in Innovation in Health Informatics, 1st Edition, A Smart Healthcare Primer 39–77.New York, NY: Elsevier Science Publishing Co Inc., Imprint by Academic Press Inc. (2019).
40.
MaoJJChungABentonAHillSUngarLLeonardCEet al. Online discussion of drug side effects and discontinuation among breast cancer survivors. Pharmacoepidemiol Drug Saf. (2013) 22:256–62. 10.1002/pds.3365
41.
SchäferFFaviezCVoillotPFoulquiéPNajmMJeanneJFet al. Mapping and modeling of discussions related to gastrointestinal discomfort in french-speaking online forums: results of a 15-year retrospective infodemiology study. J Med Internet Res. (2020) 22:e17247. 10.2196/17247
42.
Abd-AlrazaqAAAlajlaniMAlalwanAABewickBMGardnerPHousehM. An overview of the features of chatbots in mental health: a scoping review. Int J Med Inform. (2019) 132:103978. 10.1016/j.ijmedinf.2019.103978
43.
FitzpatrickKKDarcyAVierhileM. Delivering cognitive behavior therapy to young adults with symptoms of depression and anxiety using a fully automated conversational agent (Woebot): a randomized controlled Trial JMIR Ment Health. (2017) 4:e19. 10.2196/mental.7785
44.
PereiraJDíazÓ. Using health chatbots for behavior change: a mapping study. J Med Syst. (2019) 43:135. 10.1007/s10916-019-1237-1
45.
ComendadorBEVFranciscoBMBMedenillaJSMaeS. Pharmabot: a pediatric generic medicine consultant chatbot. J Automat Control Eng. (2015) 3:137–40. 10.12720/joace.3.2.137-140
46.
KowatschTNißenMShihCHRüeggerDVollandDFillerAet al. Text-based healthcare chatbots supporting patient and health professional teams: preliminary results of a randomized controlled trial on childhood obesity. Persuasive Embodied Agents for Behavior Change (PEACH2017) Workshop, co-located with the 17th International Conference on Intelligent Virtual Agents (IVA 2017). Stockholm (2017).
47.
FagherazziGGoetzingerCRashidMAAguayoGAHuiartL. Digital health strategies to fight COVID-19 worldwide: challenges, recommendations, and a call for papers. J Med Internet Res. (2020) 22:e19284. 10.2196/19284
48.
French Digital Health Agency (Agence du numérique en Santé) – 2021 Survey Evaluating the Implementation of Telemedecine. Available online at: https://esante.gouv.fr/sites/default/files/media_entity/documents/odoxa-pour-lans-et-le-mag-de-la-sante—barometre-telemedecine-vague-3—janvier-2021.pdf (accessed January 25, 2021).
49.
Uscher-PinesLThompsonJTaylorPDeanKYuanTTongIet al. Where virtual care was already a reality: experiences of a nationwide telehealth service provider during the COVID-19 pandemic. J Med Internet Res. (2020) 22:e22727. 10.2196/22727
Summary
Keywords
clinical research, dietary assessment tools, digital health, social media, survey studies, chatbots, clinical operations, patient centricity
Citation
Schäfer F, Quinquis L, Klein M, Escutnaire J, Chavanel F, Chevallier H and Fagherazzi G (2022) Attitudes and Expectations of Clinical Research Participants Toward Digital Health and Mobile Dietary Assessment Tools: Cross-Sectional Survey Study. Front. Digit. Health 4:794908. doi: 10.3389/fdgth.2022.794908
Received
14 October 2021
Accepted
18 January 2022
Published
09 March 2022
Volume
4 - 2022
Edited by
Niranjan Bidargaddi, Flinders University, Australia
Reviewed by
Martin David Lewis, South Australian Health and Medical Research Institute (SAHMRI), Australia; Manuel Ottaviano, Polytechnic University of Madrid, Spain
Updates
Copyright
© 2022 Schäfer, Quinquis, Klein, Escutnaire, Chavanel, Chevallier and Fagherazzi.
This is an open-access article distributed under the terms of the Creative Commons Attribution License (CC BY). The use, distribution or reproduction in other forums is permitted, provided the original author(s) and the copyright owner(s) are credited and that the original publication in this journal is cited, in accordance with accepted academic practice. No use, distribution or reproduction is permitted which does not comply with these terms.
*Correspondence: Florent Schäfer florent.schafer@danone.com
This article was submitted to Human Factors and Digital Health, a section of the journal Frontiers in Digital Health
Disclaimer
All claims expressed in this article are solely those of the authors and do not necessarily represent those of their affiliated organizations, or those of the publisher, the editors and the reviewers. Any product that may be evaluated in this article or claim that may be made by its manufacturer is not guaranteed or endorsed by the publisher.