 Alexander Kathan1*†
 Mathias Harrer2,3,4,†
 Ludwig Küster4
 Andreas Triantafyllopoulos1Xiangheng He1,5
 Manuel Milling1
 Maurice Gerczuk1Tianhao Yan1
 Srividya Tirunellai Rajamani1Elena Heber4Inga Grossmann4
 David D. Ebert2,4
 Björn W. Schuller1,5
- 1EIHW – Chair of Embedded Intelligence for Health Care and Wellbeing, University of Augsburg, Augsburg, Germany
- 2Psychology & Digital Mental Health Care, Technical University of Munich, Munich, Germany
- 3Clinical Psychology & Psychotherapy, Friedrich-Alexander-University Erlangen-Nuremberg, Erlangen, Germany
- 4GET.ON Institut für Online Gesundheitstrainings GmbH/HelloBetter, Hamburg, Germany
- 5GLAM – Group on Language, Audio, & Music, Imperial College London, London, UK
Introduction: Digital health interventions are an effective way to treat depression, but it is still largely unclear how patients’ individual symptoms evolve dynamically during such treatments. Data-driven forecasts of depressive symptoms would allow to greatly improve the personalisation of treatments. In current forecasting approaches, models are often trained on an entire population, resulting in a general model that works overall, but does not translate well to each individual in clinically heterogeneous, real-world populations. Model fairness across patient subgroups is also frequently overlooked. Personalised models tailored to the individual patient may therefore be promising.
Methods: We investigate different personalisation strategies using transfer learning, subgroup models, as well as subject-dependent standardisation on a newly-collected, longitudinal dataset of depression patients undergoing treatment with a digital intervention ( patients recruited). Both passive mobile sensor data as well as ecological momentary assessments were available for modelling. We evaluated the models’ ability to predict symptoms of depression (Patient Health Questionnaire-2; PHQ-2) at the end of each day, and to forecast symptoms of the next day.
Results: In our experiments, we achieve a best mean-absolute-error (MAE) of (25% improvement) for predicting PHQ-2 values at the end of the day with subject-dependent standardisation compared to a non-personalised baseline (). For one day ahead-forecasting, we can improve the baseline of by to a MAE of using a transfer learning approach with shared common layers. In addition, personalisation leads to fairer models at group-level.
Discussion: Our results suggest that personalisation using subject-dependent standardisation and transfer learning can improve predictions and forecasts, respectively, of depressive symptoms in participants of a digital depression intervention. We discuss technical and clinical limitations of this approach, avenues for future investigations, and how personalised machine learning architectures may be implemented to improve existing digital interventions for depression.
1. Introduction
Depressive disorders are very common in the general population, with twelve month prevalence estimates ranging from 5.9–7.7% (1–4). They are associated with a vast array of negative consequences for the individual and society, including increased disability (5), loss of quality of life (6, 7), suicidality (8, 9), excess mortality (10, 11), as well as large economic costs (12, 13). By 2030, depression is estimated to become the leading cause of disability-adjusted life years in high-income countries (14, 15). Thus, the development and widespread dissemination of effective treatments for depressive symptoms constitutes a public health priority.
Research documents a substantial treatment gap among individuals who suffer from depression. Even in high-income countries, depression treatment rates are often below 30% (16, 17). It has been found that structural barriers, but also attitudinal factors such as preference to self-manage or personal stigma may play a role in the limited utilisation of existing services (18). Digital interventions have therefore been discussed as an instrument to increase help-seeking (19, 20), since such interventions are easily accessible and can provide greater anonymity. Digital interventions can be provided to everyone with Internet access and are highly scalable. Therefore, they may also allow to address structural barriers in the health care system (21).
Digital interventions have been found to be an effective treatment for a broad range of mental disorders (22), including depression (23). However, it is still largely unknown for whom these interventions work, and why (24). Overall, treatment non-response remains a pervasive issue in major depressive disorder (MDD) patients, with approximately 37% achieving remission after the first course of evidence-based treatment (i.e., pharmacotherapy, psychological interventions, or combination therapy), and 67% after trying out several courses of treatment (25). “Sudden losses” and relapse remain a frequent phenomenon within or following depression treatments (26, 27).
These findings underline the potential of a more personalised treatment approach, particularly with respect to methods that allow for an early detection of symptom changes. Current digital interventions typically follow a “one size fits all” approach that is very limited in its capability to react adaptively to patients’ individual trajectory. Therefore, data-driven methods are increasingly discussed as a method to open up the “black box” of psychological treatment, and thus building the basis for tailored interventions (21, 28). Interventions based on digital applications may be particularly suited for data-driven tailoring, since they allow to capture an unprecedented amount of potentially meaningful symptom and process information. This could allow, for example, to provide targeted behavioral prompts, ecological momentary interventions (29), and additional human guidance when patients experience symptom spikes during treatment; or to exploit predicted improvements by encouraging patients to reflect on potential behavior changes they have since implemented.
There are several data sources by which data-driven models of symptom trajectories have been developed in previous research. In an emerging research field known as “Personal Sensing” (30) or “Digital Phenotyping” (31, 32), scientists are using mobile sensor data as created by commercially available smartphones or wearables to measure high-level indicators of individuals’ mental health (e.g., sleep patterns, stress, or depressed mood). This type of research has established that passive sensor data can be used to predict various symptoms of mental disorders or mental health problems (23, 33–38), as well as their future development [e.g., (39)].
A related research field involves the use of “Ecological Momentary Assessment” [EMA; (40)], in which patients’ behaviors and experiences are repeatedly sampled in situ, often using (e.g., digitally administered) self-report questionnaires. EMA is frequently used to gain a personalised understanding of the temporal dynamics of mental disorders, and their influences (41). However, EMA data has also been successfully used to predict the development of symptoms within treatments [e.g., (42)].
Currently, most data-driven approaches employ “general” models to predict current or future mental health symptoms. This means that one model capturing overall patterns across patients is derived from the training set, which allows to generate individualised predictions conditional on provided data. However, it has been recognised that the inherent clinical heterogeneity associated with mental disorders may necessitate a greater focus on inter-individual differences to ensure generalisability to unseen cases (39, 43, 44). With respect to passive sensor data, for example, a large-scale study by (45) demonstrated that depression prediction accuracies using a heterogeneous student sample () did not generalise once models were applied to a more representative, heterogeneous sample ().
Therefore, personalised models are progressively explored as a promising approach to predict mental health in heterogeneous real-world datasets (39, 46, 47). In a personalised learning approach, an idiographic model is developed for each individual or a smaller patient subset, often while retaining a “backbone” infrastructure that captures common features across subjects. Most of the personalisation approaches can be assigned to one of the following three areas: (1) user-specific, (2) similarity-based, as well as (3) enrolment-based approaches.
The first group represents a user-dependent method that depends on data of the user for whom the model will be personalised (46, 48). Busso et al. (49), for example, propose a user-dependent personalisation approach for speech applications using speaker-dependent feature normalisation. Other methods of user-dependent personalisation are approaches that have a common backbone model trained on the whole population, which is extended with personalised layers per subject (46, 48). Similarity-based and enrolment-based methods are user-independent and can be applied even if no longitudinal data of participants is available (50–52). Dividing patients into subgroups makes it possible to train a separate model for each cluster using similarity-based personalisation. By subsequently assigning new patients to the group they are most similar to, the model can learn subgroup-specific characteristics, often leading to an improved performance compared to general trained models. Li and Sano (51), for example, found that user-dependent models perform better in comparison to user-independent approaches. Finally, enrolment-based strategies attempt to adapt to new users using only a limited number of enrolment samples for which the ground-truth label is available (52).
Overall, personalisation may also allow to address frequently overlooked issues concerning the fairness of prediction models across patients. Predictive models, especially general ones, often work better in one subgroup of the population than in others. Such biases may further reinforce existing disparities in health care, for example with respect to gender or minority status (53). Model personalisation may also be an auspicious approach to meet this challenge, by allowing to pay greater attention to the variation of predictive accuracies between and within individuals.
In addition to group-level fairness, individual fairness arises in several tasks where the target manifests itself differently in distinct (human) subjects. This ranges from the expression of fatigue in runners (54), to stress and emotion in voice (55, 56), and, crucially, mood prediction from wearable sensors (46). We note that the standard individual fairness formulation proposed by Dwork et al. (57), which purports that similar individuals should receive similar outcomes, is not applicable in our work. This is because Dwork et al. (57) applied their framework to tasks where each individual is assigned once to a particular class (e.g., in recidivism cases); however, we apply our models several times to each individual to predict their PHQ-2 scores over time.
In this study, we therefore examine the utility of different personalisation strategies in providing daily predictions and forecasts of depressive symptoms. We focus on a real-world sample of patients suffering from clinically relevant levels of depression who provided mobile sensor and EMA data while participating in a digital depression intervention. In this context, we also assess the group- and individual-level fairness of the developed approaches. Even though individual fairness emerges in several prior works, there is no widely-accepted metric to quantify it. Therefore, we attempt to bridge this gap by proposing a set of indices motivated by related fields.
2. Methods
2.1. Data
In this section, we introduce the novel “Mobiler Alltagstherapieassistent mit interaktionsfokussierter künstlicher Intelligenz bei Depression” (MAIKI; german translation for “Mobile Therapy Assistant for Daily Life with Interaction-focused Artificial Intelligence for Depression”) dataset. The MAIKI dataset was collected as part of a prospectively registered feasibility trial within the MAIKI project (German Clinical Trials Register; DRKS00024718). The study procedures have been approved by the ethics committee of the Friedrich-Alexander-University Erlangen-Nuremberg (385_20B).
Figure 1 displays a Consolidated Standards of Reporting Trials [CONSORT; (58)]-type flow diagram of the MAIKI trial. Between May 2021 and September 2021, a total of patients were recruited for the study. Individuals were eligible for the study if they showed elevated symptoms of depression, defined by a score of 16 on the 20-item German version of the Center for Epidemiological Studies’ Depression Scale [CES-D; (59)]. Furthermore, participants were required to have access to an Android smartphone. Patients were assessed at baseline and post-test (8 weeks after treatment assignment), resulting in a study period of approximately 8 weeks for each individual. At baseline, the Structured Clinical Interview for DSM-5® Disorders [SCID; 5th Edition; (60)] was conducted by trained psychologists via telephone to determine if patients fulfilled the diagnostic criteria of a manifest depressive disorder. While the SCID-5 is intended to be delivered face-to-face, interviews conducted via telephone have been found to show only slightly inferior reliability, supporting their use for research purposes (61). Participants were then assigned to “HelloBetter Depression Prävention,” a digital depression application. The intervention is based on “GET.ON Mood Enhancer,” a program that has been evaluated in multiple randomised controlled trials (62–64).
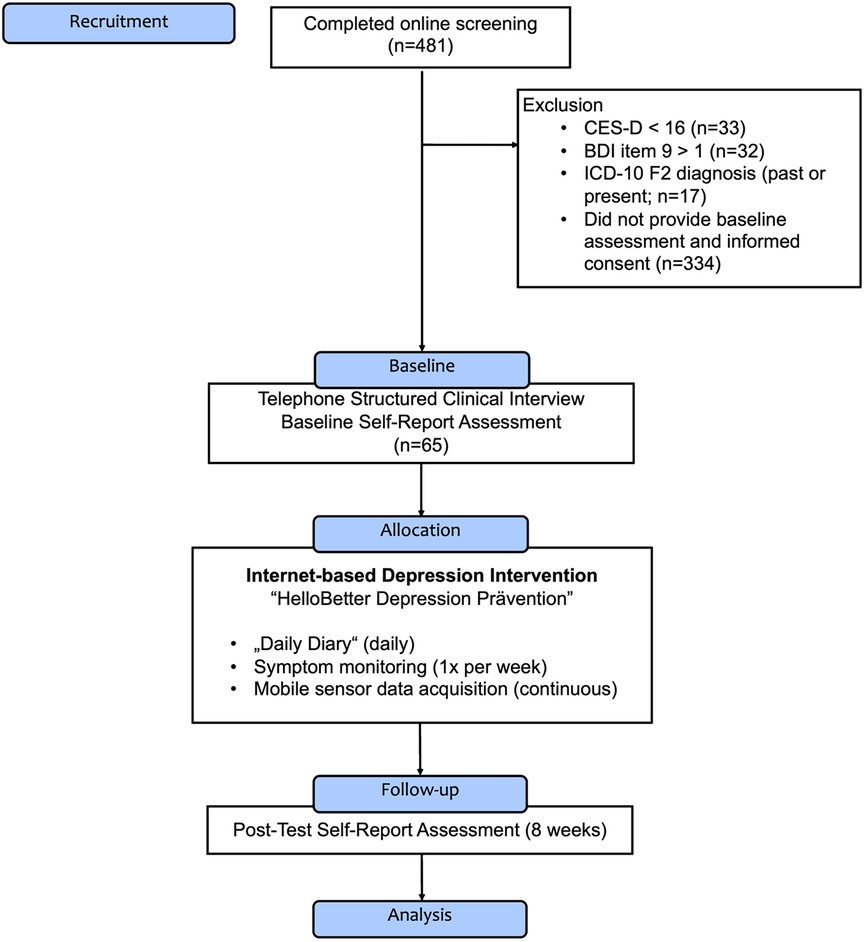
Figure 1. Flow diagram of the “MAIKI” study.
As part of the intervention, participants installed two mobile companion applications: (1) the “HelloBetter MAIKI” diary and symptom tracking app, developed for this study; and (2) the “Insights” smartphone application (65). Using this technical setup, active EMA ratings as well as passive sensor and location data could be recorded during the 8-week intervention period. Therefore, we categorise our data collection into two classes: active data, which requires an interaction with the participant and passive data, which is collected automatically without a conscious interaction of the participant. The various data streams as well as the feature extraction methods are outlined in more detail below. Since MAIKI is a real-world dataset, there are also days when no data was collected of some individuals, either due to non-response or due to technical issues; section 2.3 describes the missing data handling and what criteria were applied to ensure data quality.
2.1.1. Actively collected data
Active data collection took place in four different ways. First, at the beginning of the study, audio data were recorded during the SCID interview with a trained psychologist. Second, before treatment assignment, a comprehensive baseline assessment was conducted. This included sociodemographic information, as well as psychometrically validated measures of behavioral activation [Behavioral Activation for Depression Scale-Short Form; BADS-SF; (66)], anxiety symptoms [Generalized Anxiety Disorder 7; GAD-7; (67)] and quality of life [Assessment of Quality of Life; AQoL-8D; (68)]. A comprehensive list of all administered questionnaires is presented in the trial registration (cf. section 2.1). Symptom inventories were again administered at post-test (8 weeks after treatment assignment). Third, ecological momentary assessments were collected using the mobile companion application. Three times a day, participants were able to rate their affect by assessing to which extent they felt “happy” and “active” (positive affect) as well as “tense” and “sad” (negative affect). Ratings were provided on a scale from 0 (strongly disagree) to 6 (strongly agree). We derived these affect items from previous personalized sensing studies [which used the circumplex model of emotion as basis; (69, 70)] and a review of affect measurement in previous EMA studies (71), to increase the comparability with existing literature. Additionally, participants were instructed to fill out a “daily diary” at end of each day, which included a selection of items adapted from psychometric questionnaires: the Personality Dynamics Diary [PDD; agentic/communal reward, workload; (72)], CES-D scale (item 5, 7, 20), Pittsburgh Sleep Quality Index [PSQI; item 6; (73)], BADS-SF (item 1, 5, 7), as well as the PHQ-2 depression inventory [Patient Health Questionnaire, two items version; (74)]. Fourth, each patient underwent a weekly screening, in which depression [Patient Health Questionnaire, 9 item version; PHQ-9; (75)], anxiety symptoms (GAD-7), as well as perceived stress [Perceived Stress Scale, short version; PSS-4; (76)] were assessed.
2.1.2. Passive mobile phone and sensor data
Using mobile phones and sensors, data was also passively collected to obtain the following information: Insights into (1) patient movement patterns through GPS data, (2) communication behaviour based on previous calls, (3) phone usage behaviour, and (4) user activity data. This exploratory feature list was selected based on technical feasibility, as well as on associations with mood symptoms found in previous studies (38). For GPS, we extracted features, such as the location variance or the daily distance travelled. Furthermore, information on spent time at home and time at specific location clusters is included. For the location clustering, the three different cluster approaches DBSCAN (77), -means (78), and time-based clustering were used. Communication includes information about the calling patterns of study participants, e.g., how much time they spent each day making phone calls or the number of missed calls, which represent information about the frequency and entropy of calls. Phone usage contains information on typical usage behaviour in the form of frequency of phone use and total time spend on the mobile phone per day. The last group – user activity – relates, e.g., to the app usage behaviour, which provides information about the frequency of app usage. In addition, features on sleep behaviour were extracted based on the mobile phone usage data, including sleep duration and app usage behaviour during the night.
Table 1 lists all features that were extracted from the passive data of the MAIKI dataset. In total, 19 features were extracted, based on the four groups GPS, communication, phone usage, and user activity. For our experiments, we use both, all active and passive data.
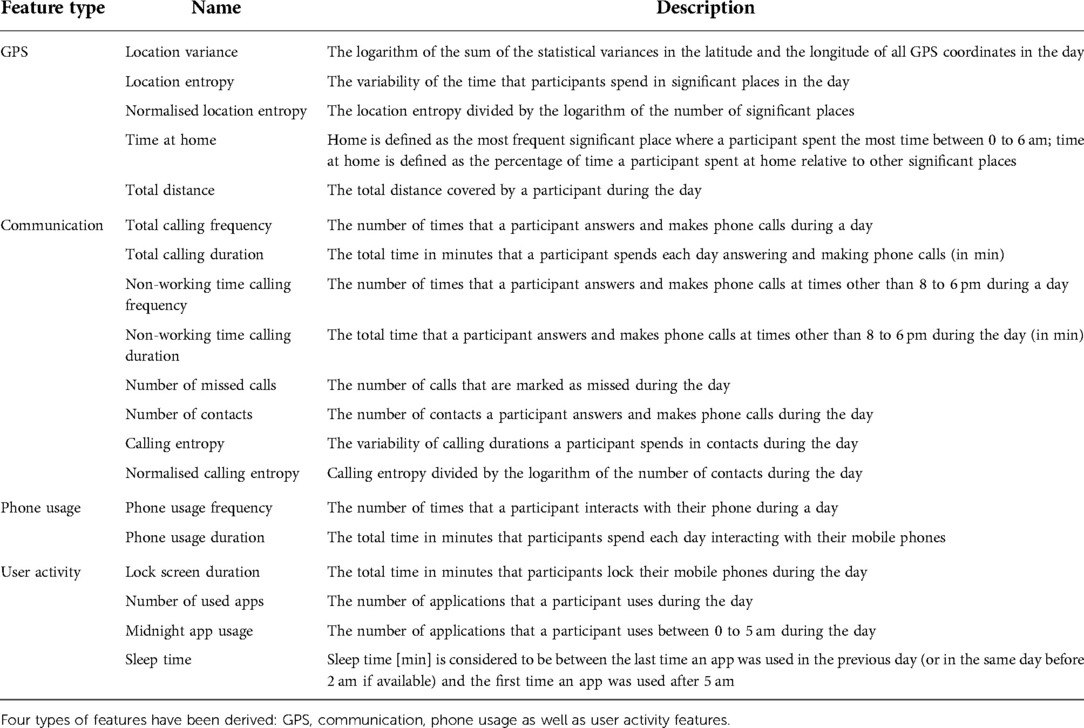
Table 1. Features extracted from the passively collected MAIKI data.
2.2. Data exploration
In this section, we outline the presented MAIKI dataset in more detail. A total of 65 people have participated in the study (intention to treat sample). However, a considerable percentage of the study participants only provided a small amount of data. This means that data was either only provided over a short period of time or the data was provided over a longer period of time but included many missing values. In section 2.3, we explain our pre-defined data quality criteria and how we handle missing data. Table 2 shows both statistics of the dataset: information about all participants as well as exclusively about the participants who meet our quality criteria that we use in our analyses.
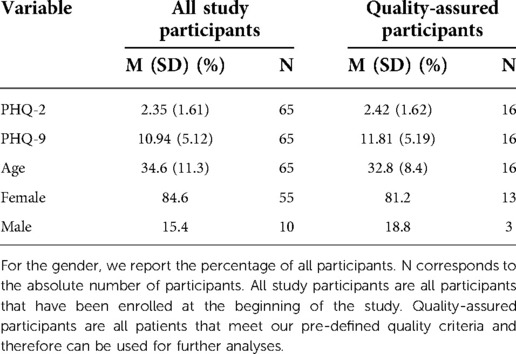
Table 2. Statistics of the MAIKI dataset. For PHQ-2, PHQ-9 and the age of the participants, we report the (M)ean value as well as the (S)tandard (D)eviation.
The 2- and 9-item Patient Health Questionnaires (PHQ) are two psychometrically valid and commonly used measures of depressive symptom severity (74, 75). Both measures are well established in clinical practice, and are therefore well suited as prediction and forecasting targets. For this reason, we choose these labels as targets for our experiments as well. Figure 2 shows the PHQ-2 label distribution in the MAIKI dataset.
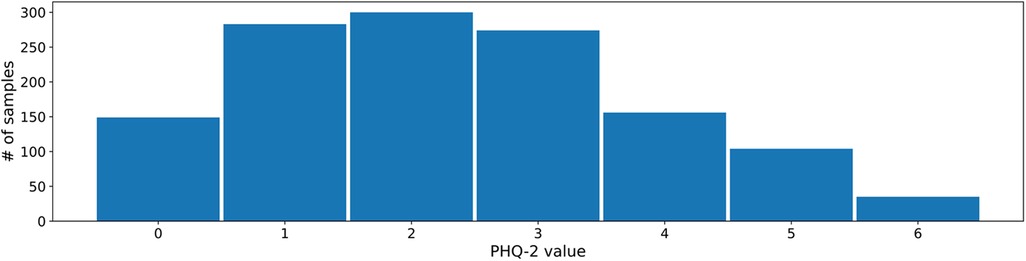
Figure 2. Distribution of daily self-assessed PHQ-2 ratings (scale: [0–6]) within the MAIKI study.
For model building, we use a broad range of active and passive data. To get an impression of which features have the greatest influence on prediction and forecasting, a random forest regressor with 50 decision trees was trained as part of the dataset exploration for predicting the PHQ-2 value. Based on this, the relevance of the different features is determined. Figure 3 shows the 10 highest variable importances of all available features identified. The analysis indicates that the EMA data in particular make a considerable contribution to the prediction result. In addition, sleep time as part of the user activity features as well as several GPS features are among the most relevant features. A detailed overview with descriptive statistics of all actively- and passively-collected data is included in the supplementary material.
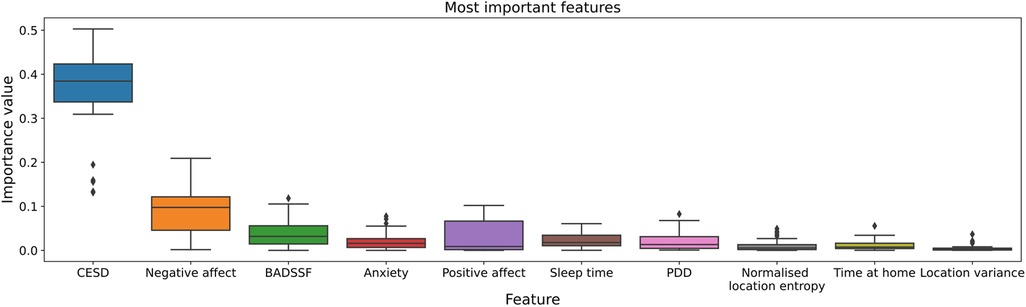
Figure 3. The 10 most important of all available features for PHQ-2 prediction. Determined by a Random Forest Regressor with a number of 50 different decision trees. In particular, the EMA data have a great influence on the prediction result: Center for Epidemiological Studies’ Depression Scale (CESD), negative affect, Behavioral Activation for Depression Scale-Short Form (BADSSF), Personality Dynamics Diary (PDD).
2.3. Preprocessing
As described in section 2.2 MAIKI is a real-world dataset and therefore contains missing data. To deal with all missing values, we define and apply the following strategy and data quality criteria: (1) Each day with available features of one participant is only considered as valid if the data missing rate over all features is less than 20%. (2) A participant’s PHQ entry is only considered if the patient provides at least five days of valid data in the week prior to the corresponding PHQ label date, taking into account criterion 1 as valid data criterion. (3) Each study participant needs to provide at least 10 valid entries for PHQ-2 and 5 for PHQ-9 respectively, considering criterion 2. These criteria were imposed to maximize the number of participants who contribute information, while trying to minimize the risk of biased results due to large amounts of missing data on a person level.
If features for one day are missing, but the missing rate is less than 20%, we perform statistical imputation by calculating the mean value of the missing feature based on all available days in the week prior to the corresponding label of the participant. Criterion 3 is necessary as we need data from each participant in the training set, development set as well as test set to be able to apply our personalisation approach.
2.4. Baseline model
Based on our pre-defined quality criteria, we have at least five days of data for every PHQ label of every patient. To consider the sequential order of this data and to process it in the best possible way, we use a recurrent neural network (RNN) with gated recurrent units (GRUs) as a baseline model. GRUs are an improved version of a standard recurrent neural network which improve on its vanishing gradient problem using so-called update and reset gates (79). These gates are represented by vectors and can be trained to preserve long-term information without losing important parts that are relevant for prediction. The model consists of two GRU layers with a hidden size of 30, one fully connected layer with 30 neurons as well as an output layer with one neuron. Further, we use a Rectified Linear Unit (ReLU) as an activation function and apply a dropout of 20% after the fully connected layer.
We use the same baseline model for predicting depression at the end of the day as well as for one day ahead forecasting, both based on data up to 7 days before the corresponding label. This time frame was chosen so that training instances encompass each day of the week.
2.5. Personalisation methods
We experiment with three different personalisation methods: First, a transfer learning approach, where we have both shared common layers as well as personalised layers for each subject. Second, we use the same architecture of the baseline model, but instead of subject-independent standardisation, we apply a subject-dependent standardisation technique. As a third personalisation method, we experiment with separate subgroup models for female and male study participants. All personalisation strategies are outlined in more detail below. Figure 4 shows a simplified overview of our baseline model as well as of all three personalisation approaches.
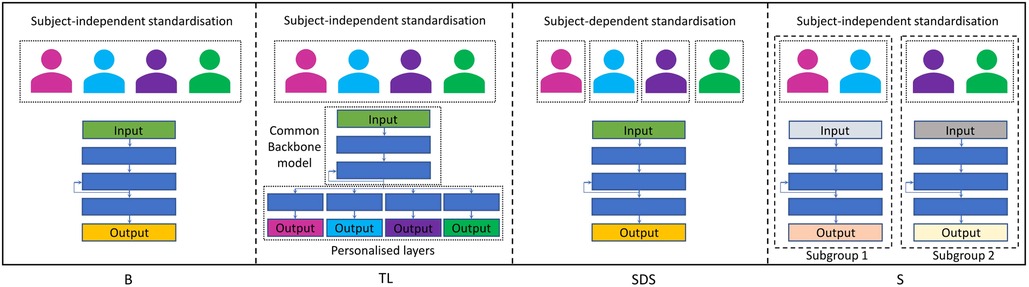
Figure 4. Simplified overview of our (B)aseline model as well as of the three personalisation approaches used in our experiments: (T)ransfer (L)earning with shared common layers, (S)ubject-(D)ependent (S)tandardisation, and (S)ubgroup models.
2.5.1. Transfer learning with shared common layers
Following the approach of Rudovic et al. (48) and Taylor et al. (46), we use a similar architecture by combining a common backbone model with personalised layers for each subject. In our experiments, we train at first the baseline model with data from all study participants of the train set. Afterwards, we use the two layer GRU-RNN of the pretrained model as backbone model. As personalised layers, we use the fully-connected layer with 30 neurons as well as the output layer of the baseline model, which we fine-tune separately on every individual participant, resulting in a unique model for each patient.
2.5.2. Personalised subgroup models
Similar to Rudovic et al. (48), we also experiment with personalised subgroup models for depression prediction and forecasting. As criterion for subgroup models, we choose the gender information which is provided in the MAIKI dataset as shown in table 2.
For modelling of each subgroup, we use the same architecture as for the baseline model, resulting in two separate models, each trained only on data from one gender.
2.5.3. Personalisation with subject-dependent standardisation
Finally, we experiment with subject-dependent standardisation. In doing so, we use the same model as for the baseline but changed the standardisation process: In all other approaches, we apply standardisation in one step for all participants in the dataset, using the statistics of the entire training population. With subject-dependent standardisation, in contrast, we apply standardisation of the data for each subject separately, resulting in one common model for all participants, but each with a personalised data standardisation.
2.6. Experimental setup
We design two tasks for depression prediction and forecasting: The first task is to predict the PHQ-2 score at the end of the day based on the data of the last 7 days. The second task is one day ahead forecasting of the PHQ-2 value using the data of up to the last 7 days.
For evaluating our experiments, we use 3-fold cross validation (CV). To be able to personalise a model to all participants, we need subject-dependent data splits. This means that we need, in all datasets (train/development/test), data from each patient. Therefore, we split the data from each participant in 3 folds. For the overall 3-fold CV, we use always from each participant one hold-out fold as test set, 80% data of the remaining two folds as train set, and 20% of the remaining data as development set, respectively. Furthermore, we use the mean-absolute-error (MAE) as evaluation metric as it is more robust to outliers compared to metrics such as mean-squared-error (MSE). In addition, we evaluate our results with Spearman’s correlation, which measures how well models are able to predict the correct ordering of instances—thus enabling medical practitioners to detect the most severe cases.
All models were trained for 100 epochs with a batch size of 8 and a learning rate of 0.01, by gradient descent and using the Adam optimiser. The final model state was selected on the basis of validation set performance. As loss function, the MAE loss is applied.
2.7. Fairness metrics
A critical consideration for digital health applications is fairness, which requires that model predictions do not show biases for certain protected attributes like race, biological sex, or age (80). In this section, we describe the metrics we use in our experiments for analysing the fairness of personalisation methods compared to non-personalised approaches.
2.7.1. Group-level fairness
With regard to fairness at group-level, we focus on biological sex as this is the only relevant, group-level variable available in our study. There is no clear definition on how to measure fairness for regression tasks, but most approaches try to achieve an equal average expected outcome for the different populations (55, 81). We adopt a similar formulation and measure fairness with two scores: the sex fairness scores and the sex fairness bias (55). These metrics are computed as follows:
where is the MAE for all male/female samples in the test set, are the predictions for all male/female samples, the truth values for all male/female samples, and denotes the mean. The first measures the difference in MAE performance for the two sexes; a higher positive/negative score indicates a higher MAE, and thus lower performance, for males/females. The second shows whether the model systematically over- or under-predicts PHQ-2 for one of the groups (accounting for potential differences in the ground truth label distribution); a higher positive/negative bias shows that the model is systematically predicting higher PHQ-2 scores for males/females, thus showing one of the two groups as being “more depressed.” The ideal values for both metrics would be – indicating a complete lack of bias in either direction.
2.7.2. Individual-level fairness
A complementary fairness constraint is to ensure equal outcomes on an individual basis (55). This is important for ensuring that a depression detection system does not favour certain individuals over others. Furthermore, we expect personalisation approaches to generally improve individual-level fairness. However, there is no widely-accepted metric to quantify individual fairness. To fill this gap, we propose a set of indices motivated by related fields.
The first such index is the Gini Coefficient (GC), a typical measure of (in)equality used in the field of economics to quantify income inequality. This metric can be broadly used to quantify the diversity within a set of values; we thus co-opt for our machine-learning scenario, where we compute the GC for the individual-level performances. This essentially shows the extent to which some participants yield much higher MAE scores than others with
with being the performance of participant and the number of participants. As GC goes towards , the performance is mostly balanced; as it goes towards , a few speakers get much higher MAE scores than others.
However, GC provides only a coarse quantification of inequality. Moreover, in the present study we are primarily interested in comparing different approaches; the fact that one approach might have a lower GC than others means only that the differences amongst participants are low, but says nothing on whether the approach is overall more beneficial to those participants.
We satisfy this second criterion by computing the distance to the median participant-level MAE separately for participants with a lower/higher MAE than the median. Our rationale is as follows: The median serves as the performance that the “average” participant should expect. This divides the group of participants to a set of “winners” and “losers”; those for which performance is higher, and those for which it is lower. When comparing the sum of distances of each group to the median, we get how much each group benefits from the proposed approach. Concretely, these two indices are computed as follows:
and
where and are again the performance per participant and the number of participants, respectively.
The use of DMLI and DMUI allows for a more nuanced selection between different methods. For example, practitioners might select to optimise for DMUI (the lower the better)—thus capping the worst-case scenario. Others might choose to optimise for DMLI (the higher the better)—thus boosting performance for those participants for which the system works satisfactorily. This choice (which is reminiscent of the precision-recall tradeoff) is context-dependent.
3. Results
3.1. Prediction of daily PHQ-2 scores
Table 3 shows the results of the performed experiments. In the case of PHQ-2 prediction, the personalised models clearly outperform the non-personalised baseline. The best result is obtained using subject-dependent standardisation which yields a MAE of and Spearman’s correlation of compared to the non personalised model that achieves and , respectively. The other two personalisation methods also improved the result, although not quite as strongly as the subject-dependent standardisation method. In addition to the global Spearman’s correlation coefficient, the local Spearman’s also improved from using the baseline to an average of across the different personalisation strategies. In depression prediction, e.g., predicting PHQ-2 with heterogeneous health data, personalisation can therefore add value and improve performance compared to non-personalised approaches.
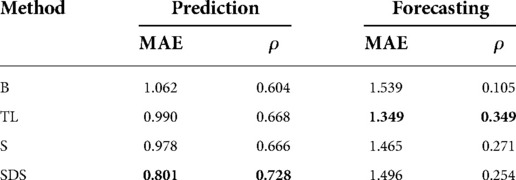
Table 3. PHQ-2 (scale: [0–6]) prediction and forecasting results, reported as mean-average-error (MAE) and Spearman’s correlation using the four methods: (B)aseline-GRU without personalisation, (T)ransfer (L)earning, (S)ubgroup models, and (S)ubject-(D)ependent (S)tandardisation.
3.2. One day ahead-forecasting of PHQ-2 scores
In one day ahead forecasting of PHQ-2 scores, the different personalisation methods improve the baseline result as well. Table 3 shows the results for PHQ-2 forecasting. The best MAE and Spearman’s is obtained using the personalised transfer learning approach with a shared common backbone model and personalised layers with a result of and compared to the baseline which yields and , respectively.
3.3. Group-level fairness
Table 4 presents the sex fairness score as well as the sex fairness bias for each method. The baseline shows a high bias for both tasks; the performance for females is consistently higher than for males (i.e., the Sex Fairness Score is negative) while females are being systematically predicted as having higher PHQ-2 scores (i.e., the Sex Fairness Bias is negative). Collectively, these two metrics show that males are predicted more wrongly with a bias towards negatives—causing a lot of high PHQ-2 cases to be mispredicted as having low PHQ-2 scores. Notably, personalisation methods most often improve on both metrics, with subgroup-models showing the best performance for prediction (where the bias is almost completely eliminated), and transfer learning with shared layers performing best for forecasting (where the performance still remains higher for females but there are no systematic over-/under-predictions).
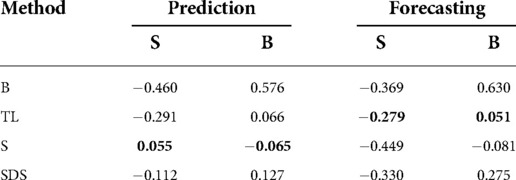
Table 4. Sex-Fairness-(S)core and Sex-Fairness-(B)ias of the different methods for PHQ-2 prediction and forecasting: (B)aseline-GRU without personalisation, (T)ransfer (L)earning, (S)ubgroup models, and (S)ubject-(D)ependent (S)tandardisation.
3.4. Individual-level fairness
Similar to Wagner et al. (55), we present the individual-level fairness by considering the MAE performance separately for each subject in the first step. This is done by computing MAE using the samples of each participant. The outcome is visualised in figure 5. Performance shows big fluctuations across different participants. For example, for the prediction task with transfer learning, it ranges between [0.000, 1.519]—a large difference which means that the system works much better for some individuals over others. Interestingly, there is sometimes disagreement as to where the system works well (e.g., for forecasting, participant #4 is ranked as the best performing one for all methods except the baseline). This is an aspect of the underspecification exhibited by machine learning architectures, where different models trained on the same data show different behaviours on distinct subpopulations of it (55, 82).
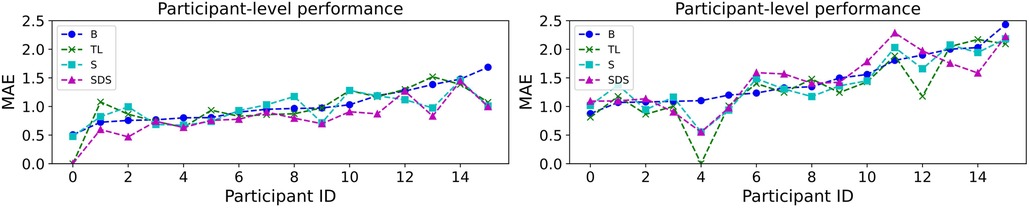
Figure 5. Individual-based MAE performance for PHQ-2 prediction (left) and forecasting (right) using the (B)aseline model as well as the three personalisation methods: (T)ransfer (L)earning, (S)ubgroup models, and (S)ubject-(D)ependent (S)tandardisation. The MAE values are calculated using the samples of each participant of the study. The participants are sorted from best to worst performance of the baseline model.
Table 5 shows all three indices proposed in section 2.7.2: GC, DMLI, and DMUI. We note that the baseline model is already showing good behaviour with respect to GC; in fact, it comes first for forecasting with a GC of and second for prediction with a GC of (following subgroup models with ). This shows that our proposed personalisation approaches increase the diversity of performance within individual participants, thus seemingly increasing inequality. However, the other two indices show a different pattern. DMLI is consistently higher when personalisation is used, while DMUI is consistently lower—this shows that “winners” further diverge from the median while “losers” come closer to it. Overall, this leads to a trend where all participants gain by having improved MAE scores. The fact that GC decreases is side-effect of the fact that DMLI increases more than DMUI decreases (on average). This means that all three personalisation methods favour “winners” (participants who fare better than the median). This leads to a bigger divergence between those on the upper and those on the lower end.
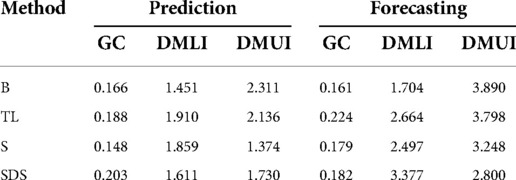
Table 5. Individual-level fairness captured by the Gini Coefficient (GC), Distance-to-Median Lower Index (DMLI), and Distance-to-Median Upper Index (DMUI). GC serves as a coarse marker of inequality, with DMLI and DMUI further elucidating whether the benefits are reaped by those in the lower or upper end of individual-level performance.
As the choice of optimising for DMUI or DMLI is context-dependent, we avoid marking one of the approaches as “best”: transfer learning shows better behaviour for DMLI, whereas the other two work better for DMUI.
4. Discussion
In this study, we investigated the performance benefits of different personalisation strategies (transfer leaning, subgroup models, subject-dependent standardisation) in predicting individuals’ (future) depressive symptom severity as measured by the PHQ-2. Our experiments were based on a novel dataset that was collected while patients with elevated depressive symptoms received a digital intervention under routine care-like conditions. In a subset of patients who provided sufficient active EMA as well as passive mobile sensor data, we found that all investigated personalisation strategies lead to improved predictions of the end-of-day depressive symptom severity ( to ), compared to a general RNN model (). A similar pattern was found for forecasts of patients’ depressive symptoms the next day ( to ; baseline model: ). We also examined the models’ fairness with respect to patients’ self-reported biological sex, which is a crucial desideratum in digital mental health applications. We found that personalisation was able to reduce the bias inherent in the initial baseline model (in our case favoring females). Similarly, we found that all patients obtain improved predictions via personalisation, although not all benefit equally. This result is in line with previous findings by Jacobson and colleagues (39), who found that the perfomance of idiographically weighted models in predicting depressed mood varied substantially between individuals. Our findings also corroborate the results of Taylor et al. (46), who report that personalized Multitask Learning (shared common layers neural network, multi-kernel learning using support vector machines, and hierarchical Bayesian models with a common Dirichlet process prior) improved prediction accuracies by 11–21% over non-personalized models. However, in contrast to aforementioned study, we only found that two personalisation strategies (Subject-Dependent Standardisation and Transfer Learning) resulted in substantial benefits compared to the non-personalised baseline RNN.
Revisiting the hypothesis of Taylor and colleagues (46), one potential reason why model personalisation may provide benefits over “traditional” machine learning methods is because this allows to deal with heterogeneity, a feature that is characteristic both of depression and the way patients respond to treatment (83, 84). Personalisation allows models to learn patterns that may be specific to the symptomatology of each patient, which could explain why performance benefits arise. From a clinical perspective, the ability to generate tailored forecasts of the depressive symptom severity is very helpful. This could allow to react pre-emptively to short-term symptom changes during treatment [e.g., sudden gains or depression spikes; (85, 86)], for example by providing personalised feedback, therapeutic recommendations, or direct contact to health care professionals.
Several limitations and challenges should be considered. First, due to missing values, only a subset of patients in the MAIKI dataset could be included in our experiments. This is a common finding in studies based on real-world data, particularly if mobile sensor features are included [see, e.g., (34, 35)]. Seamless recording of sensor data proved to be technically challenging in many cases, given that all patients used their privately owned smartphone device. Some individuals, for example, reported difficulties installing and navigating the companion tracking app. Seamless tracking of passive features could not be ensured on some devices due to software issues. These problems might be mitigated in future studies by providing participants with mobile devices or wearables; however, this could compromise the ability to implement developed models into routine care, where provision of standardised devices is typically not possible. Second, in our exploration of variable importances, we found that most of the important features were based on actively assessed data. In a related study, it could be shown that reasonable depressive symptom severity forecasts could also be generated using actively obtained EMA data only (47). Therefore, focusing on actively assessed data may be a way to provide personalised depression forecasts at greater scale, given the lower technical requirements. Structured self-monitoring is a common feature in cognitive-behavioural treatments for depression (87), and EMA ratings may therefore serve a twofold objective: providing therapeutic feedback to patients, while at the same time allowing to build a personalised forecasting model of the individual’s symptomatology.
Another limitation is that some of the personalised models investigated in this study require that several weeks of individual training data are available. This represents a constraint in clinical practice, since forecasts may only become available a few weeks into treatment. Future studies may examine how much the “burn-in” phase for individual patients can be shortened while still retaining appreciable forecasting performances. Alternatively, general models may be used initially, switching to a personalised model once sufficient patient data has been collected. It is also important to note that a wide variance of PHQ values must be collected from each participant during this time—otherwise, the personalised model may tend to overfit. To further counteract this, we also propose methods that incorporate features from the whole population, such as transfer learning with shared common layers, as well as models that are personalised on smaller subgroups rather than just a single individual.
In sum, our findings provide preliminary evidence that model personalisation, based on EMA ratings and supported by passive mobile data, can be used to improve daily forecasts of depressive symptom severity in real-world patient populations, as well as their fairness. Our experiment follows a broader research trend, found both in affective computing and clinical psychology, in which greater emphasis is put on individual patterns and dynamics of psychopathology [see, e.g., (41, 46, 88)]. Further research is needed to corroborate our results in larger samples, and to develop model personalisation strategies that can be implemented into digital mental health care at scale.
Data availability statement
Factually anonymized scientific use files containing data obtained as part the MAIKI study are available to researchers of scientific institutions. Data may only be analysed for non-commercial purposes based on a data use agreement. Due to confidentiality reasons, the scientific use files contain fewer and further aggregated variables. Requests to access the datasets should be directed toZS5oZWJlckBoZWxsb2JldHRlci5kZQ==.
Ethics statement
The studies involving human participants were reviewed and approved by Ethics committee of the Friedrich-Alexander-University Erlangen-Nuremberg (385_20B). The patients/participants provided their written informed consent to participate in this study.
Author contributions
AK, MH and AT wrote the first version of the manuscript. AK and AT wrote the technical chapters of the manuscript. MH contributed contents concerning the clinical background, interpretation and research methodology. LK, together with MH, planned and coordinated the MAIKI trial. LK also contributed to the initial idea for this study. EH, IG, and DDE are principal investigators of the MAIKI project. AK, AT, XH, MM, MG, TY, and STR extracted all the features used in the experiments. LK and MH also helped in the feature extraction process. BWS contributed to the overall organisation and planning as well as analysis and interpretation for this study. All authors contributed to the further development of the manuscript. All authors contributed to the article and approved the submitted version.
Funding
Data analysed in this publication were collected as part of the MAIKI project, which was funded by the German Federal Ministry of Education and Research (grant No. 113GW0254). The responsibility for the content of this publication lies with the authors. MH is supported by a fellowship of the Bavarian Research Institute for Digital Transformation (BIDT).
Acknowledgment
The authors would like to thank Annika Montag for her involvement in the study management of the MAIKI trial; as well as Paula Kuper for her assistance during the data preprocessing phase.
Conflict of interest
EH and DDE are shareholders, and LK and MH are employees of GET.ON Institut für Gesundheitstraings GmbH/HelloBetter, which aims to implement scientific findings related to digital health interventions into routine care. DDE reports to have received consultancy fees or served in the scientific advisory board from several companies such as Novartis, Sanofi, Lantern, Schön Kliniken, Minddistrict, and German health insurance companies (BARMER, Techniker Krankenkasse). BWS is employed by the company audEERING GmbH. The remaining authors declare that the research was conducted in the absence of any commercial or financial relationships that could be construed as a potential conflict of interest.
Publisher's note
All claims expressed in this article are solely those of the authors and do not necessarily represent those of their affiliated organizations, or those of the publisher, the editors and the reviewers. Any product that may be evaluated in this article, or claim that may be made by its manufacturer, is not guaranteed or endorsed by the publisher.
Supplementary material
The Supplementary Material for this article can be found online at: https://www.frontiersin.org/articles/10.3389/fdgth.2022.964582/full#supplementary-material.
References
1. Jacobi F, Höfler M, Siegert J, Mack S, Gerschler A, Scholl L, et al. Twelve-month prevalence, comorbidity, correlates of mental disorders in Germany: the mental health module of the German health interview, examination survey for adults (DEGS1-MH). Int J Methods Psychiatr Res. (2014) 23:304–19. doi: 10.1002/mpr.1439
2. Kessler RC, Berglund P, Demler O, Jin R, Koretz D, Merikangas KR, et al. The epidemiology of major depressive disorder: results from the national comorbidity survey replication (NCS-R). JAMA. (2003) 289:3095–105. doi: 10.1001/jama.289.23.3095
3. Kessler RC, Bromet EJ. The epidemiology of depression across cultures. Annu Rev Public Health. (2013) 34:119–38. doi: 10.1146/annurev-publhealth-031912-114409
4. Lim GY, Tam WW, Lu Y, Ho CS, Zhang MW, Ho RC. Prevalence of depression in the community from 30 countries between 1994 and 2014. Sci Rep. (2018) 8:1–10. doi: 10.1038/s41598-018-21243-x
5. Moussavi S, Chatterji S, Verdes E, Tandon A, Patel V, Ustun B. Depression, chronic diseases, and decrements in health: results from the world health surveys. Lancet. (2007) 370:851–8. doi: 10.1016/S0140-6736(07)61415-9
6. Vos T, Allen C, Arora M, Barber RM, Bhutta ZA, Brown A, et al. Global, regional, and national incidence, prevalence, and years lived with disability for 310 diseases and injuries, 1990–2015: a systematic analysis for the global burden of disease study 2015. Lancet. (2016) 388:1545–602. doi: 10.1016/S0140-6736(16)31678-6
7. Hohls JK, König H -H, Quirke E, Hajek A. Anxiety, depression and quality of life—a systematic review of evidence from longitudinal observational studies. Int J Environ Res Public Health. (2021) 18:12022. doi: 10.3390/ijerph182212022
8. Bernal M, Haro JM, Bernert S, Brugha T, de Graaf R, Bruffaerts R, et al. Risk factors for suicidality in Europe: results from the esemed study. J Affect Disord. (2007) 101:27–34. doi: 10.1016/j.jad.2006.09.018
9. Dunner DL, Rush AJ, Russell JM, Burke M, Woodard S, Wingard P, et al. Prospective, long-term, multicenter study of the naturalistic outcomes of patients with treatment-resistant depression. J Clin Psychiatry. (2006) 67:15790. doi: 10.4088/jcp.v67n0501
10. Cuijpers P, Vogelzangs N, Twisk J, Kleiboer A, Li J, Penninx BW. Comprehensive meta-analysis of excess mortality in depression in the general community versus patients with specific illnesses. Am J Psychiatry. (2014) 171:453–62. doi: 10.1176/appi.ajp.2013.13030325
11. Meng R, Yu C, Liu N, He M, Lv J, Guo Y, et al. Association of depression with all-cause and cardiovascular disease mortality among adults in China. JAMA Netw Open. (2020) 3:e1921043. doi: 10.1001/jamanetworkopen.2019.21043
12. König H, König H-H, Konnopka A. The excess costs of depression: a systematic review and meta-analysis. Epidemiol. Psychiatr. Sci. (2020) 9:1–6. doi: 10.1017/S2045796019000180
13. Greenberg PE, Fournier AA, Sisitsky T, Simes M, Berman R, Koenigsberg SH, et al. The economic burden of adults with major depressive disorder in the united states (2010, 2018). Pharmacoeconomics. (2021) 39:653–65. doi: 10.1007/s40273-021-01019-4
14. Mathers CD, Loncar D. Projections of global mortality, burden of disease from 2002 to 2030. PLoS Med. (2006) 3:e442. doi: 10.1371/journal.pmed.0030442
15. [Dataset] WHO. Global burden of mental disorders and the need for a comprehensive, coordinated response from health and social sectors at the country level. Provisional agenda item 6.2, EB130/9.
16. Chisholm D, Sweeny K, Sheehan P, Rasmussen B, Smit F, Cuijpers P, et al. Scaling-up treatment of depression and anxiety: a global return on investment analysis. Lancet Psychiatry. (2016) 3:415–24. doi: 10.1016/S2215-0366(16)30024-4
17. Thornicroft G, Chatterji S, Evans-Lacko S, Gruber M, Sampson N, Aguilar-Gaxiola S, et al. Undertreatment of people with major depressive disorder in 21 countries. Br J Psychiatry. (2017) 210:119–24. doi: 10.1192/bjp.bp.116.188078
18. Andrade LH, Alonso J, Mneimneh Z, Wells J, Al-Hamzawi A, Borges G, et al. Barriers to mental health treatment: results from the who world mental health surveys. Psychol Med. (2014) 44:1303–17. doi: 10.1017/S0033291713001943
19. Johnson JA, Sanghvi P, Mehrotra S. Technology-based interventions to improve help-seeking for mental health concerns: a systematic review. Indian J Psychol Med. (2022) 44:332–40. doi: 10.1177/02537176211034578
20. Evans-Lacko S, Hahn JS, Peter L-J, Schomerus G. The impact of digital interventions on help-seeking behaviour for mental health problems: a systematic literature review. Curr Opin Psychiatry. (2022) 35:207–18. doi: 10.1097/YCO.0000000000000788
21. Ebert DD, Harrer M, Apolinário-Hagen J, Baumeister H. Digital interventions for mental disorders: key features, efficacy, and potential for artificial intelligence applications. In Frontiers in Psychiatry. Springer (2019). p. 583–627. Available at: https://doi.org/10.1007/978-981-32-9721-0˙29
22. Andersson G, Titov N, Dear BF, Rozental A, Carlbring P. Internet-delivered psychological treatments: from innovation to implementation. World Psychiatry. (2019) 18:20–8. doi: 10.1002/wps.20610
23. Moshe I, Terhorst Y, Philippi P, Domhardt M, Cuijpers P, Cristea I, et al. Digital interventions for the treatment of depression: a meta-analytic review. Psychol Bull. (2021) 147:749. doi: 10.1037/bul0000334
24. Domhardt M, Cuijpers P, Ebert DD, Baumeister H. More light? Opportunities and pitfalls in digitalized psychotherapy process research. Front Psychol. (2021) 12:863. doi: 10.3389/fpsyg.2021.544129
25. Rush AJ, Trivedi MH, Wisniewski SR, Nierenberg AA, Stewart JW, Warden D, et al. Acute and longer-term outcomes in depressed outpatients requiring one or several treatment steps: a STAR*D report. Am J Psychiatry. (2006) 163:1905–17. doi: 10.1176/ajp.2006.163.11.1905
26. Steinert C, Hofmann M, Kruse J, Leichsenring F. Relapse rates after psychotherapy for depression–stable long-term effects? A meta-analysis. J Affect Disord. (2014) 168:107–18. doi: 10.1016/j.jad.2014.06.043
27. Lutz W, Ehrlich T, Rubel J, Hallwachs N, Röttger M-A, Jorasz C, et al. The ups and downs of psychotherapy: Sudden gains and sudden losses identified with session reports. Psychother Res. (2013) 23:14–24. doi: 10.1080/10503307.2012.693837
28. Becker D, van Breda W, Funk B, Hoogendoorn M, Ruwaard J, Riper H. Predictive modeling in e-mental health: a common language framework. Internet Interv. (2018) 12:57–67. doi: 10.1016/j.invent.2018.03.002
29. Myin-Germeys I, Klippel A, Steinhart H, Reininghaus U. Ecological momentary interventions in psychiatry. Curr Opin Psychiatry. (2016) 29:258–63. doi: 10.1097/YCO.0000000000000255
30. Mohr DC, Zhang M, Schueller SM. Personal sensing: understanding mental health using ubiquitous sensors and machine learning. Annu Rev Clin Psychol. (2017) 13:23–47. doi: 10.1146/annurev-clinpsy-032816-044949
31. Torous J, Kiang MV, Lorme J, Onnela J-P, et al. New tools for new research in psychiatry: a scalable and customizable platform to empower data driven smartphone research. JMIR Ment Health. (2016) 3:e5165. doi: 10.2196/mental.5165
32. Torous J, Onnela J, Keshavan M. New dimensions and new tools to realize the potential of RDoC: digital phenotyping via smartphones and connected devices. Transl Psychiatry. (2017) 7:e1053– . doi: 10.1038/tp.2017.25
33. He X, Triantafyllopoulos A, Kathan A, Milling M, Yan T, Rajamani ST, et al. Depression diagnosis and forecast based on mobile phone sensor data. Accepted for Publication to IEEE EMBC [Preprint] (2022). Available at: https://doi.org/10.48550/arXiv.2205.07861
34. Saeb S, Zhang M, Karr CJ, Schueller SM, Corden ME, Kording KP, et al. Mobile phone sensor correlates of depressive symptom severity in daily-life behavior: an exploratory study. J Med Internet Res. (2015) 17:e4273. doi: 10.2196/jmir.4273
35. Pratap A, Atkins DC, Renn BN, Tanana MJ, Mooney SD, Anguera JA, et al. The accuracy of passive phone sensors in predicting daily mood. Depress Anxiety. (2019) 36:72–81. doi: 10.1002/da.22822
36. Sano A, Taylor S, McHill AW, Phillips AJ, Barger LK, Klerman E, et al. Identifying objective physiological markers and modifiable behaviors for self-reported stress and mental health status using wearable sensors and mobile phones: observational study. J Med Internet Res. (2018) 20:e9410. doi: 10.2196/jmir.9410
37. Gruenerbl A, Osmani V, Bahle G, Carrasco JC, Oehler S, Mayora O, et al. Using smart phone mobility traces for the diagnosis of depressive and manic episodes in bipolar patients. In Proceedings of the 5th Augmented Human International Conference (2014). p. 1–8. Available at: https://doi.org/10.1145/2582051.2582089
38. Rohani DA, Faurholt-Jepsen M, Kessing LV, Bardram JE. Correlations between objective behavioral features collected from mobile and wearable devices and depressive mood symptoms in patients with affective disorders: systematic review. JMIR Mhealth Uhealth. (2018) 6:e9691. doi: 10.2196/mhealth.9691
39. Jacobson NC, Chung YJ. Passive sensing of prediction of moment-to-moment depressed mood among undergraduates with clinical levels of depression sample using smartphones. Sensors. (2020) 20:3572. doi: 10.3390/s20123572
40. Shiffman S, Stone AA, Hufford MR. Ecological momentary assessment. Annu Rev Clin Psychol. (2008) 4:1–32. doi: 10.1146/annurev.clinpsy.3.022806.091415
41. Wright AG, Woods WC. Personalized models of psychopathology. Annu Rev Clin Psychol. (2020) 16:49–74. doi: 10.1146/annurev-clinpsy-102419-125032
42. Olthof M, Hasselman F, Strunk G, van Rooij M, Aas B, Helmich MA, et al. Critical fluctuations as an early-warning signal for sudden gains and losses in patients receiving psychotherapy for mood disorders. Clin Psychol Sci. (2020) 8:25–35. doi: 10.1177/2167702619865969
43. Fisher AJ, Reeves JW, Lawyer G, Medaglia JD, Rubel JA. Exploring the idiographic dynamics of mood and anxiety via network analysis. J Abnorm Psychol. (2017) 126:1044. doi: 10.1037/abn0000311
44. Fisher AJ, Medaglia JD, Jeronimus BF. Lack of group-to-individual generalizability is a threat to human subjects research. Proc Natl Acad Sci. (2018) 115:E6106–15. doi: 10.1073/pnas.1711978115
45. Müller SR, Chen XL, Peters H, Chaintreau A, Matz SC. Depression predictions from GPS-based mobility do not generalize well to large demographically heterogeneous samples. Sci Rep. (2021) 11:1–10. doi: 10.1038/s41598-021-93087-x
46. Taylor S, Jaques N, Nosakhare E, Sano A, Picard R. Personalized multitask learning for predicting tomorrow’s mood, stress, and health. IEEE Trans Affect Comput. (2017) 11:200–13. doi: 10.1109/TAFFC.2017.2784832
47. Kathan A, Triantafyllopoulos A, He X, Milling M, Yan T, Rajamani ST, et al. Journaling data for daily PHQ-2 depression prediction and forecasting. Accepted for Publication to IEEE EMBC [Preprint] (2022). Available at: https://doi.org/10.48550/arXiv.2205.03391
48. Rudovic O, Lee J, Dai M, Schuller B, Picard RW. Personalized machine learning for robot perception of affect and engagement in autism therapy. Sci Robot. (2018) 3:eaao6760. doi: 10.1126/scirobotics.aao6760
49. Busso C, Mariooryad S, Metallinou A, Narayanan S. Iterative feature normalization scheme for automatic emotion detection from speech. IEEE Trans Affect Comput. (2013) 4:386–97. doi: 10.1109/T-AFFC.2013.26
50. Xu X, Chikersal P, Dutcher JM, Sefidgar YS, Seo W, Tumminia MJ, et al. Leveraging collaborative-filtering for personalized behavior modeling: a case study of depression detection among college students. Proc ACM Interact Mob Wearable Ubiquitous Technol. (2021) 5:1–27. doi: 10.1145/3448107
51. Li B, Sano A. Early versus late modality fusion of deep wearable sensor features for personalized prediction of tomorrow’s mood, health, and stress. In Proceedings of the Engineering in Medicine & Biology Society (EMBC). Montréal, Canada: IEEE (2020). p. 5896–5899. Available at: http://doi.org/10.1109/EMBC44109.2020.9175463
52. Triantafyllopoulos A, Liu S, Schuller BW. Deep speaker conditioning for speech emotion recognition. In 2021 IEEE International Conference on Multimedia and Expo (ICME). Shenzhen, China: IEEE (2021). p. 1–6. Available at: http://doi.org/10.1109/ICME51207.2021.9428217
53. Gianfrancesco MA, Tamang S, Yazdany J, Schmajuk G. Potential biases in machine learning algorithms using electronic health record data. JAMA Intern Med. (2018) 178:1544–7. doi: 10.1001/jamainternmed.2018.3763
54. Triantafyllopoulos A, Ottl S, Gebhard A, Rituerto-González E, Jaumann M, Hüttner S, et al. Fatigue prediction in outdoor running conditions using audio data. Accepted for Publication to IEEE EMBC [Preprint] (2022). Available at: http://doi.org/10.48550/arXiv.2205.04343
55. Wagner J, Triantafyllopoulos A, Wierstorf H, Schmitt M, Eyben F, Schuller BW. Dawn of the transformer era in speech emotion recognition: closing the valence gap [Preprint] (2022). Available at: http://doi.org/10.48550/arXiv.2203.07378
56. Triantafyllopoulos A, Zänkert S, Baird A, Konzok J, Kudielka BM, Schuller BW. Insights on modelling physiological, appraisal, and affective indicators of stress using audio features. Accepted for Publication to IEEE EMBC [Preprint] (2022). Available at: http://doi.org/10.48550/arXiv.2205.04328
57. Dwork C, Hardt M, Pitassi T, Reingold O, Zemel R. Fairness through awareness. In Proceedings of the 3rd Innovations in Theoretical Computer Science Conference (2012). p. 214–226. Available at: https://doi.org/10.48550/arXiv.1104.3913
58. Eldridge SM, Chan CL, Campbell MJ, Bond CM, Hopewell S, Thabane L, et al. Consort 2010 statement: extension to randomised pilot and feasibility trials. BMJ. (2016) 355:1–29. doi: 10.1136/bmj.i5239
59. Radloff LS. The CES-D scale: a self-report depression scale for research in the general population. Appl Psychol Meas. (1977) 1:385–401. doi: 10.1177/014662167700100306
60. First MB, Williams JB, Karg RS, Spitzer RL. User’s guide for the SCID-5-CV structured clinical interview for DSM-5®disorders: clinical version. Washington, DC: American Psychiatric Publishing, Inc. (2016).
61. Osório FL, Loureiro SR, Hallak JEC, Machado-de Sousa JP, Ushirohira JM, Baes CV, et al. Clinical validity, intrarater, test–retest reliability of the structured clinical interview for dsm-5–clinician version (scid-5-cv). Psychiatry Clin Neurosci. (2019) 73:754–60. doi: 10.1111/pcn.12931
62. Buntrock C, Ebert DD, Lehr D, Smit F, Riper H, Berking M, et al. Effect of a web-based guided self-help intervention for prevention of major depression in adults with subthreshold depression: a randomized clinical trial. JAMA. (2016) 315:1854–63. doi: 10.1001/jama.2016.4326
63. Ebert DD, Buntrock C, Lehr D, Smit F, Riper H, Baumeister H, et al. Effectiveness of web-and mobile-based treatment of subthreshold depression with adherence-focused guidance: a single-blind randomized controlled trial. Behav Ther. (2018) 49:71–83. doi: 10.1016/j.beth.2017.05.004
64. Reins JA, Boß L, Lehr D, Berking M, Ebert DD. The more I got, the less I need? Efficacy of internet-based guided self-help compared to online psychoeducation for major depressive disorder. J Affect Disord. (2019) 246:695–705. doi: 10.1016/j.jad.2018.12.065
65. Montag C, Baumeister H, Kannen C, Sariyska R, Meßner E-M, Brand M. Concept, possibilities and pilot-testing of a new smartphone application for the social and life sciences to study human behavior including validation data from personality psychology. J. (2019) 2:102–15. doi: 10.3390/j2020008
66. Fuhr K, Hautzinger M, Krisch K, Berking M, Ebert DD. Validation of the behavioral activation for depression scale (bads)–psychometric properties of the long and short form. Compr Psychiatry. (2016) 66:209–18. doi: 10.1016/j.comppsych.2016.02.004
67. Spitzer RL, Kroenke K, Williams JB, Löwe B. A brief measure for assessing generalized anxiety disorder: the GAD-7. Arch Intern Med. (2006) 166:1092–7. doi: 10.1001/archinte.166.10.1092
68. Richardson J, Iezzi A, Khan MA, Maxwell A. Validity and reliability of the assessment of quality of life (AQoL)-8D multi-attribute utility instrument. Patient. (2014) 7:85–96. doi: 10.1007/s40271-013-0036-x
69. LiKamWa R, Liu Y, Lane ND, Zhong L. Moodscope: building a mood sensor from smartphone usage patterns. In Proceeding of the 11th Annual International Conference on Mobile Systems, Applications, and Services (2013). p. 389–402. Available at: http://doi.org/10.1145/2462456.2464449
70. Asselbergs J, Ruwaard J, Ejdys M, Schrader N, Sijbrandij M, Riper H, et al. Mobile phone-based unobtrusive ecological momentary assessment of day-to-day mood: an explorative study. J Med Internet Res. (2016) 18:e5505. doi: 10.2196/jmir.5505
71. Scott SB, Sliwinski MJ, Zawadzki M, Stawski RS, Kim J, Marcusson-Clavertz D, et al. A coordinated analysis of variance in affect in daily life. Assessment. (2020) 27:1683–98. doi: 10.1177/1073191118799460
72. Zimmermann J, Woods WC, Ritter S, Happel M, Masuhr O, Jaeger U, et al. Integrating structure and dynamics in personality assessment: first steps toward the development and validation of a personality dynamics diary. Psychol Assess. (2019) 31:516. doi: 10.1037/pas0000625
73. Buysse DJ, Reynolds III CF, Monk TH, Berman SR, Kupfer DJ. The pittsburgh sleep quality index: a new instrument for psychiatric practice and research. Psychiatry Res. (1989) 28:193–213. doi: 10.1016/0165-1781(89)90047-4
74. Kroenke K, Spitzer RL, Williams JB. The patient health questionnaire-2: validity of a two-item depression screener. Med Care. (2003) 41(11):1284–92. doi: 10.1097/01.MLR.0000093487.78664.3C
75. Löwe B, Kroenke K, Herzog W, Gräfe K. Measuring depression outcome with a brief self-report instrument: sensitivity to change of the patient health questionnaire (PHQ-9). J Affect Disord. (2004) 81:61–6. doi: 10.1016/S0165-0327(03)00198-8
76. Lee E-H. Review of the psychometric evidence of the perceived stress scale. Asian Nurs Res. (2012) 6:121–7. doi: 10.1016/j.anr.2012.08.004
77. Khan K, Rehman SU, Aziz K, Fong S, Sarasvady S. DBSCAN: past, present and future. In Proceedings of the 5th International Conference on the Applications of Digital Information and Web Technologies (ICADIWT) (2014). IEEE. p. 232–238. Available at: https://doi.org/10.1109/ICADIWT.2014.6814687
78. Likas A, Vlassis N, Verbeek JJ. The global k-means clustering algorithm. Pattern Recognit. (2003) 36:451–61. doi: 10.1016/S0031-3203(02)00060-2
79. Cho K, Van Merriënboer B, Gulcehre C, Bahdanau D, Bougares F, Schwenk H, et al. Learning phrase representations using RNN encoder-decoder for statistical machine translation [Preprint] (2014). Available at: https://doi.org/10.48550/arXiv.1406.1078
80. Corbett-Davies S, Goel S. The measure and mismeasure of fairness: a critical review of fair machine learning [Preprint] (2018). Available at: https://doi.org/10.48550/arXiv.1808.00023.
81. Fitzsimons J, Ali A, Osborne M, Roberts S. Equality constrained decision trees: for the algorithmic enforcement of group fairness [Preprint] (2018). Available at: https://doi.org/10.48550/arXiv:1810.05041
82. D’Amour A.et al Underspecification presents challenges for credibility in modern machine learning [Preprint] (2020). Available at: https://doi.org/10.48550/arXiv.2011.03395
83. Fried E. Moving forward: how depression heterogeneity hinders progress in treatment and research. Expert Rev Neurother. (2017) 17:423–5. doi: 10.1080/14737175.2017.1307737
84. Goldberg D. The heterogeneity of “major depression”. World Psychiatry. (2011) 10:226. doi: 10.1002/j.2051-5545.2011.tb00061.x
85. Shalom JG, Aderka IM. A meta-analysis of sudden gains in psychotherapy: outcome and moderators. Clin Psychol Rev. (2020) 76:101827. doi: 10.1016/j.cpr.2020.101827
86. O’Mahen HA, Hayes A, Harries C, Ladwa A, Mostazir M, Ekers D, et al. A comparison of the effects of sudden gains and depression spikes on short-and long-term depressive symptoms in a randomized controlled trial of behavioral activation and cognitive behavioural therapy. J Consult Clin Psychol. (2021) 89:957. doi: 10.1037/ccp0000577
87. Cohen JS, Edmunds JM, Brodman DM, Benjamin CL, Kendall PC. Using self-monitoring: implementation of collaborative empiricism in cognitive-behavioral therapy. Cogn Behav Pract. (2013) 20:419–28. doi: 10.1016/j.cbpra.2012.06.002
Keywords: depression, forecasting, personalised models, machine learning, mHealth, mental illness
Citation: Kathan A, Harrer M, Küster L, Triantafyllopoulos A, He X, Milling M, Gerczuk M, Yan T, Rajamani ST, Heber E, Grossmann I, Ebert DD and Schuller BW (2022) Personalised depression forecasting using mobile sensor data and ecological momentary assessment. Front. Digit. Health 4:964582. doi: 10.3389/fdgth.2022.964582
Received: 8 June 2022; Accepted: 24 October 2022;
Published: 18 November 2022.
Edited by:
Ieuan Clay, Digital Medicine Society (DiMe), GermanyReviewed by:
Stefan Lüttke, University of Greifswald, Germany,Paraskevi Papadopoulou, American College of Greece, Greece
© 2022 Kathan, Harrer, Küster, Triantafyllopoulos, He, Milling, Gerczuk, Yan, Rajamani, Heber, Grossmann, Ebert and Schuller. This is an open-access article distributed under the terms of the Creative Commons Attribution License (CC BY). The use, distribution or reproduction in other forums is permitted, provided the original author(s) and the copyright owner(s) are credited and that the original publication in this journal is cited, in accordance with accepted academic practice. No use, distribution or reproduction is permitted which does not comply with these terms.
*Correspondence: Alexander Kathan YWxleGFuZGVyLmthdGhhbkB1bmktYS5kZQ==
†These authors have contributed equally to this work and share first authorship.
Specialty Section: This article was submitted to Personalized Medicine, a section of the journal Frontiers in Digital Health