Abstract
Metaphors are commonly used in interface design within Human-Computer Interaction (HCI). Interface metaphors provide users with a way to interact with the computer that resembles a known activity, giving instantaneous knowledge or intuition about how the interaction works. A widely used one in Digital Musical Instruments (DMIs) is the conductor-orchestra metaphor, where the orchestra is considered as an instrument controlled by the movements of the conductor. We propose a DMI based on the conductor metaphor that allows to control tempo and dynamics and adapts its mapping specifically for each user by observing spontaneous conducting movements (i.e., movements performed on top of fixed music without any instructions). We refer to this as mapping by observation given that, even though the system is trained specifically for each user, this training is not done explicitly and consciously by the user. More specifically, the system adapts its mapping based on the tendency of the user to anticipate or fall behind the beat and observing the Motion Capture descriptors that best correlate to loudness during spontaneous conducting. We evaluate the proposed system in an experiment with twenty four (24) participants where we compare it with a baseline that does not perform this user-specific adaptation. The comparison is done in a context where the user does not receive instructions and, instead, is allowed to discover by playing. We evaluate objective and subjective measures from tasks where participants have to make the orchestra play at different loudness levels or in synchrony with a metronome. Results of the experiment prove that the usability of the system that automatically learns its mapping from spontaneous movements is better both in terms of providing a more intuitive control over loudness and a more precise control over beat timing. Interestingly, the results also show a strong correlation between measures taken from the data used for training and the improvement introduced by the adapting system. This indicates that it is possible to estimate in advance how useful the observation of spontaneous movements is to build user-specific adaptations. This opens interesting directions for creating more intuitive and expressive DMIs, particularly in public installations.
1. Introduction
Computational Audio deals with the intersection between Computer Science and Audio Analysis, Processing and Synthesis. It is, in this sense, a field that involves two possible directions of study: extracting information and knowledge from audio, or turning available information and knowledge to acoustic information for a variety of applications. In an interaction context, this information can be the actions or movements that a user or instrumentalist makes when using a Digital Musical Instrument (DMI). Musical Human-Computer Interaction (HCI) focuses on developing techniques to make this transfer from actions or movements to acoustic information in a way that allows a more intuitive and expressive control of the resulting music.
Metaphors are commonly used in interface design within HCI. Probably the most ubiquitous example is the desktop metaphor (Blackwell, 2006), where elements in the Graphical User Interface (GUI) are depicted and arranged replicating an office desktop. The rationale behind using interface metaphors is to provide the user a way to interact with the computer that resembles a known activity, giving instantaneous knowledge or intuition about how the interaction works. The field of New Interfaces for Musical Expression (NIME) has developed around the International Conference on NIME1, which started out as a workshop at the Conference on Human Factors in Computing Systems2 in 2001. NIME works inherit many of the practices and methods of HCI, including the common use of metaphors for the design of DMIs. Fels et al. (2002) argue that the application of a metaphor to a musical interface has the effect of increasing its transparency, understood as the physiological distance, from the perspective of the player and the potential audience, between the input and output of a DMI mapping.
Note that these metaphors are not limited to the design of GUI elements to interact with through traditional computer input devices, such as mouse and keyboard. HCI, and particularly NIME, deal with interaction through different modalities such as touch, movement, etc. A good way to understand how a metaphor may work in the case of a DMI is through a toy example. We can imagine a DMI consisting on a control interface with two sliders controlling an oscillator: the position of the first controls the frequency of the oscillator, and the velocity at which the other is moved controls the amplitude. It would be easy to learn this functioning through experimentation, but we could expect a user to have an immediate intuition of it if we indicated her that the instrument is controlled as a violin: the first slider corresponding to the position of the left hand on the fingerboard, the second one replicating the action of the bow. Even more, we could place these sliders in a violin-shaped object and expect the user to have an intuition of the functioning without providing any indications. Mimicking real-world instruments as the violin following this kind of rationale is common (Poepel and Overholt, 2006; Carrillo and Bonada, 2010). Another widely used metaphor is the conductor-orchestra one, where the instrument is designed to work as an orchestra that follows the movements of the conductor.
The commonly considered first computer music system using this metaphor is the Conductor Program by Mathews (1976). Mathews developed different input sensors for the Conductor Program, including the Daton (Mathews and Barr, 1988) and the most popular Radio Baton (Boie et al., 1989; Mathews, 1991), which incorporates low-frequency radio transmitters whose 3D position over a plate is measured by an array of receiving antennas. With two Radio Batons, one of them (usually the one held in the right hand) is used to trigger beats when its distance to the plate is smaller than a certain threshold; the position of the other one can continuously control other parameters such as the overall loudness or the dynamic balance between different instruments. In this pioneer system we observe some characteristics shared by interfaces using this metaphor: (1) they are controlled using gestures that resemble those of a real conductor, (2) the control consists on the modification of an existing musical piece—usually by controlling its tempo and dynamics—and (3) the interaction occurs in real time, with the user being able to listen to the effects of her gestures on the musical outcome.
Systems that followed the Conductor Program implement refinements or modifications in different aspects. On many occasions, a big effort is devoted to the development of new input devices (Haflich and Burnds, 1983; Keane and Gross, 1989; Morita et al., 1989; Marrin and Paradiso, 1997; Marrin and Picard, 1998) or the adaptation of existing ones to this use (Brecht and Garnett, 1995; Garnett et al., 2001). The complexity of mapping strategy often varies depending on the context of each application. This term is used to define how the input (the movements or actions performed by the user) and output (the control parameters for the resulting sound) are connected (Paradiso, 1997; Rovan et al., 1997).
For beat control, as in Mathews' case, the most commonly found strategy is to use information directly derived from the position of the hand or a hand-held device to trigger beats or control tempo (Haflich and Burnds, 1983; Keane and Gross, 1989; Morita et al., 1989; Borchers et al., 2002; Lee et al., 2004; Bergen, 2012; Rosa-Pujazon and Barbancho, 2013; Toh et al., 2013). In all of these works, as in Mathews', the “beat induction” instant in the gesture (the ictus) is assumed to correspond to the change from downward to upward motion [except in the case of Lee et al. (2004), where there is no beat but just tempo control, and Rosa-Pujazon and Barbancho (2013), who use horizontal hand movements].
Temporal modeling strategies have also been exploited to provide control over tempo, for example using Hidden Markow Models (HMMs) (Usa and Mochida, 1998; Kolesnik, 2004) or neural networks (Brecht and Garnett, 1995; Ilmonen, 1999). Regarding the control of dynamics, the volume is sometimes controlled with specific gestures such as raising and lowering one hand (Rosa-Pujazon and Barbancho, 2013; Toh et al., 2013), but it has been more common to map parameters derived from the execution of the gesture (e.g., its size) to the resulting loudness (Morita et al., 1989; Usa and Mochida, 1998; Lee et al., 2004; Toh et al., 2013). Fabiani (2011) explored mapping semantic qualities extracted from movement to semantic qualities of the music, such as the mood.
An important aspect in systems where tempo is controlled by triggering beats is to provide accurate control on the exact time when the orchestra plays following the gesture. As previously explained, most works consider that the ictus corresponds to the change from downward to upward motion, so beats are triggered when this change is detected.
However, Lee et al. (2005) identified some usability breakdowns when qualitatively analyzing how people performed with their systems in public spaces (Borchers et al., 2002; Lee et al., 2004), and decided to analyze with more detail the temporal relationship between users' conducting gestures and the beat on a musical piece. In order to do that, they asked professional conductors and non-conductors to “conduct” a fixed musical clip from the Radetzky March using up-down movements making them aware that their movements were not affecting the resulting sound. They found that conductors tended to anticipate the music beat by an average of 150 ms, while non-conductors anticipated by just 50 ms, also showing larger variance in the placement of the gesture beat with respect to the music beat. The hypothesis of Lee et al., following the conclusions from their study, was that incorporating this knowledge to conducting systems could improve their usability.
In the case of Lee et al. (2005), the comparison between different expertise profiles was done using a fixed gesture (up-down hand movements). We believe, however, that in the case of public installations, it is potentially more engaging to allow users to freely perform with spontaneous movements. With this in mind, we performed a study (Sarasúa and Guaus, 2014a,b) where we analyzed the movements of different participants when asked to “conduct” on top of a musical excerpt. In our case, the difference was that we did not ask to perform any specific gesture like up-down movement, nor did we ask them to focus on any specific aspect of the performance like the beat. We just asked participants to perform the movements they would do to make the orchestra sound as in the recording and then we analyzed how they synchronized to the beat and how their movements were related to the loudness of the piece. We observed different tendencies among participants. For example, some of them tended to move more energetically in loud parts (as suggested by a strong correlation between loudness and quantity of motion computed from the velocity of all body joints), while others tended to raise their hands higher (as suggested by a strong correlation between loudness and the vertical position of the hands). Regarding the timing, we did not observe general tendencies for different musical expertise, but we observed that the beats that we extracted from the participants' hand movement tended to be lagged with respect to the annotated beats differently, and consistently, for each participant.
Similarly to the case of Lee et al. (2005), we hypothesize that an interactive conducting system that adapts its parameters to the observations from spontaneous conducting movements can see its usability improved and also become more intuitive. However, following the conclusions from the aforementioned study, these adaptations must be user-specific (and not just based on different expertise profiles). This is something that cannot be assumed and needs to be thoroughly tested, provided that it is different to follow fixed music than actually conducting it. In the context of this work, we consider that a system has better usability if the user has better ability to take precise control over it. For the particular case of interest of our work, where we want to allow users to use spontaneous movements (as opposed to giving them instructions on how to perform), we refer to a system as more intuitive if, in a similar context where no instructions are given, it provides more precise control to the user (i.e., the user is better able to learn how to perform).
In this context, we propose a system that explicitly exploits the knowledge that users have from the activity that inspires the interface (in our case, music conducting). The approach we propose can be defined as mapping by observation. Françoise (2015) has proposed a framework for building motion-sound mappings called Mapping by Demonstration that follows the design principle of Mapping through Listening (Caramiaux et al., 2014a). This framework considers listening as the starting point for the design of the mapping, which is learned from a set of demonstrations where the user explicitly shows the relationship between motion and sound as an acted interaction. In our case, taking advantage of the fact that the instrument is based on a metaphor, we propose to learn the mapping by observing each user making spontaneous conducting movements such as those in the aforementioned study. We argue that in the context of public installations, it is preferable to perform learning in this transparent way, observing spontaneous movements from the user, rather than allowing each user to explicitly define her own mapping in a learning stage.
More concretely, we present a DMI based on the conductor metaphor that allows to control tempo and dynamics and learns personalized parameters from user-specific observation of spontaneous conducting movements. We evaluate the usability and intuitiveness of the system in a setup where the user does not receive instructions on how the system works and instead just learns by experimenting. For comparison, we also build another system based on the most commonly found strategies for controlling tempo and dynamics in the reviewed works as a baseline. The experiment includes a series of tasks to compare both systems using both subjective feedback and objective measures about the participants' ability to control loudness and the exact time of beats in the resulting music. In addition, we recruited both musicians and non-musicians to study possible differences caused by musical expertise.
2. Proposed System
In this section, we explain in detail the functioning of the proposed system. As it has been indicated, it has a predefined mapping which is tuned specifically for each user. Accordingly, we first explain the system without adaptation, to which we refer as BASELINE. Then, we continue with the proposed system, to which we refer as TRAINED, highlighting the aspects in which they differ.
In both cases, the user can control loudness and tempo on a musical piece using body movements captured by a Motion Capture (MoCap) device, in this case a Kinect v23. The Kinect is a motion sensing device developed by Microsoft for video games, which can track the position of several body joints.
2.1. Baseline
Inspired by previous approaches (Haflich and Burnds, 1983; Keane and Gross, 1989; Morita et al., 1989; Borchers et al., 2002; Lee et al., 2004; Bergen, 2012; Rosa-Pujazon and Barbancho, 2013; Toh et al., 2013), the system allows to control the tempo of the performance by triggering beats in changes from downward to upward hand movement. For this, we use the vertical velocity (vy) of both hands, computed with low-pass differentiators of degree one proposed by Skogstad et al. (2013), as implemented in MoDe4, a library for real-time feature extraction from MoCap data developed by the authors within the scope of this research. The ictus is detected whenever a change from negative to positive sign in vy occurs (change from downward to upward movement), as illustrated by the red circles in Figure 1. Notes falling between beats are played according to the tempo estimated from the time interval between the last two beats. Two extra rules are applied to avoid false positives in beat detection:
If the last local minimum before the current change of sign of vy is not below a threshold vth, the beat is not triggered. This avoids detecting beats from almost-still movement.
Two consecutive beats must be detected separated by at least a certain number of frames nth from each other. This is done to avoid detecting beats closer in time than musically meaningful, and is particularly necessary to avoid triggering two beats from simultaneous movements from both hands.
Figure 1
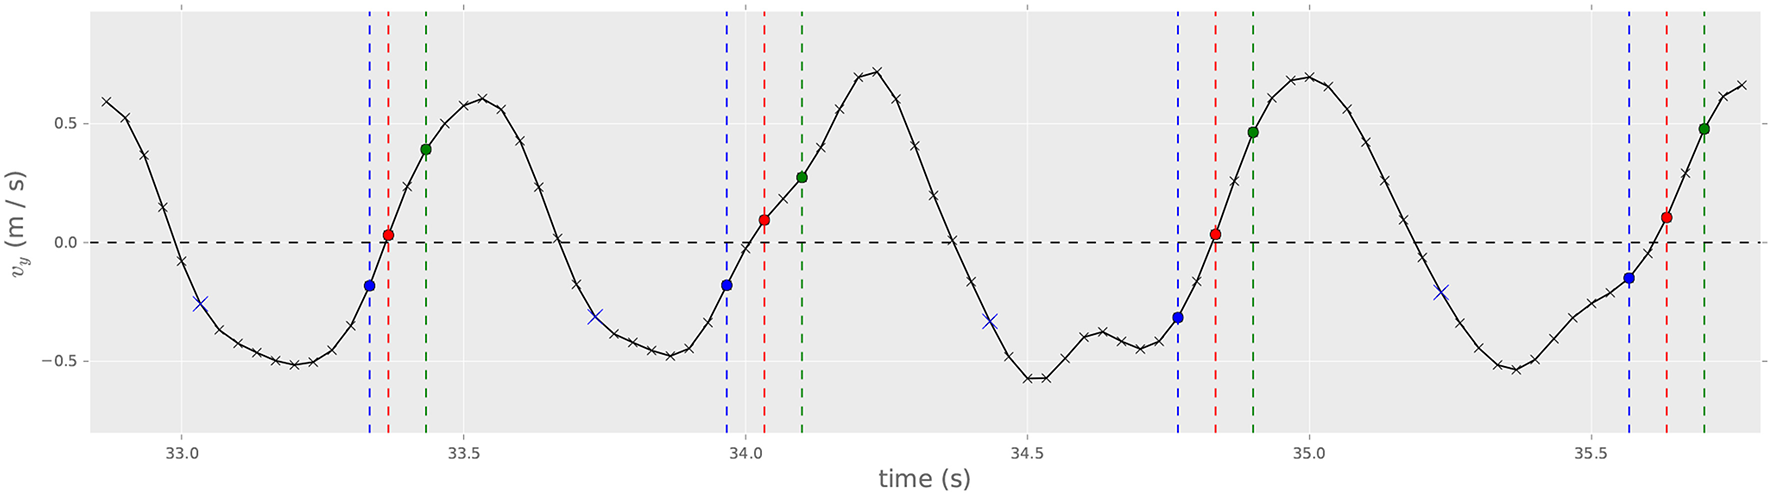
Beat triggering from vy with BASELINE (red circles) and TRAINED systems (green circles, nant = −2; blue circles, nant = 2). Samples highlighted as blue crosses set the vtrigger values for nant = 2 in the TRAINED system.
Loudness in the performance is controlled by means of the gesture size, similarly to Morita et al. (1989), Usa and Mochida (1998), Lee et al. (2004), and Toh et al. (2013). When a beat is detected at time tB using the method above, the gesture size is computed as the cumulative squared distance traveled by the hand where the beat has been detected since the detection of the previous beat, tPB5:
where i denotes the frames from times tPB to tB. The mapping from size to MIDI velocity values is set in preliminary user tests, in order to cover the whole MIDI velocity range. We used MIDI velocity values provided that, as we explain below, we are considering a MIDI sound engine. MIDI velocity values can range from 0 to 127. In the following, we refer to MIDI velocity units (mvu) for loudness values represented in this scale.
2.2. Trained
The proposed system adapts its mapping individually to each user by performing a previous analysis of spontaneous conducting movements. By “spontaneous” we refer to conducting movements that the user performs on top of a musical excerpt without having received any specific instructions. In this sense, the system needs the user to “conduct” on top of a musical piece for which there is available information on the loudness and location of beats, just as in the case of previous observation studies (Lee et al., 2005; Sarasúa and Guaus, 2014a,b) (in this case, since the music is rendered from a symbolic musical score, the location of the beats and the loudness are known). More concretely, this system takes into consideration how the user tends to anticipate or fall behind the beat, and which body movement descriptors are best correlated with loudness. We focus on this descriptor since it is the one to be controlled afterwards. For this, we need to store the time position of beats in the music and beats detected from hand movement (using the same method we detailed for the BASELINE system), as well as the value of different body movement descriptors together with the corresponding loudness values at different instants.
The mean difference in seconds between beats in the music and beats detected in hand movement, lag, provides an estimation of the tendency of the user to anticipate or fall behind the beat. Negative values indicate that beats detected in hand movement tend to appear before the beat in the music, while positive values indicate that beats detected in hand movement tend to appear after the music beat. From lag, we compute nant as the number of frames at the device sampling rate, fs (in the case of the Kinect V2, 30 fps), that corresponds to the time closest to lag:
Tempo in the TRAINED system is controlled exactly the same way as in the BASELINE system, but including this additional parameter nant. If nant = 0, there is no difference with respect to the BASELINE. If nant < 0, the beat is triggered −nant frames after the change of sign in vy. Figure 1 illustrates the method for for nant = −2 (green circles). If nant >0, beats are no longer detected looking at changes of sign in vy. Instead, beats are triggered when two consecutive values of vy are, respectively, smaller and greater than a new threshold vtrigger ≠ 0. The value for vtrigger is computed after every change of vy from positive to negative sign (upward to downward movement). It takes the value of vy, nant frames after this change of sign. This is summarized in Algorithm 1 and depicted in Figure 1. In this figure, blue circles illustrate the samples where the beat would be triggered in the case of nant = 2, while blue crosses show the samples that determine the different values of vtrigger.
Algorithm 1
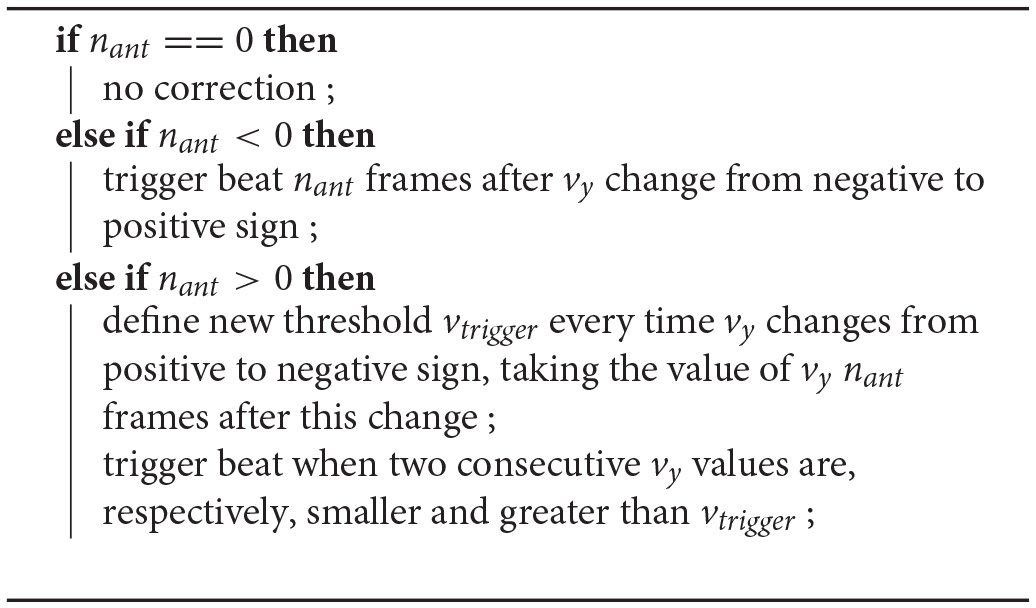
Correction of beat triggering for the TRAINED system.
Loudness is controlled through a linear combination of three different MoCap descriptors:
Gesture size, using the same method as for BASELINE and defined in Equation (1).
Quantity of Motion QoM, computed by averaging the mean speed values of all tracked joints during N frames as
, , are the x, y, and z components of the velocity of joint j, i frames before n, and J is the number of tracked joints. We use N = 30 (1 s at 30 fps).
Highest hand position Ymax, a simple descriptor that in every frame looks at the vertical position y of both hands and takes the maximum value.
The descriptors and loudness values recorded during the execution of spontaneous movements are later used to compute the weights assigned to each descriptor (ωS for size, ωQ for QoM, ωY for Ymax and β for the intercept) using least squares linear regression.
3. Materials and Methods
3.1. Materials
We built a dedicated Windows application with OpenFrameworks6 to be used with a Kinect v2. It uses ofxKinectForWindows27 (an OpenFrameworks wrapper for Kinect for Windows SDK) to track skeleton data and MoDe for real-time feature extraction and event triggering.
The application allows to control the experiment procedure using a set of keyboard commands and records all necessary data (training results, tasks results and MoCap data) into text files. It implements the conducting systems introduced in section 2, BASELINE and TRAINED, to conduct a musical piece using movements captured by the Kinect v2. For synthesis, it reads a music score in MusicXML or MIDI format and outputs MIDI events which can be rendered by any external software. For the experiment, we used Native Instrument's Kontakt with Session Strings library and a simplified 8-bar long score for strings from the Ode to Joy theme from the fourth movement in Beethoven's 9th Symphony, shown in Figure 2. We chose this excerpt for two reasons: first, it is a very popular melody that all participants in the study knew in advance (as they later confirmed); second, the selected melody mostly contains quarter notes. This makes the beat and rhythm of the melody equivalent and avoids possible confusions with participants tending to conduct to the onsets of the predominant melody instead of the beat (this effect was observed by Lee et al., 2005). We used symbolic score material for the synthesis since it simplifies the control of the performance in terms of event triggering and loudness manipulation, as compared to the case of using a real pre-recorded performance to manipulate. The application also provides visual feedback consisting on the mirrored image captured by the Kinect v2 and specific visualizations for each of the phases in the experiment. The content and design of these visualizations is explained with more detail below.
Figure 2

Excerpt from Beethoven's 9th symphony used in the experiment.
The experiment took place at an audiovisuals room in Universitat Pompeu Fabra, Barcelona. During the experiment, participants used over-ear headphones to avoid distraction from other sound sources and stood approximately two meters away from a 46-inch TV screen showing the visual feedback from the application. The Kinect v2 sensor was placed below the screen, using a flat speaker stand, approximately 1.4 m from the floor. The experimenter read instructions to the participants and controlled the application from a laptop to which the screen, Kinect v2 sensor and headphones were connected. Another laptop was placed close to the participants for them to provide some demographic information and feedback after each task on a Google Form.
3.2. Hypothesis and Experiment Design
As previously indicated, we hypothesize that observed user-specific tendencies in spontaneous conducting movements can be used to build user-specific mappings in a DMI based on the conductor metaphor, improving its usability. Provided that we deal with the concrete case of loudness and beat control, this main hypothesis can be separated in two:
H1: Computational analysis of spontaneous conducting movements can be used to design user-specific mappings between motion and loudness in a DMI based on the conductor metaphor, the resulting system having better usability and being more intuitive than one where the mapping is fixed.
H2: Computational analysis of spontaneous conducting movements can be used to build a DMI based on the conductor metaphor where tempo control considers user-specific tendencies to anticipate or fall behind the beat, the resulting system providing more precise control over beat than a system not considering these tendencies.
To test these hypotheses, we designed an experiment to compare the TRAINED and BASELINE conducting systems. The concrete procedure of the experiment is explained with detail below, but we first enumerate the factors we controlled.
In the experiment, participants use both systems to perform a series of tasks in which we retrieve objective measures of the performance, as well as subjective feedback provided by participants. The most relevant factor we investigate in the experiment is thus the System (TRAINED / BASELINE) being used for each of the tasks. All participants use both systems, so the order in which they use them is counterbalanced to compensate the possible effect of learning. Because of this, we also consider the System Index (first / second) factor.
We retrieve objective measures and subjective feedback related to the control over loudness and beat separately. In addition, we minimize confounding by creating tasks that challenge participants to only control loudness, beat, and both at the same time. More specifically, participants are presented with the following tasks:
- Loudness tasks
. The participant is asked to make the orchestra play following a pattern of loudness variation (e.g., “first play
loud, then
soft, then
loud…”).
- Objective measure: Loudness error, εL. At each beat, we define εL as the difference between the target and achieved loudness levels, both represented in MIDI velocity units (mvu).
- Subjective feedback: Loudness control rating, rL. At the end of the task, the participant rates her ability to control loudness in a 5-point scale ranging from “Could not control loudness at all” to “Could perfectly control loudness.” For the analysis, values in the scale were coded from 1 (“could not control”) to 5 (“could perfectly control”).
- Metronome tasks
. The participant listens to a metronome at a fixed tempo and has to make the orchestra play in synchrony with it.
- Objective measure: Beat error, εB. Every time a beat is triggered, εB corresponds to the difference in seconds with respect to the closest metronome beat.
- Subjective feedback: Beat control rating, rB. At the end of the task, the participant rates her ability to control the exact moment in which the instruments sound in a 5-point scale ranging from “Instruments played much sooner than I intended” to “Instruments played much later than I intended,” with the middle value corresponding with “Instruments played exactly when I intended.” For the analysis, values in the scale were coded from 1 (“much sooner”) to 5 (“much later”).
Combined tasks. A combination of the previous tasks (i.e., the participant listens to a metronome and has to make the orchestra play in synchrony with it while following a loudness variation pattern).
In order to test our hypotheses, we investigate the following effects:
For H1, we expect significantly lower values of |εL| and significantly higher values of rL for the TRAINED system with respect to the BASELINE system.
For H2, we expect significantly lower values of |εB| and values of rB (beat control rating) significantly closer to 3 (which corresponds to “Instruments played exactly when I wanted”) for the TRAINED system with respect to the BASELINE system. In this case, however, we only expect to observe this effect when the number of frames for anticipation nant estimated for the user is different from 0. Recall that the BASELINE and TRAINED systems are equivalent for beat control when nant = 0. We explore this with an additional factor Anticipation that codes, for each participant, whether nant = 0 or nant ≠ 0.
Tasks with a different Target are presented. In the case of loudness tasks, the Target corresponds to different loudness levels, coded by the corresponding MIDI velocity. In the case of metronome tasks, the Target corresponds to different tempi. We also investigate the influence of the Task Type (simple or combined). Finally, we investigate whether the musical Expertise of participants influences the results.
3.3. Participants
Participants were recruited via convenience sampling through department members and their students in Universitat Pompeu Fabra, Barcelona (Spain). Given the nature of the experiment, a prospective ethics approval was not necessary according to the Universitat Pompeu Fabra's8 guidelines and Spanish national regulations. Participants signed an informed consent granting the authors to exploit the data recorded during the experiment (including MoCap and video) for analysis and publication, following the procedures for privacy and personal data protection established in the PHENICX FP7 framework project (grant agreement no. 601166) funded by the European Commission.
3.4. Procedure
After signing the consent form, participants were informed about the general setup for the experiment.
Once the participant agrees to start, she fills a form with information about her age and musical expertise. Then, a procedure consisting on three phases is repeated twice, once for each System (BASELINE and TRAINED), counterbalancing the order across participants. These phases are (1) Warm up: the parameters for the TRAINED system are adjusted and the participant familiarizes with the set up; (2) Adaptation: the participant is allowed to explore how the System works; (3) Tasks: the experimenter asks the participant to perform the tasks introduced above. The concrete procedure was the following:
- Warm up phase
. In this phase we learn the parameters for the
TRAINEDsystem. We only use the information from the first time this phase appears (regardless of the order in which the systems are presented to the participant). We do this because we are interested in learning from “spontaneous movements,” and these only occur at the beginning of the experiment. In this sense, the information from the second Warm up phase is not considered, but we still make it to provide the same set up for both systems. There are two steps:
The experimenter informs the participant that she will listen to the musical excerpt used throughout the experiment, preceded by four metronome counts. In this phase, the excerpt (8 bars, 32 beats) is played once at a fixed tempo (90 Beats Per Minute or BPM) and with loudness changing on every bar, following the pattern MID-LOUD-MID-LOUD-MID-SOFT-MID-SOFT. This pattern was chosen to facilitate the ability to remember it, and it does not based on any actual loudness progression from the piece. The MIDI velocities corresponding to each of the loudness levels, based on preliminary tests, was set to 60 mvu for “MID,” 127 mvu for “LOUD” and 30 mvu for “SOFT.” The visualization of the pattern consists on a set of red parallel lines separated proportionally to the loudness. The space between the lines is filled with red color as the music advances. This visualization, for which a snapshot is shown in Figure 3, is designed to be self-explanatory and to allow participants to memorize and anticipate loudness changes. The excerpt is played as many times as necessary until the participant correctly understands the visualization.
The experimenter asks the participant to imagine she has to conduct this excerpt exactly as it sounded, and to perform those conducting movements while listening again to the same excerpt. The fact that no actual conducting is occurring during this phase and the excerpt plays exactly the same way it did before is remarked to avoid confusion. After allowing the participant to rehearse her movements as many times as needed to feel comfortable, the experimenter asks her to perform it again. Here, the application computes the necessary information to compute the parameters for the TRAINED system. More specifically, it stores the exact time at which beats occur in the played excerpt and, for each beat detected in the participant's movement, the exact time at which it is detected, the MIDI velocity at which the music plays, and the MoCap descriptors (size, QoM and Ymax) values at that time. This information is used to determine the parameters of the TRAINED system as explained in section 2.
Adaptation Phase. During this phase, the participant is allowed to experiment with the conducting system. The experimenter does not give any information about possible motion-sound mappings; he only indicates that the system should allow to control tempo and loudness using conducting gestures and that these are not necessarily related to what the participant did in the warm up phase (and, in the case of it being the second tested system, also not necessarily similar to the previous one). A maximum of three trials (each of them consisting of two repetitions of the excerpt) is given to the participant to optimize her control of the performance. Note that the participant is not given the possibility to re-train the model, since the intention is to test the training as a transparent step based on observing spontaneous movements, as opposed to allowing the user to consciously train the model.
- Tasks Phase
. Here, the participant performs the tasks introduced above. For all tasks, the participant must conduct the excerpt twice in a row (16 bars, 64 beats). The order in which the loudness and metronome tasks are presented is counterbalanced across participants; the combined tasks always come last. After every task, the participant rates the perceived sense of control over loudness and/or beat. The specifics of the presented tasks are the following:
- There is one single Loudness task where the participant must make the orchestra play with the same loudness variations from the Warm up phase (represented in Figure 3) at any tempo. The application shows an equivalent visualization during the task. The red parallel lines now illustrate the target loudness on every bar, and the color fill between the red parallel lines is green and corresponds to the loudness at which the participant is actually making the orchestra sound. Note that in a single loudness task there are three different T
arget
levels (LOUD, MID, and SOFT). For every loudness task, we have 64 values of εL and one rL rating.- There are two Metronome tasks at 80 and 100 BPM. In this case, the only visualization is a red progress bar. For each task, we have 64 values of εB and one rB rating.
- There are also two Combined tasks, at 80 and 100 BPM, and with the same pattern of loudness variations and visualization from Loudness tasks. For each task, we have 64 values of εL, 64 values of εB, one rL rating and one rB rating.
Figure 3
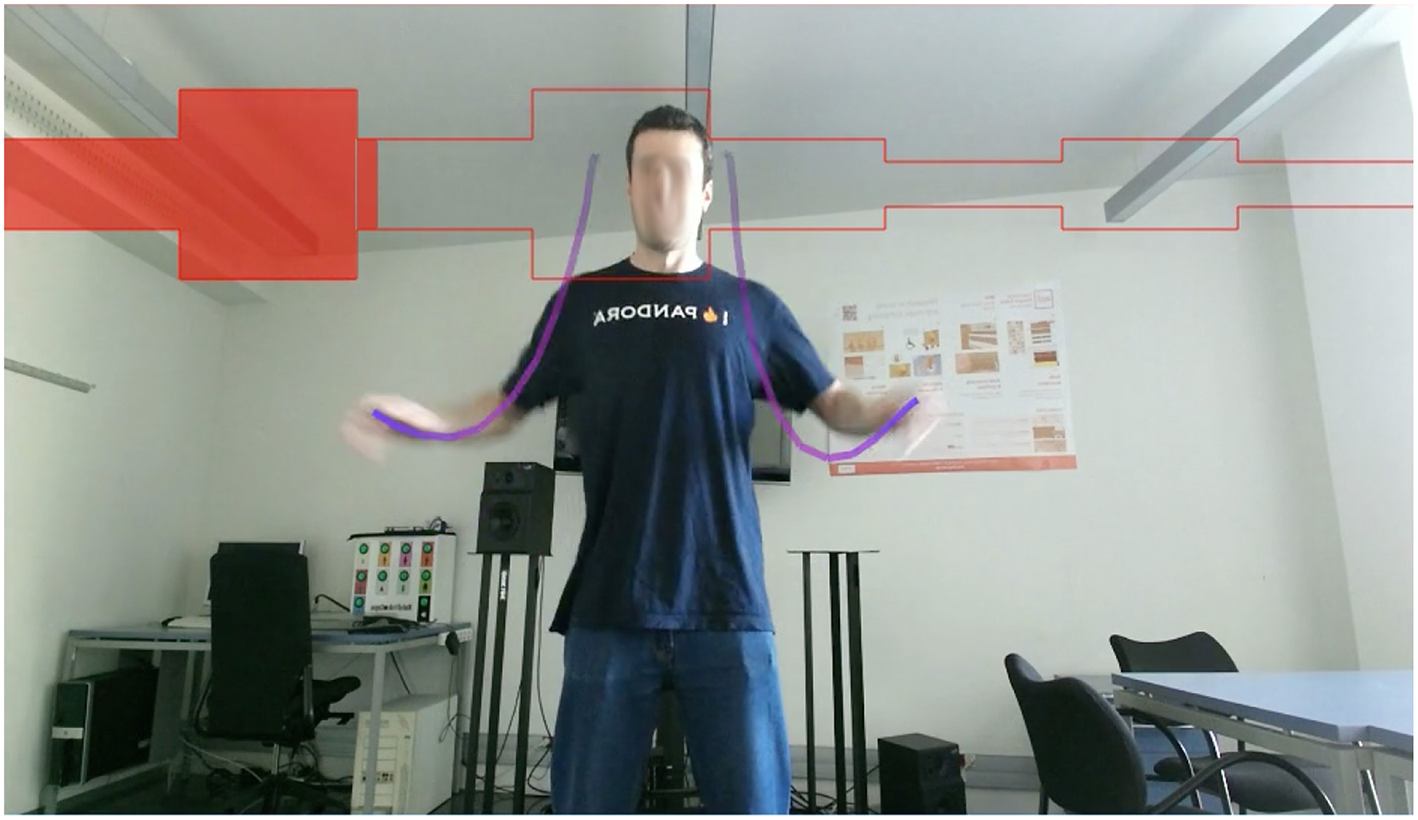
Visualization shown during warm up phase. All participants gave written informed consent for the publication of all the recorded material during the experiment, including images.
After completing these three phases with both systems, the participant is allowed to freely perform with each system. In this stage, no visualization is presented to the user, who can just focus on freely performing without any given task. Then, she provides feedback about her preferred one (“first” or “second,” as the participant does not know about the difference between both) by answering three questions: “Did you feel any difference between both systems?”, “Which one did you prefer in terms of loudness control?” and “Which one did you prefer in terms of your ability to make instruments sound exactly when intended?”
4. Results
Twenty four people (18 male and 6 female) participated in the experiment. Their average age was 28 years (σ = 5.84), with ages ranging from 19 to 41. Half of them were musicians (considering musicians participants with any musical training) and the other half were non-musicians. No conductors were recruited for the experiment. The difference between both groups is thus expected to be related to different abilities to perform musical tasks, not on the ability to conduct an actual orchestra. The experiment was carried out during four different days, taking 35 min for each participant.
We first analyze the results from the first Warm up phase, where the parameters of the TRAINED system are learned. In this phase, participants performed spontaneous conducting movements on top of fixed music.
First, we focus on the results that determine the loudness control. Figure 4A shows, for each participant, the correlations found between each of the three MoCap descriptors (size, QoM, and Ymax) and loudness (MIDI velocity). In most cases, as expected, MoCap descriptors show a positive correlation with loudness. There are a few exceptions where negative correlations appear, with only two cases where the absolute value of these correlations are >0.5 (QoM for participants 4 and 15). In most cases (70%), QoM is the most correlated descriptor, with an average absolute correlation of 0.48, followed by Ymax (0.38) and size (0.29). Correlation is not the only factor influencing the computed linear models. Figure 4B shows, for each participant, the dynamic range of the three MoCap descriptors. For consistent visualization across descriptors, the dynamic range for a participant and descriptor is computed by dividing the difference between the maximum and minimum descriptor values for that participant by the difference between the maximum and minimum descriptor values across all participants. As an illustrative example, participants 11 and 21 show a similar positive correlation between QoM and loudness, but the former has a larger dynamic range. This positive correlation indicates that the mapping for loudness control with the TRAINED system would assign louder output for more energetic movements for both participants. The different dynamic ranges indicate that the difference in QoM of movements resulting in soft and loud output would be larger for participant 11 than for participant 21. From the computed linear regression models, we compute the adjusted coefficient of determination as indicative of how much loudness variability is explained by the MoCap descriptors. Computed values for each participant are depicted in Figure 4C. We use these values below to check whether results during the tasks are affected by the quality of the learned models.
Figure 4
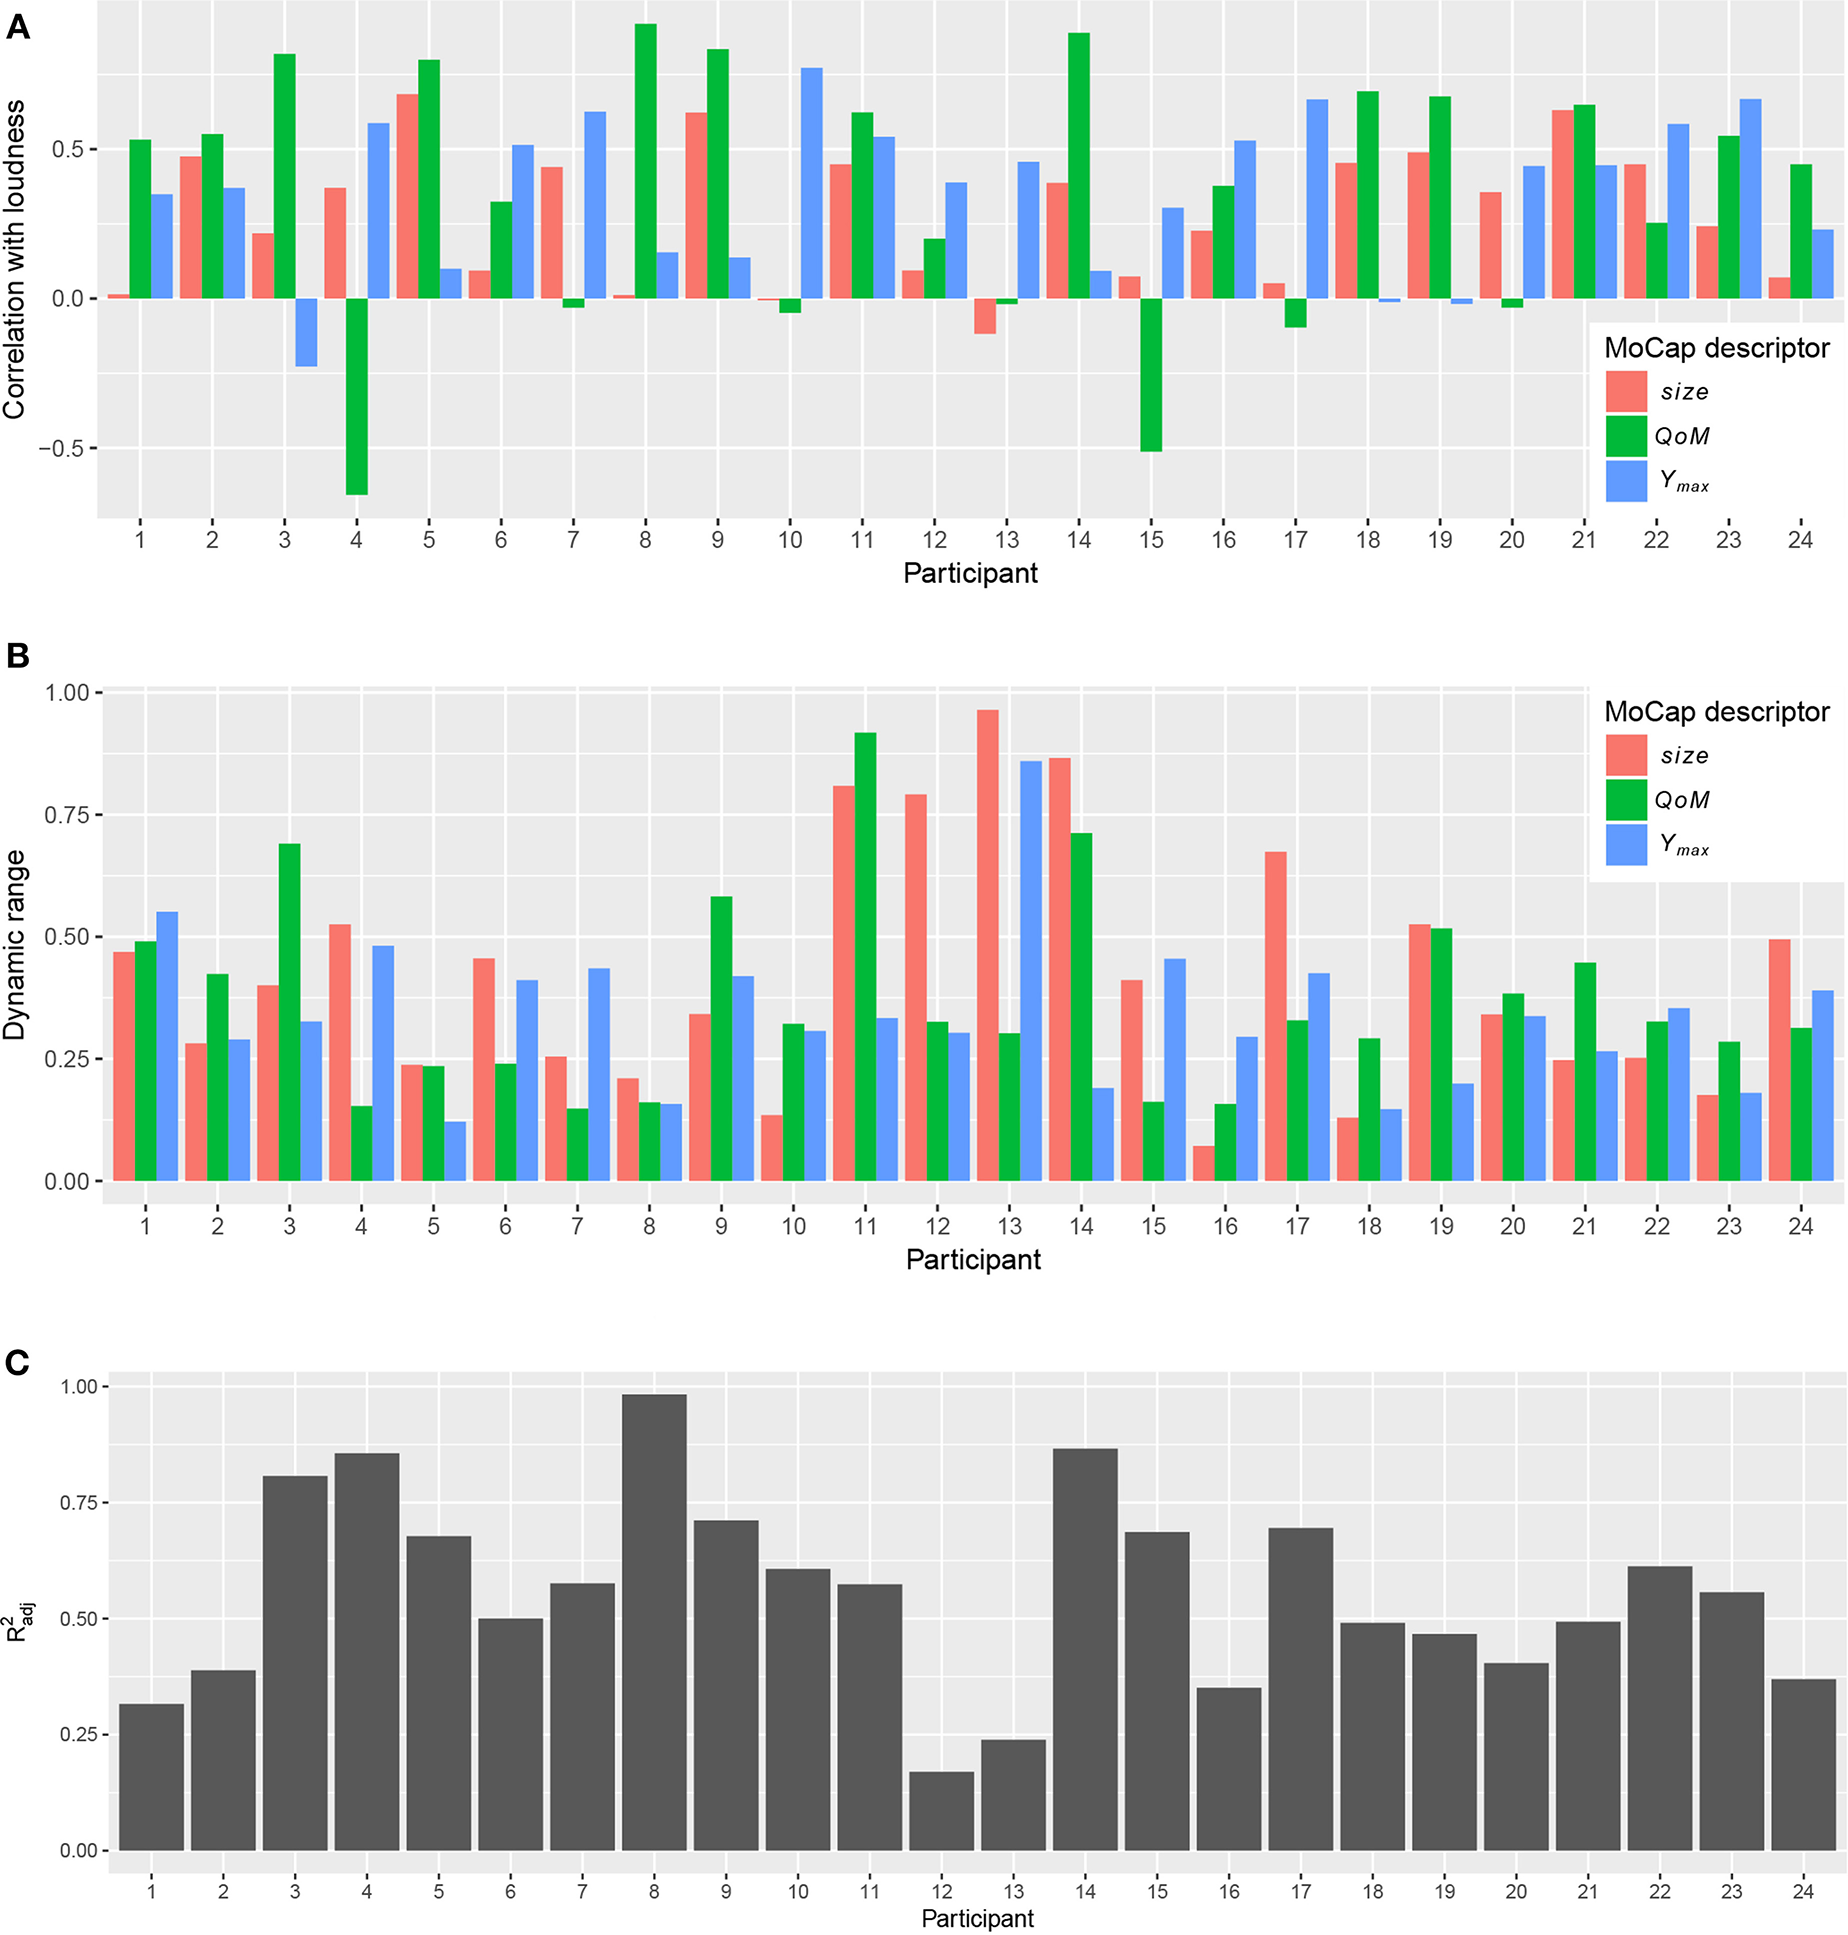
Correlation with loudness, dynamic range of MoCap descriptors, and coefficient of determination for each participant computed from first Warm up phase. (A) Correlation of MoCap descriptors with loudness. (B) Dynamic range of MoCap descriptors. (C) Coefficient of determination () of linear regression models.
Regarding beat control, Figure 5 shows, for each participant, the distribution of the differences in seconds between beats in the music and beats detected from hand movement. In the figure, we also indicate the number of frames for anticipation nant estimated from the mean of this distribution for each participant. There were 6 participants (2, 6, 12, 14, 17, and 24) for whom nant = 0, i.e., BASELINE and TRAINED systems were equivalent in terms of beat control. nant values range from −4 to 4. For participants with nant = 4, beats are triggered 9 frames (300 ms) before than for participants with nant = −4. From these distributions, we also computed F-measure values for each participant as introduced in Sarasúa and Guaus (2014a). This measure is an indication of how consistent is the anticipation effect that the TRAINED system uses for user-specific adaptation. We use these F-measure values below to check whether this affects the results.
Figure 5
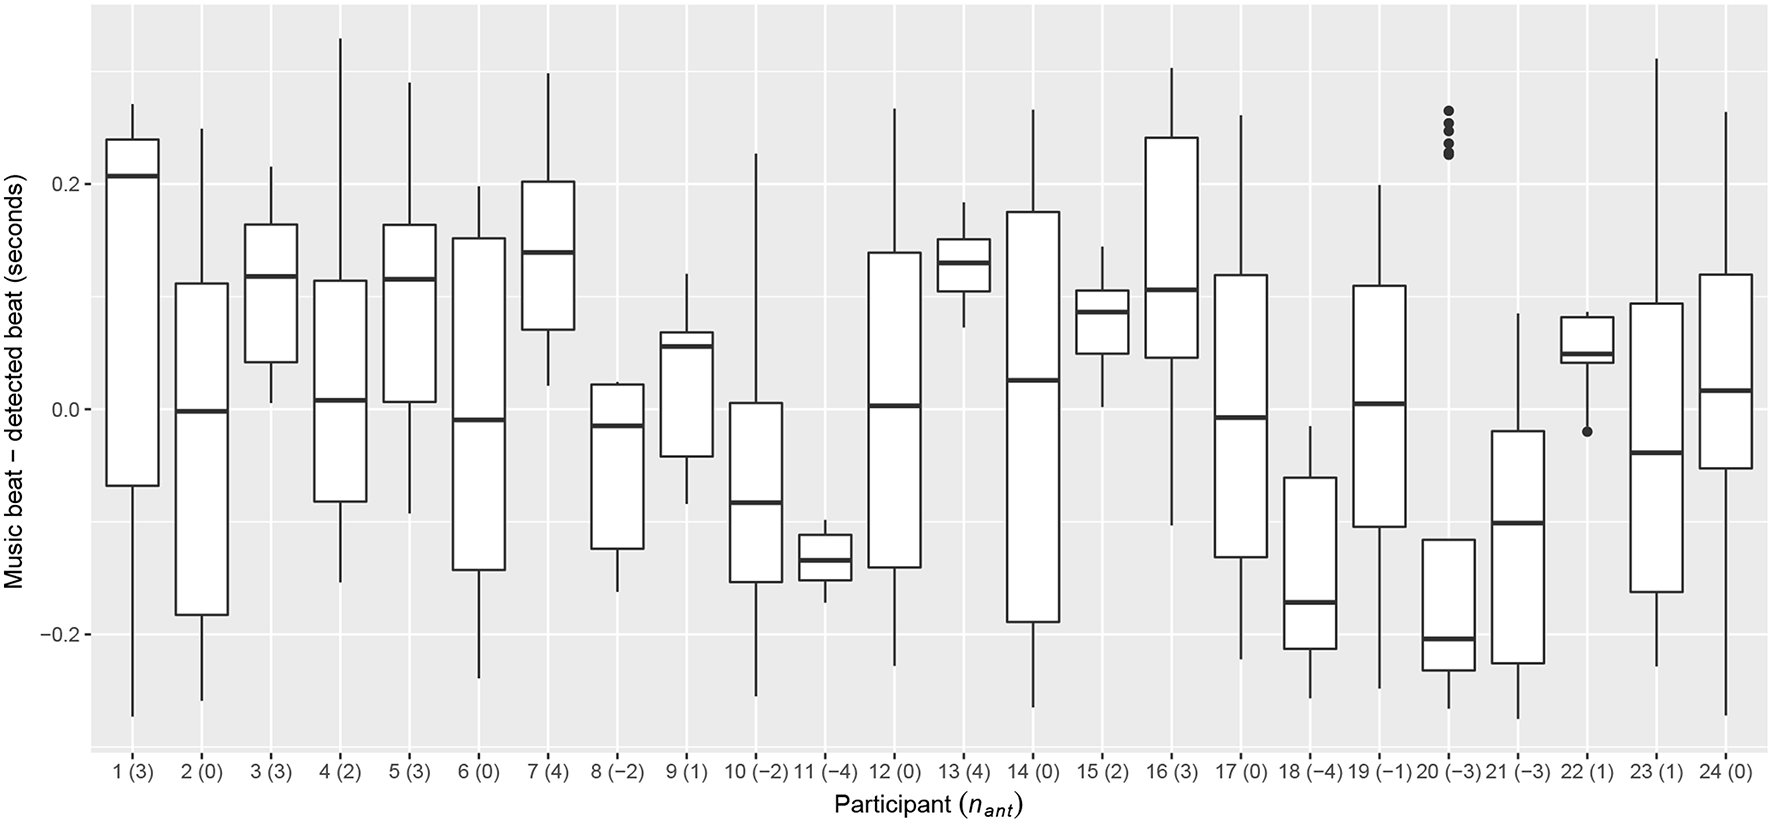
Distribution of differences between beats in music and beats detected in hand movement during the first Warm up phase for each participant. The resulting estimated number of frames for anticipation (nant) for each participant is indicated between parenthesis.
Both for loudness and beat control, the results indicate that the TRAINED system was quite different across participants. In the following, we analyze the results from the Tasks Phase.
4.1. Loudness Control
Regarding the objective measures taken from the tasks, Figure 6 shows the distributions of absolute loudness error (|εL|) for each participant across all loudness and combined tasks, with 64 values of εL per task (one per beat). In most cases, we observe the expected tendency of lower εL values with the TRAINED system. Participant 8, however, shows clearly worse results with the TRAINED system than in any other case. Coming back to the results from training (Figure 4), we see that actually this participant showed a very strong correlation between QoM and loudness. Also, the metric of the fitted regression model is 0.98, which is very close to ideal in terms of the loudness variability explained by the MoCap descriptors. The low dynamic range suggests that what may have happened is that the observed correlation is spurious; the participant performed with very little variations in QoM that just happened to be very correlated with loudness, resulting in a model whose functioning the participant was not able to learn. Given that this is an outlier case, we removed this participant for the overall statistical analysis presented below.
Figure 6
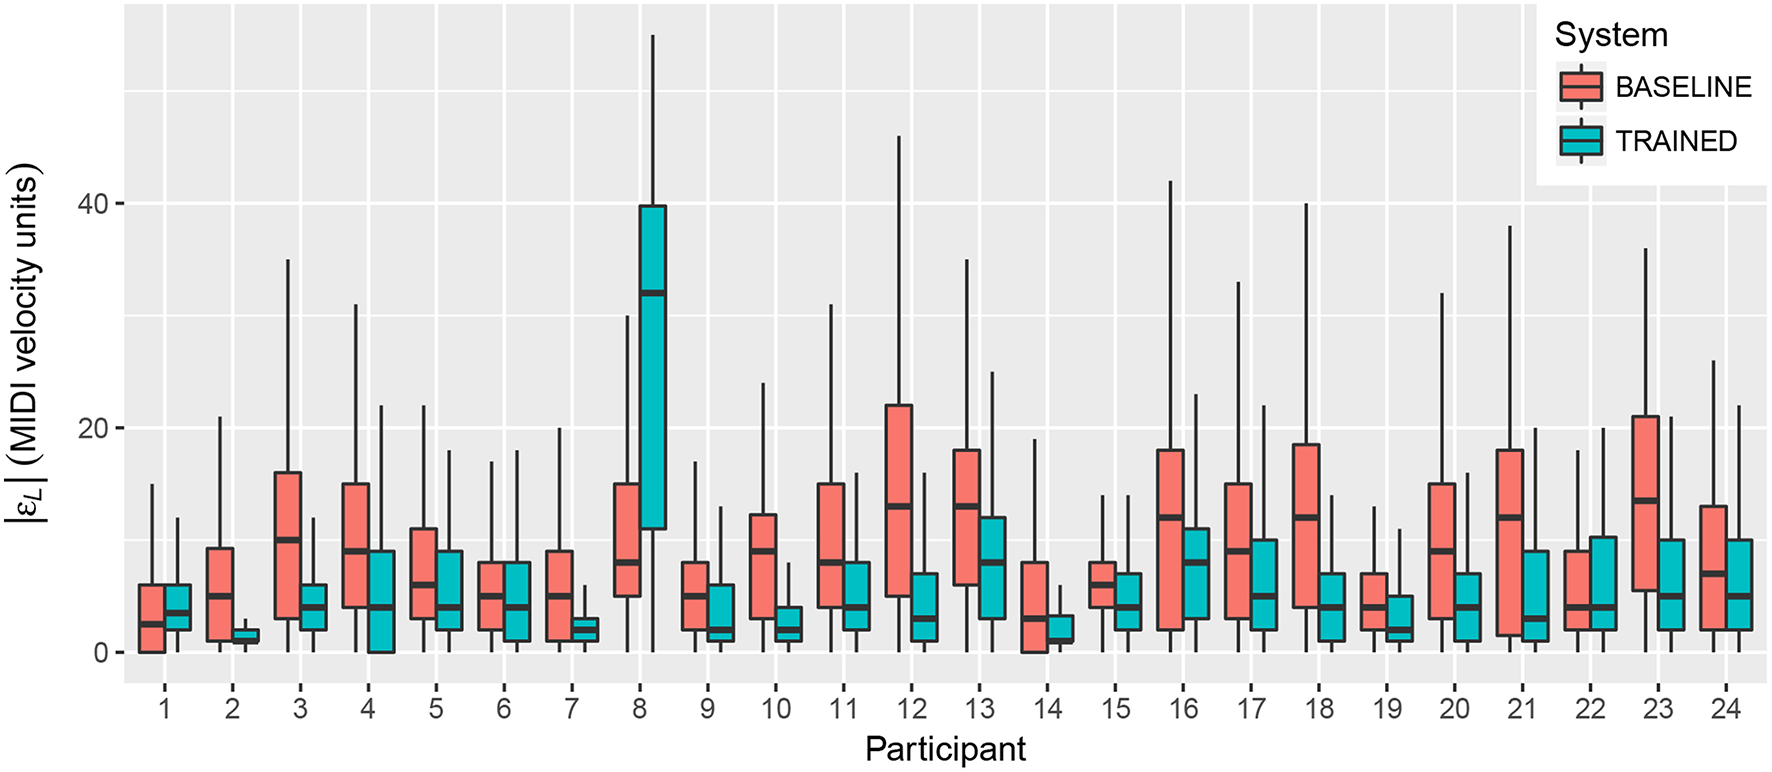
Absolute loudness error (|εL|) for both systems, averaged across tasks, for each participant.
In addition, and in order to prevent pseudoreplication (Hurlbert, 1984), we first averaged values per run and Target (recall that all three targets, “SOFT,” “MID,” and “LOUD” are present in every run), thus having a single observation per participant, Task Type, Target, and System. We do this because the 64 observations (one value per beat) per run correspond to one single application of the treatment (TRAINED or BASELINE) and are therefore correlated. If they were analyzed separately, degrees of freedom would be artificially inflated and our results would overstate statistical significance.
We fitted a linear model to System, System Index, Expertise, Task Type, Target and their two-factor interactions, and ran an ANOVA to study their effect on the absolute value of εL.
A strong effect was observed for System, F(1, 366) = 83.34, p < 0.001. As expected, the absolute value of the loudness error was significantly lower using the TRAINED system than using the BASELINE, the average error being of 5.70 mvu for the former and 10.43 mvu for the latter. System Index does not cause any main effect, nor does its interaction with System, indicating that the observed effect of System does not depend on the order in which the systems were presented to the participants.
Results reveal that the performance varies depending on the Target, F(2, 366) = 84.75, p < 0.001. Absolute error is higher for parts where the target was to play “LOUD.” However, this effect is mostly caused by tasks performed using the BASELINE system. The interaction between System and Target also has a significant effect on the absolute error, F(2, 366) = 59.10, p < 0.001. The errors were similar in the case of the TRAINED system (4.98 mvu for “SOFT,” 5.74 mvu for “MID” and 6.37 mvu for “LOUD”), but participants had more difficulties to achieve louder levels using the BASELINE system, with 3.49 mvu for “SOFT,” 9.27 mvu for “MID” and 18.53 mvu for “LOUD.” This suggests that the better performance of the TRAINED system is due to its ability to provide accurate control over the whole range of loudness levels. The BASELINE system, where the gesture size is mapped to loudness, was problematic for loudest levels.
The effect of Expertise also shows that musicians achieve significantly better control over loudness than non-musicians, F(1, 366) = 54.15, p < 0.001. This difference is however significantly reduced when using the TRAINED system. The difference between musicians and non-musicians using the BASELINE was 4.30 mvu, while it was 2.64 mvu using the TRAINED system. This suggests that even though both groups achieved better performance with the TRAINED system, musicians were more able to learn the functioning of the BASELINE and adapt in order to complete the tasks.
Finally, no effect is observed for the Task Type, but its interaction with Expertise indicates that musicians performed slightly better in combined tasks, while the opposite happened for non-musicians, F(1, 366) = 14.65, p < 0.001. Recall that combined tasks always come after simple ones. In this sense, the improvement in combined tasks for musicians can be due to learning. In the case of non-musicians, the effect might be explained by the higher complexity of combined tasks.
Regarding the subjective feedback provided by participants at the end of each task, Figure 7 shows the distribution of ratings in a 5-point scale ranging from 1 = “Could not control loudness at all” to 5 = “Could control loudness perfectly.” With the TRAINED system, participants rated their ability to control loudness with 4 in most cases, followed by 5. With the BASELINE, ratings were in most cases evenly distributed between 2 and 4. This suggests that participants felt they had better control over loudness when using the TRAINED system.
Figure 7
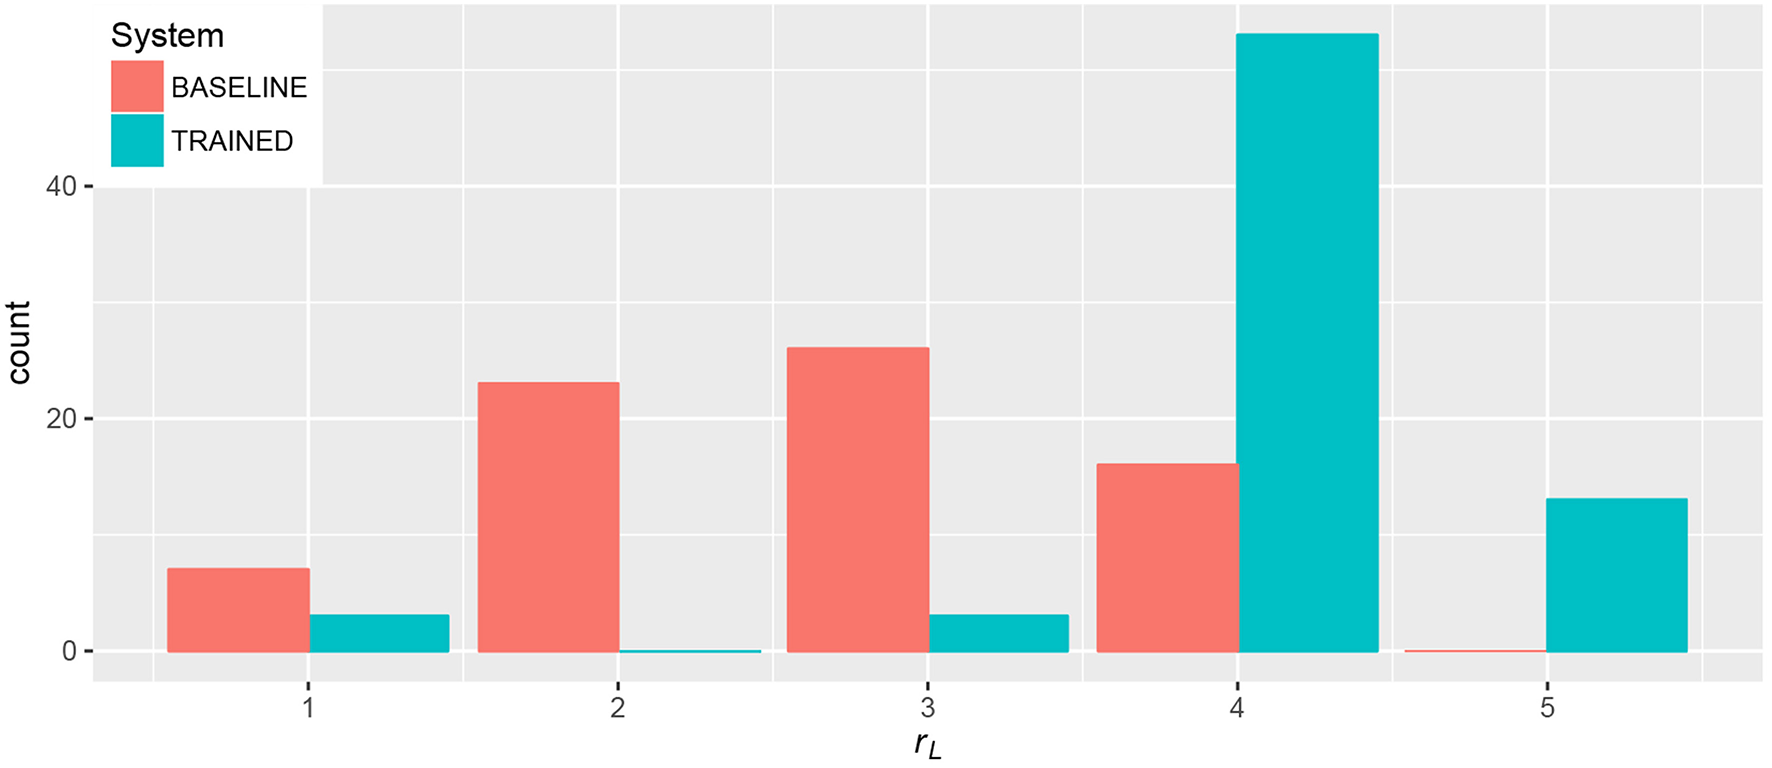
Ratings for loudness control (rL) provided by participants at the end of loudness and combined tasks.
Again, we fitted a linear model to System, System Index, Expertise, Task Type, and their two-factor interactions, this time running an ANOVA to study their effect on rL. Note that here we do not investigate Target, provided that the three targets appear in all tasks and we obtained one rating per task.
Results confirm that the reported sense of control over loudness is better using the TRAINED system, with an average rating of 4.14, than using the BASELINE, with 2.74, F(1, 128) = 91.39, p < 0.001. The analysis revealed no other significant effects.
We also examine the correlation between the subjective feedback provided by participants and the objective measures reflected in the values of εL. We expect a negative correlation (lower error for higher ratings). In Figure 8, every point corresponds to the average absolute value of εL and the rating provided by the participant for a task, with the color indicating the System being used. The correlation between rL and |εL| is −0.66. This indicates that, as expected, participants were able to achieve a better performance in the tasks when they had a better sense of control over loudness. One-way ANOVA shows that the difference of absolute values of εL for different ratings is significant, F(4, 139) = 37.32, p < 0.001.
Figure 8

Control over loudness rating (rL) and absolute loudness error (|εL|) of all loudness and combined tasks.
We also investigate whether the quality of the linear models computed to adjust the mapping of the TRAINED system for each participant influences the results. For this, we take the statistic of each participant's model, which gives a measure of how much loudness variability is explained by the MoCap descriptors. We then compute ΔεL for each participant as the difference between average |εL| values for the BASELINE and TRAINED systems. Accordingly, ΔεL measures how much improvement the TRAINED system introduces in comparison with the BASELINE. We have thus one and ΔεL value for each participant. The correlation between both variables across participants is 0.49. This positive correlation indicates that, as expected, better models result in higher improvement introduced by the proposed system.
Another interesting aspect we investigated is the learning effect that occurs during the realization of each task. Figure 9 shows the evolution of the absolute loudness error along the 64 beats each task lasted, averaged across all participants. A different curve is shown for each combination of System and Expertise. One of the visible effects in the graph is that the error is in general higher for every first beat with a new target. In the curves, this is reflected by the peaks appearing every 4 beats.
Figure 9
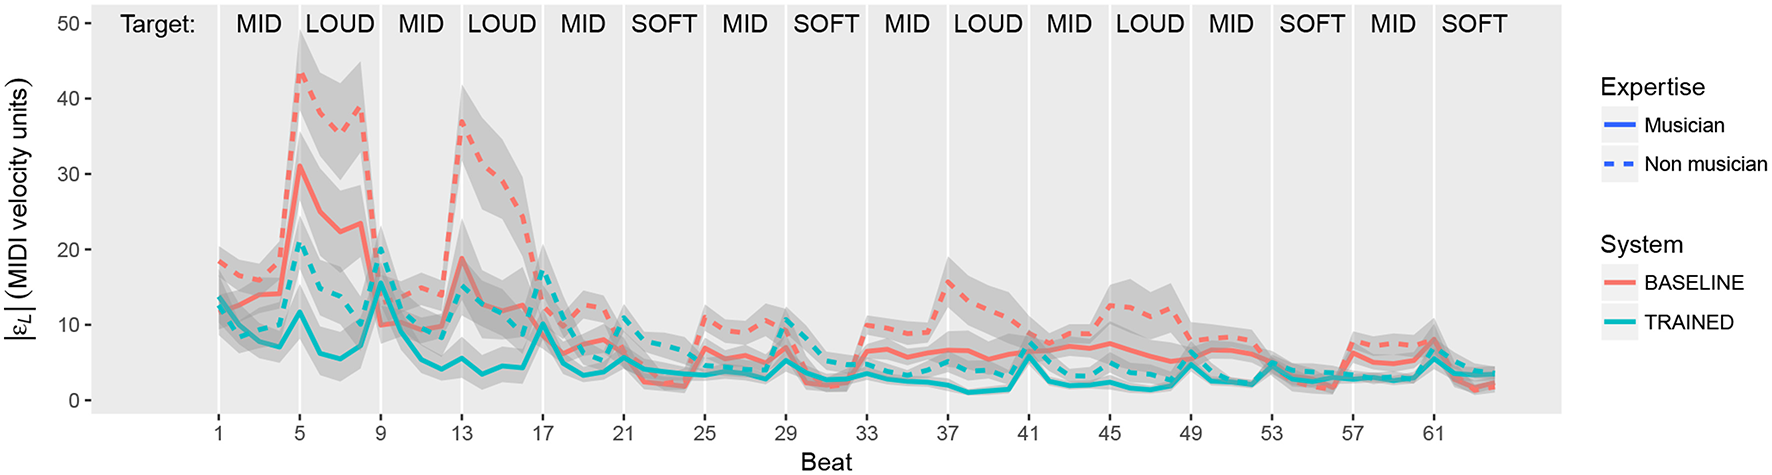
Average evolution of absolute loudness error (|εL|) for different combinations of System and Expertise.
It is also clearly visible that the aforementioned effect of the Target using the BASELINE system is particularly higher in the first two appearances of the “LOUD” target (beats 5–8 and 13–16). This is most likely caused by the fact that these are the first loudness changes that participants had to perform. Having observed this effect, we repeat the ANOVA by only using the information from the second half of every task (i.e., from beat 33), to check that the observed effects are consistent along the task. Indeed, the largest effect is the one caused by the System used in the task, F(1, 366) = 68.85, p < 0.001. The absolute loudness error is still significantly lower with the TRAINED system (3.43 mvu) than with the BASELINE (6.84 mvu). The effect of musicians performing better than non-musicians is also preserved, F(1, 366) = 26.75, p < 0.001. The effect of the Target and its interaction with the System also appears when looking at the second half of the tasks, but much more mitigated than when considering the whole task duration.
4.2. Beat Control
We now focus on beat control, by analyzing metronome and combined tasks. Regarding the objective performance measures in these tasks, Figure 10 shows the distributions of beat errors (distance in time between metronome and performed beats) for each participant across all metronome and combined tasks, with 64 values of εB per task (one per beat). As for the case of loudness, we observe that the general tendency is to find these distributions closer to 0 when the TRAINED system is used.
Figure 10
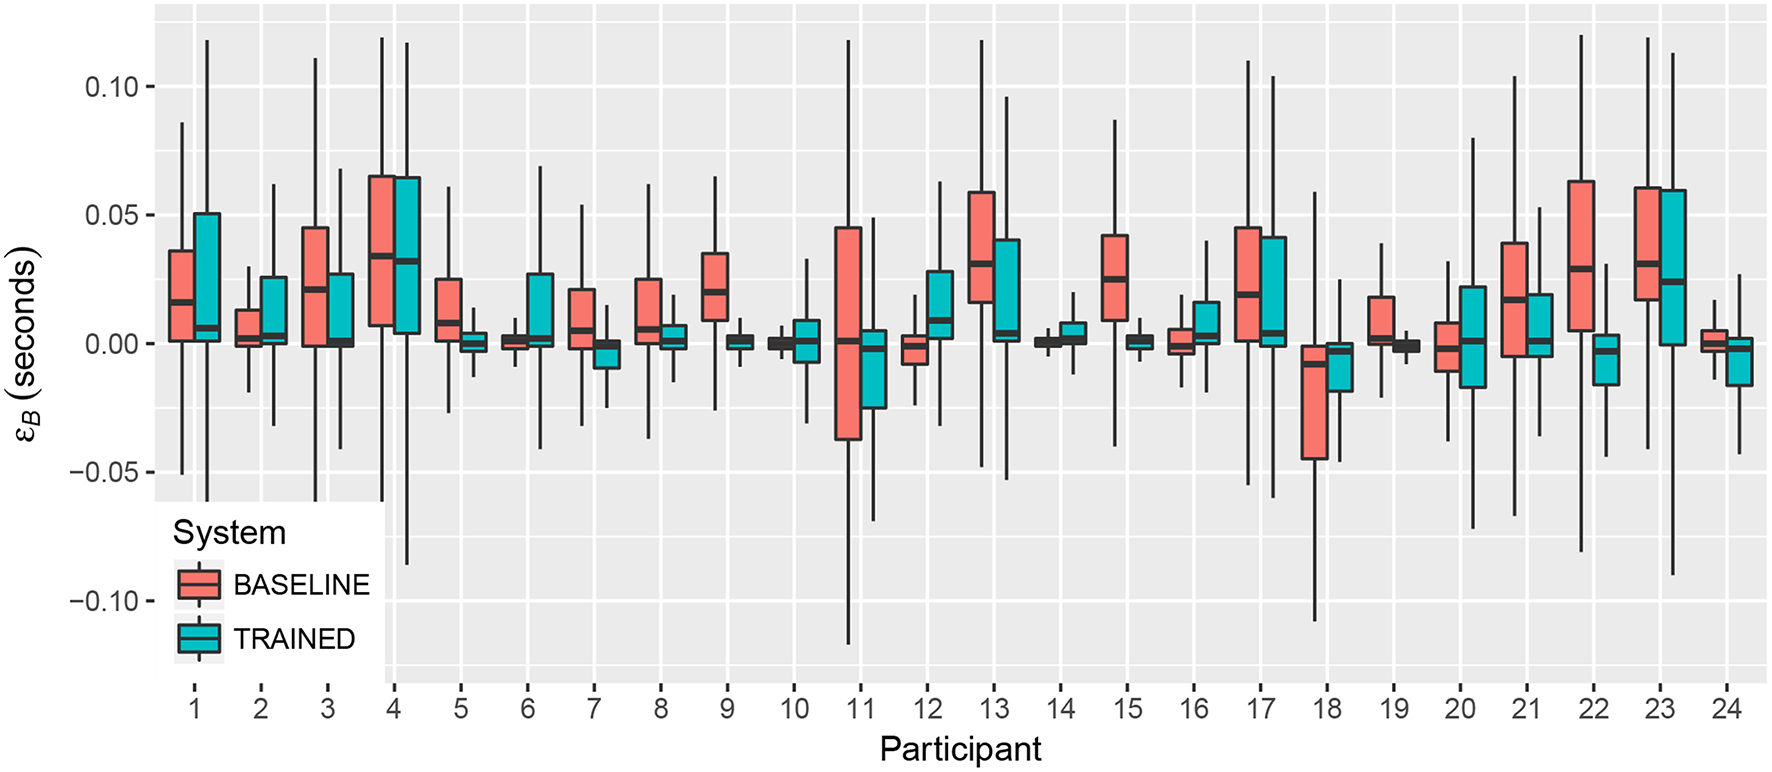
Beat error for both systems, averaged across tasks, for each participant.
In the case of beat control, both systems work equivalently if the estimated number of frames for anticipation nant = 0. For this reason, the analysis has one more factor than in the case of loudness control: Anticipation. This factor has just two levels (nant = 0 —no difference expected between systems— and nant ≠ 0). As before, we aggregate all 64 measurements per run in a single mean absolute score to prevent overstating statistical significance due to pseudoreplication. We fitted a linear model to System, System Index, Expertise, Task Type, Target, Anticipation and their two-factor interactions, and ran an ANOVA to study their effect on the absolute value of εB.
A significant effect is in fact caused by Anticipation, F(1, 136) = 6.72, p < 0.01. The absolute beat error for participants with nant≠0 (n = 18) is 0.009 s higher than for participants with nant = 0 (n = 6). The underlying effect is better explained by the interaction between Anticipation and System (F(1, 136) = 3.41, p < 0.01). In the case of participants with nant≠0, the absolute beat error is 0.013 s smaller using the TRAINED system. For the 6 participants for whom nant = 0, the error is slightly smaller (0.003 s) using the BASELINE system. These results indicate that the compensation introduced by the TRAINED system is indeed useful to improve the performance of participants who tended to anticipate or fall behind the beat during the Warm up phase (nant≠0), i.e., when they performed spontaneous conducting movements. These differences are in the range of a few milliseconds and it could be argued that it would be hardly perceivable from the perspective of the performer (Wessel and Wright, 2002). Recall, however, that these differences are not the differences in how beats are triggered using each system (e.g., correcting by just one frame introduces a 33.3 ms correction), but between the actual average achieved performances. In other words, a 33.3 ms correction does not imply a 33.3 ms improvement in the absolute beat error; still, in average, there is an observable significant improvement.
The results also indicate that the error differed depending on the musical Expertise. Musicians show 0.009 s less absolute error than non-musicians, F(1, 136) = 10.75, p < 0.001. Interestingly, the Target also affects the absolute beat error, F(1, 136) = 6.50, p < 0.001. However, this only occurs for participants with nant≠0 using the BASELINE system. This indicates that the correction that the TRAINED system applies is particularly necessary for slower tempi. Indeed, focusing on the 18 participants with nant≠0, the TRAINED system outperforms the BASELINE by reducing the absolute beat error in 0.007 s for 100 BPM tasks and 0.019 s in 80 BPM tasks.
Figure 11 shows the results of subjective ratings of beat control, where participants rated in a 5-point scale ranging with 1 = “Instruments played much sooner than I intended,” 3 = “Instruments played exactly when I intended,” 5 = “Instruments played much later than I intended.” In this case, the best rating is thus 3 (“exactly when intended”). The figure shows the tendency of participants to give a better rating when using the TRAINED system.
Figure 11
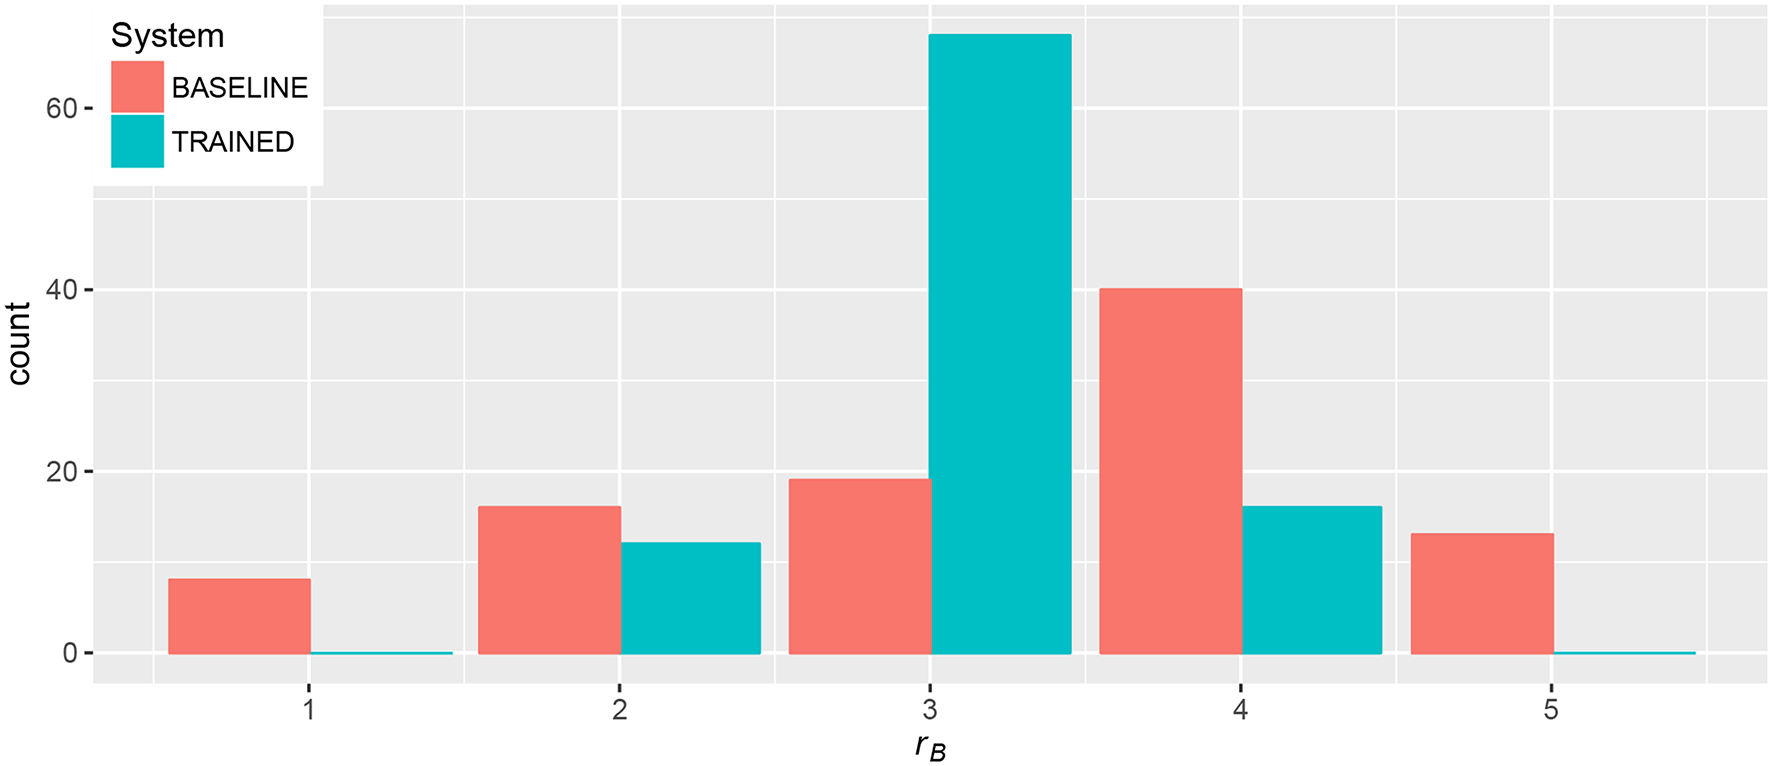
Ratings for beat control provided by participants at the end of metronome and combined tasks.
In order to statistically analyze the effect of the different factors on the ratings, we perform the following analysis. We define , which ranges from 1 to 3, being 1 = “Instruments played much sooner/later than I intended,” 2 = “Instrument played a bit sooner/later than I intended” and 3 = “Instruments played exactly when I intended.” , then, gives a measure of how good or bad the participant felt the system was in providing accurate control of beats, independently of whether a possible bad behavior was caused by instruments playing sooner or later than intended.
Again, we fitted a linear model on the factors of the analysis and performed an ANOVA to study their effect on . Participants rated their ability to make instruments play when intended with an average 2.71 for the TRAINED system and 1.97 for the BASELINE, being this difference significant, F(1, 136) = 743.5, p < 0.001. As expected, the perceived difference was bigger for participants with nant≠0. They rated the BASELINE with an average 1.72 and the TRAINED system with 2.72. The 6 participants for whom both systems were equivalent gave slightly better rating to the BASELINE (2.75 vs 2.67 for TRAINED). The interaction between Target and System [F(1, 136) = 11.84, p < 0.001] shows that the reported sense of control was significantly worse for 80 BPM tasks using the BASELINE. As we saw before, this is the case where the highest values for absolute beat error appeared. This suggests that the ability to correctly perform the task (to make the orchestra play in synchrony with the metronome) influenced the perceived ability to make instruments play when intended.
As in the case of loudness, we examined the correlation between the subjective and objective measures. In this case, we expect a positive correlation, with negative values of εB for low ratings, positive values of εB for high ratings, and εB values close to 0 for rB = 3. Every point in Figure 12 corresponds to the average value of εB and the rating provided by the participant for a task, with the color indicating the System being used. The correlation in this case is weaker (0.48), but still in the expected direction. This indicates that those participants who felt that instruments came too early with respect to their gesture tended to make the orchestra play in anticipation to the metronome, while those who felt that instruments came too late tended to make the orchestra beats fall behind the metronome. One-way ANOVA shows that the difference of values of εB for different ratings is significant, F(4, 187) = 9.912, p < 0.001.
Figure 12

Control over beat rating (rB) and beat error (εB) of all metronome and combined tasks.
As we indicated earlier, we computed F-measure values from the training data as indicative of the consistency of participants to anticipate or fall behind the beat during the Warm up phase. In order to test whether this had an effect on the results, we compute ΔεB for each participant as the difference between average |εB| values for the BASELINE and TRAINED systems, i.e., ΔεB measures how much improvement there is using the TRAINED system in comparison with the BASELINE. Then, we compute the correlation between ΔεB and F-measure values across participants, obtaining a high value of 0.81. This indicates that after the Warm up phase, just by looking at the data used for adapting the TRAINED system, we can guess whether the adaptation will introduce an improvement or not. To put it another way: if time differences between beats in the music and beats detected from hand movement are not consistent in the warm up phase, then the adaptation introduced by the TRAINED system does not guarantee an improvement.
Finally, we explore the possible learning and adaptation effects during tasks. Figure 13 shows the evolution of the absolute beat error along the 64 beats each task lasted, averaged across all participants. A different curve is shown for each combination of System and Expertise. We observe a more stable tendency than in the case of loudness control. The error is higher during the first bars, where participants seem to adapt to make the orchestra synchronize with the metronome. The error looks much more stable in the second half (from beat 33), so we also ran the ANOVA again to check if the observed effects also appear in the moment where participants seem to have adapted.
Figure 13
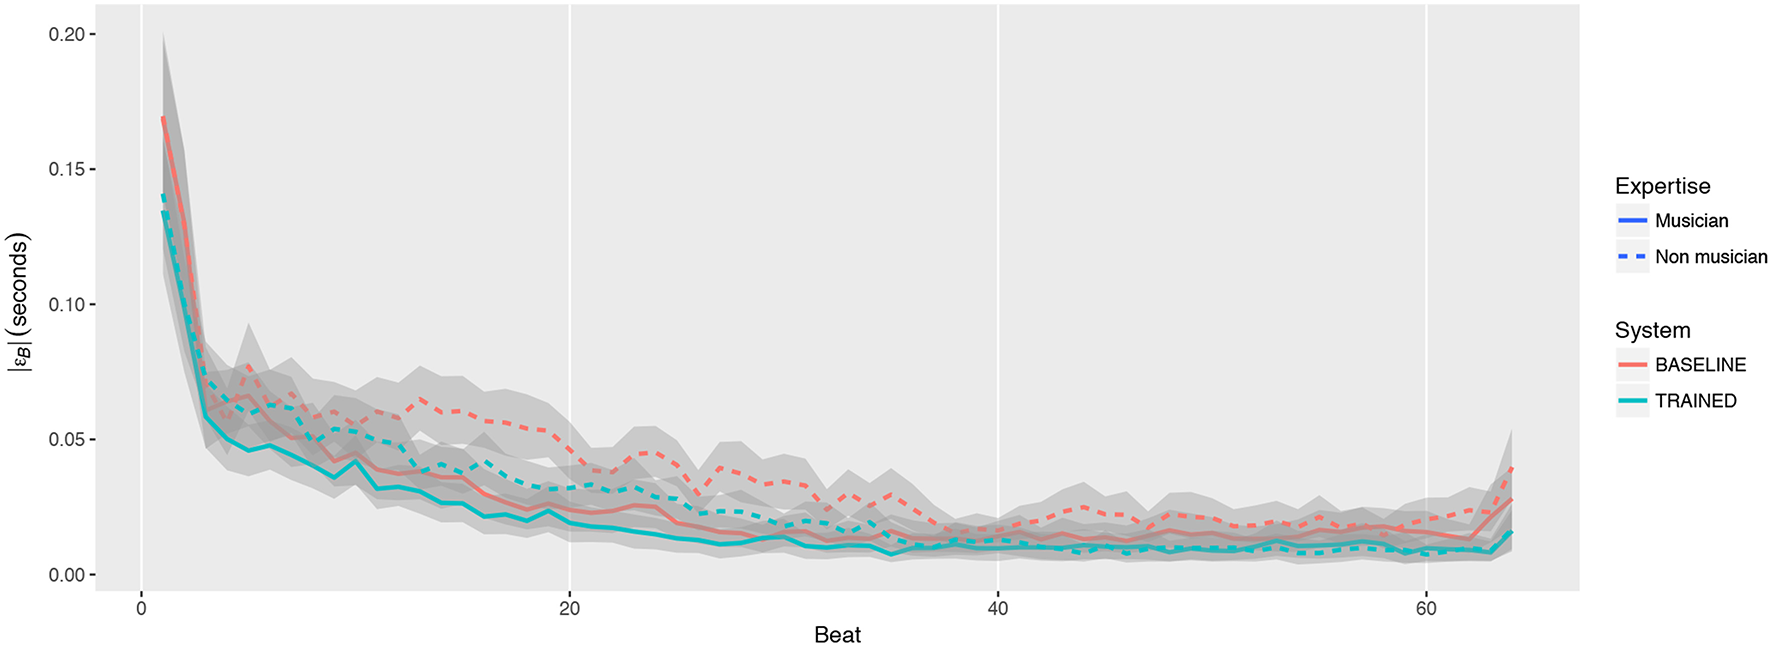
Average evolution of absolute beat error (|εB|) for different combinations of System and Expertise.
The results indicate that there is still a difference of 0.003 s between musicians and non-musicians, F(1, 136) = 1.83, p < 0.01. This difference is however smaller than when considering the full task (0.009 s), which indicates that part of the better performance of musicians is due to their ability to adapt faster. A greater difference is still observed for the System: the performance is still notably better (0.008 s improvement) with the TRAINED system than with the BASELINE, F(1, 136) = 10.33, p < 0.001.
4.3. Overall Evaluation
As we indicated, participants were able to freely perform with both systems again at the end of the experiment, after which they were asked whether they have found differences between both systems and whether they preferred any of them in terms of loudness and beat control.
All participants indicated that they had indeed noticed differences between both systems. Regarding loudness control, all participants preferred the TRAINED system, except for participants 22 and 8 (the outlier), who preferred the BASELINE. Regarding beat control, three participants (2, 6, and 14) indicated that they did not have any preference between both systems, and one (12) showed preference for the BASELINE system. All these four participants were amongst those with nant = 0 (i.e., both systems were equivalent in terms of beat control). The rest of the participants showed preference for the TRAINED system.
5. Discussion
Results of the experiment suggest that both hypothesis are confirmed: the usability of the proposed system, with the mapping built from the analysis of spontaneous conducting movements, is better both in terms of providing a more intuitive control over loudness (H1) and a more precise control over beat timing (H2). In both cases, results of objective evaluation and subjective feedback provided by participants are coherent. Note that, as indicated above, we use intuitive in the sense that users were not given instructions on how each system worked, and they were just learning by performing.
We believe that the proof of these hypotheses is particularly relevant considering that parameters were learned in spontaneous movements, i.e., participants where not making a conscious training of their personalized systems when the parameters for control were learned. This is important for public installations where, if the interaction designers want to take advantage of user customization, it is preferable to make it in a way that is transparent to the user. Our experiment was however carried out in a lab setting, so social factors may arise in such public settings that could condition the direct applicability of the observed results. We have undertaken some informal validation during public outreach events that seem to validate the presented results, but formal validation remains as a necessary task for future work. Beyond the concrete scope of systems for music conducting, our conclusions can be relevant for other interaction design scenarios using metaphors: the knowledge of the user from the original activity can be explicitly exploited in the system.
Similar applications can be defined in a context were learning does not take place by automatically analyzing spontaneous movements but allowing users to consciously create their own personal mappings. This would be closer to Mapping by Demonstration as introduced by Françoise (2015), and can benefit from Interactive Machine Learning techniques for DMI building (Fiebrink and Caramiaux, 2016). We have in fact already considered this approach in the context of conducting to allow users to define their own space for controlling articulation (Sarasúa et al., 2016).
Precisely because the focus of this work was to test whether the information observed in spontaneous movements is useful to be applied during interaction, the parameters under control and the systems under comparison were kept simple. The learned parameters are applied, in the end, to modify the rules of the system used as baseline (by using appropriate descriptors and weights to control loudness and by compensating for the observed anticipation for beat). However, as we pointed out in the introduction, previous conducting systems have used more sophisticated techniques to deal with temporal information from the gesture (Brecht and Garnett, 1995; Usa and Mochida, 1998; Ilmonen, 1999; Kolesnik, 2004). We believe that the conclusions from this experiment are not restricted to the case of simple rule-based systems, nor to just the control of beat and loudness. Particularly suitable for more sophisticated and complex gesture-sound mappings to be learned from few observations would be dynamical models that adapt dynamically to variations (Caramiaux et al., 2014b) or statistical models like HMMs that learn spatio-temporal variations from gesture (Françoise et al., 2014).
In the field of NIME, it is often hard to establish a criterion for evaluating the quality or usability of musical interfaces. In the concrete case of systems using the conductor metaphor, evaluations, when provided, are most of the times based on subjective feedback provided by participants (Lee et al., 2004; Bergen, 2012; Rosa-Pujazon and Barbancho, 2013) or are focused on evaluating technical aspects specific to the method being used (Brecht and Garnett, 1995; Toh et al., 2013). The warm up and learning phases of the procedure we followed in our experiment are specific to the scenario where the user receives no instructions and observation from her spontaneous movements is required. However, we believe that the kind of tasks we used are suitable to other cases where it is necessary to objectively assess the suitability of a musical interface to control some specific parameters.
In our experiment we also were interested in the effect of musical expertise in the interaction. We observed that, in general, musicians achieved better performance than non-musicians. However, focusing on loudness control, this difference was reduced with the proposed system. This suggests that musicians were better at learning how to conduct with the BASELINE system, while non-musicians probably tried to stick to their intuitions and were less able to learn by playing. Provided that this effect (greater improvement for non-musicians) was not observed for beat control, this might also indicate that non-musicians, when using the BASELINE system, tended to focus more on beat control and “forget” about loudness. In accordance with this idea, non-musicians got worse results in combined tasks than in simple ones for loudness control, while the opposite happened for beat control. Results also seem to reveal that this difficulty of non-musicians to control loudness with the BASELINE system was particularly noticeable in louder parts. This might indicate that they were unable to discover that loudness was controlled with the size of the gesture or that they were probably unable to perform big enough gestures at a given tempo. In any case, all results back the idea that non-musicians were the most benefited by using the proposed system, which learns its mapping from their spontaneous movements.
In the analysis of loudness control, we removed participant 8, whose results were causing spurious effects for a number of factors and interactions. However, the case of this participant must be carefully considered, as it shows the problems that can be encountered when applying knowledge extracted from analyzing spontaneous movements on top of fixed music. Even though the results from the warm up phase, where the parameters for the TRAINED system are learned, indicate a high correlation (0.920) between QoM and midi velocity, the resulting model was clearly not intuitive for this participant to control loudness. In most cases, modifications introduced by the TRAINED system created more intuitive interfaces, but the possibility of learning wrong clues is present and should be considered. In the context of public installations, this can be addressed by giving the user the possibility to perform an explicit, conscious training; or by providing explicit usage instructions (i.e., explaining the mapping) when bad performance is detected.
We would also like to point out some considerations regarding the limitations of the input device used in this work: the Kinect v2. Concretely, the implications of its motion capture frame rate and latency. The Kinect v2 works at 30 fps (30 Hz). This control granularity is far from optimal for many real-time musical applications. For example Jordà (2005) situates 100 Hz as a reasonable lower limit, while Mulder (1998) considers a maximum time delay of 20 ms (50 Hz) acceptable. This, of course, depends on the context of and the application. In our case, we were using a synthesis engine with bowed strings sounds and legato articulation. This makes the 33 ms precision of the device more acceptable than it would be for percussive sounds. Subjective feedback from the experiment suggests that indeed, with this device under these conditions, participants felt they were able to make instruments play when intended despite the frame rate of the device. Another aspect to take into account regarding the time granularity of the device is that the average values of εB (time difference between metronome and played beats), given in ms, are meaningful because in all cases we are considering a high number of beats. The program was designed to guarantee no jitter for consecutive metronome beats at the millisecond level, and the time between metronome beats always was the one corresponding to the tempo (750 ms for 80 bpm, 666.6 ms for 90 bpm, and 600 ms for 100 bpm). The Kinect v2 frames are not guaranteed to appear every 33.3 ms as there is some jitter (Sell and O'Connor, 2014). In this sense, for a single detected beat in the movement, part of its difference with respect to the closet metronome will always be caused by this jitter. However, when we observe differences in two large distributions of εB, we can assume that these differences are caused by the rest of the implicated factors.
Latencies around 20–30 ms are commonly considered acceptable for most musical applications (Lago and Kon, 2004). The Kinect v2 has a ~20 ms latency (Sell and O'Connor, 2014), and the computation of velocity from raw positional data using low-pass differentiators introduces two samples of delay (Skogstad et al., 2013). This means that this latency is implicit in observed differences in anticipation to the beat. In this sense, the observed improvement introduced by compensating for different tendencies to anticipate or fall behind the beat is also compensating for the device and computation latencies.
Having these considerations in mind, we can further explore the results for beat control. BASELINE and TRAINED systems were equivalent for beat control for participants for whom the estimated anticipation was nant = 0. Results show how a strong difference in the performance for beat control between both systems was just observed in participants with nant≠0. Strictly speaking, however, there is a difference between both systems when nant = 0: the mapping for loudness control is different. This could have caused a better performance for beat control of the TRAINED system, specially in combined tasks, but this effect was not observed. Interestingly, the results also show how participants with nant≠0 had special difficulties with the slowest tempo (80 BPM) task that were mitigated when the estimated anticipation was compensated (i.e., when they used the TRAINED system). This is unlikely to be caused by the time granularity limitations of the input device, which in fact would penalize the faster task. At 80 bpm (750 ms) there are 22.5 Kinect frames between two consecutive beats, while there are 18 at 100 bpm (600 ms)9. In this sense, the results suggest that observed differences in terms of anticipation of the beat are particularly relevant for slower tempos.
In loudness tasks, we added a visual feedback to maximize the ability of users to remember when they were supposed to perform the changes in loudness during the task execution. This means that we cannot separate the effect of the resulting audio and visualization in the results from the tasks (i.e., users could be adapting their performance based on the resulting visuals, audio or both). However, we also have subjective ratings from the final stage (overall evaluation), where participants could just freely perform without any required task or visuals. Results indicate that they indeed preferred the TRAINED system in terms of loudness control, which indicates that the preference observed during the tasks (and confirmed by objective measures) is in agreement with subjective sense of control during free performance.
An additional consideration to point out from the analyzed data is that the group of participants was unbalanced in terms of gender (six female participants out of twenty four) or background education (the experiment was carried out in the University facilities with students and University staff). While we do not expect any effect of gender on the performance, it would be desirable to perform experiments with more balanced groups in order to be able to investigate this.
We have not dealt with the underlying mechanisms that may cause differences between participants. Whether the different tendencies to anticipate or fall behind the beat are intentional, caused by different sensorimotor synchronization to the beat (Aschersleben, 2002) or by different hand gestures is something we cannot analyze from the acquired data. We could even expect different results if the music material or chosen sound engine had been different. Observation studies of sound-accompanying movements by Jensenius (2007) show that these movements are influenced, among other things, by action-sound types (impulsed, sustain, iterative) that depend on the instrument and articulation with which it is played. In any case, for the goal of this work, our focus was to compensate an observed effect, regardless of the mechanisms that cause it. Also, we selected a musical excerpt where the main melody mostly contains quarter notes, avoiding possible problems with participants conducting to the rhythm instead of the beat, as observed by Lee et al. (2005). This is something to take into consideration, particularly when the goal is to create a system that users can learn to use by themselves. In addition, we did not analyze beat misdetections. Again, our focus was the comparison between both systems; possible errors in the detection of the ictus are common to both and are outside the scope of interest in this work.
Statements
Author contributions
ÁS designed and implemented the systems, performed the experiments and data analysis and wrote the paper. JU contributed to the experiment design and the data analysis and revised critically the paper. EG was the supervisor of the project and revised critically the paper.
Acknowledgments
We would like to thank all the people who participated in the study, as well as all the colleagues at the Music Technology Group for their valuable feedback.
Conflict of interest
The authors declare that the research was conducted in the absence of any commercial or financial relationships that could be construed as a potential conflict of interest.
Footnotes
2.^CHI, one of the most relevant conferences on HCI: https://sigchi.org/conferences/conference-history/chi/
3.^https://developer.microsoft.com/en-us/windows/kinect
4.^https://github.com/asarasua/MoDe
5.^We use the squared distance instead of the distance as it requires less computation.
7.^https://github.com/elliotwoods/ofxKinectForWindows2
8.^https://www.upf.edu/web/cirep/
9.^We can assume that the input device limitations would start to harm the performance for faster tempo, even though it was not observed for the selected tempos in our tasks.
References
1
AscherslebenG. (2002). Temporal control of movements in sensorimotor synchronization. Brain Cogn.48, 66–79. 10.1006/brcg.2001.1304
2
BergenS. (2012). Conductor Follower: Controlling Sample-Based Synthesis With Expressive Gestural Input. Master's thesis, Aalto University School of Science.
3
BlackwellA. F. (2006). The reification of metaphor as a design tool. ACM Trans. Comput. Hum. Interact.13, 490–530. 10.1145/1188816.1188820
4
BoieB.MathewsM. V.SchlossA. (1989). The radio drum as a synthesizer controller, in Proceedings of the 1989 International Computer Music Conference, ICMC (Columbus, OH), 42–45.
5
BorchersJ. O.SammingerW.MühlhäuserM. (2002). Engineering a realistic real-time conducting system for the audio/video rendering of a real orchestra, in 4th International Symposium on Multimedia Software Engineering, ISMSE, 352–362. 10.1109/MMSE.2002.1181633
6
BrechtB.GarnettG. (1995). Conductor follower, in Proc. of the 1995 International Computer Music Conference (San Francisco, CA: International Computer Music Association), 185–186.
7
CaramiauxB.FrançoiseJ.SchnellN.BevilacquaF. (2014a). Mapping through listening. Comput. Music J.38, 34–48. 10.1162/COMJ_a_00255
8
CaramiauxB.MontecchioN.TanakaA.BevilacquaF. (2014b). Adaptive gesture recognition with variation estimation for interactive systems. ACM Trans. Interact. Intell. Syst.4, 1–34.
9
CarrilloA. P.BonadaJ. (2010). The bowed tube : a virtual violin, in Proceedings of the International Conference on New Interfaces for Musical Expression (Sydney, NSW), 229–232.
10
FabianiM. (2011). Interactive Computer-Aided Expressive Music Performance: Analysis, Control, Modification and Synthesis. Ph.D. thesis, KTH.
11
FelsS.GaddA.MulderA. (2002). Mapping transparency through metaphor: towards more expressive musical instruments. Org. Sound7, 109–126. 10.1017/S1355771802002042
12
FiebrinkR.CaramiauxB. (2016). The machine learning algorithm as creative musical tool. arXiv:1611.00379.
13
FrançoiseJ. (2015). Motion-Sound Mapping by Demonstration. Ph.D. thesis, Université Pierre et Marie Curie. 10.13140/RG.2.1.5035.0248
14
FrançoiseJ.SchnellN.BorghesiR.BevilacquaF. (2014). Probabilistic models for designing motion and sound relationships, in Proceedings of the International Conference on New Interfaces for Musical Expression (London; Goldsmiths; University of London), 287–292.
15
GarnettG.JonnalagaddaM.ElezovicI.JohnsonT.SmallK. (2001). Technological advances for conducting a virtual ensemble, in International Computer Music Conference (Havana: Michigan Publishing, University of Michigan Library), 167–169.
16
HaflichF.BurndsM. (1983). Following a conductor: the engineering of an input device, in Proc. of the 1983 International Computer Music Conference (San Francisco, CA).
17
HurlbertS. H. (1984). Pseudoreplication and the design of ecological field experiments. Ecol. Monogr.54, 187–211.
18
IlmonenT. (1999). Conductor following with artificial neural networks, in Proceedings of the 1999 International Computer Music Conference, ICMC (Beijing), 367–370.
19
JenseniusA. (2007). Action-Sound: Developing Methods and Tools to Study Music-Related Body Movement. Ph.D. thesis, University of Oslo.
20
JordáS. (2005). Digital Lutherie: Crafting Musical Computers for New Musics' Performance and Improvisation. Ph.D. thesis, Universitat Pompeu Fabra.
21
KeaneD.GrossP. (1989). The MIDI Baton. Ann Arbor, MI: Michigan Publishing, University of Michigan Library.
22
KolesnikP. (2004). Conducting Gesture Recognition, Analysis and Performance System. Master's thesis, McGill University.
23
LagoN.KonF. (2004). The quest for low latency, in Proceedings of the 2004 International Computer Music Conference, ICMC (Miami, FL), 33–36.
24
LeeE.NakraT. M.BorchersJ. (2004). You're the conductor: a realistic interactive conducting system for children, in Proceedings of the 2004 Conference on New Interfaces for Musical Expression (Singapore: National University of Singapore), 68–73.
25
LeeE.WolfM.BorchersJ. (2005). Improving orchestral conducting systems in public spaces: examining the temporal characteristics and conceptual models of conducting gestures, in Proceedings of the SIGCHI Conference on Human Factors in Computing Systems (New York, NY: ACM), 731–740. 10.1145/1054972.1055073
26
MarrinT.ParadisoJ. (1997). The digital baton: a versatile performance instrument, in International Computer Music Conference (Michigan Publishing, University of Michigan Library), Vol. 1997, 313–316.
27
MarrinT.PicardR. (1998). The “Conductor's Jacket”: a device for recording expressive musical gestures, in Proceedings of the 1998 International Computer Music Conference, ICMC (Ann Arbor, MI), 1–5.
28
MathewsM. V. (1976). The conductor program, in Proceedings of the International Computer Music Conference (Cambridge, MA).
29
MathewsM. V. (1991). The radio baton and conductor program, or: pitch, the most important and least expressive part of music. Comput. Mus. J.15, 37–46.
30
MathewsM. V.BarrD. (1988). The Conductor Program and Mechanical Baton. Stanford University, Stanford, CA.
31
MoritaH.OhteruS.HashimotoS. (1989). Computer music system which follows a human conductor, in International Computer Music Conference Proceedings (Michigan Publishing, University of Michigan Library), 207–210.
32
MulderA. (1998). Design of Virtual Three-Dimensional Instruments for Sound Control. Ph.D. thesis, Simon Fraser University.
33
ParadisoJ. A. (1997). Electronic music: new ways to play. IEEE Spectrum34, 18–30.
34
PoepelC.OverholtD. (2006). Recent developments in violin-related digital musical instruments: where are we and where are we going? in Proceedings of the International Conference on New Interfaces for Musical Expression (Paris), 390–395.
35
Rosa-PujazonA.BarbanchoI. (2013). Conducting a virtual ensemble with a kinect device, in Proceedings of the Sound and Music Computing Conference (Stockholm), 284–291.
36
RovanJ. B.WanderleyM. M.DubnovS.DepalleP. (1997). Instrumental gestural mapping strategies as expressivity determinants in computer music performance, in Proceedings of Kansei-The Technology of Emotion Workshop (Genova), 3–4.
37
SarasúaA.CaramiauxB.TanakaA. (2016). Machine learning of personal gesture variation in music Conducting, in Proceedings of the 2016 CHI Conference on Human Factors in Computing Systems - CHI '16 (New York, NY: ACM Press), 3428–3432.
38
SarasúaA.GuausE. (2014a). Beat tracking from conducting gestural data: a multi-subject study, in Proceedings of the 2014 International Workshop on Movement and Computing, MOCO '14, (New York, NY: ACM), 118–123. 10.1145/2617995.2618016
39
SarasúaA.GuausE. (2014b). Dynamics in music conducting: A computational comparative study among subjects, in Proceedings of the International Conference on New Interfaces for Musical Expression (London: Goldsmiths, University of London), 195–200.
40
SellJ.O'ConnorP. (2014). The xbox one system on a chip and kinect sensor. IEEE Micro34, 44–53. 10.1109/MM.2014.9
41
SkogstadS. A. V. D.NymoenK.HøvinM. E.HolmS.JenseniusA. R. (2013). Filtering motion capture data for real-time applications, in Proceedings of the International Conference on New Interfaces For Musical Expression (Daejeon), 196–197.
42
TohL. W.ChaoW.ChenY. S. (2013). An interactive conducting system using kinect, in 2013 IEEE International Conference on Multimedia and Expo (ICME) (San Jose, CA), 1–6. 10.1109/ICME.2013.6607481
43
UsaS.MochidaY. (1998). A conducting recognition system on the model of musicians' process. J. Acoust. Soc. Japan4, 275–287.
44
WesselD.WrightM. (2002). Problems and prospects for intimate musical control of computers. Comput. Mus. J.26, 11–22. 10.1162/014892602320582945
Summary
Keywords
HCI, digital music, motion-sound mapping, kinect, conducting, machine learning, digital musical instruments
Citation
Sarasúa Á, Urbano J and Gómez E (2019) Mapping by Observation: Building a User-Tailored Conducting System From Spontaneous Movements. Front. Digit. Humanit. 6:3. doi: 10.3389/fdigh.2019.00003
Received
31 January 2018
Accepted
05 February 2019
Published
25 February 2019
Volume
6 - 2019
Edited by
Mark Brian Sandler, Queen Mary University of London, United Kingdom
Reviewed by
Pierre Alexandre Tremblay, University of Huddersfield, United Kingdom; Nick Bryan-Kinns, Queen Mary University of London, United Kingdom
Updates
Copyright
© 2019 Sarasúa, Urbano and Gómez.
This is an open-access article distributed under the terms of the Creative Commons Attribution License (CC BY). The use, distribution or reproduction in other forums is permitted, provided the original author(s) and the copyright owner(s) are credited and that the original publication in this journal is cited, in accordance with accepted academic practice. No use, distribution or reproduction is permitted which does not comply with these terms.
*Correspondence: Álvaro Sarasúa alvaro.sarasua@upf.edu
†Present Address: Emilia Gómez, Joint Research Centre, European Commission, Sevilla, Spain
This article was submitted to Digital Musicology, a section of the journal Frontiers in Digital Humanities
Disclaimer
All claims expressed in this article are solely those of the authors and do not necessarily represent those of their affiliated organizations, or those of the publisher, the editors and the reviewers. Any product that may be evaluated in this article or claim that may be made by its manufacturer is not guaranteed or endorsed by the publisher.