 Luís M. A. Bettencourt1,2,3*
 José Lobo4,5*
- 1Mansueto Institute for Urban Innovation, University of Chicago, Chicago, IL, United States
- 2Department of Ecology & Evolution, Department of Sociology, University of Chicago, Chicago, IL, United States
- 3Santa Fe Institute, Santa Fe, NM, United States
- 4School of Sustainability, Arizona State University, Tempe, AZ, United States
- 5ASU–Santa Fe Institute Center for Biosocial Complex Systems, Arizona State University, Tempe, AZ, United States
Comparative studies of cities throughout history are one of the greatest sources of insight into the nature of change in human societies. This paper discusses strategies to anchor these comparisons on well-defined, quantitative and empirical characteristics of cities, derived from theory and observable in the archeological and historical records. We show how quantitative comparisons based on a few simple variables across settlements allow us to analyze how different places and peoples dealt with general problems of any society. These include demographic change, the organization of built spaces, the intensity and size of socioeconomic networks and the processes underlying technological change and economic growth. Because the historical record contains a much more varied and more independent set of experiences than contemporary urbanization, it has a unique power for illuminating present puzzles of human development and testing emergent urban theory.
Introduction
Cities have always held a special fascination to any scholar of human societies. Coincident with the advent of the first cities, we observe the appearance of many technologies and adaptations that, in different forms, are still with us today (Adams, 2005). Thus, the experience of living in cities (Wirth, 1938; Lees, 2015) provides a general conducting line throughout history, connecting common phenomena across different societies and thus also identifying features that are truly contextual.
Performing comparative analyses of different societies is always an exercise fraught with challenges. There is the empirical challenge of identifying cultural, social, political and economic traits, which can be measured in very different settings. But there is another difficulty when doing comparative analysis which habitually goes unnoticed. The identification of common traits is often conditioned on performance measures, such as rates of economic growth or energy use per capita, which convey a sense of what today we find important (Mcfarlane, 2010). Assessing the nature, and even the quality, of ancient societies can easily be biased by using the socioeconomic experience of today's high-income nations and their recent history. Is evidence for improvements in diet or material conditions in ancient societies to be disregarded because these same societies did not experience high (by today's standards) output growth rates? Such a stance crudely disregards many of the extraordinary adaptations and inventions—social, cultural, and technological—of earlier societies. Alternatively, conditioning on environmental stewardship and sustainability leads to the opposite conclusion, ranking smaller scale societies that had less impact on their immediate natural environments as having higher quality than most recent societies.
There is however an alternative to such approaches, which starts with much more basic but also more pervasive features of any settled human society (Bettencourt, 2013; Ortman et al., 2014). A number of recent new ideas, supported by extensive empirical analyses, point to certain quantitative comparisons of basic general quantities that may shed light on a number of key puzzles about the organization, sociality and capacity for adaptation of past urban societies (Bettencourt et al., 2007; Fletcher, 2011; Bettencourt, 2013; Ortman et al., 2014, 2015, 2016; Cesaretti et al., 2016; Hanson and Ortman, 2017; Ortman and Coffey, 2017). Such puzzles include the relative size, structure and flows between settlements in the same polity, the nature of socioeconomic networks in cities, the spatial organization of settlements, and the nature of change and adaptation in these systems, including processes of economic growth (Economic growth is here understood to be simply an increase, from one period to the next, in a society's material output). What is most important to capture through such comparisons, in our view, is how different societies deal with general problems affecting them all, including energy and resource extraction, and the organization of their socioeconomic networks over space and time (Bettencourt, 2013; Morris, 2013; Ortman et al., 2014).
As we look back at history from a modern perspective, shaped by an urban planet with large human population and fast economic growth and technological change, these puzzles become especially poignant: Are pre-industrial societies fundamentally different in the way people lived and interacted? Or are these differences primarily connected to issues of scope, scale and technology? Can we identify, clearly and empirically, lines of continuity and divergence in the structure and dynamics of urbanizing societies?
These puzzles cannot be answered simply by using the present as the baseline for comparison: what is needed is a framework that makes comparison between the experiences of the past and life in the present conceptually coherent and empirically consistent (Bettencourt, 2013; Ortman et al., 2014). Here, we explore three strategies for quantitative analysis of settlements throughout history. We discuss how these are undertaken methodologically and their promise for generating a more integrated understanding of our social history as well as an appreciation of each society in its own context. A comparison of the past and the present that is based on fundamental processes and features makes it intelligible to use the past and present to discern what the future might be like.
Results
Because we are asking for quantitative ways to perform comparative analysis of cities in history we need to obtain data that are consistent across places and times. This remains a challenge, not only because empirical evidence in the archeological record is sparse and mostly associated with durable materials, but also because methods and definitions have naturally varied between many different communities, each dedicated to different periods, using different methods of analysis, etc (Kintigh et al., 2014).
Thus, to go forward and attempt any reasonable synthesis, simplicity and clarity are paramount. Simple quantities such as the area of a settlement, its putative population count (based on independent measures, such as room counts or amounts of debris), and perhaps other basic quantities related to public spaces or monument construction are usually available through the material record, and have now been measured in several instances (Bettencourt, 2013; Ortman et al., 2014, 2015, 2016; Ortman and Coffey, 2017). The analytical advantage of these quantities is that they are reasonably objective and salient features of any human settlement, while leaving plenty of room for varying cultural, political, and economic features of different societies (Mcfarlane, 2010; Lees, 2015).
For simplicity then, we ask below what we can be inferred from fairly sparse data records, where only a few variables (one, two,…) are available for each site. This approach also allows us to connect to well-known traditions in history, demography and geography (Fujita, 1990; Bairoch, 1991; Zipf, 2012; Morris, 2013; Ober, 2016), before we attempt to take longer steps toward the end of the paper.
One Variable: Demography and the City-Size Distribution
Perhaps the most established way to characterize an urban system quantitatively is by analyzing the statistics of settlement sizes, or equivalently testing the “rank-size” rule (Henderson, 1974; Fujita, 1990; Bairoch, 1991; Zipf, 2012). This is the simplest of all tests of any quantitative expectation for cities. It requires data on only a single variable, such as the population of each settlement. For this reason, studies constructing the settlement size distribution for many societies are numerous and have been undertaken for decades (Bairoch, 1991; Gabaix, 1999; Zipf, 2012; Swerts and Pumain, 2013). In many archeological applications, population is replaced by more directly observable proxies, such as the settlement's area.
The simplest expectation for the rank-size rule (also known as Zipf's law Krugman, 1996; Zipf, 2012 states that, when cities are rank-ordered from largest (rank = 1) to smallest (rank = number of cities in the system), the size of each city is simply inversely proportional to its rank:
where sizemax is the size of the largest city and z is an exponent. The standard rank-size rule applies for z = 1. This is equivalent to the probability distribution of city sizes taking the form
where P0 is a normalizing constant, so that the probability integrates to unity.
Much has been made of the shape of the city size distribution and its meaning. The common exercise deals with the estimation of the rank-size exponent, z, and observing its deviations away from unity. The existence of a distribution of city sizes has been attributed to the (neutral) trade-offs between the benefits and disadvantages accruing from populations agglomerating (Henderson, 1974), between economies of scale and costs of movement (Fujita, 1990), and a stochastic “preferential attachment” growth process (Simon, 1955). Others have shown that, in some circumstances, Zipf's law is not a good description of data at all, and distributions in the lognormal family, in particular, may fit the data better (Eeckhout, 2004).
This kind of problem is clearly visible in Figure 1, and is discussed below.
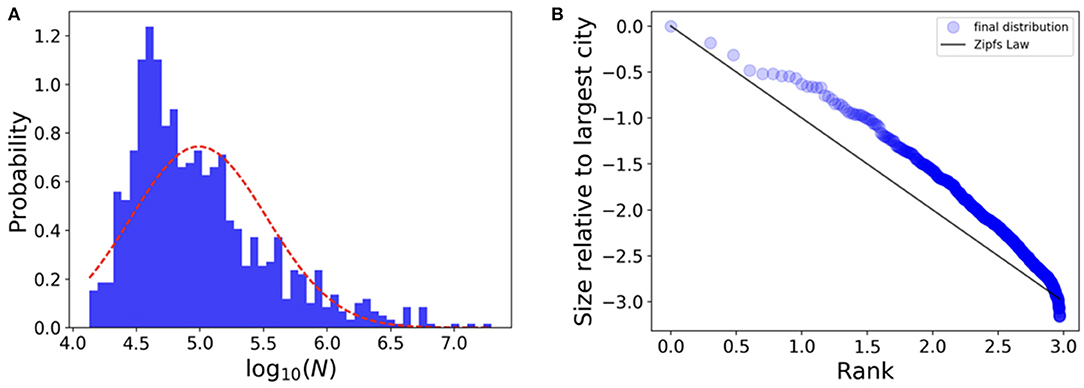
Figure 1. The city size distribution of Metropolitan Areas in the USA in 2010. (A) Histogram of city sizes (red dashed line is lognormal distribution fit); (B) Rank-size rule [black line is Equation (1)]. We see that in the USA the rank size rule approximately describes the relative distribution of large cities but fails to account for an overabundance and then deficit of progressively smaller towns. Data is available online at the US Census Bureau, Website: https://www.census.gov/programs-surveys/metro-micro/data.html.
Often patterns of settlement size are called primate if a single city is much larger than all the others and larger than what the rank size rule would predict. This has often been taken to signal political and economic centralization, in some cases beyond the territory of the settlement system, as in the case of empires (Savage, 1997). Primate (or macrocephalous) settlement systems of this kind seem to apply to many cases in history, from the Aztecs to contemporary France or England (Ortman et al., 2014; Bettencourt and Lobo, 2016). Likewise, in many other situations there are several large cities of roughly about the same size [perhaps the Maya, contemporary Spain, Italy, or even Germany (Bettencourt and Lobo, 2016)]. This is sometimes interpreted as a sign of a not fully integrated political or economic system across settlements, with several large cities competing for the “highest” functions associated with the urban hierarchy, such as the central place of government or the dominant (financial) market (Harris and Ullman, 1945).
Another pattern is a deficit of small settlements relative to what the rank-size rule would predict. This is a common occurrence for most contemporary, highly urbanized settlement systems. To appreciate this consider that, for a system with a largest city of a million [like Rome under Hanson and Ortman (2017)], the rank size rule predicts 10,000 towns of 100 people and 1,000,000 with one person.
For contemporary systems, with the largest cities in the region of 20–30 million, this would predict way too many small settlements, which are demonstrably not there. This means in practice that the rank-size rule cannot apply across the entire set of settlement sizes, especially for very small ones. For intermediate settlement sizes, some quantitative geographers would attribute this deficit to issues related to the definition of small settlements, many of which they would separate from the orbit of larger places. Varying spatial definitions of cities, usually through different criteria of spatial clustering, can indeed obtain more “Zipfian” city size distributions. This in turn raises issues for of settlement definition, especially for large cities, which are often surrounded by many commuting towns, giving rise to integrated labor markets known in modern settings as metropolitan areas (OECD, 2012).
Despite these interesting interpretations, there seems to be no strong connection between the relative size of settlements in an urban system and its overall performance, for example in terms of rates of economic or demographic change (Berry, 1961).
The sure lesson that can be derived from the observation of the relative sizes of settlements is very simple.
Mechanically, the size of each city measures simply the integrated growth (including periods of decline) over its history, which is essentially a measure of its demographic average growth rate over a long period of time. The simplest rank-size rule states, from this perspective, that all settlements grow at the same rate (Gabaix, 1999) (if they were created at the same time), another approximate statistical regularity known as Gibrat's law. Note that this does not have to mean that demographic growth rates are the same for all cities at all time, but simply that over a long period of time these rates converge to the same number, presumably as the result of balances between births, deaths and migration between these towns and cities.
Thus, by comparing the relative size of different settlements, historians and archeologists should be asking whether these were part of the same “demographic” system, connected by mutual migration flows and other networks of exchange and trade. If so, observing something close to the settlement size distribution predicted by the rank-size rule would imply the same average population growth rates for all places, big and small. Then, for example, if mortality rates were higher in larger cities, this would imply a correspondingly larger rate of immigration from smaller places to larger cities (Dyson, 2011; Bocquier and Costa, 2015).
If it is possible to measure the size distribution of the same settlements at two or more times, then we can moreover compare their relative growth rates during the intervening periods, giving us an empirical basis to rank their relative (demographic) success.
Some additional issues are worth flagging here. For human settlements, spatial areas are not typically proportional to population sizes. How physical space is used socially can be modulated by cultural and physical infrastructure, as well as by technology (Wirth, 1938; Adams, 2005; Bettencourt, 2013). Furthermore, areas can also be measured in different ways, as the surface within the convex hull of the settlement's putative boundaries A, or as the actual built up area of buildings, streets and other structures, An. We discuss these issues next.
Two Variables: Settlement Scaling, Density, and Agglomeration
What was life like in the ancient city of Ur? Or in the great city of Teotihuacan? We will never really know 150 for sure, of course. One of the main objectives of archeological and historical research is to reconstruct 151 what social and economic life might have been like from fragmentary information, much of it about the 152 built environment. This is a very difficult type of inference that requires a testable theory of how properties 153 of social and economic life relate to variations in specific characteristics of the built environment.
Settlement scaling theory attempts to do precisely this (Ortman et al., 2014, 2015, 2016; Ortman and Coffey, 2017). Developed originally to explain urban scaling properties in contemporary cities (Bettencourt et al., 2007; Bettencourt, 2013; Ortman et al., 2014), its ingredients are very general leading to the exciting prospect of the application of its core ideas to settlements in history. The empirical observations on which it is based, as well as its core models, indicate that several basic social economic and infrastructural properties of settlements are interrelated, and can thus be predicted on the basis of comparative analyses of their built environment and estimates of their population size. Empirically, scaling analysis is also very simple, requiring only pairs of variables for each settlement, and the analysis of a familiar xy plot (Figure 2).
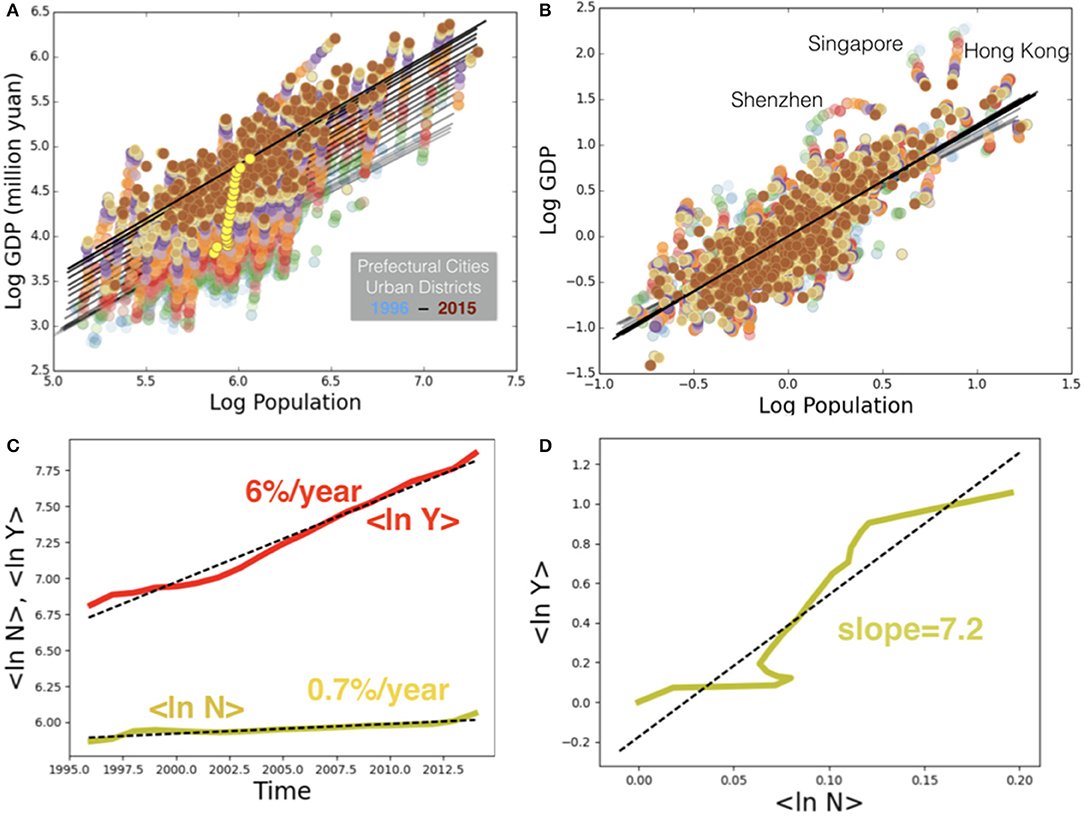
Figure 2. Economic and demographic growth in modern cities, such as those of China (shown) is a property of the urban system. (A) Shows about 20 years of data for Chinese Prefectural cities (colored dots), and the scaling of GDP with population size (solid line shows the scaling relation). (B) Shows the same scaling after system wide growth (yellows squares) is subtracted. This growth is shown in (C) for both GDP (red) and Population (yellow) and versus each other on (D). Data are from Chinese City Statistical Yearbooks compiled by the Chinese National Bureau of Statistics (see Zünd and Bettencourt, 2019). The same data is compiled and translated in English and made available online at https://www.china-data-online.com/member/city/ (requires subscription).
If we have two variables for each settlement we can ask for example, how does their built-up area depend on their population size: all we have to do is plot one quantity against the other. The answer tends to be non-linear, but well-described by scale invariant functions (power-laws), such as
This can be made linear by a simple transformation to logarithmic variables, or a loglog xy plot (Figure 2).
Theoretical considerations derive the values for the prefactor α(t) and the exponent for area as 2/3 α 5/6, depending on the type of settlement and how area is measured (Bettencourt, 2013; Ortman et al., 2014). These expectations are confirmed by empirical analysis of many settlement systems, including in the pre-Columbian Basin of Mexico (Ortman et al., 2015, 2016), classical Rome (Hanson and Ortman, 2017), Medieval Europe (Cesaretti et al., 2016), and of course contemporary urban areas (Bettencourt et al., 2007; Bettencourt, 2013).
The same theoretical framework predicts scaling relations and exponent numerical values for many other quantities (see e.g., Figure 2), including the number of socioeconomic interactions in a settlement, its division of labor, its rate of socioeconomic production and many detailed characteristics of the built environment, such as street length and width and associated transportation costs (Bettencourt, 2013).
In this way, a very straightforward two-variable scaling analysis can reveal commonalities of settlements as socioeconomic networks self-consistently embedded in built spaces. An expansion of this type of analysis to other settlement systems promises to reveal common quantitative patterns of basic settlement organization and socioeconomic capacity in societies through space and time.
It is also from the perspective provided by these observations and associated theoretical frameworks that we may appreciate any exceptions. For example, an interesting set of questions has been raised by Fletcher about “low density urbanism” (Fletcher, 2011), specifically in the context of Mayan settlements and Angkor Wat, which appear to show an expansion of their area with population with an exponent, α > 1. Therefore, such settlements would become less dense the larger they are, not realizing agglomeration effects typical of other cities. A similar, but perhaps more expected pattern also applies to mobile hunter-gatherer camps, but with greater variability. These patterns also vary in time in specific ways, to which we now turn.
Technological and Economic Change
In modern societies, cities have been a necessary condition for economic growth (Jones and Romer, 2009).
We say necessary because the existence and expansion of cities is not always sufficient for income growth at the national level: there are many episodes, some shorter and some longer, of urbanizing societies experiencing no (economic) growth (Inoue et al., 2015). Nevertheless, the association between higher levels of urbanization and larger GDP per capita is one of the strongest empirical results in studies of economic change and international development.
Much work has been done to try to elucidate this connection and better understand the mechanisms of technological change and economic growth generated by urban environments (Lucas, 1988; Jones and Romer, 2009). However, if the judgment of success is predicated on creating quantitatively precise growth rates, it remains fair to say that the problem is not yet well-understood.
Many studies in economic history have also shed light on the circumstances that led to sustained economic growth after the industrial revolution, calling our attention to macroeconomic factors such as the availability of energy on a large scale, political and economic institutions, and the advent of modern science (Morris, 2013). The study of socieconomic development in the past has also highlighted the role of urbanization (Algaze, 2008; Cowgill, 2015; Ober, 2016; Harper, 2017; Manning, 2018) as have historical experiences of urbanization without growth (Jedwab and Vollrath, 2015). As useful as detailed case studies and historical examinations are, comparative analyses have been hampered partly because of a perceived lack of common empirical evidence within regions and across eras and geographies.
There are, however, a set of facts that may be useful for framing the study of urbanization's role across time: i) sustained economic growth is a system's level property (see Figure 2 for China); ii) growth volatility reduces rates of economic growth; iii) very small rates of systemic economic growth are not perceptible over a human lifetime; and iv) the accumulation of material wealth resulting from low-levels of growth are vulnerable to exogenous shocks (such as disease or changes in climate). As a consequence, growth can go unnoticed and remain accidental. This is not to say that people were not keenly aware of times of prosperity or famine, resulting from conquest or good harvests, it simply means that the concept of long-run intensive economic growth would have been very hard to perceive and nurture in pre-industrial societies.
The first point may not be obvious as we often think of rich and poor settlements, even within the same nation or polity. It is, however, generally true that the type of sustained and fast economic growth observed in modern settlement systems is a system level property (so that information, ideas, resources and individuals can flow among settlements), with all cities experiencing about the same annual rate of growth over long periods of time (see Figure 2).
The happy consequence of this observation is that studying systemic economic growth in history may require only a number of point assessments, which should agree in magnitude whether they were measured in small towns or larger cities. This also means that golden ages often associated with large cities, such as classical Athens or Rome, whether triggered by a technological innovation or by conquest and theft, may not be sustainable unless they induce economic growth across their settlement systems (Ober, 2016). This means, for example, that we should see the living experience of primary producers living in small settlements change so as to enjoy some of the products of large cities and vice-versa in a virtuous cycle of exchange and common development. We know of course that prior to the industrial revolution such periods, if they existed at all, were not associated with large growth rates, and were typically localized in space and time.
The second and third properties of economic growth follow from its character as a stochastic (fluctuating) process. This is a very general feature of collective dynamics of growth, from population biology to financial markets (Bettencourt, 2018). Without going into detailed models for those contexts, quantities such as the resources available to a society ('wealth') are expected to grow approximately as
where η, ϵ are the average growth rate (an approximate constant in time, say 1% a year) and the corresponding stochastic variations, respectively.
Writing the variance of ε as σ2 (also known as the square volatility) allows us to integrate the equation in time to give
where ξ(t) is an approximately normal variable with zero mean and unit variance. The actual growth rate that results is the geometric mean (not the arithmetic mean!) of growth rates, as is well-known in population biology. This is reduced from the average growth rate by a term proportional to the square volatility, σ2, that is half the variance of the growth rate, due to its fluctuations over time. Thus, high variability can render any small growth rate zero or even negative (see Figure 3). This means that innovations to reduce instability in the economy are, in the beginning, almost as important as having a positive growth rate in the first place.

Figure 3. Production and volatility measured by lead emissions [measured in Greenland ice cores, McConnell et al. (2018), data available online at https://www.pnas.org/content/suppl/2018/05/09/1721818115.DCSupplemental]. (A) Shows estimated emissions over a long historical period. (B) Shows the corresponding growth rate in emissions (orange is a running average). Red vertical lines delimit the period between 150BC and 150AD, associated with a rise of the Roman Empire (Delile et al., 2014). For this period the effective growth rate is very small due to high volatility. The annual average growth rate is about η ≃ 0.17%.
With all that said, the final argument we wish to emphasize here is that the growth rate for any preindustrial economy over any extended time period (say decades) was likely very small. Figure 3, based on lead emissions, suggests a value of about 0.17%, certainly lower than 0.3% a year. This translates at the most into a doubling time for the economy of 240 years. This time scale is too long to be felt by anyone—on average at least—in their own lifetimes. Thus, even if slow economic growth was present in preindustrial societies, it was likely too slow for its society to become conscious of it and take measures that could sustain it. The perception would then be one of effectively zero growth, where any positive period would be quickly reversed by fluctuations.
Even if the change in material output of societies in the past had been exponential in nature, the accumulation of wealth could have been greatly set back by disease, climate change or war. And even if the underlying social processes by which agglomerated populations learn, innovate, and become more productive are the same across eras, societies abilities to deal with the plague or sharp reduction in rainfall are importantly determined by science and technology.
In conclusion, processes of human development and economic growth recognizable to us today were probably at play throughout history, and certainly in most urban societies. However, even in the best of times such rates of change may have been too local, too volatile and too short-lived to be acted upon and sustained, intentionally, over the long term. The search for some of the tell-tale signs of these episodes, especially in the systemic change in living conditions across settlement sizes may give us precious new insights into the actual time dependent variability of these effects, and on the human experience in cities during long periods of very slow growth and even decay.
Discussion
The history of cities presents us with a bewildering variety of social, economic, political and cultural ways in which human settlements can exist. Making sense of this variation, while at the same time extracting what may be essential across time and space, is a necessary goal not only for a “science of cities” but for a science of human sociality. We have shown how an approach to comparative analysis based on common but determinant variables for human settlements—including population, area and measures of the built environment- has the power to support an analytical narrative relating the earliest settlements in history to contemporary cities and presumably their future forms.
The ambition to develop a theoretical and empirical basis for the study of human settlements through history may invoke in the reader common criticisms of any cross-cultural comparative analysis, specifically that some societies will be judged to be better or worse, and that contemporary high-income societies along with their economic and political systems will be used as standards for evaluation. None of this follows from the strategy proposed here, except the fairly mechanical features that some societies are larger than others—in both their creative and destructive capacity—and so must possess knowledge of, and access to, different types of resources, in ways that are sometimes sustainable and sometimes exploitative. Only by learning formally about this variation can we come to appreciate the range of the human experience in cities.
The approach proposed here then simply connects social and cultural life to some of its most basic material underpinnings, common to all societies in all places. This includes the fact that people exist in space and that their interactions must be structured over space and time in ways that must be compatible with their collective socioeconomic capacity. Evidence from historical and archeological sources have the singular potential to illuminate these issues in ways that contemporary evidence cannot.
Data Availability Statement
Publicly available datasets were analyzed in this study. This data can be found here: https://www.dropbox.com/sh/xuuuy0oedvfekbp/AADhWggmVuiMOU2txx-Kc2aNa?dl=0.
Author Contributions
LB has conceptualized the study and analyzed the data. LB and JL wrote the manuscript.
Funding
This work is partially supported by OPEN-AIRE funding linked to the Marie Curie Project Past-people-nets 628818, conducted by Francesca Fulminante (2014–2016). Publication of this research has been supported by a grant from the James S. McDonnell Foundation (#220020438).
Conflict of Interest
The authors declare that the research was conducted in the absence of any commercial or financial relationships that could be construed as a potential conflict of interest.
Acknowledgments
We are thankful to the speakers and participants of two workshops, Urbanization without Growth in the Ancient World? (at the British Academy in Rome, July 2017) and at the Roman Archeology Conference (RAC/TRAC) 2018, where some of the material presented here was originally developed.
References
Adams, R. M. (2005). The Evolution of Urban Society: Early Mesopotamia and Prehispanic Mexico. New Brunswick: AldineTransaction.
Algaze, G. (2008). Ancient Mesopotamia at the Dawn of Civilization: The Evolution of an Urban Landscape. Chicago: University of Chicago Press.
Bairoch, P. (1991). Cities and Economic Development: From the Dawn of History to the Present. Chicago: University of Chicago Press.
Berry, B. J. L. (1961). City size distributions and economic development. Econ. Dev. Cult. Change 9, 573–588. doi: 10.1086/449923
Bettencourt, L. M. A. (2013). The origins of scaling in cities. Science 340, 1438–1441. doi: 10.1126/science.1235823
Bettencourt, L. M. A., and Lobo, J. (2016). Urban scaling in Europe. J. R. Soc. Interface 13:20160005. doi: 10.1098/rsif.2016.0005
Bettencourt, L. M. A., Lobo, J., Helbing, D., Kühnert, C., and West, G. B. (2007). Growth, innovation, scaling, and the pace of life in cities. Proc. Natl. Acad. Sci. U.S.A. 104, 7301–7306. doi: 10.1073/pnas.0610172104
Bocquier, P., and Costa, R. (2015). Which transition comes first? Urban and demographic transitions in Belgium and Sweden. Demogr. Res. 33, 1297–1332. doi: 10.4054/DemRes.2015.33.48
Cesaretti, R., Lobo, J., Bettencourt, L. M. A., Ortman, S. G., and Smith, M. E. (2016). Population-area relationship for medieval European cities. PLoS ONE 11:e0162678. doi: 10.1371/journal.pone.0162678
Cowgill, G. L. (2015). Ancient Teotihuacan: Early Urbanism in Central Mexico. New York, NY: Cambidge University Press.
Delile, H., Blichert-Toft, J., Goiran, J. P., Keay, S., and Albarede, F. (2014). Lead in ancient Rome's city waters. Proc. Natl. Acad. Sci. U.S.A. 111, 6594–6599. doi: 10.1073/pnas.1400097111
Dyson, T. (2011). The role of the demographic transition in the process of urbanization. Populat. Dev. Rev. 37, 34–54. doi: 10.1111/j.1728-4457.2011.00377.x
Eeckhout, J. (2004). Gibrat's law for (all) cities. Am. Econ. Rev. 94, 1429–1451. doi: 10.1257/0002828043052303
Fujita, M. (1990). Urban Economic Theory: Land Use and City Size. Cambridge: Cambridge University Press.
Gabaix, X. (1999). Zipf's law for cities: an explanation. Q. J. Econ. 114, 739–767. doi: 10.1162/003355399556133
Hanson, J. W., and Ortman, S. G. (2017). A systematic method for estimating the populations of Greek and Roman settlements. J. Roman Archaeol. 30, 301–324. doi: 10.1017/S1047759400074134
Harper, K. (2017). The Fate of Rome: Climate, Disease & the End of an Empire. Princeton, NJ: Princeton University Press.
Harris, C. D., and Ullman, E. L. (1945). The nature of cities. Ann. Am. Acad. Polit. Soc. Sci. 242, 7–17. doi: 10.1177/000271624524200103
Henderson, J. V. (1974). The sizes and types of cities. Am. Econ. Rev. 64, 640–656. doi: 10.2105/AJPH.64.7.656
Inoue, H., Álvarez, A., Anderson, E. N., Owen, A., Álvarez, R., Lawrence, K., et al. (2015). Urban scale shifts since the bronze age: upsweeps, collapses, and semiperipheral development. Soc. Sci. Hist. 39, 175–200. doi: 10.1017/ssh.2015.50
Jedwab, R., and Vollrath, D. (2015). Urbanization without growth in historical perspective. Explorat. Econ. Hist. 58, 1–21. doi: 10.1016/j.eeh.2015.09.002
Jones, C., and Romer, P. (2009). The New Kaldor Facts: Ideas, Institutions, Population, and Human Capital.
Kintigh, K. W., Altschul, J. H., Beaudry, M. C., Drennan, R. D., Kinzig, A. P., Kohler, T. A., et al. (2014). Grand challenges for archaeology. Proc. Natl. Acad. Sci. U.S.A. 111, 879–880. doi: 10.1073/pnas.1324000111
Krugman, P. (1996). Confronting the mystery of urban hierarchy. J. Jpn. Int. Econ. 10, 399–418. doi: 10.1006/jjie.1996.0023
Lees, A. (2015). “The city: a world history,” in The City: A World History (New York, NY: Oxford University Press).
Lucas, R. E. (1988). On the mechanics of economic development. J. Monet. Econ. 22, 3–42. doi: 10.1016/0304-3932(88)90168-7
Manning, J. G. (2018). The Open Sea: The Economic Life of the Ancient Mediterranean World from the Iron Age to the Rise of Rome. Princeton, NJ: Princeton University Press.
McConnell, J. R., Wilson, A. I., Stohl, A., Arienzo, M. M., Chellman, N. J., Eckhardt, S., et al. (2018). Lead pollution recorded in greenland ice indicates european emissions tracked plagues, wars, and imperial expansion during antiquity. Proc. Natl. Acad. Sci. U.S.A. 115, 5726–31. doi: 10.1073/pnas.1721818115
Mcfarlane, C. (2010). The comparative city: knowledge, learning, urbanism: the comparative city: knowledge, learning, urbanism. Int. J. Urban Region. Res. 34, 725–742. doi: 10.1111/j.1468-2427.2010.00917.x
Morris, I. (2013). The Measure of Civilization: How Social Development Decides the Fate of Nations. Princeton, NJ: Princeton University Press.
Ortman, S. G., Cabaniss, A. H. F., Sturm, J. O., and Bettencourt, L. M. A. (2014). The pre-history of urban scaling. PLoS ONE 9:e87902. doi: 10.1371/journal.pone.0087902
Ortman, S. G., Cabaniss, A. H. F., Sturm, J. O., and Bettencourt, L. M. A. (2015). Settlement scaling and increasing returns in an ancient society. Sci. Adv. 1:e1400066. doi: 10.1126/sciadv.1400066
Ortman, S. G., and Coffey, G. D. (2017). Settlement scaling in middle-range societies. Am. Antiquity 82, 662–682. doi: 10.1017/aaq.2017.42
Ortman, S. G., Davis, K. E., Lobo, J., Smith, M. E., Bettencourt, L. M., and Trumbo, A. (2016). Settlement scaling and economic change in the Central Andes. J. Archaeol. Sci. 73, 94–106. doi: 10.1016/j.jas.2016.07.012
Savage, S. H. (1997). Assessing departures from log-normality in the rank-size rule. J. Archaeol. Sci. 24, 233–244. doi: 10.1006/jasc.1996.0106
Simon, H. A. (1955). On a class of skew distribution functions. Biometrika 42, 425–440. doi: 10.1093/biomet/42.3-4.425
Swerts, E., and Pumain, D. (2013). A statistical approach to territorial cohesion: the Indian city system. L'Espace Géogr. 42, 75–90. doi: 10.3917/eg.421.0077
Zipf, G. K. (2012). Human Behavior and the Principle of Least Effort: An Introduction to Human Ecology. Mansfield Centre, CT: Martino Pub.
Keywords: urbanization, scaling, zip's law, economic growth, data
Citation: Bettencourt LMA and Lobo J (2019) Quantitative Methods for the Comparative Analysis of Cities in History. Front. Digit. Humanit. 6:17. doi: 10.3389/fdigh.2019.00017
Received: 16 January 2019; Accepted: 16 October 2019;
Published: 01 November 2019.
Edited by:
Juan A. Barcelo, Autonomous University of Barcelona, SpainReviewed by:
Alicia García-Holgado, University of Salamanca, SpainChris Chase-Dunn, University of California, Riverside, United States
Copyright © 2019 Bettencourt and Lobo. This is an open-access article distributed under the terms of the Creative Commons Attribution License (CC BY). The use, distribution or reproduction in other forums is permitted, provided the original author(s) and the copyright owner(s) are credited and that the original publication in this journal is cited, in accordance with accepted academic practice. No use, distribution or reproduction is permitted which does not comply with these terms.
*Correspondence: Luís M. A. Bettencourt, YmV0dGVuY291cnRAdWNoaWNhZ28uZWR1; José Lobo, am9zZS5sb2JvQGFzdS5lZHU=