 Jenny Nissel
 Jacqueline D. Woolley
- 1Wheelock College of Education and Human Development, Boston University, Boston, MA, United States
- 2Department of Psychology, The University of Texas at Austin, Austin, TX, United States
Pseudoscientific beliefs, including vaccine-related and other types of conspiracy theories, are often formed through reliance on personal anecdotes shared by people with similar belief sets. In the present study, we explore one aspect of pseudoscientific versus scientific reasoning by studying the development of the use of anecdotal versus statistical evidence. To do so, we asked 7 and 10-year-olds and adults to help an agent solve a problem by choosing one of two potential solutions, one supported by an anecdote and one by a graph. Results revealed significant age differences, with older participants more likely to value the graphical over the anecdotal evidence. Participants who chose the anecdotal solution frequently justified their choices by referring to either an inferred causal relationship between the chosen solution and the outcome or to the characteristics of the person who provided the anecdote. Participants who chose the graphical solution frequently referred to quantity. Our findings suggest that both a greater valuation of statistical information and an increased ability to reflect critically about causal relationships may be critical in resisting the persuasive power of anecdotes, and hence, in making valid evidence-based decisions.
1 Introduction
Although one might have anticipated the arrival of the COVID-19 vaccine in the United States to be heralded as a way out of the ravages of the pandemic, the response was tempered by a wave of distrust and doubt. Questioning of authority, bias, and denialism played a role, but an important role was also played by stories—in the form of anti-vaccine anecdotes revolving around spurious causal relations (e.g., the COVID-19 vaccine causes AIDS or enables government surveillance via an implanted microchip; Schäfer et al., 2022). Although the data show no support for the causal claims made in these anecdotes—and in fact, show a direct causal link between vaccines and reductions in viral contraction, severity, and deaths—30% of the U.S. population did not complete the initial series (Centers for Disease Control and Prevention, 2023).
The connection between vaccine skepticism and anecdotal evidence extends to the anti-vax movement more broadly. In a sample of 480 web pages, Moran et al. (2016) found that 30% used anecdotal evidence to support anti-vaccine claims. When disseminated through the internet, anecdotes like these can spread at rapid rates, often interfering with people’s ability to reason scientifically (Rodriguez et al., 2016). Moreover, some have suggested that the success of the anti-vax movement is due to it telling a better story than the science (Shelby and Ernst, 2013). The goal of the present study is to explore how children and adults use anecdotal evidence to draw conclusions about novel causal relations. This research is part of a larger body of work exploring the factors that contribute to the formation and development of beliefs in pseudoscience.
An important criterion that differentiates science from pseudoscience is the reliance of the former on data and the latter on anecdotal information (e.g., Lilienfeld et al., 2014; Lack and Rousseau, 2016). Research on the formation of pseudoscientific beliefs, including vaccine-related conspiracy theories, has found that these beliefs are often formed through reliance on personal anecdotes shared by people with similar belief sets (Browne et al., 2015; Lack and Rousseau, 2016; Browne, 2018; Hornsey et al., 2018). In some domains, anecdotes are considered better evidence than facts. Kubin et al. (2021) presented participants with vignettes in which people made statements about moral and political beliefs that were supported by either personal experience or facts. Statements supported by personal experience were less doubted, and the speakers who made them were perceived as being more rational.
Beliefs based on anecdotes are adopted even in the presence of scientific information that contradicts the anecdote. For example, people use anecdotes from a trusted source to guide personal medical decisions even when they contradict the advice of their doctor (e.g., Fagerlin et al., 2005; Browne, 2018; Pennycook and Rand, 2020). Research exploring why this happens shows that anecdotes are often given more weight than scientific data when anecdotal suppliers are seen as more reliable sources of information than experts (Browne, 2018). Moreover, the mere presence of anecdotal evidence has been shown to interfere with scientific reasoning and evidence-based decision-making (Michal et al., 2021), potentially diminishing the perceived strength of any contradictory scientific evidence.
Researchers have examined the effect of exposure to anecdotal and statistical evidence on adults’ attitudes, beliefs, and intentions, but findings have been mixed. Several reviews conclude that anecdotal evidence is more persuasive (i.e., more likely to lead to acceptance of a claim) than statistical evidence (see, e.g., Taylor and Thompson, 1982; O’Keefe, 1990). A meta-analysis of 19 experiments comparing the relative persuasiveness of statistical and anecdotal evidence found anecdotal evidence to be more persuasive in 13 studies, statistics to be more persuasive in 2, and both to be equally persuasive in 4 (Baesler and Burgoon, 1994). In contrast, two other meta-analyses concluded that statistics are more influential than anecdotes (Allen and Preiss, 1997; Hornikx, 2005). A more fine-grained meta-analysis conducted by Zebregs et al. (2015) suggested that the two types of evidence may affect beliefs, attitudes, and intentions differentially: although statistical evidence had a stronger influence on beliefs and attitudes than did anecdotal evidence, anecdotes had a stronger influence on people’s intentions. Taken together, this body of work is agnostic as to the relative persuasiveness of statistical and anecdotal evidence; however, it does provide clear evidence that adults often value anecdotes as sources of information.
Our aim in the present research is to explore one aspect of the development of scientific versus pseudoscientific reasoning by studying the use of statistical and anecdotal evidence to draw conclusions about novel causal relations. To operationalize statistical evidence, we used simple bar graphs for ecological validity, given that research (reviewed below) indicates that children between the ages of 7 and 10 are competent at extracting information from them. To investigate the use of anecdotal evidence, or the process by which people use personal stories told by others as support for making a decision or solving a problem (Kazoleas, 1993), we provided participants with short, personal accounts relaying an incident. Although research (reviewed below) indicates that young children have a basic understanding of graphs and are sophisticated consumers of various forms of verbal testimony, there is no research specifically exploring children’s use of anecdotes or their evaluation of statistical versus anecdotal evidence as competing sources of information.
Research on children’s understanding of statistics classifies interpreting the quantities represented in graphs like bar charts, dot plots, and pie charts as the earliest-emerging of three categories of children’s graphical understanding (the second involves comparing graphs, and the third using technology to create them; Franklin and Bargagliotti, 2020). Children as young as 7 demonstrate the ability to interpret graphs (Phillips, 1997), and even the ability to extract precise numerical information from bar graphs (Kaminski and Sloutsky, 2013). By age 8, children are also able to create bar graphs: English (2018) asked 8-year-old children to create visual representations of different colored counters randomly drawn from a bag and found that bar graphs and pie charts were commonly produced.
Research assessing children’s beliefs about stories can inform our expectations about children’s conceptions of anecdotes (essentially personal stories, Merriam-Webster, n.d.). Stories are one of the first ways people understand the world, and even very young children can extract real-world information from them about a range of physical, biological, and psychological topics (e.g., scientific facts, evolution, and mental states; Dyer et al., 2000; Ganea et al., 2011; Kelemen et al., 2014). Stories also transmit sociocultural information. For example, religious children tend to believe what they hear in religious stories, and this increases with age and religiosity (Woolley and Cox, 2007; Vaden and Woolley, 2011). Additionally, many stories are intended to teach moral lessons, and by the end of the preschool age period, children’s ability to transfer these lessons to the real world increases significantly provided they are presented with appropriate scaffolding (e.g., prompts to explain parts of the story; Walker and Lombrozo, 2017). Finally, children as young as 3 have been shown to transfer novel causal relationships learned in a realistic story context to the real world (Walker et al., 2015). That young children use stories to learn about a range of concepts suggests a potentially high level of receptivity to the information—and causal relations—contained in anecdotal reports.
At the same time, research suggests that children might resist using anecdotes as evidence. Young children are often skeptical about the reality and real-world relevance of information contained in storybooks. For example, Woolley and Cox (2007) found that preschool-aged children resisted considering events in realistic stories to (a) have taken place in real life and (b) have real-world relevance. Corriveau et al. (2015) reported similar findings. When stories are relayed to children without scaffolding (as in Walker and Lombrozo, 2017), children often have difficulty extracting moral and other social lessons from them (Mares and Acosta, 2008; Mares et al., 2022; cf. Rottman et al., 2020).
Research on young children’s trust in verbal testimony indicates that they are selective consumers of the testimony of other people by the age of 4 (Harris et al., 2018). Although much of this research focused on object names and functions, a growing body of work shows that young children do not simply believe everything that they are told but instead demonstrate skepticism about more complex claims such as the reality of novel entities and the distinction between appearance and reality (Woolley and Ghossaniy, 2013; Lane and Harris, 2014). Children’s evaluation of testimony also appears to become more sophisticated with age. For example, between the ages of 3 and 8, children develop distrust of second-hand versus first-hand reports of improbable events; (Fitneva, 2008; Matsui and Fitneva, 2009, Lane et al., 2018). Although none of these studies have included anecdotal evidence, together these findings suggest that children might resist using personal stories as evidence and might do so increasingly with age.
As we have seen from the research discussed here, children between the ages of 7 and 10 have the ability to extract information from graphs, evaluate complex testimonial claims, and learn causal relations from stories, although there is no research on the evaluation of anecdotes specifically. Thus, it is an open question as to how children will evaluate anecdotes and also how they might weigh graphical and anecdotal information when they provide contradictory information about a novel causal relation. Although 7-year-olds are capable of evaluating different sources of evidence for the same causal relation, this ability develops significantly between 7 and 10 years of age (Danovitch et al., 2021). Thus, even if younger children can extract relevant information from the evidence provided, they may still have difficulty weighing anecdotal against statistical information to draw a conclusion. However, this ability may undergo developmental changes between the ages of 7 and 10.
Thus, our primary goal was to explore age-related changes in how children weigh anecdotal and statistical evidence. We asked children aged 7 to 10 and undergraduates to help an agent solve a problem (i.e., achieve a desired outcome), after reviewing two potential solutions (i.e., ways to cause the desired outcome). One solution was supported by anecdotal evidence (a personal story) and the other was supported by statistical evidence (a bar graph). Participants chose between the two solutions and explained their decisions.
After assessing age-related changes in children’s weighting of anecdotal and statistical evidence, we planned to explore two individual difference factors. First, the preference for anecdotal information may be affected by an individual’s level of engagement with the material. We measured engagement in two parts: transportation and identification. Second, a preference for statistical information may be driven by an individual’s level of cognitive reflection.
An individual’s level of narrative transportation, or the degree to which one feels immersed in a story world, has been shown to be an important variable in research measuring the effects of experimental manipulations involving stories (Green and Brock, 2000). When reading a novel or watching a movie, we may feel drawn to or transported to other words other than our own. The extent to which one feels absorbed in a story or transported to a fictional world may affect the degree to which one’s beliefs are changed after engaging with the material (e.g., ibid). We expected that participants who were more transported into the worlds of the anecdotes would be more likely to use the information in them to make decisions.
We also expected that identification (i.e., experience-taking; Kaufman and Libby, 2012), would play a role in how participants used anecdotal information. The degree to which a listener identifies with the narrator or protagonist of a story has been found to affect the degree to which the reader experiences a belief change as a result of hearing that story. For example, middle schoolers who read a passage from Harry Potter about marginalized members of the wizarding community subsequently expressed less prejudice toward immigrant populations than those who read a control passage, but only when they identified with Harry Potter and disidentified with Voldemort (Vezzali et al., 2015). We expected that participants who identified more with the person relaying the anecdote, the anecdotist, would be more likely to rely on the information conveyed in the anecdote.
Finally, we also explored the potential role of cognitive reflection (Frederick, 2005; Young et al., 2018) in affecting how children and adults treat scientific versus anecdotal information. Cognitive reflection has been shown to predict both scientific and mathematical understanding in young children (Young and Shtulman, 2020), and similar cognitive processes in adults, including science understanding (Shtulman and McCallum, 2014), science acceptance (Gervais, 2015), and rejection of religious and paranormal concepts (Pennycook et al., 2015). Specifically, we expected that participants higher in cognitive reflection would be more likely to use statistical evidence to make decisions.
2 Materials and methods
2.1 Participants
Participants were 109 children and 65 adults recruited from a large city in the southwestern United States. The children were part of an online database of families; parents were contacted by phone or e-mail. The adults were undergraduate students at a large southwestern university; they completed the study for course credit. Of the 109 children, 57 were 7 years old (33 girls, M = 7.58, range = 7.08–8.50) and 52 were 10 years old (27 girls, M = 10.55, range = 10.0–11.33). In total, 5% identified as Asian (n = 5), 4% as Black or African American (n = 4), 70% as White (n = 76), 11% reported multiple races (n = 12), 6% indicated “other” (n = 6), and 5.5% did not report their race (n = 6). A total of 27% of the children identified as Hispanic or Latinx (n = 29). Of the 65 undergraduates (46 women, M = 18.81 years, range = 18.0–21.58), 26% identified as Asian (n = 17), 3.1% as Black or African American (n = 2), 60% as White (n = 39), 9.2% reported multiple races (n = 6), and 5% indicated “other” (n = 1). In total, 31% of the undergraduates identified as Hispanic or Latinx (n = 20). Our sample size was based on that used in similar studies of children’s evaluation of evidence and testimony (e.g., Lane et al., 2018; Danovitch et al., 2021; Woolley et al., 2021). Our goal was 50 participants per age group—our final sample is slightly above that. We typically recruit approximately 10 child participants beyond our stopping point due to the possibility of no-shows, parental interference, and technical difficulties; we over-recruit adults for the same reasons (save for parental interference).
2.2 Materials
People often seek out others’ advice—either face-to-face or via social media—for help with a problem, and the personal stories collected in these encounters often persuade people of a causal relationship between two events (e.g., vaccines cause autism). At the same time, people may also seek out data that may or may not support a similar causal relationship. To simulate this process, we constructed four vignettes, each featuring an agent who needed help overcoming an obstacle and achieving a goal by choosing one of two potential solutions. In each case, the efficacy of one solution was supported by anecdotal evidence (i.e., a personal story from a single individual, the anecdotist) and the efficacy of the other was supported by statistical evidence (i.e., a bar graph). Stories were chosen from four domains: medicinal healing, animal behavior, athletic performance, and academic performance. For each vignette, participants were introduced to an age- and gender-matched agent and shown a photograph. They then heard a description of the problem along with two proposed solutions—an anecdote endorsing one solution provided by age- and gender-matched anecdotist (e.g., their experience taking a medicine, Whexa, that cured their prognosia) and graphical information endorsing the other (e.g., a bar graph representing the success of Midox in curing prognosia).
2.2.1 Anecdote construction
Using Freytag’s pyramid of narrative structure (Dobson et al., 2011), we constructed four anecdotes spanning four domains, in which an anecdotist faced and overcame an obstacle. Each anecdote contained five component parts: exposition, rising action, climax, falling action, and resolution. In each story, the anecdotist relayed a personal experience in which one of the potential solutions was associated with the outcome desired by the agent. See Appendix A for agent introduction and anecdote texts.
2.2.2 Graph construction
Each graph showed the distribution of 11–15 people who experienced successful and unsuccessful outcomes with one of the solutions. One of four different statistically significant ratios of successful to unsuccessful outcomes (9:2; 10:2; 11:3; 12:3) was presented per vignette, and the ratio order was counterbalanced. To increase comprehensibility, children saw bars that were enhanced with discrete story-relevant focal objects representing each data point (e.g., for the athletic performance vignette, 9 sneakers: 2 sneakers). A sample graph is shown in Figure 1.
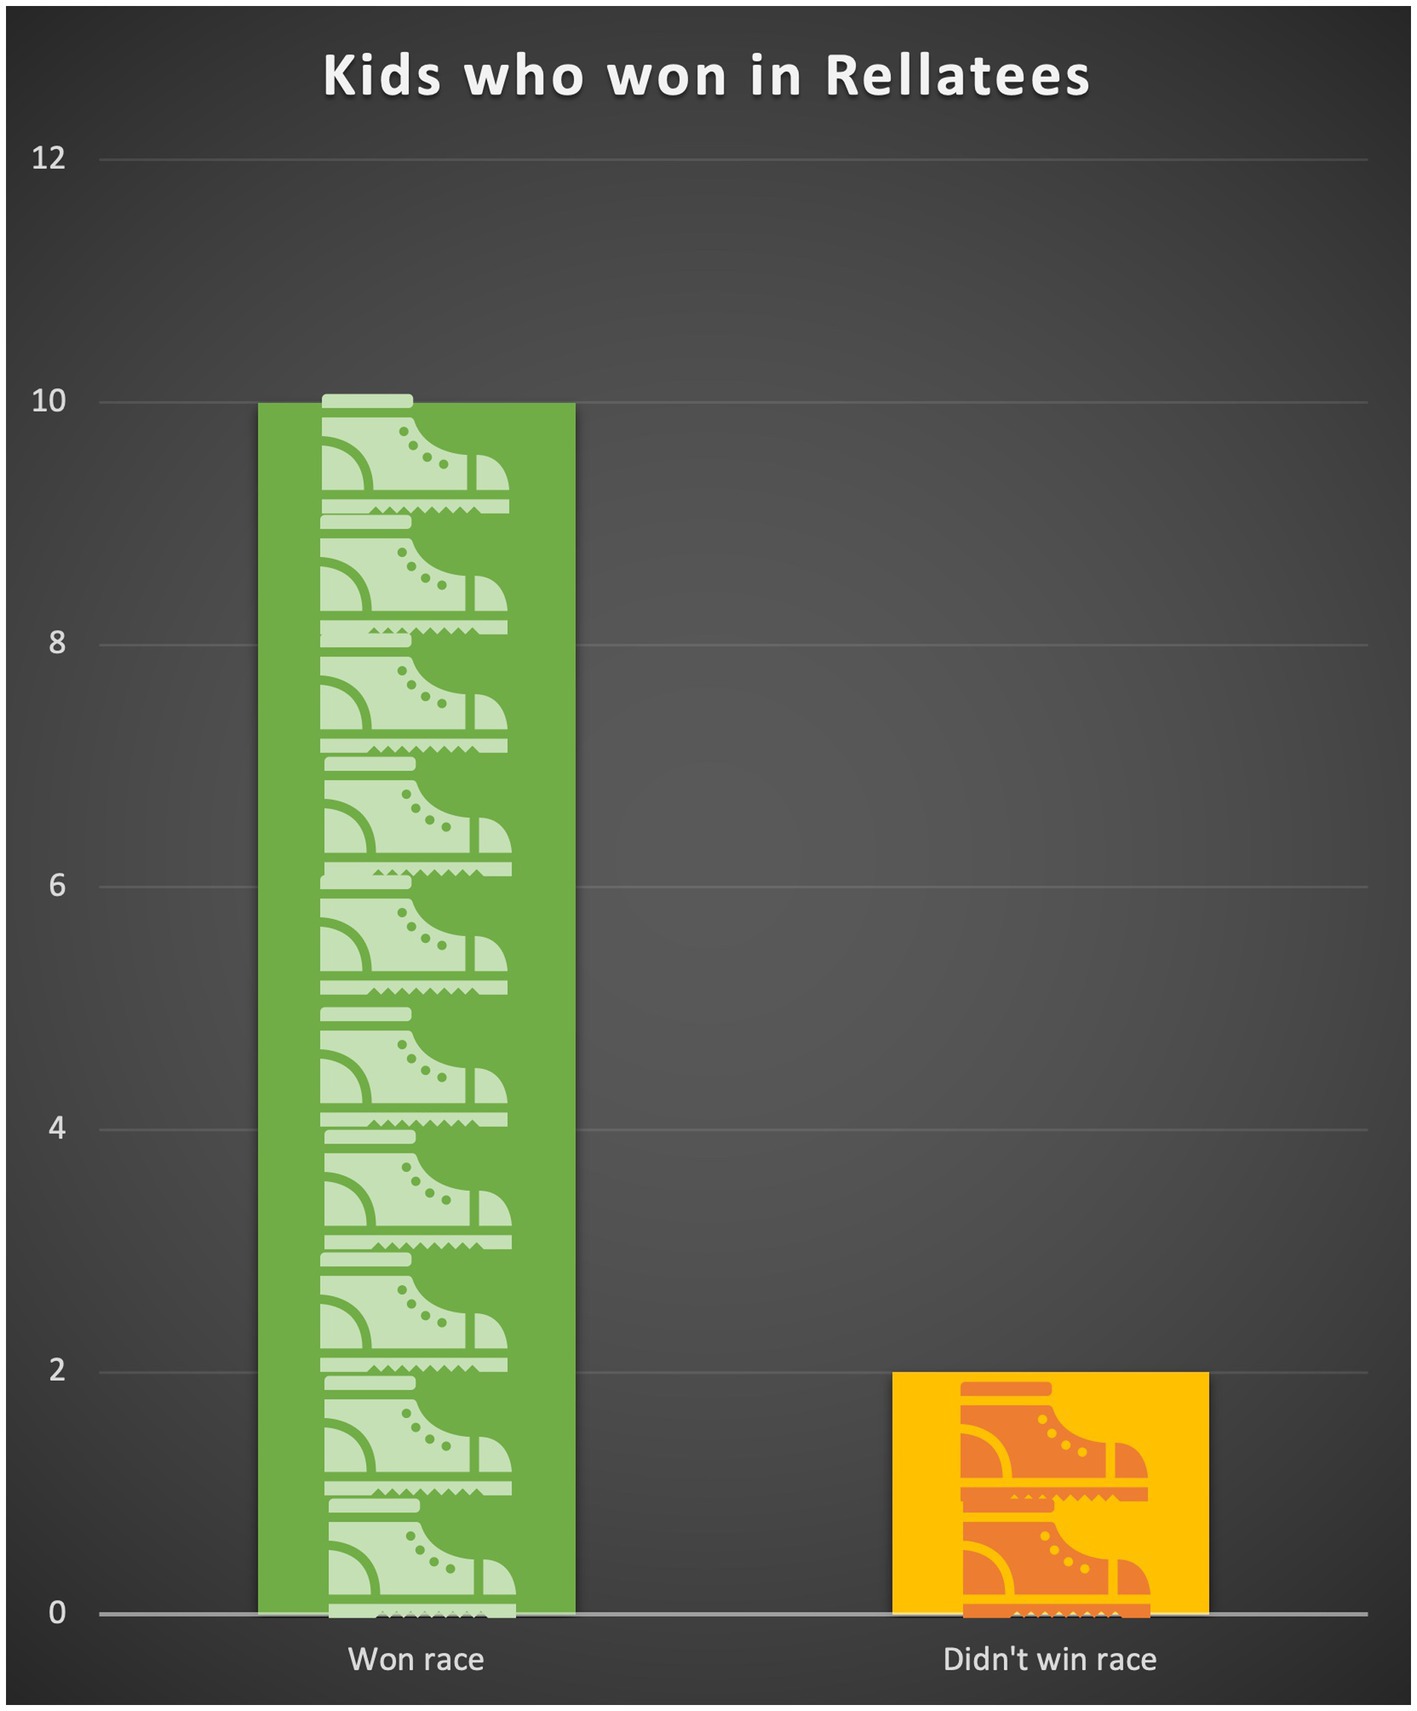
Figure 1. Example graph shown to the children.
2.3 Procedure
2.3.1 Children
All children were tested online over Zoom by an undergraduate research assistant, and their names were entered into a gift card drawing as a means of compensation. The same procedure was used for both 7- and 10-year-old children. For each trial, children heard a short introduction in which they were introduced to an agent and shown a photograph. They were told that the agent was facing a problem, the problem was briefly described, and they were told that the agent needed help choosing between two different solutions. For example, a sick boy named Alex had to choose between two medicines to get better. For the anecdotes, the children were told that they would hear what another child (i.e., the anecdotist) who had a similar experience said; for the graphs, they were told that they would see the results of “some research about what happened when some other kids made a different choice.” They then heard the anecdote and saw the graph, the order of which was counterbalanced across participants and trials, such that each participant saw the graph first on two trials and the anecdote first on the other two. Participants were then asked to choose a solution and to explain their choice. Subsequently, they answered a comprehension check question to assess their understanding of the graph: they were shown the graph again and asked whether more children experienced a successful or unsuccessful outcome.
We also assessed individual difference variables: two measures assessing engagement, narrative transportation and identification with the character relaying the anecdote, and cognitive reflection (as measured by the CRT—D, Young et al., 2018). Narrative transportation was assessed for each vignette with two questions extracted from the adult narrative transportation scale (Green and Brock, 2000): (1) how clearly the participant could picture the events in the story and (2) how much they wanted to hear how it ended while they were listening. Identification was assessed for each vignette with two questions extracted from the adult experience-taking scale (Kaufman and Libby, 2012): (1) how much they understood how the character was feeling, and (2) how much they had in common with the character. All responses were collected on a four-point scale from not/nothing at all to very much.
2.3.2 Adults
Undergraduate students followed the same procedure with these exceptions: (1) they completed the survey independently through Qualtrics, (2) they performed two attention checks before the main task, (3) rather than referring to the agents as “children your age,” they were referred to as “students,” (4) the photographs of the agent and the anecdotist were of college-age adults, (5) the graphs did not contain focal object icons, (6) and cognitive reflection was measured using the CRT (Frederick, 2005). The language used to describe the problems and solutions was also revised to be more adult-appropriate.
3 Results
We first conducted a preliminary analysis of the graph comprehension questions. In total, 94% of the 7-year-olds’, 99% of 10-year-olds’, and 99% of the adults’ responses to these questions were correct. Thus, participants of all ages were able to extract accurate information from the graphs. Descriptive analyses showed that participants chose solutions supported by the graph (vs. the anecdote) 60% of the time, although as shown in Figure 2, participants’ responses appeared to reflect an increase in preference for the graphical solution with age: 7-year-olds chose the graph 42% of the time, 10-year-olds chose the graph 60% of the time, and adult participants chose the graph 75% of the time. For individual subjects, preference for the graph (over the anecdote) in the majority of trials also increased with age: while 52% of 7-year-olds chose the anecdotal solution every time or 3 out of 4 times, only 23% of 10-year-olds and 8% of adults did so. In contrast, 46% of 10-year-olds and 71% of adults chose the graph at least 3 out of 4 times.
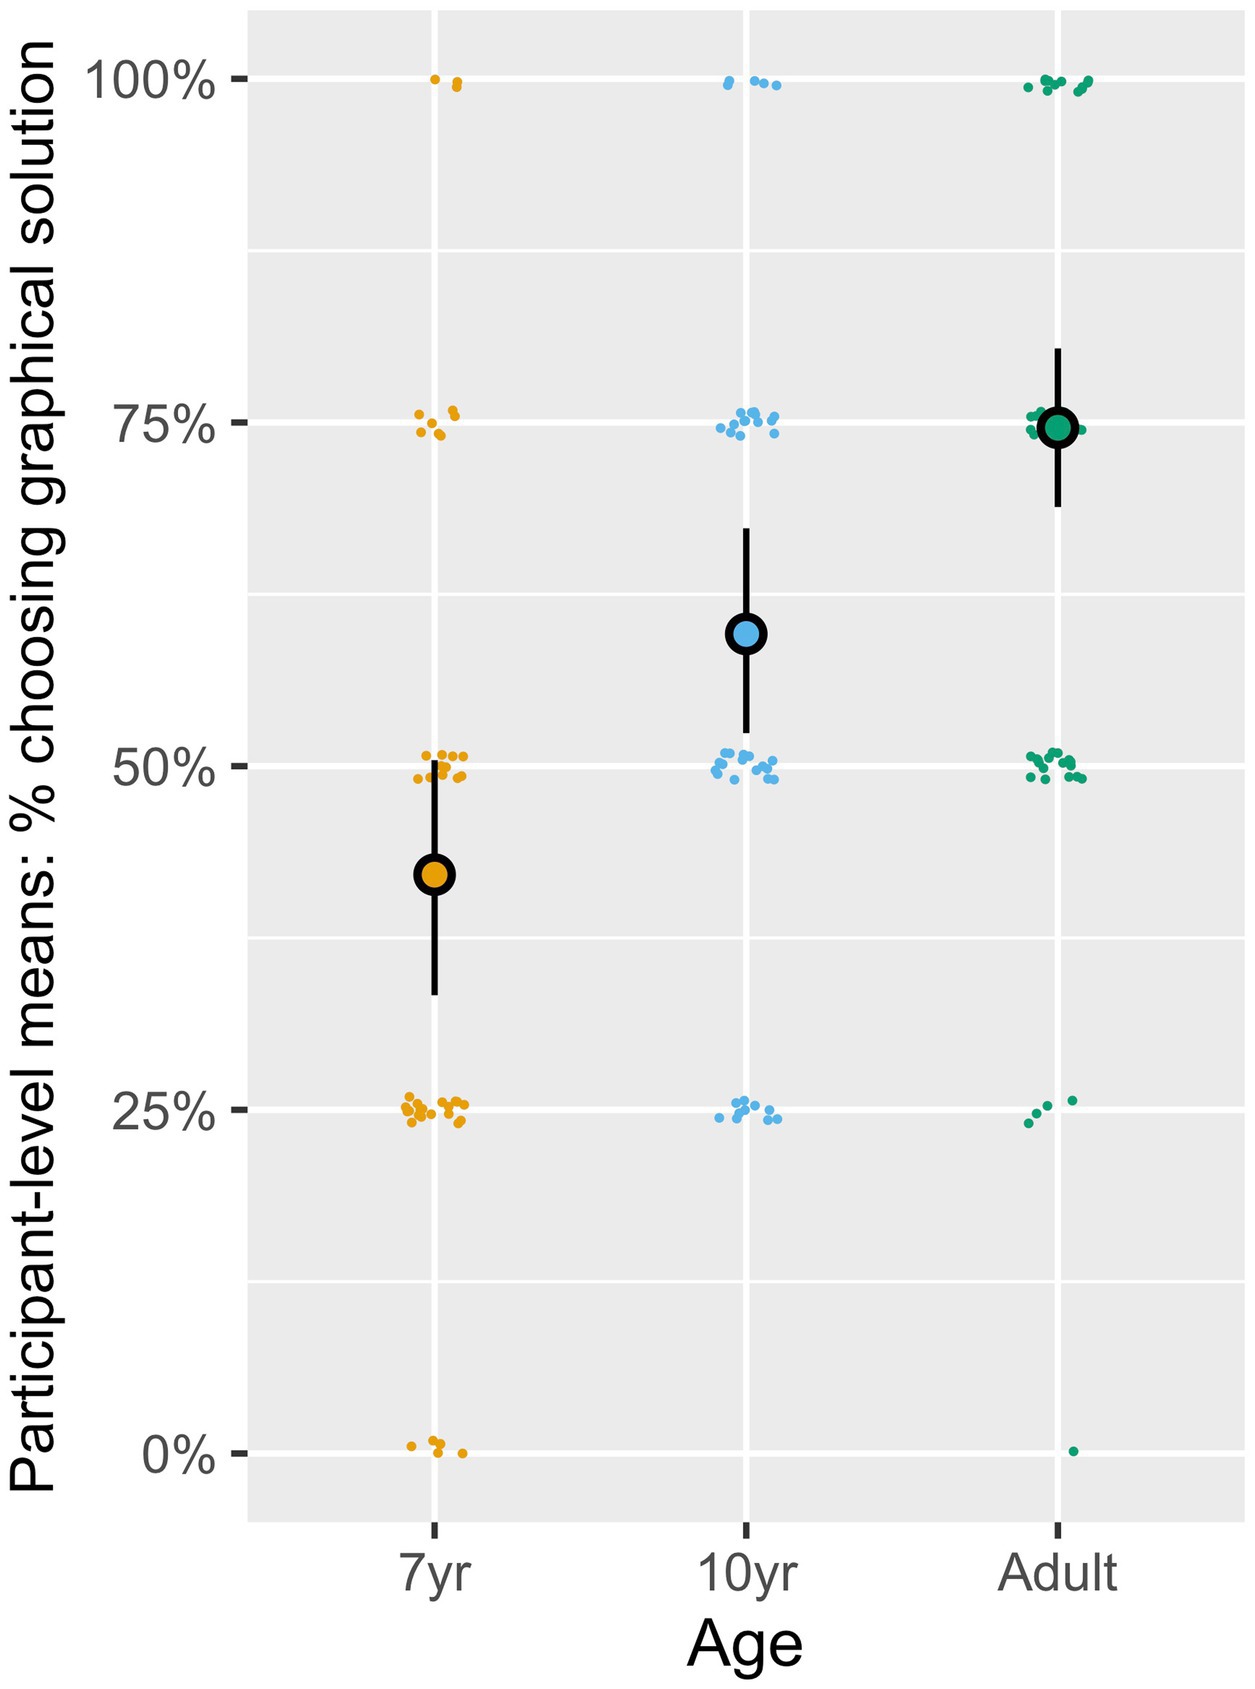
Figure 2. Percentage of participants choosing the graphical solution at each age. Error bars are bootstrapped 95% CIs.
To examine these patterns, we conducted a mixed-effects binary logistic regression using the lme4 package in R Statistical Software (R Core Team, 2022) on participants’ choice of the graphical solution (vs. the anecdote). Age group (7, 10, adults) was included as a fixed effect. To test for all age contrasts, the model was run once with 7-year-olds as the reference category and a second time with 10-year-olds as the reference category. To control for within-participant variability, participant was included as a random effect in each model. The results of these analyses are shown in Table 1.
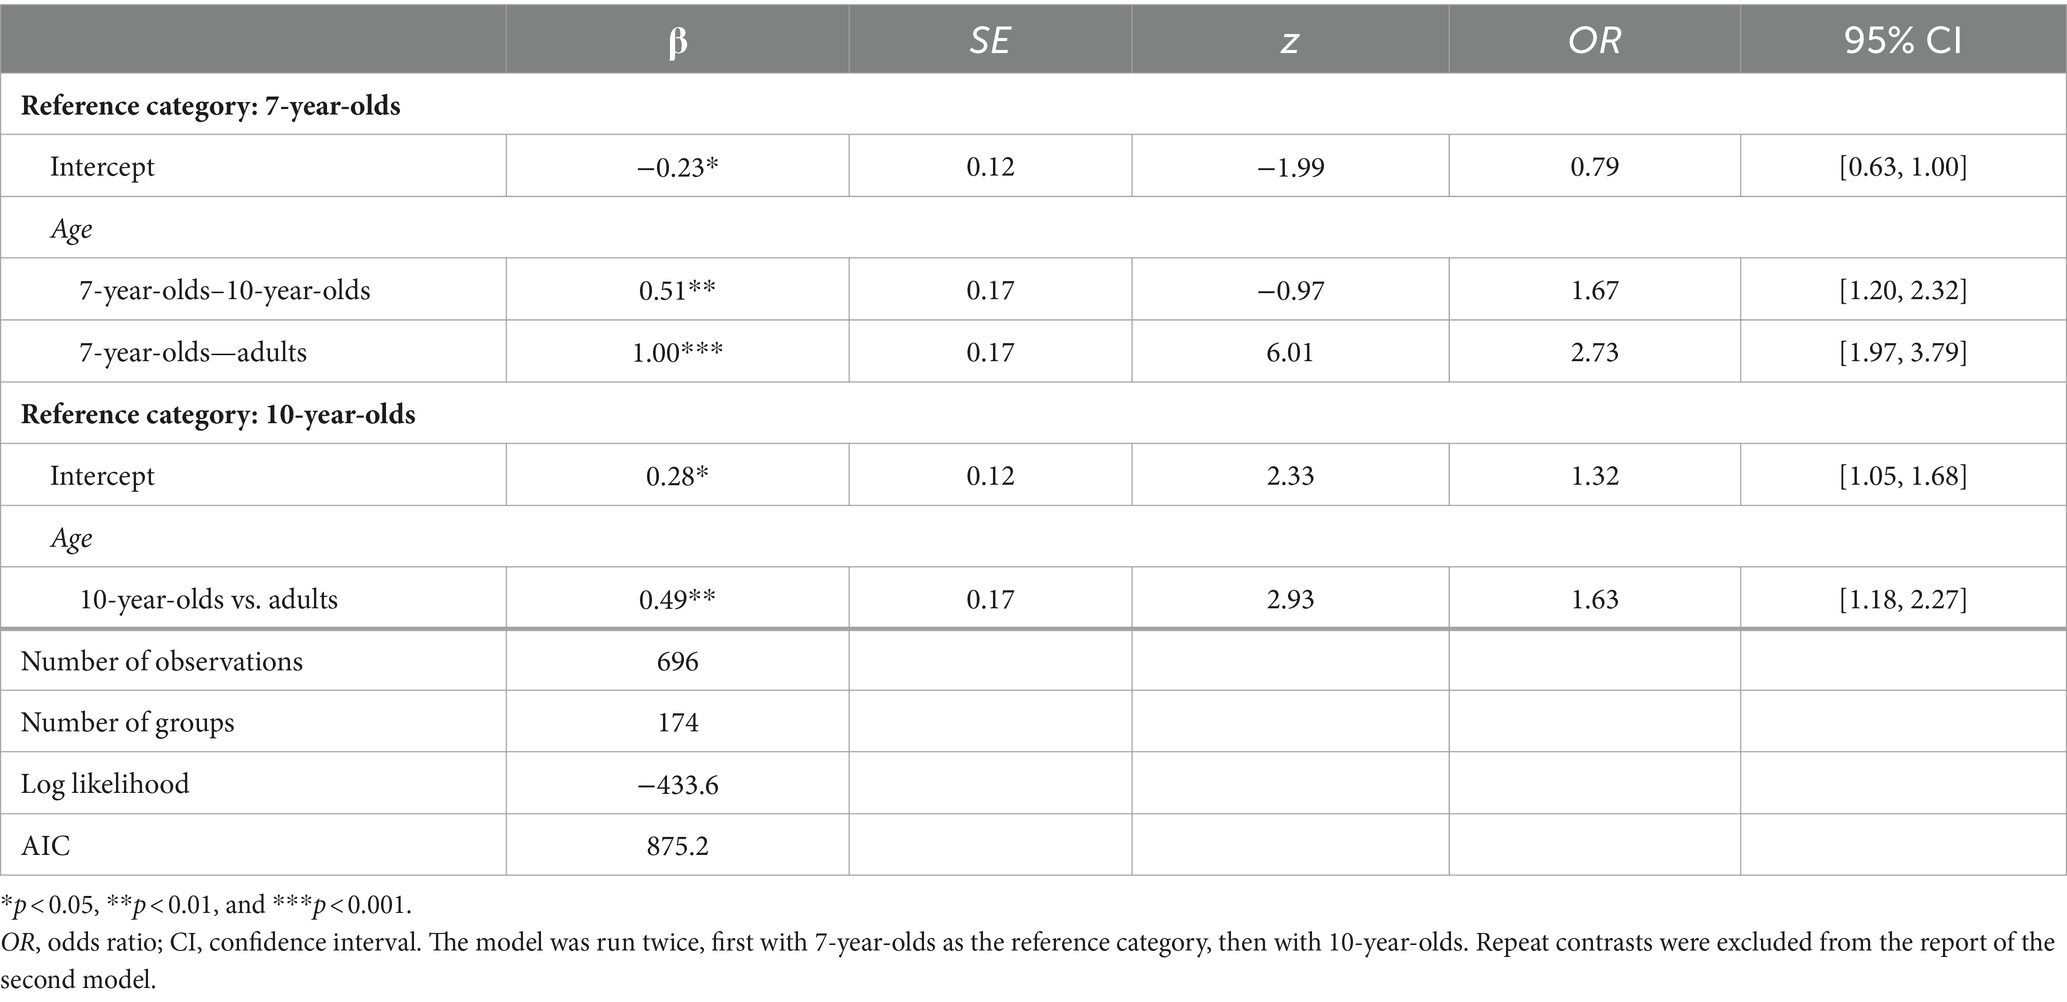
Table 1. Mixed-effects binomial logistic regression analyses for the effect of age on the likelihood of choosing the graphical (vs. anecdotal) solution.
Our analyses revealed a significant effect of age on participants’ solution choices: with age, participants became increasingly likely to choose the solution supported by the graph over the solution supported by the anecdote (7-year-olds vs. 10-year-olds: β = 0.52, SE = 0.17, z = 3.05, p = 0.002; 7-year-olds vs. adults: β = 1.00, SE = 0.17, z = 6.00, p < 0.001; 10-year-olds vs. adults: β = 0.49, SE = 0.17, z = 2.93, p = 0.003). The explanations offered by the participants shed light on the mechanisms behind this age-related change.
3.1 Explanations
3.1.1 Coding
Once the data were collected, the authors randomly selected a sample of participants’ explanations across the vignettes to examine patterns that emerged. Explanations varied among two important dimensions described below, and a coding scheme was devised by the authors to reflect this variation. Explanations were coded by two research assistants—one coded 100% of the data and the other approximately 50%. Cohen’s kappa revealed substantial intercoder reliability (k = 0.82). Disagreements were resolved by the second author.
First, explanations were coded according to whether they supported the participant’s choice (i.e., provided reasons why the chosen form of evidence was superior), and/or discounted the rejected choice (i.e., provided reasons why the rejected form of evidence was inferior). For example, if a person chose the graph, a code of support would be given if the participant explained their choice of the graph by saying, “larger sample size,” because it cited an attribute of the graph (their chosen solution), and a discount code would be given if a participant explained their choice of the graph with, “[The story] was just one person,” because it cited a weakness of the anecdote (the rejected solution). It should be noted that sometimes participants offered compound justifications in which they both supported their choice and discounted the alternative, so support and discount were noted as separate variables for each observation.
Second, explanations were coded for the presence of four dimensions: (1) person, (2) number, (2) intended cause, and (4) alternative cause (see Table 2). Justifications were double-coded if they referenced more than one of these dimensions. Justifications that did not reference the categories (including “I do not know”) were coded as uninformative and kept in the dataset for analyses (11% of all cases).
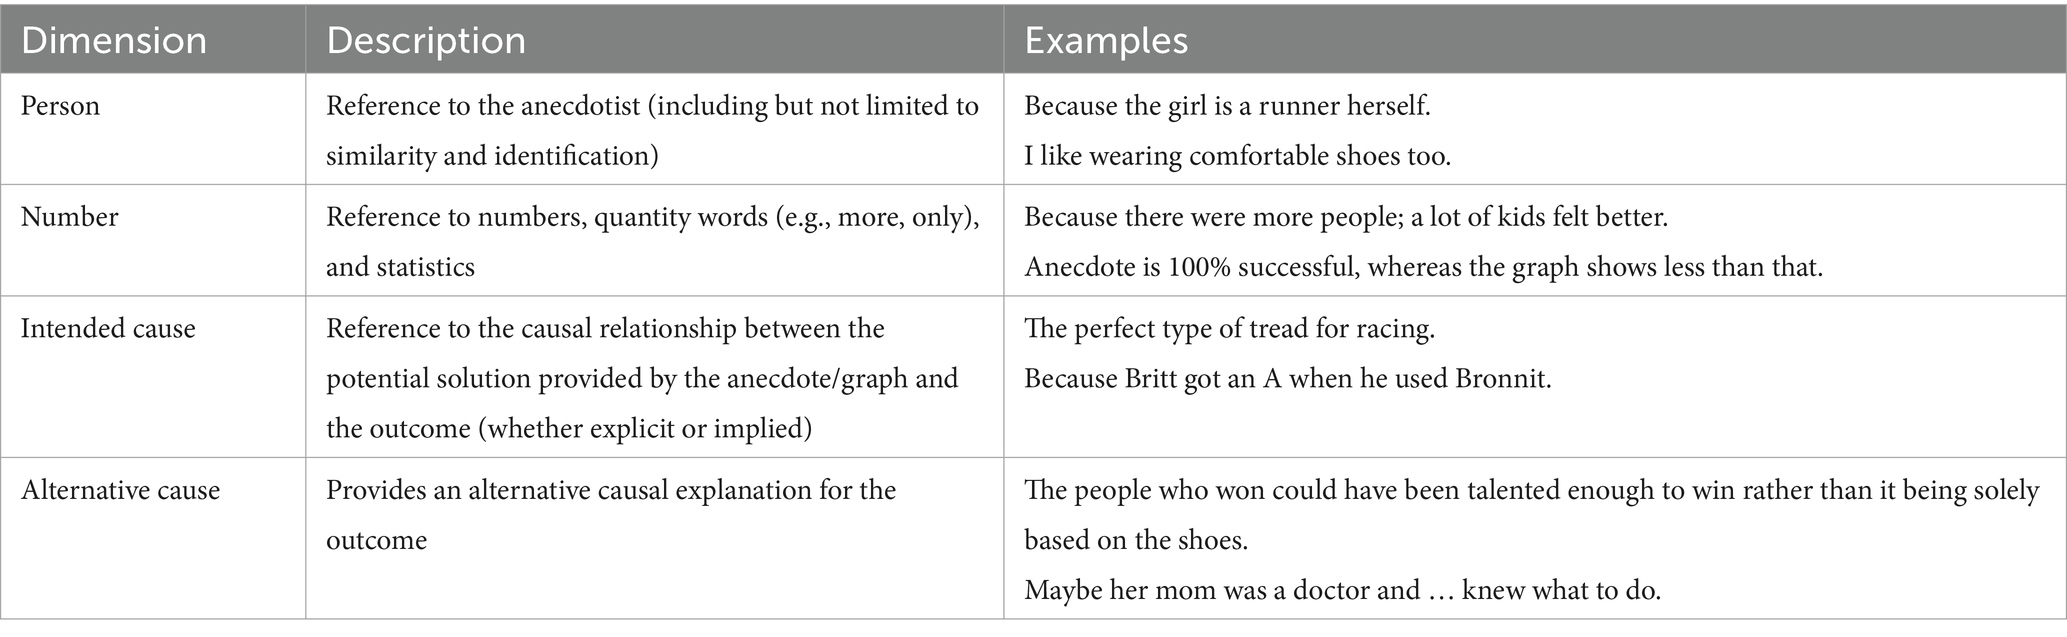
Table 2. Justification types.
3.1.2 Support analyses
Overall, participants’ justifications tended to support their choices 76% of the time and to discount their choices 53% of the time. To examine whether the likelihood of giving a supporting justification differed by age, we conducted a mixed-effects binary logistic regression on the presence of supporting justifications with age as a predictor and participant as a random effect. To test all age comparisons, the model was run twice, first with 7-year-olds as the reference group, and then with 10-year-olds. Participant was included as a random intercept. It was observed that 10-year-olds gave fewer supporting justifications than adults: β = 0.79, SE = 0.35, z = 2.23, p = 0.03 (72% vs. 81%); otherwise, the presence of supporting justifications did not differ by age. See Supplementary Table A1 for full results. To examine whether the likelihood of giving a discount judgment differed by age, we repeated this process with discount judgments as the outcome variable. No age differences emerged.
3.1.3 Dimension analyses
Figure 3 shows the distribution of each justification type based on evidence choice and age. The most common justifications offered for choosing the anecdotal solution were references to the intended cause (e.g., “because the Callisters were better”; 34%) and to people (e.g., “Britt’s story is more personal”; 19%); references to number (15%) and alternative causes (9%) were present but less common. When participants chose the graphical information they most often referred to number (e.g., “Did the math—the graph showed that 3/11 people would not feel better after taking Midox”; 72%); participants sometimes suggested an alternative cause for the outcome (12%) or cited the intended cause (11%) but rarely referred to people (1%).
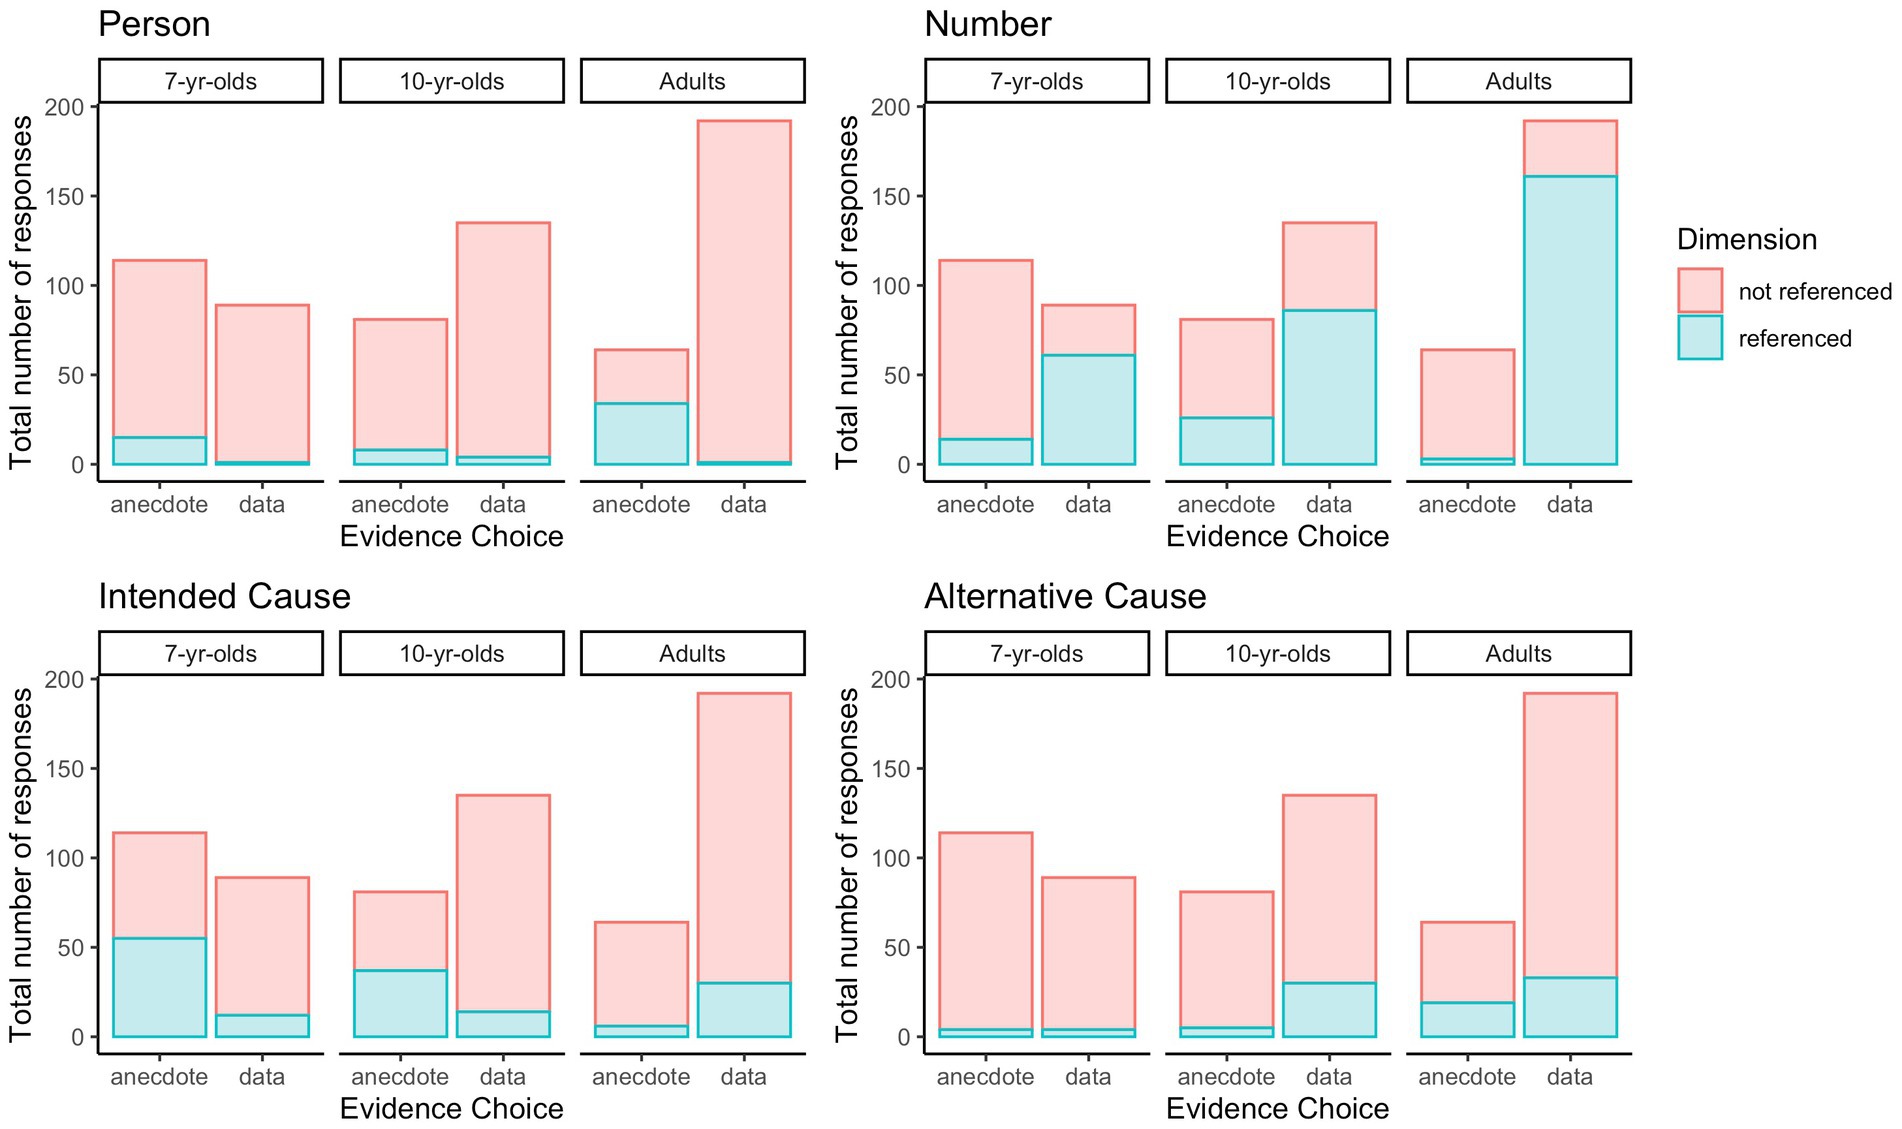
Figure 3. Distribution of justifications by age and solution choice.
To explore these patterns, we ran a series of mixed-effects binary logistic regression models on each justification type separately. In each model, participant was included as a random effect and solution choice (anecdote vs. graph) and age (7, 10, adult) were included as predictors. To see all contrasts, these models were run first with 7-year-olds as the reference category and second with 10-year-olds as the reference category.
When interactions between age and solution choice were found, to explore these interactions we ran three separate mixed effects logistic regression models to see whether graph (vs. anecdote) choice predicted each justification type for each age group separately. In each case, participant was included as a random intercept and the p-level was Bonferroni-adjusted to correct for multiple comparisons (0.05/3 = 0167).
3.1.3.1 Person
Our models for person revealed significant effects of solution choice (with 7-year-olds as the reference category: β = −1.30, SE = 0.59, z = −2.18, p = 0.03), age (7-year-olds vs. adults: β = 2.67, SE = 1.04, z = 2.57, p = 0.01; 10-year-olds vs. adults: β = 2.90, SE = 0.93, z = 3.11, p = 0.001), and a significant interaction between graph choice and age (7-year-olds vs. adults: β = −2.95, SE = 1.14, z = −2.56, p = 0.01; 10-year-olds vs. adults: β = −3.53, SE = 1.06, z = −0.81, p < 0.001). The full results of these models appear in Table 3.
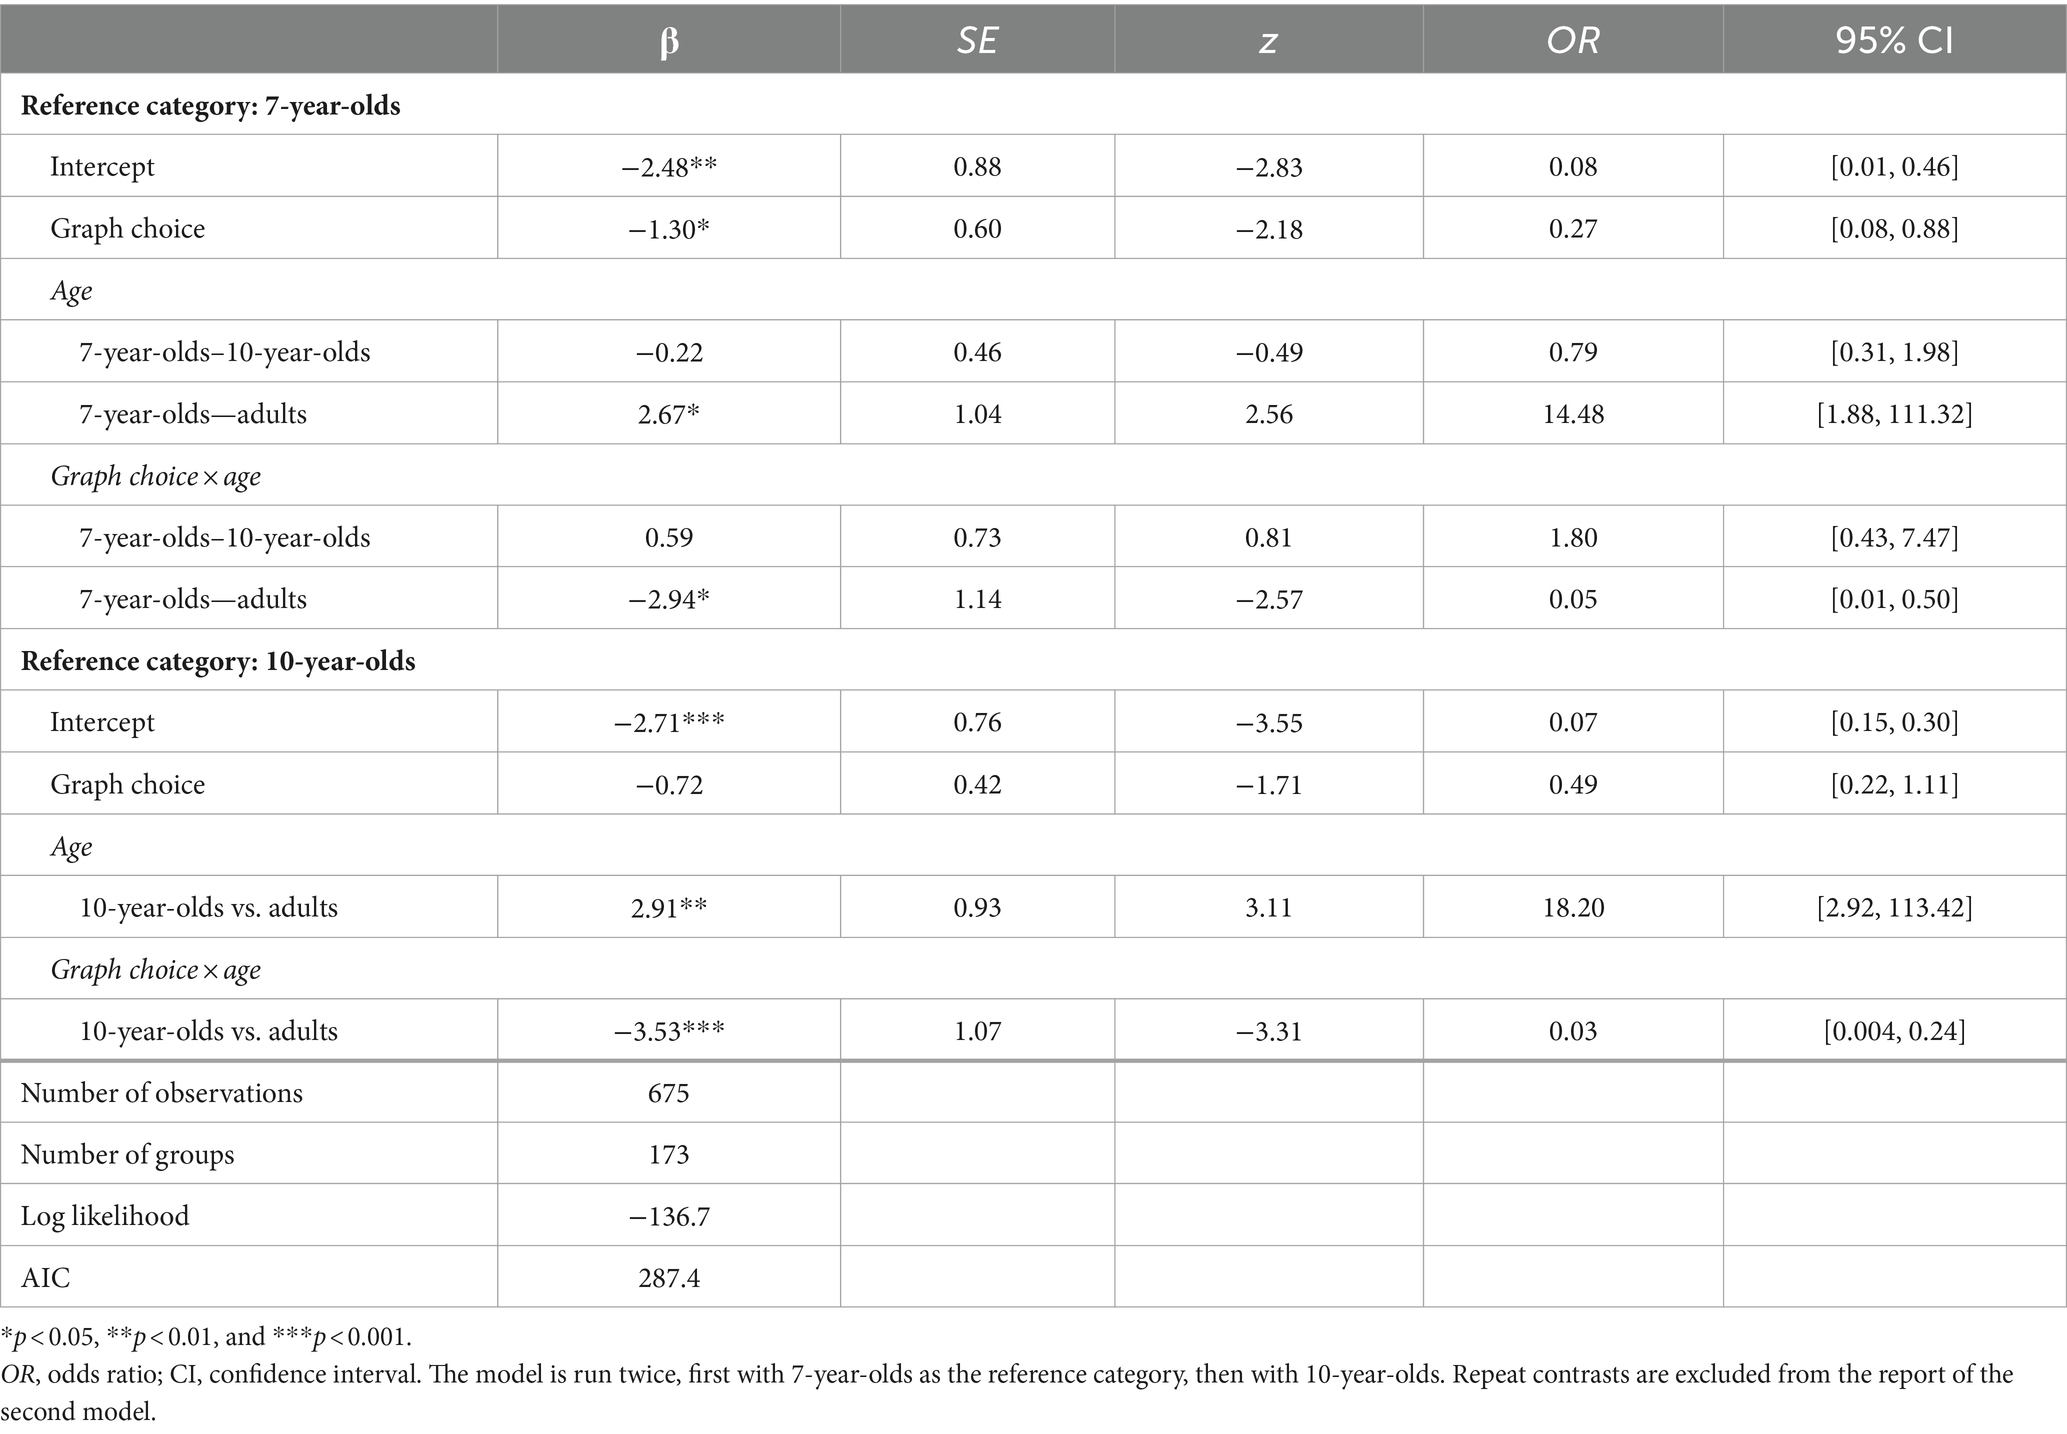
Table 3. Mixed-effects binomial logistic regression analysis for the effect of age and graph on the likelihood of providing a person justification.
To explore the interactions between age and solution choice, we ran three separate mixed-effects logistic regression models to see whether graph (vs. anecdote) choice predicted person justifications separately for each age group (with participant as a random intercept and a p-level set to 0.0167). The model for 7-year-olds showed a significant effect of data choice on person justifications (β = −1.32, SE = 0.50, z = −2.61, p = 0.009), such that they were more likely to reference person when justifying anecdote choice (13% of all anecdote choice justifications) than when justifying graph choice (1% of all graph choice justifications). It was observed that 10-year-olds used person justifications even more infrequently (10% of the time for anecdote choice and 3% for graph choice), and the model for 10-year-olds did not show an effect of solution choice (β = −0.88, SE = 0.57, z = −1.55, p = 0.12). The model for adults confirmed that adults justified anecdote choice with person justifications significantly more frequently for anecdote choice (53% of the time) than for graph choice (0.5%, β = −3.17, SE = 0.66, z = −4.79, p < 0.001). Thus, although solution choice affected both adults’ and 7-year-olds use of person justifications, it did so to the greatest extent for adults. The full results are included in Supplementary Table A2.
3.1.3.2 Number
The models for number yielded significant differences predicted by solution choice (7-year-olds: β = 3.568, SE = 0.56, z = 6.52, p < 0.001; 10-year-olds: β = 1.78, SE = 0.41, z = 4.34, p < 0.001), such that children of both ages were more likely to reference number when they chose the graphical (vs. anecdotal) solution. The models yielded significant age differences (7-year-olds vs. 10-year-olds: β = 1.73, SE = 0.60, z = 2.90, p = 0.003; 10-year-olds vs. adults: β = −2.65, SE = 0.79, z = −3.35, p < 0.001). There was also an interaction between graphical solution endorsement and age group (7-year-olds vs. 10-year-olds: β = −1.90, SE = 0.67, z = −2.82, p = 0.004; 7-year-olds vs. adults: β = 2.28, SE = 0.90, z = 2.54, p = 0.011; 10-year-olds vs. adults: β = 4.18, SE = 0.86, z = 4.86, p = 0.004). See Table 4.
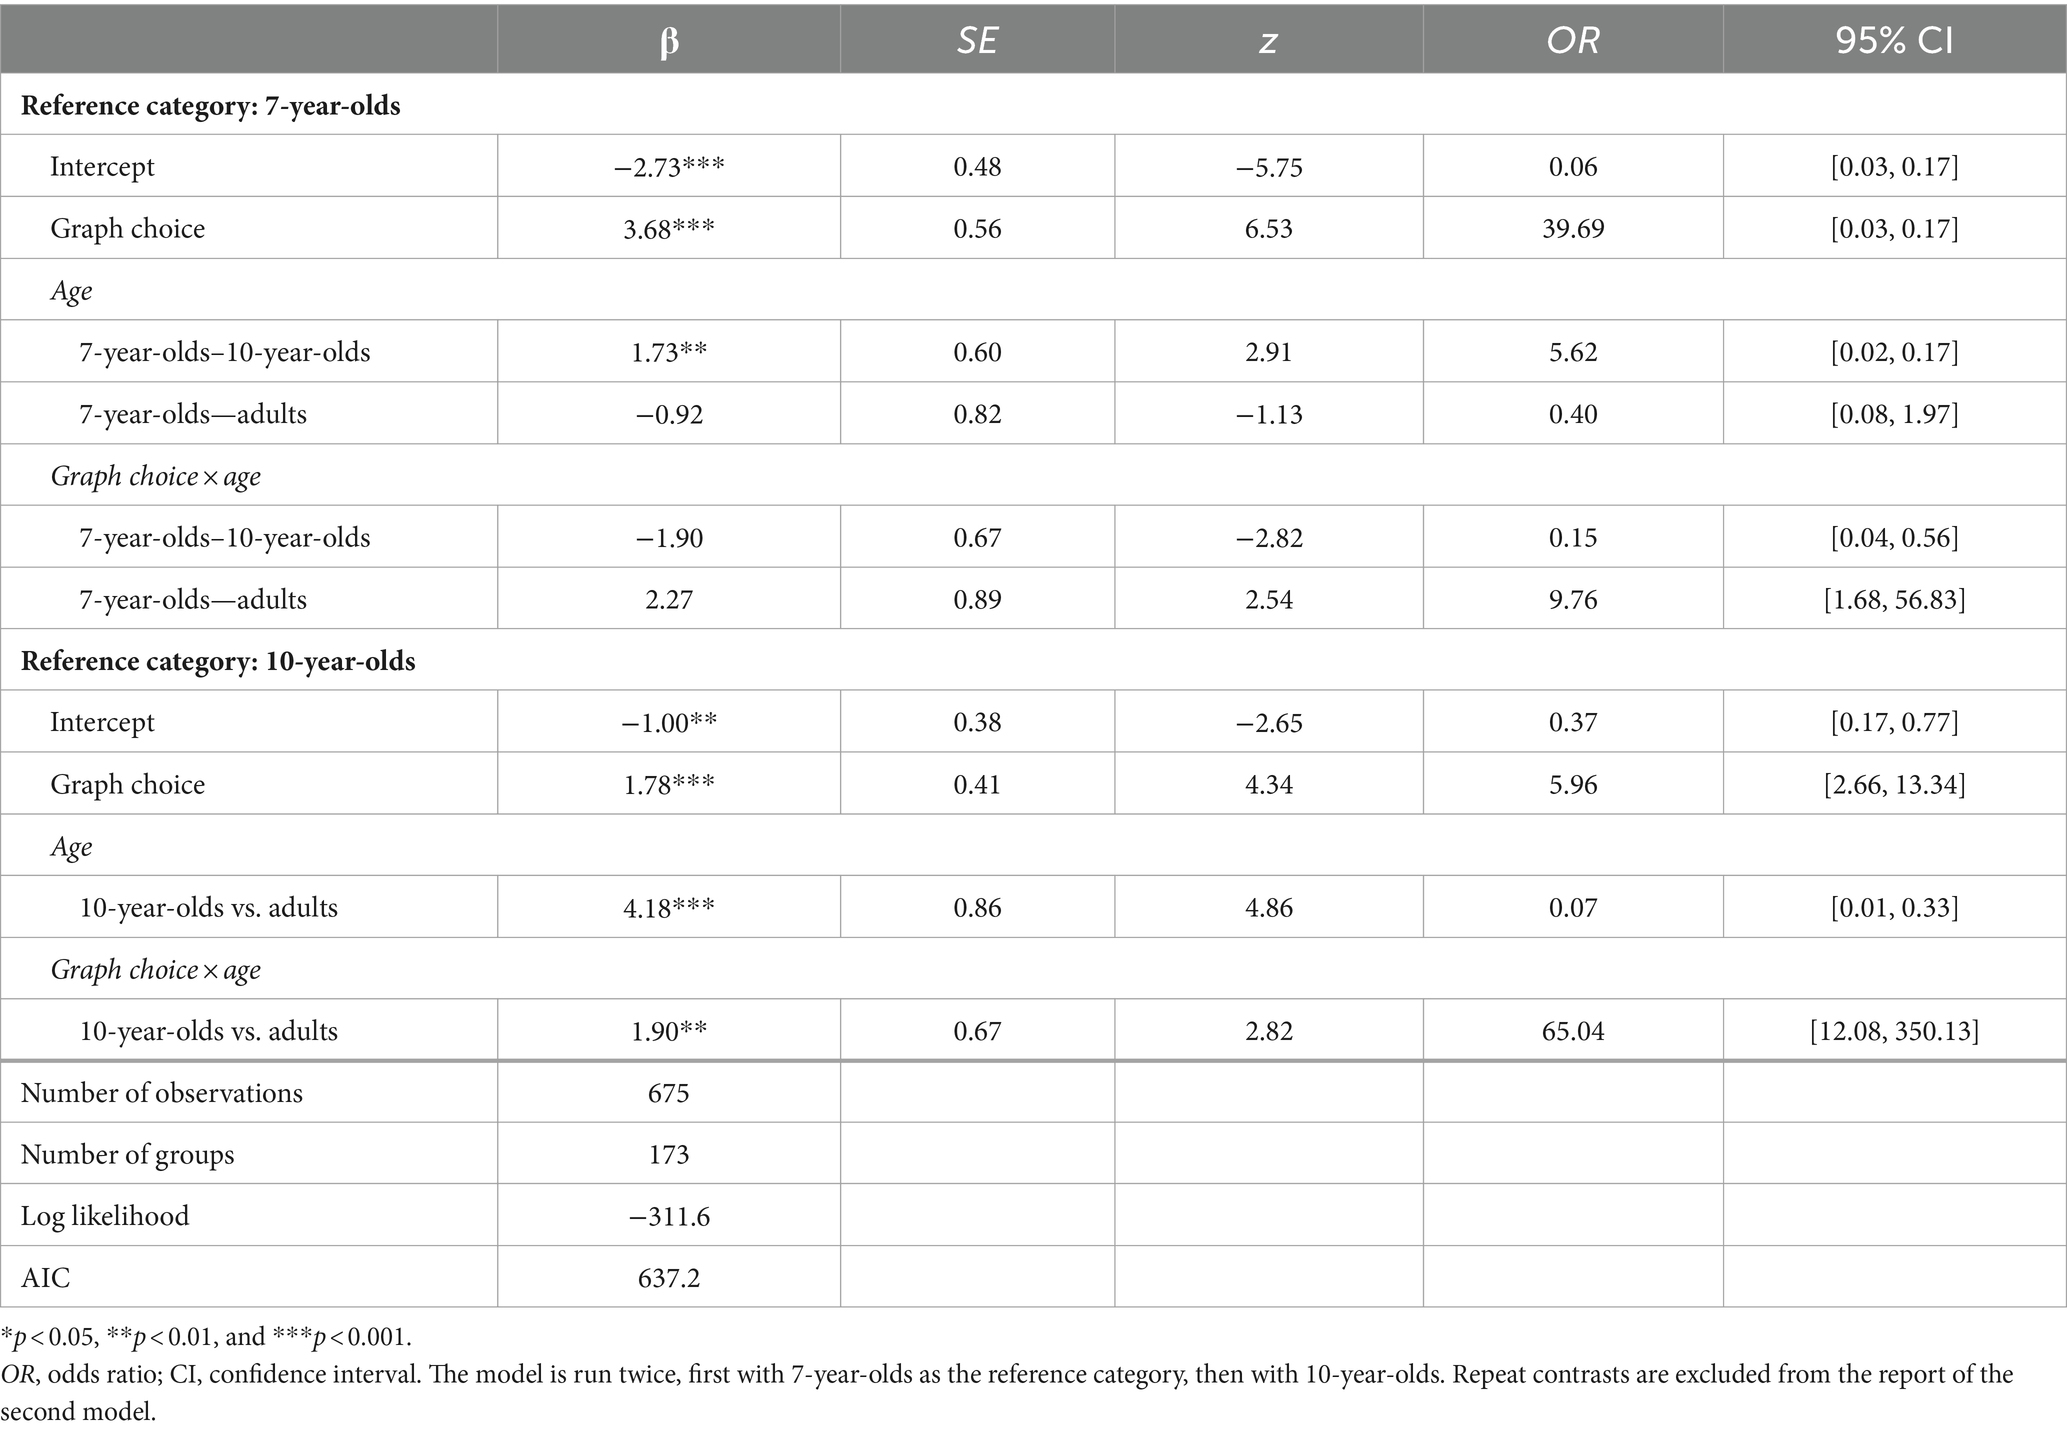
Table 4. Mixed-effects binomial logistic regression analysis for the effect of age and data choice on the likelihood of providing a number justification.
To explore these interactions, we produced three separate models to see whether the choice of the graph (vs. anecdote) predicted number of explanations for each age group separately (with participant as a random intercept and an adjusted p-value of 0.0167). The model for 7-year-olds showed a significant effect of data choice (β = 3.57, SE = 0.81, z = −4.40, p < 0.001), such that 7-year-olds were significantly more likely to use number explanations when justifying graph choice (69% of all graph choice justifications) as compared to anecdote choice (12% of all anecdote choice justifications). The models for 10-year-olds and adults both showed significant effects of graph choice in the same direction (10-year-olds: β = 1.95, SE = 0.22, z = 4.26, p < 0.001; 64% total graph justifications vs. 32% total anecdote justifications; adults: β = 6.00, SE = 0.93, z = 6.48, p < 0.001; 84% total graph justifications vs. 5% total anecdote justifications). As seen in Figure 3, although participants of all ages referenced number more frequently when justifying choice of the graphical solution (vs. the anecdotal), this effect was strongest in adults and weakest (though still very present) in 10-year-olds. See Supplementary Table A3.
3.1.3.3 Intended cause
The models for intended cause yielded significant differences predicted by solution choice, such that children at both ages were more likely to justify anecdote endorsement (vs. graph endorsement) with reference to the intended cause (7-year-olds: β = −1.23, SE = 0.25, z = −4.98, p < 0.001; 10-year-olds: β = −1.25, SE = 0.23, z = −0.5.28, p < 0.001). Age-predicted differences in solution choice (7-year-olds vs. adults: β = −1.50, SE = 0.31, z = −4.83, p < 0.001; 10-year-olds vs. adults: β = −1.38, SE = 0.32, z = −4.35, p < 0.001), such that when endorsing the anecdote, adults were less likely than children of both ages to reference the intended cause. Additionally, there were significant interactions between solution choice and age group (7-year-olds vs. adults: β = 1.56, SE = 0.38, z = 4.14, p < 0.001; 10-year-olds vs. adults: β = 1.58, SE = 0.37, z = 34.31, p < 0.001). See Table 5.
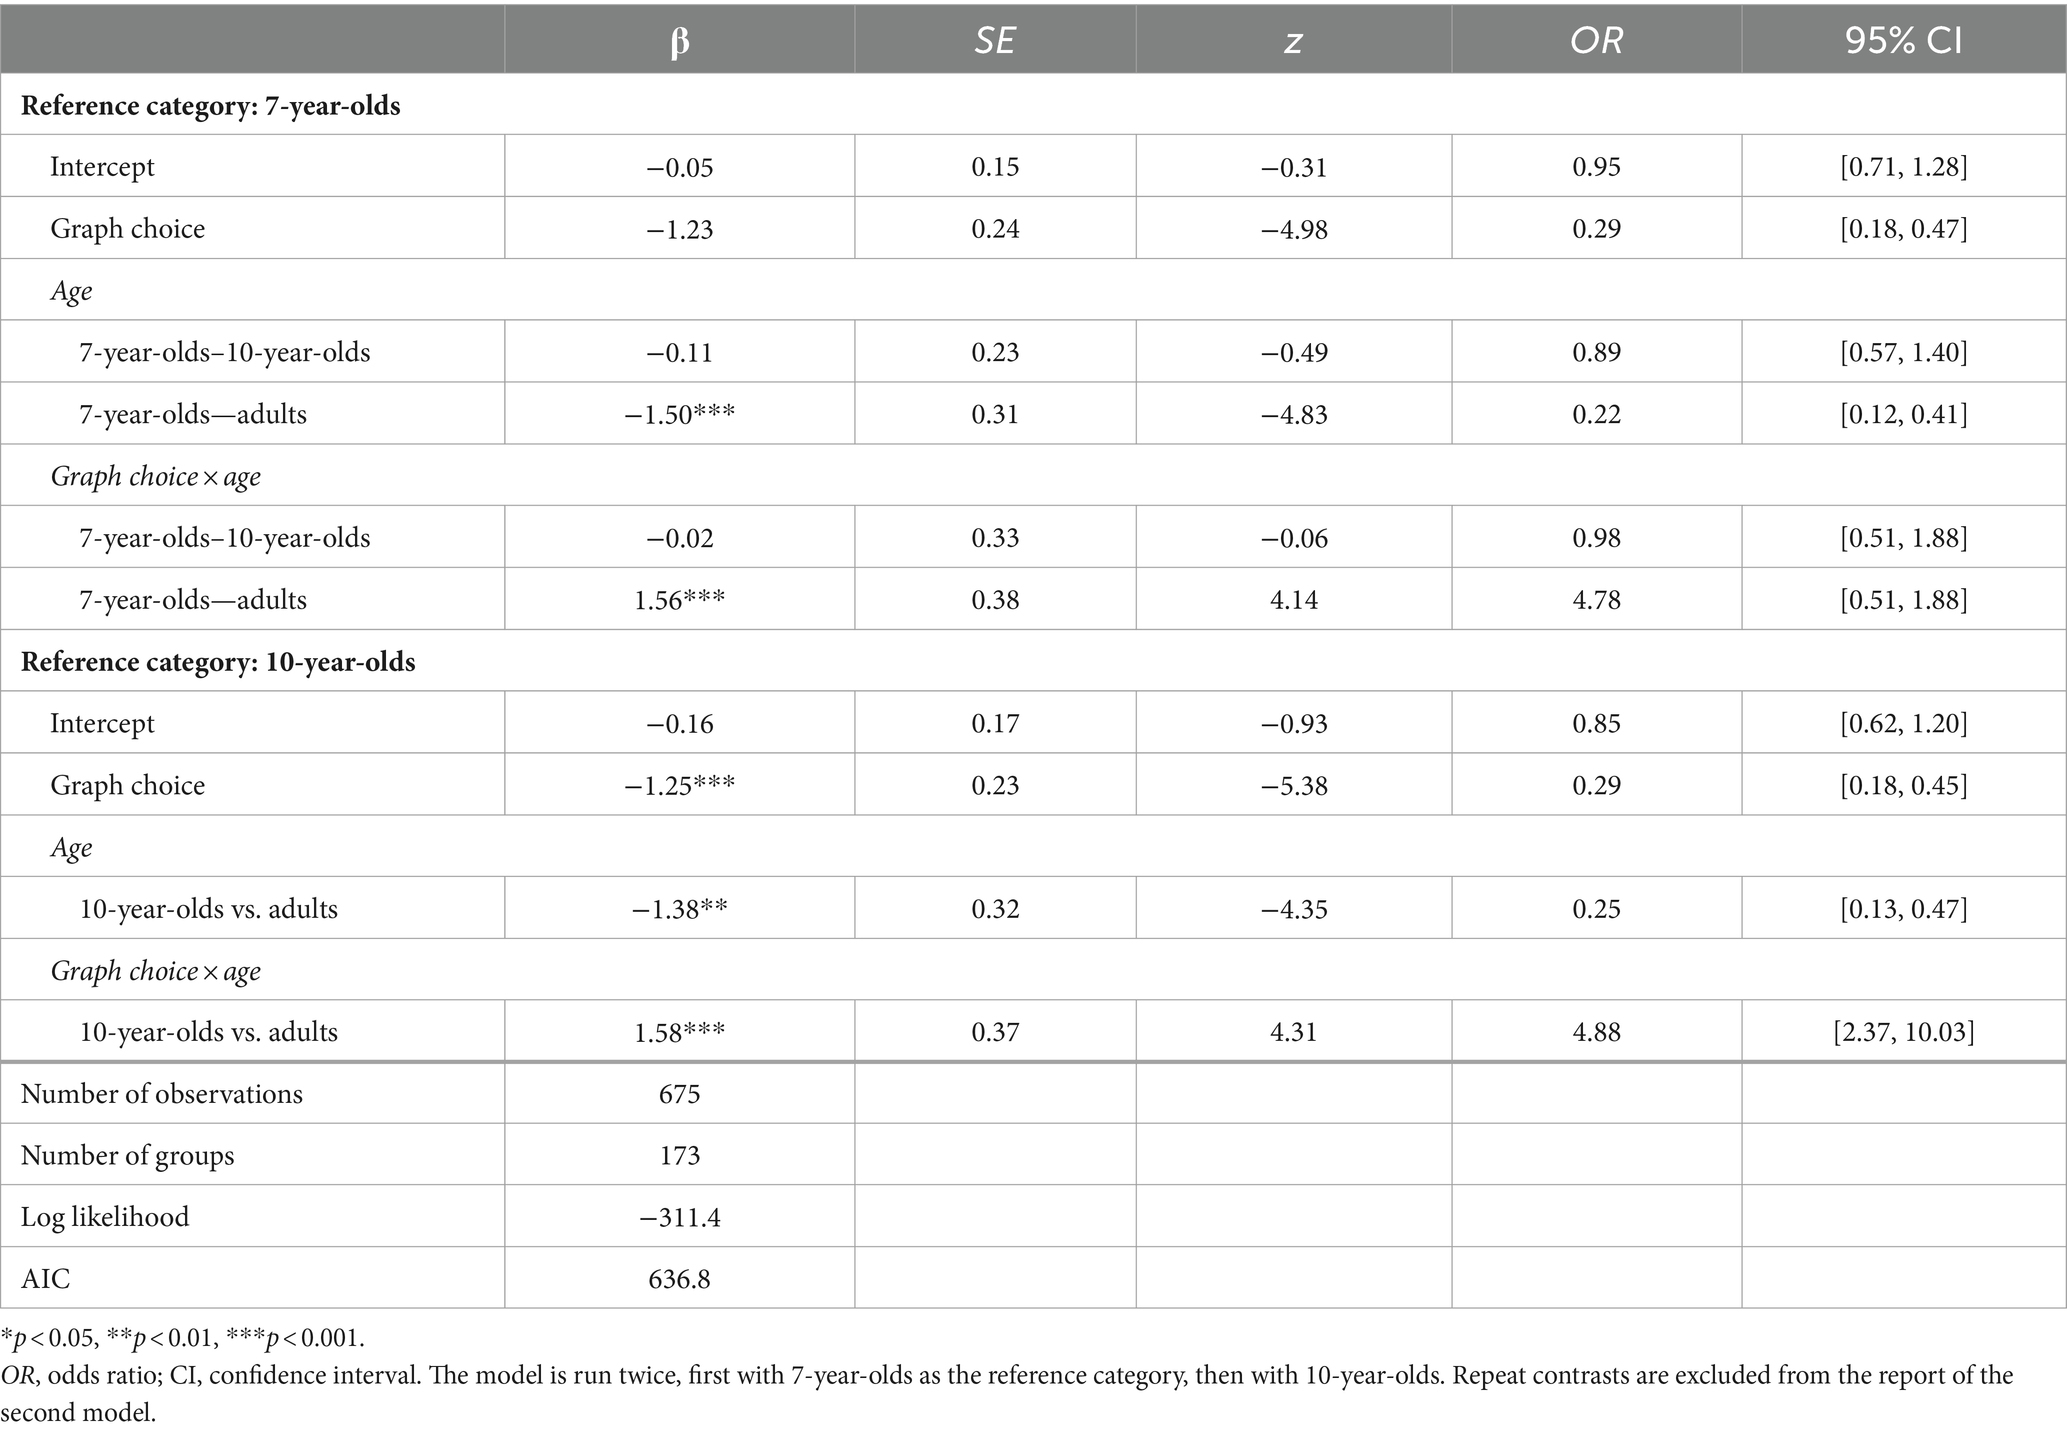
Table 5. Mixed-effects binomial logistic regression analysis for the effect of age and data choice on the likelihood of providing an intended cause justification.
To explore the interactions, we conducted three mixed-effects logistic regressions for each age group separately to test whether graph choice (vs. anecdote) predicted intended cause explanations (with participant as a random intercept and the p-value adjusted to 0.0167). The model for 7-year-olds and the model for 10-year-olds both revealed significant effects of graph choice (7-year-olds: β = −1.17, SE = 0.24, z = −4.76, p < 0.001; 10-year-olds: β = −1.17, SE = 0.21, z = −5.51, p < 0.001), such that children were more likely to refer to the intended mechanism when justifying the choice of the anecdotal solution (7-year-olds: 48% of total anecdote justifications, 10-year-olds: 46%) vs. the graphical (7-year-olds: 14%; 10-year-olds: 10%). Although as seen in Figure 3, adults appeared to show the opposite trend, referring to intended cause 9% of the time when justifying anecdote choices and 16% of the time when justifying graph choices, the model yielded no effects of solution choice (β = 0.72, SE = 0.61, z = 1.17, p = 0.24). See Supplementary Table A4.
3.1.3.4 Alternative cause
The models for alternative cause yielded significant differences predicted by solution choice (10-year-olds: β = 0.94, SE = 0.29, z = 3.21, p = 0.001) and age (7-year-olds vs. adults: β = 1.48, SE = 0.34, z = 4.30, p < 0.001, 10-year-olds vs. adults: β = 1.17, SE = 0.34, z = 3.51, p < 0.001), such that, when choosing the anecdote, adults referred to an alternative cause in their justifications significantly more frequently than did children of both ages. The models also revealed an interaction between solution choice and age (10-year-olds vs. adults, β = −1.41, SE = 0.38, z = −3.74, p < 0.001). See Table 6.

Table 6. Mixed-effects binomial logistic regression analysis for the effect of age and data choice on the likelihood of providing an alternative cause justification.
To further explore this interaction, we conducted three mixed-effects logistic regression models looking at the effect of solution choice on alternative cause justifications for each age group separately (with participant as the random intercept and the p-value corrected to 0.0167). The model for 7-year-olds yielded no effect of solution choice (β = 0.55, SE = 0.55, z = 0.99, p = 0.32): 7-year-olds rarely referred to alternative causes in their justifications [equally infrequently whether justifying anecdote choices (4%) or graph choices (5%)]. The model for 10-year-olds revealed a significant effect of solution choice (β = 0.90, SE = 0.30, z = 3.02, p = 0.002), such that 10-year-olds were more likely to reference alternative cause when choosing the graphical solution (22%; e.g., “There were some kids that did not win, but there’s probably another reason besides the shoes that those kids did not win”) vs. when choosing the anecdotal solution (6%). The model for adults revealed the opposite trend (β = −0.81, SE = 0.39, z = −2.05, p = 0.04), such that they were marginally more likely to use alternative cause explanations when choosing the anecdotal solution (30%; e.g., for the academic ability story, “Because having something that you think might work helps your confidence”) vs. the graphical one (17%). Thus, as shown in Figure 3, 7-year-olds rarely suggested an alternative cause to justify their choices. This response was more common in 10-year-olds and adults, but distribution by solution choice differed with age: 10-year-olds suggested an alternative cause more when they chose the graph, and adults tended to do so more when they chose the anecdote. See Supplementary Table A5.
3.2 Individual differences
Before exploring the effects of the individual difference variables (critical reflection, identification, and transportation), we checked for correlations between transportation and identification, two variables that we suspected were be closely related. Because there was a significant positive correlation between transportation and identification (r = 0.95, p < 0.001), these were combined into a single four-point score representing engagement for each vignette.
To determine whether engagement and critical reflection predicted solution choice for participants at each age, we conducted a mixed-effects binomial logistic regression on participants’ choice of the graphical solution. Participant was included as a random effect, and engagement and critical reflection were included as continuous fixed effects. Age (7, 10, adult) was included as a categorical fixed effect, and to see all age contrasts, the model was run twice, first with 7-year-olds as the reference category and then with 10-year-olds as the reference category. The analysis yielded differences predicted by engagement (10-year-olds: β = −1.01, SE = 0.41, z = −2.43, p = 0.015) and age (7-year-olds vs. 10-year-olds: β = 3.75, SE = 1.74, z = 2.16, p = 0.031; 7-year-olds vs. adults: β = 3.74, SE = 1.50, z = 2.50, p = 0.013); two-way interactions between critical reflection and age (7-year-olds vs. 10-year-olds: β = −8.12, SE = 4.11, z = −1.98, p = 0.048; 7-year-olds vs. adults: β = −7.86, SE = 3.74, z = −2.01, p = 0.036); and a three-way interaction between engagement, critical reflection, and age (7-year-olds vs. adults: β = 2.61, SE = 1.26, z = 2.06, p = 0.039). The full results of these models appear in Table 7.
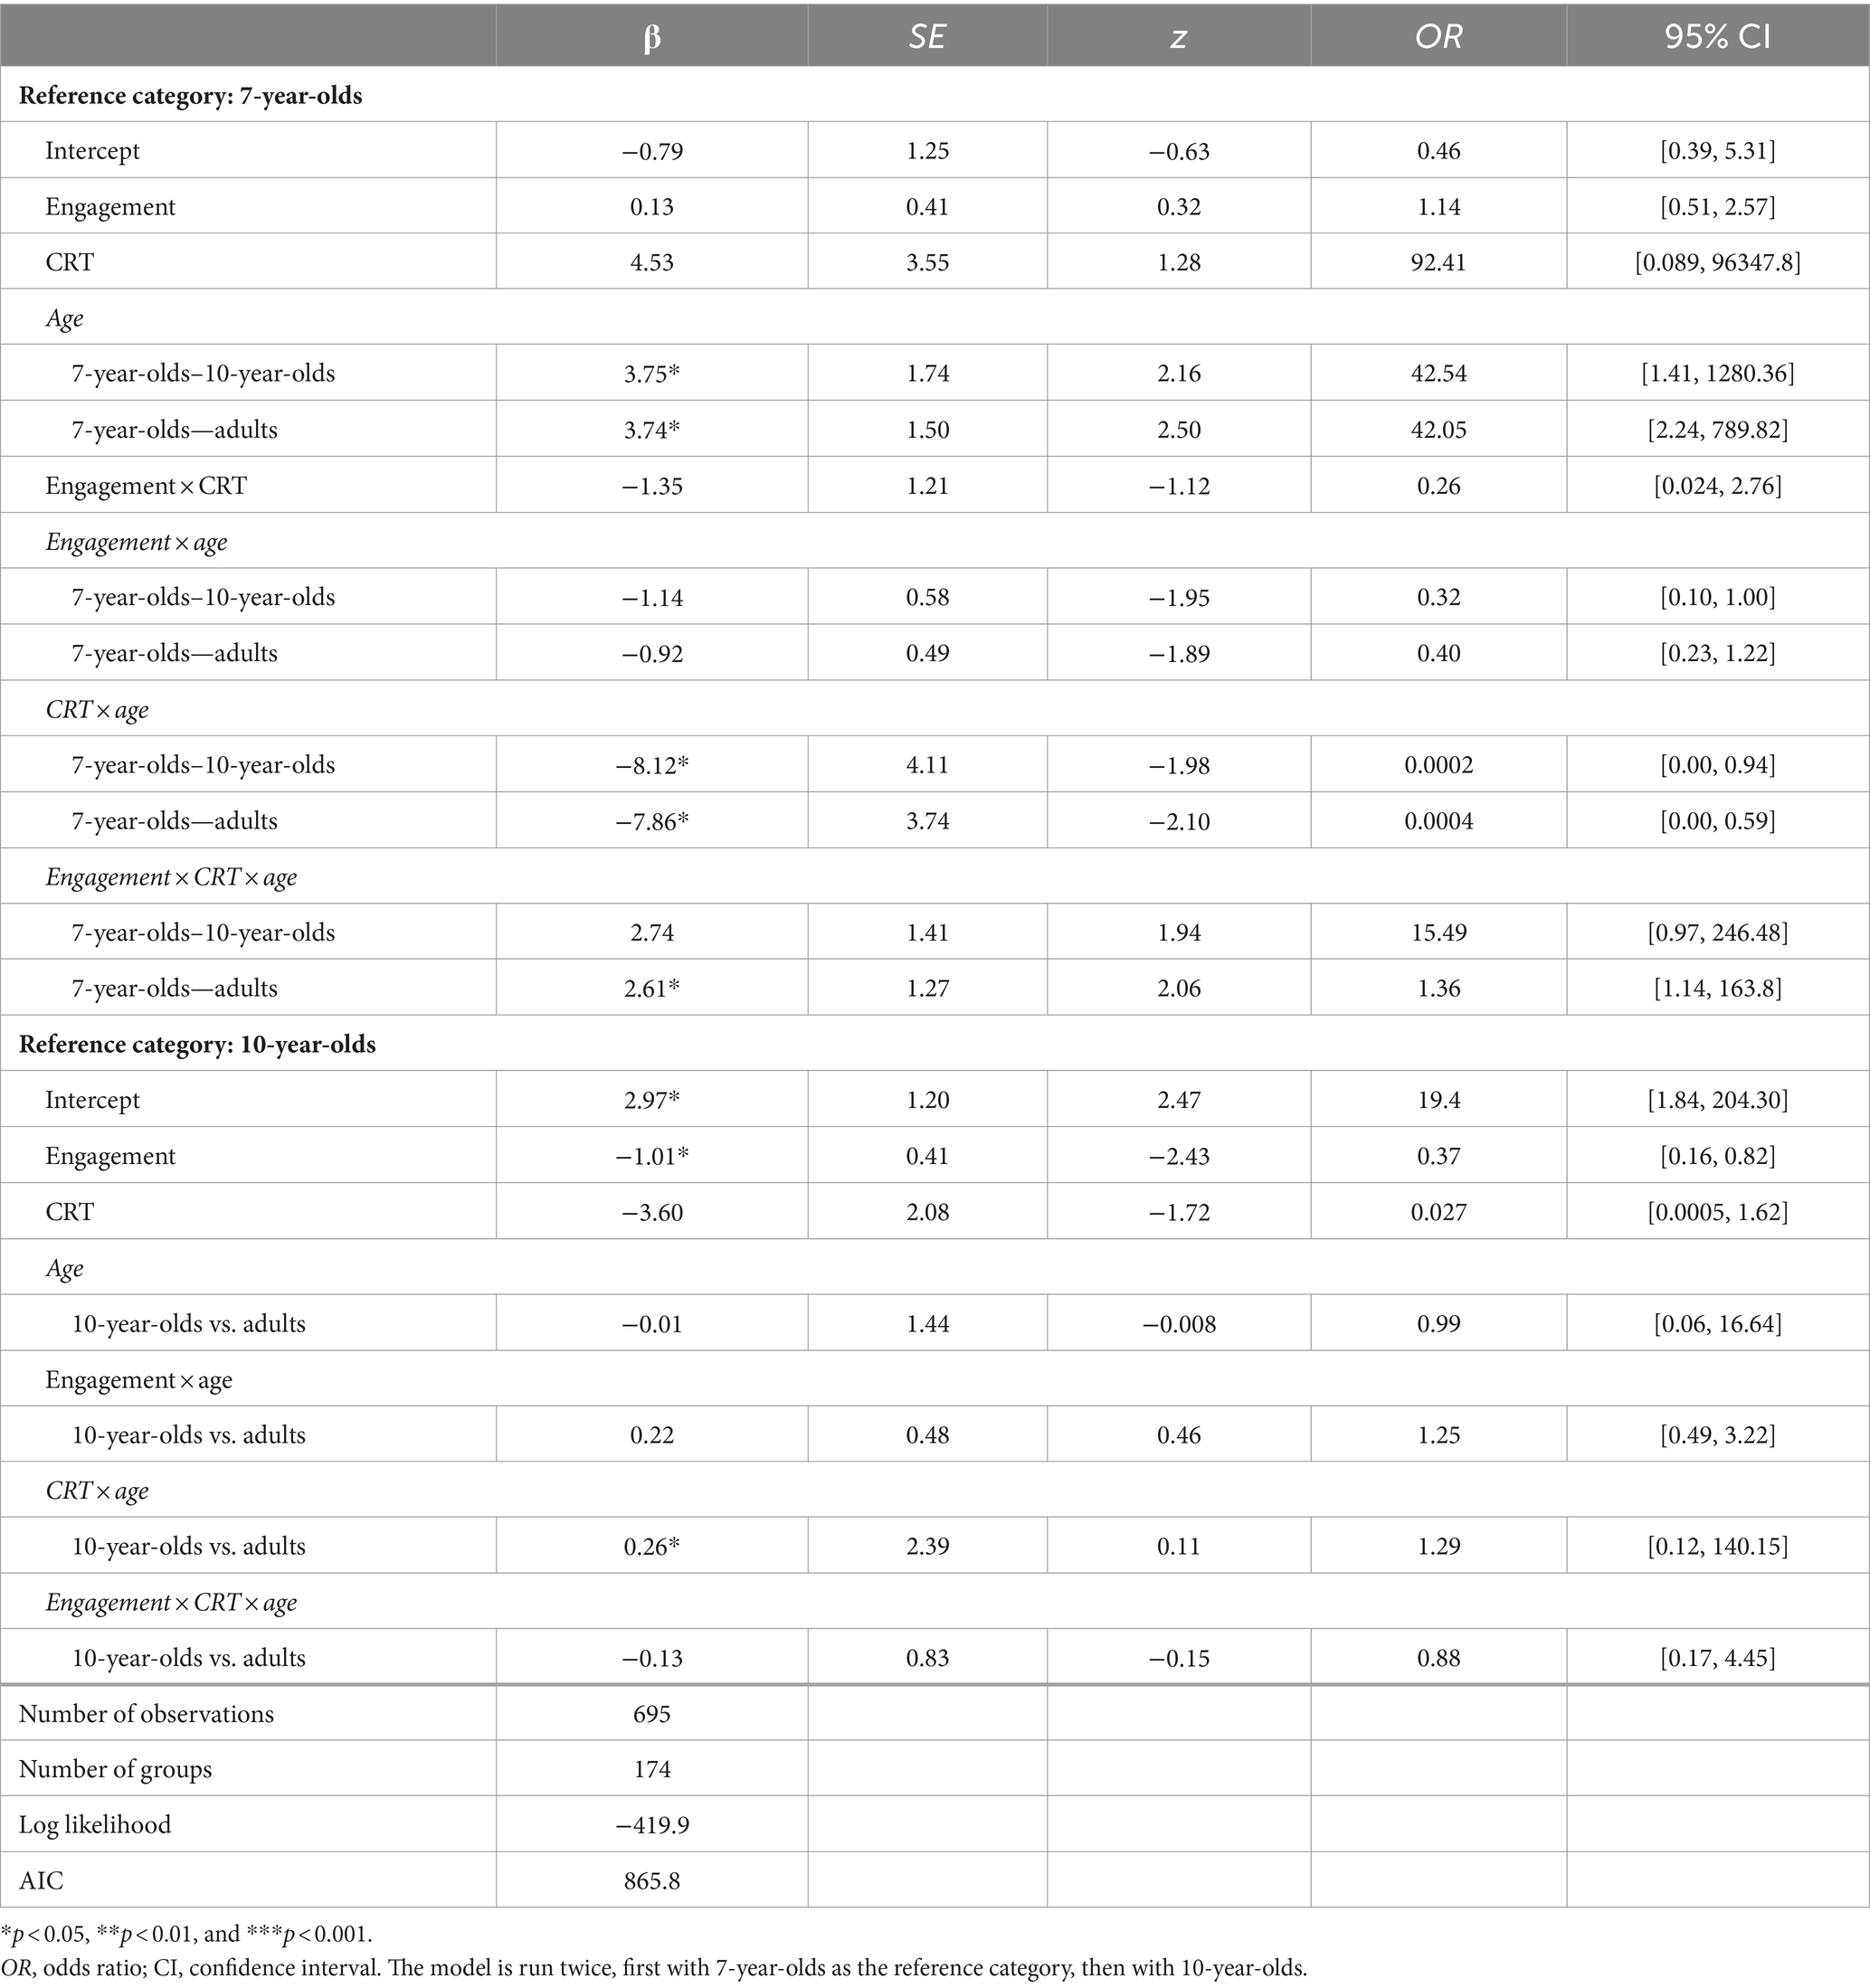
Table 7. Mixed-effects binomial logistic regression analyses for the effect of engagement, critical reasoning (CRT), and age on choice of the graphical solution.
To explore these interactions, we conducted three mixed-effects binomial logistic regressions, one per age group, on participants’ choice of the graphical solution with engagement and critical reflection as predictors and participant as the random intercept. To correct for multiple comparisons, we used a Bonferroni-corrected p-value of 0.0167 (0.05/3) for the following analyses. The full results of these models appear in the Supplementary Table A6. The model for 7-year-olds indicated no significant effects of either engagement or critical reflection. The model for 10-year-olds indicated a significant effect of engagement on data choice (β = −0.95, SE = 0.38, z = −2.55, p = 0.011). This model also showed traces of interaction between engagement and critical reflection (β = 1.36, SE = 0.67, z = 2.05, p = 0.041). The model for adults indicated significant effects of engagement (β = −0.81, SE = 0.27, z = −2.96, p = 0.003) and critical reflection (β = −3.43, SE = 1.24, z = −2.77, p = 0.006), and a significant interaction between engagement and critical reflection (β = 1.30, SE = 0.41, z = 3.17, p = 0.002). As shown in Figure 4, for adults with higher CRT scores, increased engagement predicted choosing the graphical solution. In contrast, for adults with lower CRT scores, increased engagement predicted the choice of anecdote. The beginnings of this pattern are also apparent in 10-year-olds.
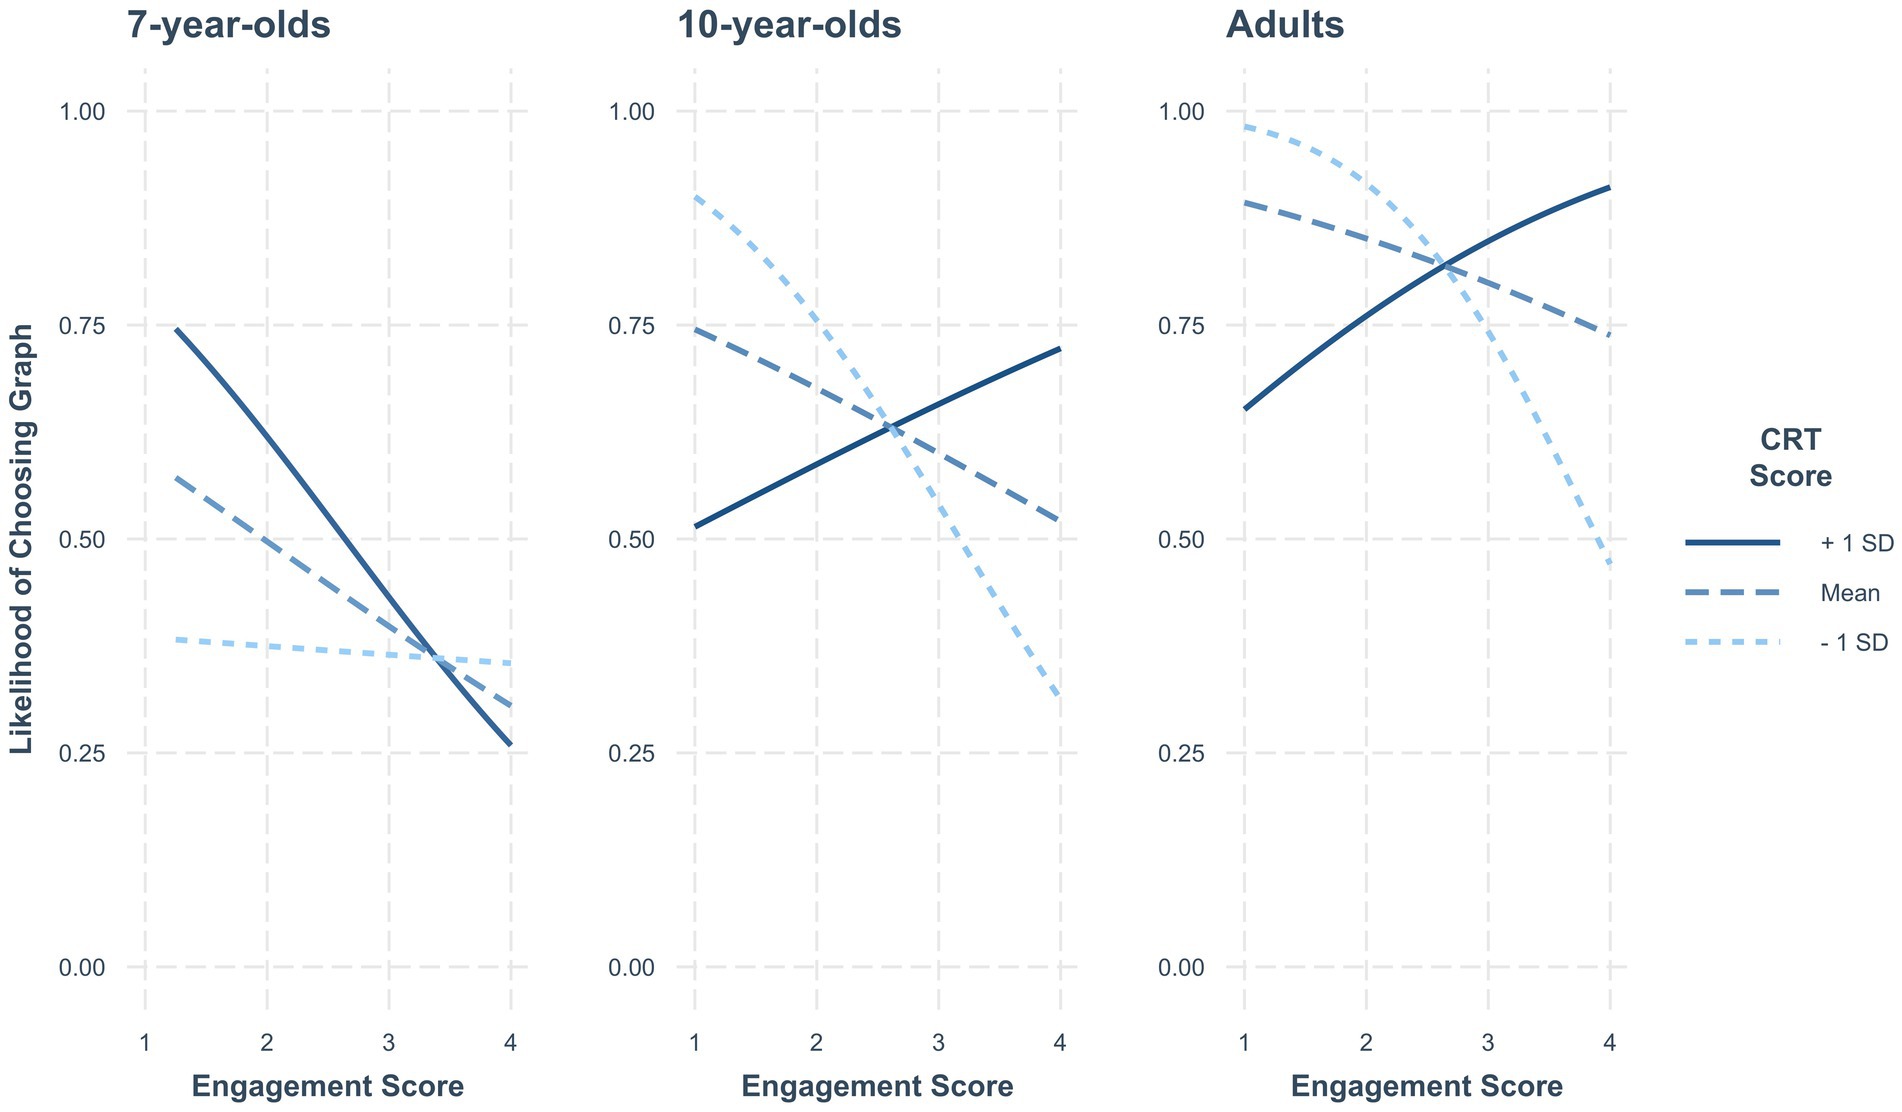
Figure 4. Interaction between engagement and cognitive reflection on graph choice.
4 Discussion
Mistaken beliefs about causal relations are revealed when anecdotal evidence is considered a more reliable source of knowledge than statistical evidence. The assumption that anecdotal evidence is generally applicable reveals a reasoning fallacy: namely, inferring a reliable causal relation between two variables when they are only associated with each other in one person’s experience. Moreover, a preference for anecdotal over statistical evidence indicates that an individual regards this inferred relation more highly than one supported by statistical evidence. Our goal in this study was to explore the origins and development of this error and to understand how participants weigh anecdotal and statistical evidence more generally. Our findings indicate that reliance on anecdotal versus statistical information in identifying solutions to everyday problems decreases with age: 7-year-olds preferred to use anecdotal evidence to determine the solutions, whereas 10-year-olds and adults preferred statistical information.
Why did younger participants favor the anecdotes? One possibility is that they were unable to understand the graphs and extract information from them. We think this is unlikely, as responses to the check questions indicated that they correctly interpreted the patterns depicted. Although our findings do not address the source of this tendency, the participants’ explanations shed light on their reasoning processes and suggest age-related differences. Both 7 and 10-year-olds, but not adults, referred to the intended cause to support their choice of the anecdote. Children often said things like, “the Rellatees made her run faster” or “Because Britt got an A when he used Bronnit,” suggesting that they inferred a causal relation between the solution used by the anecdotist and the desired outcome, and that they valued it more highly than the one supported by the statistical evidence.
Adults chose the anecdote less often, and when they did, their explanations suggested different reasons for doing so: they often referred to some aspect of the anecdotist (e.g., “Because the girl is a runner herself and is telling you the experience…”) or created an alternative cause for the outcome of the anecdote to explain their answer (e.g., “Because having something that you think might work helps your confidence”). The latter type of response was most common in the academic achievement story (involving a character who did well on a math test when they brought a lucky rock to school) and often reflected knowledge of psychological causal mechanisms underlying apparently superstitious outcomes (see Woolley et al., 2024). Future research might explore what facets of anecdotes make them more or less compelling to people of different ages. Some of these factors might include characteristics of the anecdotist (e.g., age or authority) and aspects of the relationship between the anecdotist and the participant (e.g., similarity or familiarity), as these have been shown to affect children’s processing of other aspects of testimony (see, e.g., Sobel and Kushnir, 2013).
With age, participants increasingly endorsed the solution supported by statistical evidence. Because participants were required to choose just one of the solutions, our data do not address whether the increased choice of the statistical solution was due to a greater understanding of the validity of graphs as evidence or a heightened awareness of concerns about relying on anecdotes as evidence. Again, participants’ explanations for their choices offer some insight. When participants (even 7-year-olds) chose the solution supported by statistical evidence, they were more likely to explain their choice by referring to number. However, older children were more likely to do this than younger ones. Thus, one possibility is the increased reliance on statistical versus anecdotal evidence is related to an increased sense of some aspect of numbers, perhaps the importance of a greater sample size. As one older child informed us, “Because there are a lot of people on the graph that got better, and less that did not get better. And the other one (referring to the anecdote) was just one person.”
There is also evidence that an increased ability to generate possible alternative causes may have played a role in facilitating age-related changes. When discounting the rejected choice, older children and adults, but not 7-year-olds, appeared to be attuned to alternative causes that might have been responsible for the outcome of the anecdote (e.g., “Because Jessie could also have more skill”) and for the statistical patterns (e.g., “The data from the graph could be skewed; it could just be because some runners were faster/slower than others”). These patterns suggest that an increased focus on sample size and possible alternative causal explanations might each play a role in age-related changes in the relative reliance on statistical versus anecdotal evidence.
We expected certain individual differences to affect how participants weighted anecdotal and statistical evidence. Specifically, we thought that participants who were more engaged in the narratives might be more likely to be persuaded by them, and hence more likely to choose the anecdotal solution. We also thought that participants who tended to reflect more when solving problems might be less persuaded by the anecdotes (and more attuned to the statistical information). Our findings indicated that these factors interacted in affecting solution choices. For adults with lower CRT scores, increased levels of engagement led to higher rates of endorsement of the anecdotal solution. For these participants, high narrative engagement may have facilitated persuasion by the anecdote (as in previous research on narrative transportation and experience-taking, e.g., Green and Brock, 2000; Kaufman and Libby, 2012). For adults with high CRT scores, however, increased levels of engagement with the anecdote led to higher rates of rejection of that solution—these participants were more likely to endorse the graphical solution. For these listeners, engagement with the narrative may have led to higher degrees of critical listening, resulting in skepticism about the generalizability of any causal relation suggested by the anecdote. This pattern may emerge with age: it was not yet apparent in the 7-year-olds, present at trend level in the 10-year-olds, and fully present in the undergraduates. Fostering critical thinking and reflection in education may be key to helping people learn to refrain from inferring reliable causal relations between two variables when they are only associated with each other in one person’s anecdotal experience.
It is important to note, however, that adults were not at ceiling in favoring the statistical information. Adults chose the statistical solution just 75% of the time and only 41% of adults chose it all four times. This finding is consistent with previous work revealing the persuasiveness of anecdotal information in the presence of conflicting statistical information. Research with adults indicates that a variety of factors facilitate the persuasiveness of anecdotes, including characteristics of the speaker, vividness, and emotionality (McCabe and Peterson, 1991; Baesler and Burgoon, 1994; Gustafson et al., 2020). Future work should also investigate the role of these and other factors in children’s susceptibility to the pull of anecdotes.
The current research is limited in that we focused only on situations in which anecdotal information had less validity than the alternative source. It will be important for future research to address the use of anecdotal information in all, situations including those in which it might have a unique value. Stories are a ubiquitous way by which people of all ages and cultures learn about the world (e.g., Mutonyi, 2016). From an early age, children are surrounded by stories (Hopkins and Weisberg, 2017), and even in adulthood, people spend a great deal of time engaging with narrative fiction, not just with books but with films, plays, and television shows (in the U.S., this figure is over 4 h a day; Bloom, 2010). Moreover, stories are omnipresent in human life not only throughout development but also throughout our history as a species (as evidenced by narrative cave paintings dating back 41,000 years; Aubert et al., 2019). Stories have even been argued to serve an evolutionary function—through their engaging form, they provide a medium through which cultural information can be quickly and effectively transmitted (Gottschall, 2012). Raymond Mar and colleagues have argued that we learn much of what we know about the social world through the reading of literary fiction—stories about other people (Mar and Oatley, 2008; Mar et al., 2009). The “reader’s dilemma” (Gerrig and Prentice, 1991; Hopkins and Weisberg, 2017) captures the challenge of knowing which aspects of a fictional world to import into reality and which aspects are fanciful alone. Perhaps this same challenge applies more broadly—we may also face a sort of “listener’s dilemma” as we struggle to determine what pieces of information conveyed by personal narratives apply to our lives and when.
Additional limitations of this work also provide avenues for future research. First, we included only three age groups. It will be important in future work to broaden our age range to explore what develops between the ages of 10 and adulthood. Along these lines, it is important to consider that our adults were college students, who are arguably in the process of being trained to evaluate statistical information. In future work, including a community sample of adults with varying levels of education would provide valuable information as to how education may or may not influence the age-related changes seen in this work.
Moreover, our youngest children were 7-year old, as we were constrained by the age at which children are able to extract accurate information from bar graphs. The ability to use anecdotal information is likely to emerge earlier, alongside children’s ability to extract information from stories. Future work could focus specifically on the interpretation of anecdotes, to determine what properties even younger children might find most compelling.
Additionally, the current research explored the use of anecdotal information only in the presence of conflicting statistical information. It is possible that this conflict triggered skepticism about the anecdotes (and led to the consideration of alternative causes); without this trigger, older children and adults may have been more accepting of the anecdotal information. Exploring how participants respond when only anecdotal evidence is available will address these questions and will allow us to further explore the properties of anecdotes that make them so persuasive.
Finally, we included evidence from four different domains in our study—medicine, animal behavior, athletic achievement, and academic achievement. Although there were hints in our data that participants treated these differently, our study was not designed to address such differences. We suspect that more focused explorations may reveal significant domain differences in the use of anecdotal information.
In conclusion, our findings indicate that the tendency to be persuaded by anecdotal information—demonstrated so often in adults—is also present in children as young as 7. With age, statistical information becomes more highly valued as a source of information. Justifications suggest that the decreasing reliance on anecdotes as evidence may be due to an increased understanding of sample size, and hence a greater valuation of statistical information with age. An increased tendency to generate alternative causal explanations for outcomes may also facilitate age-related changes. Our findings also show that cognitive reflection and engagement may interact to make some people more critical of anecdotal information and others less so. Because pseudoscience often relies on anecdotal information as evidence, further exploration of the factors affecting trust in anecdotal evidence is critical to fostering scientific literacy.
Data availability statement
The datasets presented in this study can be found in online repositories. The names of the repository/repositories and accession number(s) can be found at: Open Science Framework, https://osf.io/d43nu/.
Ethics statement
The studies involving humans were approved by the University of Texas at Austin IRB. The studies were conducted in accordance with the local legislation and institutional requirements. Written informed consent for participation in this study was provided by the participants’ legal guardians/next of kin.
Author contributions
JN: Conceptualization, Formal analysis, Methodology, Visualization, Writing – original draft, Writing – review & editing. JW: Conceptualization, Methodology, Supervision, Writing – original draft, Writing – review & editing.
Funding
The author(s) declare that no financial support was received for the research, authorship, and/or publication of this article.
Acknowledgments
Data collection took place at the University of Texas at Austin. The authors thank the children who participated, their parents, the staff at the Children’s Research Center, and the following undergraduate students who helped with data collection, data entry, explanation coding, and reference compilation: Ruth Esther Apura, Cameron Bates, Katherine Bos, Zachary Bricken, Emma Brunk, Amanda Cramer, Helen Ding, Matthew Finch, Julia Fishkind, Eleanor Gambrell, Amy Kim, Melanie Lown, Yao (Cloris) Lu, Candice Ma, Ashley Missimo, Jacquelyn Olivarez, Claire Perkins, Amelia Perret, Muskan Shah, Riley Shin, Jasmine Xu, and Abbi Zametz. Special thanks to Avery Simone Largent and Claire Perkins for valuable discussions at the inception of the project. Thanks are also due to members of the Imagination and Cognition lab for feedback on earlier drafts of the manuscript.
Conflict of interest
The authors declare that the research was conducted in the absence of any commercial or financial relationships that could be construed as a potential conflict of interest.
Publisher’s note
All claims expressed in this article are solely those of the authors and do not necessarily represent those of their affiliated organizations, or those of the publisher, the editors and the reviewers. Any product that may be evaluated in this article, or claim that may be made by its manufacturer, is not guaranteed or endorsed by the publisher.
Supplementary material
The Supplementary material for this article can be found online at: https://www.frontiersin.org/articles/10.3389/fdpys.2024.1324704/full#supplementary-material
References
Allen, M., and Preiss, R. W. (1997). Comparing the persuasiveness of narrative and statistical evidence using meta-analysis. Commun. Res. Rep., 14, 125–131. doi: 10.1080/08824099709388654
Aubert, M., Lebe, R., Oktaviana, A. A., Tang, M., Burhan, B., Hamrullah Jusdi, A., et al. (2019). Earliest hunting scene in prehistoric art. Nature, 576, 442–445. doi: 10.1038/s41586-019-1806-y
Baesler, E. J., and Burgoon, J. K. (1994). The temporal effects of story and statistical evidence on belief change. Commun. Res., 21, 582–602. doi: 10.1177/009365094021005002
Bloom, P. (2010). How pleasure works: the new science of why we like what we like. New York, NY: W.W. Northern.
Browne, M. (2018). Epistemic divides and ontological confusions: the psychology of vaccine skepticism. Hum. Vaccin. Immunother., 14, 2540–2542. doi: 10.1080/21645515.2018.1480244
Browne, M., Thomson, P., Rockloff, M. J., and Pennycook, G. (2015). Going against the herd: psychological and cultural factors underlying the ‘vaccination confidence gap’. PLoS One, 10,:e0132562. doi: 10.1371/journal.pone.0132562
Centers for Disease Control and Prevention . (2023). COVID data tracker. Available at: https://covid.cdc.gov/covid-data-tracker
Corriveau, K. H., Chen, E. E., and Harris, P. L. (2015). Judgments about fact and fiction by children from religious and nonreligious backgrounds. Cogn. Sci. 39, 353–382. doi: 10.1111/cogs.12138
Danovitch, J. H., Mills, C. M., Duncan, R. G., Williams, A. J., and Girouard, L. N. (2021). Developmental changes in children’s recognition of the relevance of evidence to causal explanations. Cogn. Dev., 58,:101017. doi: 10.1016/j.cogdev.2021.101017
Dobson, T., Michura, P., Ruecker, S., Brown, M., and Rodriguez, O. (2011). Interactive visualizations of plot in fiction. Vis. Lang., 45, 169–191.
Dyer, J. R., Shatz, M., and Wellman, H. M. (2000). Young children’s storybooks as a source of mental state information. Cogn. Dev., 15, 17–37. doi: 10.1016/S0885-2014(00)00017-4
English, L. D. (2018). Young children’s statistical literacy in modelling with data and chance. In A. Leavy Editor, M. Meletiou-Mavrotheris and E. Paparistodemou (Eds.), Statistics in early childhood and primary education (pp. 295–313). Springer: Singapore
Fagerlin, A., Wang, C., and Ubel, P. A. (2005). Reducing the influence of anecdotal reasoning on people’s health care decisions: is a picture worth a thousand statistics? Med. Decis. Mak., 25, 398–405. doi: 10.1177/0272989X05278931
Fitneva, S. A. (2008). The role of evidentiality in Bulgarian children’s reliability judgments. J. Child Lang., 35, 845–868. doi: 10.1017/S0305000908008799
Franklin, C., and Bargagliotti, A. (2020). Introducing GAISE II: a guideline for precollege statistics and data science education. Harvard Data Sci. Rev., 2, 1–9. doi: 10.1162/99608f92.246107bb
Frederick, S. (2005). Cognitive reflection and decision making. J. Econ. Perspect., 19, 25–42. doi: 10.1257/089533005775196732
Ganea, P. A., Ma, L., and DeLoache, J. S. (2011). Young children’s learning and transfer of biological information from picture books to real animals. Child Dev., 82, 1421–1433. doi: 10.1111/j.1467-8624.2011.01612.x
Gerrig, R. J., and Prentice, D. A. (1991). The representation of fictional information. Psychol. Sci., 2, 336–340. doi: 10.1111/j.1467-9280.1991.tb00162.x
Gervais, W. M. (2015). Override the controversy: Analytic thinking predicts endorsement of evolution. Cognition, 142, 312–321. doi: 10.1016/j.cognition.2015.05.011
Gottschall, J. (2012). The storytelling animal: how stories make us human. Boston: Houghton Mifflin Harcourt.
Green, M. C., and Brock, T. C. (2000). The role of transportation in the persuasiveness of public narratives. J. Pers. Soc. Psychol., 79,:701. doi: 10.1037/0022-3514.79.5.701
Gustafson, A., Ballew, M. T., Goldberg, M. H., Cutler, M. J., Rosenthal, S. A., and Leiserowitz, A. (2020). Personal stories can shift climate change beliefs and risk perceptions: the mediating role of emotion. Commun. Rep., 33, 121–135. doi: 10.1080/08934215.2020.1799049
Harris, P. L., Koenig, M. A., Corriveau, K. H., and Jaswal, V. K. (2018). Cognitive foundations of learning from testimony. Annu. Rev. Psychol., 69, 251–273. doi: 10.1146/annurev-psych-122216-011710
Hopkins, E. J., and Weisberg, D. S. (2017). The youngest readers’ dilemma: a review of children’s learning from fictional sources. Dev. Rev., 43, 48–70. doi: 10.1016/j.dr.2016.11.001
Hornikx, J. (2005). A review of experimental research on the relative persuasiveness of anecdotal, statistical, causal, and expert evidence. Stud. Commun. Sci., 5, 205–2016.
Hornsey, M. J., Harris, E. A., and Fielding, K. S. (2018). Relationships among conspiratorial beliefs, conservatism and climate scepticism across nations. Nat. Clim. Chang., 8, 614–620. doi: 10.1038/s41558-018-0157-2
Kaminski, J. A., and Sloutsky, V. M. (2013). Extraneous perceptual information interferes with children's acquisition of mathematical knowledge. J. Educ. Psychol., 105, 351–363. doi: 10.1037/a0031040
Kaufman, G. F., and Libby, L. K. (2012). Changing beliefs and behavior through experience-taking. J. Pers. Soc. Psychol., 103, 1–19. doi: 10.1037/a0027525
Kazoleas, D. C. (1993). A comparison of the persuasive effectiveness of qualitative versus quantitative evidence: a test of explanatory hypotheses. Commun. Q., 41, 40–50. doi: 10.1080/01463379309369866
Kelemen, D., Emmons, N. A., Seston Schillaci, R., and Ganea, P. A. (2014). Young children can be taught basic natural selection using a picture-storybook intervention. Psychol. Sci., 25, 893–902. doi: 10.1177/0956797613516009
Kubin, E., Puryear, C., Schein, C., and Gray, K. (2021). Personal experiences bridge moral and political divides better than facts. Proc. Natl. Acad. Sci. U.S.A., 118, 1–9. doi: 10.1073/pnas.2008389118
Lack, C. W., and Rousseau, J. (2016). Critical thinking, science, and pseudoscience: why we can’t trust our brains. New York, NY: Springer Publishing Company.
Lane, J. D., and Harris, P. L. (2014). Confronting, representing, and believing counterintuitive concepts: navigating the natural and the supernatural. Perspect. Psychol. Sci., 9, 144–160. doi: 10.1177/1745691613518078
Lane, J. D., Ronfard, S., and El-Sherif, D. (2018). The influence of first-hand testimony and hearsay on children's belief in the improbable. Child Dev., 89, 1133–1140. doi: 10.1111/cdev.12815
Lilienfeld, S. O., Lynn, S. J., and Lohr, J. M. (Eds.). (2014). Science and pseudoscience in clinical psychology (2). New York: Guilford.
Mar, R. A., and Oatley, K. (2008). The function of fiction is the abstraction and simulation of social experience. Perspect. Psychol. Sci., 3, 173–192. doi: 10.1111/j.1745-6924.2008.00073.x
Mar, R. A., Oatley, K., and Peterson, J. B. (2009). Exploring the link between reading fiction and empathy: ruling out individual differences and examining outcomes. Communications, 34, 407–428. doi: 10.1515/COMM.2009.025
Mares, M.-L., and Acosta, E. E. (2008). Be kind to three-legged dogs: children’s literal interpretations of TV's moral lessons. Media Psychol., 11, 377–399. doi: 10.1080/15213260802204355
Mares, M.-L., Bonus, J. A., and Peebles, A. (2022). Love or comprehension? Exploring strategies for children’s prosocial media effects. Commun. Res., 49, 763–791. doi: 10.1177/0093650218797411
Matsui, T., and Fitneva, S. A. (2009). Knowing how we know: evidentiality and cognitive development. New Dir. Child Adolesc. Dev., 2009, 1–11. doi: 10.1002/cd.246
McCabe, A., and Peterson, C. (Eds.). (1991). Developing narrative structure. Hillsdale, NJ: Erlbaum.
Merriam-Webster . (n.d.). Anecdote. Available at: https://www.merriam-webster.com/dictionary/anecdote
Michal, A. L., Zhong, Y., and Shah, P. (2021). When and why do people act on flawed science? Effects of anecdotes and prior beliefs on evidence-based decision-making. Cogn. Res. Princ. Implic., 6, 1–23. doi: 10.1186/s41235-021-00293-2
Moran, M. B., Lucas, M., Everhart, K., Morgan, A., and Prickett, E. (2016). What makes anti-vaccine websites persuasive? A content analysis of techniques used by anti-vaccine websites to engender anti–vaccine sentiment. J. Commun. Healthc., 9, 151–163. doi: 10.1080/17538068.2016.1235531
Mutonyi, H. (2016). Stories, proverbs, and anecdotes as scaffolds for learning science concepts. J. Res. Sci. Teach., 53, 943–971. doi: 10.1002/tea.21255
Pennycook, G., Fugelsang, J. A., and Koehler, D. J. (2015). Everyday consequences of analytic thinking. Current Directions in Psychological Science, 24, 425–432. doi: 10.1177/0963721415604
Pennycook, G., and Rand, D. G. (2020). Who falls for fake news? The roles of bullshit receptivity, overclaiming, familiarity, and analytic thinking. J. Pers., 88, 185–200. doi: 10.1111/jopy.12476
Phillips, R. J. (1997). Can juniors read graphs? A review and analysis of some computer-based activities. J. Inf. Technol. Teach. Educ., 6, 49–58. doi: 10.1080/14759399700200005
R Core Team . (2022). R: A language and environment for statistical computing. R Foundation for Statistical Computing, Vienna, Austria. URL https://www.R-project.org/
Rodriguez, F., Rhodes, R. E., Miller, K. F., and Shah, P. (2016). Examining the influence of anecdotal stories and the interplay of individual differences on reasoning. Think. Reason., 22, 274–296. doi: 10.1080/13546783.2016.1139506
Rottman, J., Zizik, V., Minard, K., Young, L., Blake, P. R., and Kelemen, D. (2020). The moral, or the story? Changing children’s distributive justice preferences through social communication. Cognition, 205,:104441. doi: 10.1016/j.cognition.2020.104441
Schäfer, M. S., Mahl, D., Füchslin, T., Metag, J., and Zeng, J. (2022). From hype cynics to extreme believers: typologizing the Swiss population’s COVID-19-related conspiracy beliefs, their corresponding information behavior, and social media use. Int. J. Commun., 16, 2885–2910.
Shelby, A., and Ernst, K. (2013). Story and science. Hum. Vaccin. Immunother., 9, 1795–1801. doi: 10.4161/hv.24828
Shtulman, A., and McCallum, K. (2014). Cognitive reflection predicts science understanding. Proceedings of the 36th Annual Conference of the Cognitive Science Society, 2937–2942.
Sobel, D. M., and Kushnir, T. (2013). Knowledge matters: how children evaluate the reliability of testimony as a process of rational inference. Psychol. Rev., 120, 779–797. doi: 10.1037/a0034191
Taylor, S. E., and Thompson, S. C. (1982). Stalking the elusive “vividness” effect. Psychol. Rev., 89, 155–181. doi: 10.1037/0033-295X.89.2.155
Vaden, V. C., and Woolley, J. D. (2011). Does god make it real? Children’s belief in religious stories from the Judeo-Christian tradition. Child Dev., 82, 1120–1135. doi: 10.1111/j.1467-8624.2011.01589.x
Vezzali, L., Stathi, S., Giovannini, D., Capozza, D., and Trifiletti, E. (2015). The greatest magic of Harry Potter: reducing prejudice. J. Appl. Soc. Psychol., 45, 105–121. doi: 10.1111/jasp.12279
Walker, C. M., Gopnik, A., and Ganea, P. A. (2015). Learning to learn from stories: children’s developing sensitivity to the causal structure of fictional worlds. Child Dev., 86, 310–318. doi: 10.1111/cdev.12287
Walker, C. M., and Lombrozo, T. (2017). Explaining the moral of the story. Cognition, 167, 266–281. doi: 10.1016/j.cognition.2016.11.007
Woolley, J. W., Baca, P., and Kelley, K. A. (2024). Development of a naïve theory of superstition. J. Cogn. Dev. 25, 27–45. doi: 10.1080/15248372.2023.2256871
Woolley, J. D., and Cox, V. (2007). Development of beliefs about storybook reality, Dev. Sci., 10, 681–693. doi: 10.1111/j.1467-7687.2007.00612.x
Woolley, J. D., and Ghossaniy, M. E. (2013). Revisiting the fantasy-reality distinction: children as naïve skeptics. Child Dev., 84, 1496–1510. doi: 10.1111/cdev.12081
Woolley, J. D., Nissel, J., and Gilpin, A. T. (2021). Children’s use of testimony to determine reality status. Child Dev., 92, e317–e328. doi: 10.1111/cdev.13500
Young, A. G., Powers, A., Pilgrim, L., and Shtulman, A. (2018). Developing a cognitive reflection test for school-age children. Proceedings of the 40th Annual Conference of the Cognitive Science Society.
Young, A. G., and Shtulman, A. (2020). Children’s cognitive reflection predicts conceptual understanding in science and mathematics. Psychol. Sci., 31, 1396–1408. doi: 10.1177/0956797620954449
Keywords: cognitive development, pseudoscience, causal reasoning, anecdotal evidence, statistical evidence
Citation: Nissel J and Woolley JD (2024) Anecdata: children’s and adults’ evaluation of anecdotal and statistical evidence. Front. Dev. Psychol. 2:1324704. doi: 10.3389/fdpys.2024.1324704
Edited by:
Rachel L. Severson, University of Montana, United StatesReviewed by:
Josh Rottman, Franklin & Marshall College, United StatesAna Raquel Costa Aguiar, Polytechnic Institute of Viana do Castelo, Portugal
Copyright © 2024 Nissel and Woolley. This is an open-access article distributed under the terms of the Creative Commons Attribution License (CC BY). The use, distribution or reproduction in other forums is permitted, provided the original author(s) and the copyright owner(s) are credited and that the original publication in this journal is cited, in accordance with accepted academic practice. No use, distribution or reproduction is permitted which does not comply with these terms.
*Correspondence: Jenny Nissel, bmlzc2VsQGJ1LmVkdQ==; Jacqueline D. Woolley, d29vbGxleUBhdXN0aW4udXRleGFzLmVkdQ==