 Paola Maria Cutroneo1
 Daniele Sartori2
 Marco Tuccori3*
 Salvatore Crisafulli4
 Vera Battini5
 Carla Carnovale5
 Concetta Rafaniello6
 Annalisa Capuano6
 Elisabetta Poluzzi7
 Ugo Moretti4
 Emanuel Raschi7
- 1Sicily Pharmacovigilance Regional Centre, University Hospital of Messina, Messina, Italy
- 2Uppsala Monitoring Centre, Uppsala, Sweden
- 3Unit of Adverse Drug Reaction Monitoring, University Hospital of Pisa, Pisa, Italy
- 4Department of Medicine, University of Verona, Verona, Italy
- 5Department of Biomedical and Clinical Sciences, Pharmacovigilance & Clinical Research, International Centre for Pesticides and Health Risk Prevention, ASST Fatebenefratelli-Sacco, Università degli Studi di Milano, Milan, Italy
- 6Department of Experimental Medicine, Section of Pharmacology “L. Donatelli”, University of Campania “Luigi Vanvitelli”, Napoli, Italy
- 7Department of Medical and Surgical Sciences, Pharmacology Unit, Alma Mater Studiorum, University of Bologna, Bologna, Italy
Spontaneous reporting systems remain pivotal for post-marketing surveillance and disproportionality analysis (DA) represents a recognized approach for early signal detection. Although DAs cannot be used per se as a standalone approach to assess a drug-related risk and cannot replace clinical judgment in the individual patient, their role remain irreplaceable for rapid detection of rare and unpredictable adverse drug reactions with strong drug-attributable component (e.g., designated medical events), especially when developed by a multidisciplinary team and combined with a careful case-by-case analysis (individual inspection of reports for causality assessment or to uncover reporting patterns and clinical features). In the recent past, a remarkable increase in publications of pharmacovigilance studies using DAs was observed, albeit the quality was debated: several publications contained “spin”, namely, misinterpretation of results to infer causality, calculate incidence, or provide risk stratification, which may ultimately result in unjustified alarm. The development of dedicated Guidelines by the international READUS-PV project (https://readus-statement.org/) will allow reproducible and transparent publication of accurate DAs, thus supporting their real transferability and exploitation by regulators and clinicians. This review offered a perspective on methodological aspects (and understanding) of DAs, their rationale, design, reporting, and interpretation.
1 Background
Disproportionality analysis (DA) in spontaneous reporting databases of adverse drug reactions (ADRs) refers to validated quantitative methods used for signal detection in pharmacovigilance. Box 1 summarizes the most frequently used measures of disproportionality and the formulae for their calculation. DA methods allow to detect higher reporting frequencies of specific drug-event combinations in comparison with general reporting frequencies detected in a reference dataset which usually consist of the overall database (Bate and Evans, 2009; Hauben and Bate, 2009; Candore et al., 2015; European Medicine Agency, 2017). What is considered statistically disproportionate is determined by what might be expected by chance and, in case of spontaneous reporting databases, it could be derived from the proportionate representation of all of the reported drug-event combinations in the entire database (ICH. International, 2023). For instance, frequentist DA methods (i.e., proportional reporting ratio—PRR; reporting odds ratio—ROR), based on a 2 × 2 contingency table (Box 1), relate the observed count of a drug-event combination with an “expected value” extrapolated from the counts of all other drugs and adverse events (AEs) in the database (full data reference set as primary reference group) (Evans et al., 2001; Rothman et al., 2004). An example of Bayesian method is the Information component (IC) which is defined as the logarithm of the ratio of the observed rate of a specific AE to the expected rate of AE under the null hypothesis of no drug-AE association (Box 1) (Bate et al., 1998). When correctly interpreted, these measures can be very useful for generating hypotheses about unknown adverse drug reactions warranting further investigation to be validated as safety signals (Bate and Evans, 2009; Hauben and Aronson, 2009). However, DA measures cannot estimate risks or necessarily account for a causal association but only facilitate the identification of AE supposed to have a higher-than-expected reporting frequency.
Box 1 Most frequently used disproportionality methods
Frequentist methods
Proportional Reporting Ratio (PRR) (Evans et al., 2001), Reporting Odds Ratio (ROR) (Rothman et al., 2004)
These methods are based on a 2 x 2 contingency table that relates the observed number of a drug-AE combination of interest to all other drugs and events in the database, which together constitute the background.
| Adverse event of interest (Y) | Other adverse events | Total | |
|---|---|---|---|
| Using drug of interest (X) | A | B | (a+b) |
| Using other drugs | C | D | (c+d) |
| Total | (a+c) | (b+d) | (a+b+c+d) |
When examining a combination of drug (X) and adverse event (Y) combination in spontaneously reported data a ‘two by two’ contingency table can be created, including the numbers of reports for the combination of interest. The first row contains the observed number of reports of drug X and adverse event Y of interest (“a”); the next displays the number of reports of other adverse events attributed to drug X (“b”, except the event of interest); the second row represents the number of reports describing the AE of interest Y for all other drugs in the database (“c”, except the drug X); lastly, “d” stands for all other reports attributed to all other medications and other AEs in the database. The conditions for detecting a signal of disproportionate reporting (SDR) are defined below.
Statistical threshold based on 95% confidence interval (CI)
– Lower bound 95% CI >1; – Number of reports ≥3 (or ≥5)*
1. Using 95% confidence interval (95% CI)
– Lower bound 95% CI >1; – Number of reports ≥3* (or ≥5)*
2. Using chi-square statistic (with Yates’s correction)
– PRR ≥2; – Chi-square ≥4; – Number of reports ≥3
* These thresholds are most frequently used, although the minimum number of cases can be modified depending on different aspects, including the database and the drug/event under investigation (Slattery et al., 2013)
Bayesian statistics
Information Component (IC) (Bate et al., 1998; Norén et al., 2013)
IC represents a measure of disproportionality that compares the observed and the expected reporting of a drug-AE combination. The IC value is calculated using a logarithmic scale, with a value of zero indicating that the observed number of reports for a drug-ADR pair is equal to the expected rate of reporting for all drug-event combinations in the database. A positive IC value, that usually requires that the lower 95% CI of the IC exceed zero, indicates that a specific drug-AE combination is reported more frequently than expected, suggesting a safety signal. The higher the IC value, the more prominently the combination distinguished itself from the background. The IC is given by the following expression:
IC025 = lower limit 95% confidence interval. If the IC value increases over time, and the IC025 value is positive, this suggests a correlation between the drug and the AE.
Multi-item Gamma-Poisson-Shrinker (MGPS) Algorithm (Szarfman et al., 2002; Gould, 2003; Hauben and Bate, 2009)
The Multi-item Gamma-Poisson-Shrinker (MGPS) algorithm is an empirical Bayesian method that matches the observed and the expected counts of specific drug-event combinations.
The MGPS algorithm produces adjusted relative reporting ratios, also referred to as Empirical Bayes Geometric Mean (EBGM) values. For each drug-event combination in the database, a Relative Reporting Ratio (RR) is defined as the observed count (N) divided by the expected count (E), N/E, for any adverse event associated with a specific drug in comparison to all other drugs and adverse events in the entire database. The expected counts (E) are computed using a stratified, full-independence model. This model aids in identifying potential drug-event associations that deviate significantly from what would be expected under the assumption of no association.
Furthermore, the MGPS calculates two-sided 90% confidence intervals (EB05 and EB95) for these EBGM scores. EB05 greater than or equal to 2 is used as a threshold in data mining to identify signals.
DA findings requires cautious interpretation, assessments of the risk of bias, and consideration for alternative explanations other than causal association between the drug and the AE (Mouffak et al., 2021). Indeed, clinical assessment (qualitative analysis) remains essential before drawing any causal inference from DA measures. Consequently, DA are insufficient to confirm safety signals and rarely support regulatory decisions on their own. In this regard, several published reviews and some official documents issued by regulatory agencies proposed key requirements for spontaneous reporting analyses (ENCePP, 2013; Wisniewski et al., 2016; European Medicine Agency, 2017).
Despite these premises, a growing literature based on disproportionality methods claims to identify and confirm associations between a given drug and a given adverse reaction, by presenting all the DA results without adequate clinical evaluation for confirmation (Sartori et al., 2023). Most of these studies derive from open-access pharmacovigilance databases and the relevant public dashboard, characterized by significant restrictions in performing both quantitative and qualitative analyses (Fouretier et al., 2016). Their results could often be misinterpreted because of spins, such as the use of causal language or the inappropriate extrapolation of definite safety risks referring to DA findings taken alone (Mouffak et al., 2021). This tendency of inappropriately using and interpreting spontaneous reporting data and DAs to make claims on causal inference or estimate about the incidence or prevalence of ADRs, and to compare the safety profiles of different drugs has been called “pharmacovigilance syndrome” (Greenblatt, 2015).
In the light of this phenomenon, this narrative review is aimed at: a) clarifying the meaning of signal and DA; b) illustrating the role and positioning of DA in the signal management process; c) illustrating elements of signal validation that are essential integration of measure of disproportionality; d) describing the rationale and the possible research questions that DA can address; e) discussing the possible interpretations and implications of statistically-significant disproportionality; and f) identifying some contexts where DA may have been used inappropriately or was insufficient to assess drug safety issues.
This review relies on research experience of the authors (Raschi et al., 2019a; Sultana et al., 2019) and should not be intended as systematic, but rather represents the result of recent scientific debate among members of the Italian Chapter of the International Society of Pharmacovigilance (https://isoponline.org/chapters/italy/).
2 Signals, signals of disproportionate reporting, and risks
In 2009 the Council for International Organizations of Medical Sciences adopted Hauben and Aronson’s definition of a “signal of suspected causality” as: “Information that arises from one or multiple sources (including observations and experiments), which suggests a new potentially causal association, or a new aspect of a known association, between an intervention and an event or set of related events, either adverse or beneficial, which would command regulatory, societal or clinical attention, and is judged to be of sufficient likelihood to justify verificatory and, when necessary, remedial actions” (Hauben and Aronson, 2009).
The same authors (Hauben and Aronson, 2009) further distinguish “signal of suspected causality,” or more easily “signal”, from “signal of disproportionate reporting” (SDR), defining the latter as “numerical output of disproportionality analysis.” Having drawn the distinction between signals and SDRs, in the interest of appropriate use of terminology, it is indispensable (Raschi et al., 2016a) the concept of SDR be disentangled from that of “risk of harm,” that is: “the combination of the probability of occurrence of harm and the severity of that harm” (ICH. International, 2023). SDRs are probabilistic computations of reporting frequencies (observed vs. expected ratios) that quantify the likelihood of reporting suspected ADRs to a database. On the other hand, risks of harm are probabilistic estimates of the occurrence of one or more ADRs in a target population. Although few studies showed a weak correlation between SDRs and relative risk for known association, results from DA, even when conducted appropriately, cannot automatically translate to actual risk of harm (see Section 7.1) (Maciá-Martínez et al., 2016; Beau-Lejdstrom et al., 2019; Gatti et al., 2021a; Khouri et al., 2021a). Beyond terminology alone, it is imperative to refer to any findings from DAs as SDRs, and not as “risks,” to favor transparency of reporting results and avoid the so-called spin (Mouffak et al., 2021). SDRs and signals fit within the frame of signal management, i.e., the set of activities performed to determine whether there are new risks of harm, or whether there are new aspects of known risks of harm, associated with a medicinal product (European Medicine Agency, 2017).
3 Position of signal detection and signal validation in the signal management process: the role of signals of disproportionate reporting
Disproportionality analysis is typically employed in the earliest stage of signal management in databases of reports of suspected ADRs (signal detection). Whether applied to large or small databases (≥500 reports) (Caster et al., 2020), DA will give rise to false positives, the rate of which depends on the methods used (Harpaz et al., 2017; Pham et al., 2019) and the pre-established thresholds that define an SDR (Candore et al., 2015). Although there are means to curtail the rate of false positives, such as sensitivity analyses including background (Grundmark et al., 2014) or subgrouping/stratification (Hopstadius et al., 2008), the high resources required to follow-up all detected SDRs (Alvarez et al., 2010) solidify the role of DA as a first-pass screening method.
Signal validation—subsequent to signal detection—is the step of the process ensuring that a) the information on the suspected ADR is novel; b) the statistical findings hold when accounting for the strength of the evidence in the reports—among other aspects (European Medicine Agency, 2017). In practice, signal validation entails verifying whether SDRs are included in regulatory documents (e.g., risk management plans, periodic safety update reports) or reference materials (e.g., Summaries of Products Characteristics, SmPCs). Most importantly, signal validation requires a clinical review of the reports that, through the detection phase, numerically supported the SDRs. Such a review is concerned with ensuring that the data are of sufficient quality to allow for signal assessment, that the reports share similar clinical characteristics, or, more broadly, that they suggest causality according to, for example, the viewpoints of Bradford Hill (HILL, 1965; European Medicine Agency, 2017). In summary, to make the best use of available resources, detected SDRs require clinical review of the reports (Wisniewski et al., 2016). Examples of works that combine DA with a clinical review of reports may be found (de Jong et al., 2012; Tarapués et al., 2013; Viola et al., 2014; Béné et al., 2016; Valdiserra et al., 2023).
In Figure 1, we report a schematic representation of the process of signal management and the position of signal detection and signal validation steps. In the next paragraphs we discuss in detail two essential steps of signal management that pertain SDRs that the researchers might consider and discuss, namely, novelty and strength of evidence.
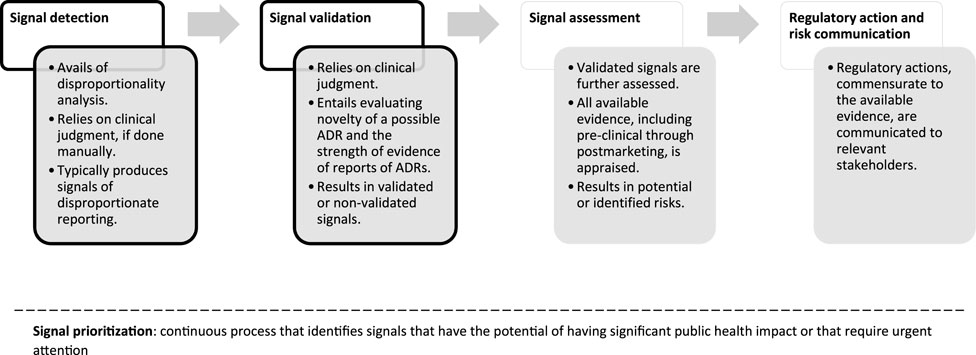
Figure 1. Flowchart of signal management, simplified and applied to reports of suspected ADRs. For a complete overview of the process, please see Good Vigilance Practices Module IX (European Medicine Agency, 2017). Throughout the phases of signal management, signals are continuously prioritized within signal prioritization. Shape borders in black indicate the steps that are most relevant to signals of disproportionate reporting.
4 Integrating measures of disproportionality with clinical and pharmacological assessments
4.1 Checking the novelty of the suspected adverse drug reaction
As mentioned above, the novelty of a suspected ADR should be checked after the detection of an SDR. Again, from the definition of signal, one should be concerned with the suggestion of a new potentially causal association or new aspects of a known one. The reader might rightfully ask: “New to whom?”.
Healthcare professionals, researchers, or regulators might find an ADR to be new: healthcare professionals may have never encountered it in their practice; researchers might detect an SDR for the first time in a database; and regulators might not have included the ADR in relevant SmPCs. In European guidelines, novelty of an ADR refers to the latter kind of scenario. Practically speaking, ensuring that a detected association is new involves checking its presence in SmPCs or critically reviewing these documents (Lindquist et al., 2000; Scholl and van Puijenbroek, 2012; Raschi et al., 2015). The underlying assumption of this approach is that regulatory documents are evidence-based, are used as reference materials in clinical practice, and have legal value. Notably, only the last statement is true: indeed, a number of ADRs are listed in the SmPCs only cautiously, without actual evidence of causal association, and health professionals rarely use SmPC as reference for their clinical decisions (McMahon and Preskorn, 2014).
Nevertheless, the SmPC currently still represents an objective and easy-to-access reference for assessing the novelty of a signal. Another barrier to the use of SmPC is the lack of established methods to determine whether detected associations match or diverge from the contents of SmPCs. As these supports include ADRs or AEs coded to the Medical Dictionary for Regulatory Activities (MedDRA), an automatic approach might be able to verify that the MedDRA term under study is present or not from the SmPCs. However, compared to its use in signal detection MedDRA is going to be applied conceptually differently in SmPCs; for healthcare professionals to make the best use of them, clinically related terms are going to be encapsulated in single expressions: the MedDRA Labelling Groupings (Große-Michaelis et al., 2023). One such example might be the MedDRA Preferred Terms “acute kidney injury” and “subacute kidney injury” subsumed under “acute kidney injury” in an SmPC. Moreover, SmPCs contain inconsistencies at a national level, across products in different (Sawalha et al., 2008; Al-Aqeel, 2012) or the same (Savill and Bushe, 2012) therapeutic class, or at an international one (Alloza and Lasagna, 1983; Pfistermeister et al., 2013; Lee et al., 2014; Noh et al., 2018). These inconsistencies also extend to expressions relating to drug-drug interactions (Jeong et al., 2019), or even to comparisons between generics vs. reference products (Sillo et al., 2018). Thus, the mere absence of a MedDRA term from the SmPC might not necessarily engender novelty. Instead, clinical reasoning ought to guide the assessment of novelty of an SDR, coupled with an appropriate choice of SmPCs to consult, which should account for their inconsistencies.
Considering the aforementioned challenges and limitations in the critical analysis of SmPCs, researchers should consider additional sources to check the novelty of an SDR, for instance by performing a structured literature review (e.g., an overview of systematic reviews) that require harder efforts, but may provide a more reliable support to the prioritization of SDR with likely clinical relevance (Raschi et al., 2019b).
4.2 Strength of evidence of the supporting reports
If an SDR has been deemed as novel, signal validation prescribes that the reports in its support be clinically reviewed. It would be beyond the scope of this work to provide a detailed guide on how to clinically review reports; readers should be mindful that there are no gold standards for these activities but the possible methods to assess causality in single or series of reports have been published elsewhere (Agbabiaka et al., 2008). Irrespective of methods used to appraise the reports, case narratives are an essential section to review. Not only case narratives have been weighed in semi-qualitative signal detection methods (Caster et al., 2014), but they have been found to provide information on medical history, and time course and diagnostic work-up of suspected ADRs (Szarfman et al., 2006; Klepper and Edwards, 2011). For reports submitted by patients, it was also possible to better understand changes to their quality of life (Inácio et al., 2018; Watson et al., 2018).
The necessity of a clinical review of the case narratives brings about an important aspect to consider when conducting DA, that is the availability of the data themselves. While the structured fields of raw exports of databases such as the Food and Drug Administration Adverse Events Reporting System (FAERS) are accessible online, narratives are sensitive information that require anonymization to ensure safekeeping of patients’ privacy and are not publicly available. Therefore, to carry out a thorough signal validation, it may be necessary to obtain narratives through Freedom of Information Act Requests, submitted to the competent regulatory agency or authority, when these data are unavailable to the researcher (US national Archives, 2023).
5 Rationale for conducting a disproportionality analysis
More than 10 years ago, the British Journal of Clinical Pharmacology opened the debate on the strengths and limitations of DAs, thus challenging, for the first time, the issue of publishing relevant results in medical journals (De Boer, 2011; Montastruc et al., 2011).
A key overlooked aspect is represented by the rationale and actual added value of a DA for the various stakeholders. In other words: “which kinds of research questions can be addressed by a DA?”. Of note, notwithstanding a remarkable increase in published DAs in recent years from academia (Sartori et al., 2023), most of them remains unnoticed by regulators and not corroborated by subsequent research (Dhodapkar et al., 2022). The availability of already published pharmacoepidemiological and/or spontaneous reporting data should be carefully taken into account before planning a DA, to avoid research waste and redundancies. In particular, the question arises on the actual added value of a newer but similar pharmacovigilance study using the same spontaneous reporting system. Reproducibility is vital in modern pharmacovigilance, especially when dealing with the FAERS archive, which requires extensive data processing and curation (see Section 6) before conducting a DA. In our opinion, replication studies are welcome, provided that they are carefully planned to offer an additional complementary perspective, for instance by providing a case-by-case analysis or by accounting for previously unrecognized biases to increase the robustness of a signal.
Moreover, the type of drugs and/or safety issues under investigation may drive the choice of the most appropriate pharmacovigilance data source. An appraisal of signals identified by the FDA from the FAERS concluded that DAs are effective for: 1) early detection of post-marketing risks with new drugs (namely, those with less than 5 years on the market), likely related to the so-called Weber effect; 2) continuous monitoring of old medications (due to prescribing changes, long-term use); 3) identifying potentially overlooked non-serious events such as procedural complications (Fukazawa et al., 2018). With regard to the type of event, there is general agreement that spontaneous reporting systems represent the best source of data to investigate the so-called designated medical events (DMEs), namely, rare but serious side effects with strong drug-attributable component (e.g., Torsade de Pointes) that may escape detection from healthcare databases and pivotal trials (Harpaz et al., 2013; Raschi et al., 2016b).
Therefore, we believe that the key consolidated goal of a DA remains early detection of rare, unexpected, late-onset, or long-lasting ADRs (including those from drug interactions), which cannot be fully appreciated during the pre-marketing phase (Raschi et al., 2022). The “trigger” should be clinical practice, namely, case report/series, with plausible pharmacological basis. In specific areas, such as rare diseases, some specific regulatory aspects might support a stringent post-marketing monitoring of drugs receiving fast-track approval with preliminary benefit-risk evaluation or under specific risk management plan. This is especially the case of biologics/biotechnological drugs (Giezen et al., 2010; Cutroneo et al., 2014) and advanced therapy medicinal products with peculiar pharmacokinetics/pharmacodynamics (Fusaroli et al., 2022), for which mapping global safety profile through the agnostic/untargeted analysis may be warranted. These hypothesis-free studies aim to describe the entire spectrum of ADRs for a specific drug or drug class, or to explore all drugs responsible for a given ADR. A systematic review (Gaucher et al., 2023) of 92 pharmacovigilance studies (mostly employing DA as statistical approach) found that multiple testing was not adequately addressed in most studies, potentially leading to false positive signals, thus arguing for the establishment of specific guidelines. We also support specific criteria and case-by-case analysis to actually prioritize ADRs of special interest.
An emerging use of DA is represented by the combination with other source of data, including in vitro/ex vivo assays to corroborate the biological plausibility (Salem et al., 2019), or electronic healthcare records (EHRs) to substantiate (or refuse) the research hypothesis or, under certain circumstances, to enhance signal detection for events with high background incidence (Pacurariu et al., 2015; Roberto et al., 2023; Wang et al., 2023). The correlation between disproportionality measures and pharmacokinetic/pharmacodynamic features (e.g., lipophilicity, receptor affinity/occupancy) may be used to explore the underlying pharmacological basis. This is illustrated by a number of examples in the recent past, especially in the neuropsychiatric area (Mazhar et al., 2019; Gatti et al., 2021b; Fusaroli et al., 2023). Furthermore, the traditional analytical approaches to the analysis of adverse events can take advantage from the integration with evidence coming from genomics data, which can provide additional support to understand the biological plausibility as well as to describe the relationships between interacting components. As an example, the so-called “molecular expansion of adverse event data” is a promising approach to explore adverse events by providing mechanism-based context for the assessment of drug safety (Boland et al., 2016). In particular, the integration of DA with genomics data and molecular data concerning both drugs and biological targets allows for the improvement of the analysis of adverse event by providing insights that may be helpful to understand drug-target interactions within the context of a biological system. As such, the correlation between DA and both molecular features may lead to valuable implications for the assessment and the prediction of ADRs, as well as for precision medicine and routine clinical practice. Although the approach of coupling pharmacovigilance with pharmacometrics has attracted interest, there are still important methodological aspects that are not fully standardized, including the source of pharmacodynamic data (e.g., ChEMBL, DrugBank databases), relevant index (e.g., calculation of receptor occupancy) and management of missing/multiple data, as well as the statistical model to assess the target-event relationship. Moreover, this approach may not be suitable for drugs with unconventional or complex drug-target interaction (e.g., gene therapy) or immunological ADRs (Soldatos et al., 2022).
Another starting point for performing DAs may be simply represented by an event (e.g., rare diseases with unclear multi-factorial etiology) for which possible drug role in its occurrence should be investigated. By this approach, not only signals may arise, but also suggestions for mechanisms of disease and, even, for possible new pharmacological strategies. In particular, drugs arising from DAs should be further considered for their typical biological targets, by accessing literature and pharmacodynamic databases, since these targets could also represent a key-point for the specific disease development (Gaimari et al., 2022).
A mixed approach combining a meta-analysis of clinical trials with a DA might be a complementary strategy to comprehensively describe the spectrum and other clinical features of a given safety issue (Wang et al., 2018; Mouffak et al., 2021). Moreover, the analysis of social media and drug information databases may reveal the patient’s perspective on concepts (e.g., anxiety) overlooked/underexplored in traditional sources (Smith et al., 2018).
Finally, the investigation of methodological aspects represents an important goal of DA. While in the recent past the vast majority of efforts were directed in demonstrating/handling of reporting biases (Arnaud et al., 2016), in the current era of artificial intelligence ongoing challenges are represented by automation in detection, assessment and prioritization of safety signals through machine-learning algorithms and natural language processing (Ball and Dal Pan, 2022; Battini et al., 2023a; Al-Azzawi et al., 2023).
6 Possible interpretation of a disproportionality signal
A number of common pitfalls can be identified in presenting study results from DAs. Due to inherent limitations, causality, risk ranking, incidence, prevalence and reporting rate cannot be calculated or claimed (with the exception of vaccines if the background rates are known or in case of sufficient drug utilization data) (Raschi et al., 2018; Faillie, 2019; Cortes et al., 2023; Khouri et al., 2023). A recent meta-research on 100 randomly selected published studies noted a misinterpretation of results, also called “spin”: many DAs intentionally or unintentionally overstate the strength of causal links, lack proper handling and discussion of biases, or over-extrapolate results to provide clinical recommendations or compare drug safety profiles, notably in the abstracts (Mouffak et al., 2021).
An accurate discussion of SDRs is mandatory, to avoid two possible scenarios: a) overlooking a true safety problem or b) emphasizing the importance of a biased SDR (Bate and Evans, 2009; Raschi et al., 2018; Faillie, 2019). Therefore, alternative (not drug-related) causes should be excluded, including differential reporting that may be caused by external factors (stimulated reporting, known as notoriety bias, following media attention, regulatory warnings, or active pharmacovigilance projects), or related to operative choices in study design, especially the inappropriate selection of the reference group (see below).
Several reporting biases have been described, including temporal, information, selection and competition biases (Raschi et al., 2018; Faillie, 2019). Of note, the existence of biases and strategies for relevant management should be considered a priori during study conception and design, including a careful consideration of quality aspects such as missing data and duplicate detection (Table 1). Although data quality applies to the various SRSs, the FAERS database possesses unique features that should be carefully considered (Poluzzi et al., 2012; Giunchi et al., 2023), including unrestricted access through different public dashboards, the use of non-standardized terms (e.g., free text for doses), and most importantly, the existence of sometimes “extreme” duplicates (Hauben et al., 2007), which can inflate calculated disproportionality measures or mask the identification of other SDRs. There is no gold standard for duplicate detection (rule-based vs. probabilistic algorithm) and potential duplicates are likely to remain after cleaning procedure. Therefore, visual inspection should be considered in the case-by-case analysis (Schilder et al., 2023). Additional frequent reporting biases that can be accounted for are represented by confounding by indication (see Section 7.2) and notoriety bias, also known as stimulated reporting. If the latter is suspected, a dynamic temporal analysis of disproportionality may support proper data interpretation and avoid transforming a disproportionality signal of alert automatically into an alarm (which is not always justified) (Raschi et al., 2013).
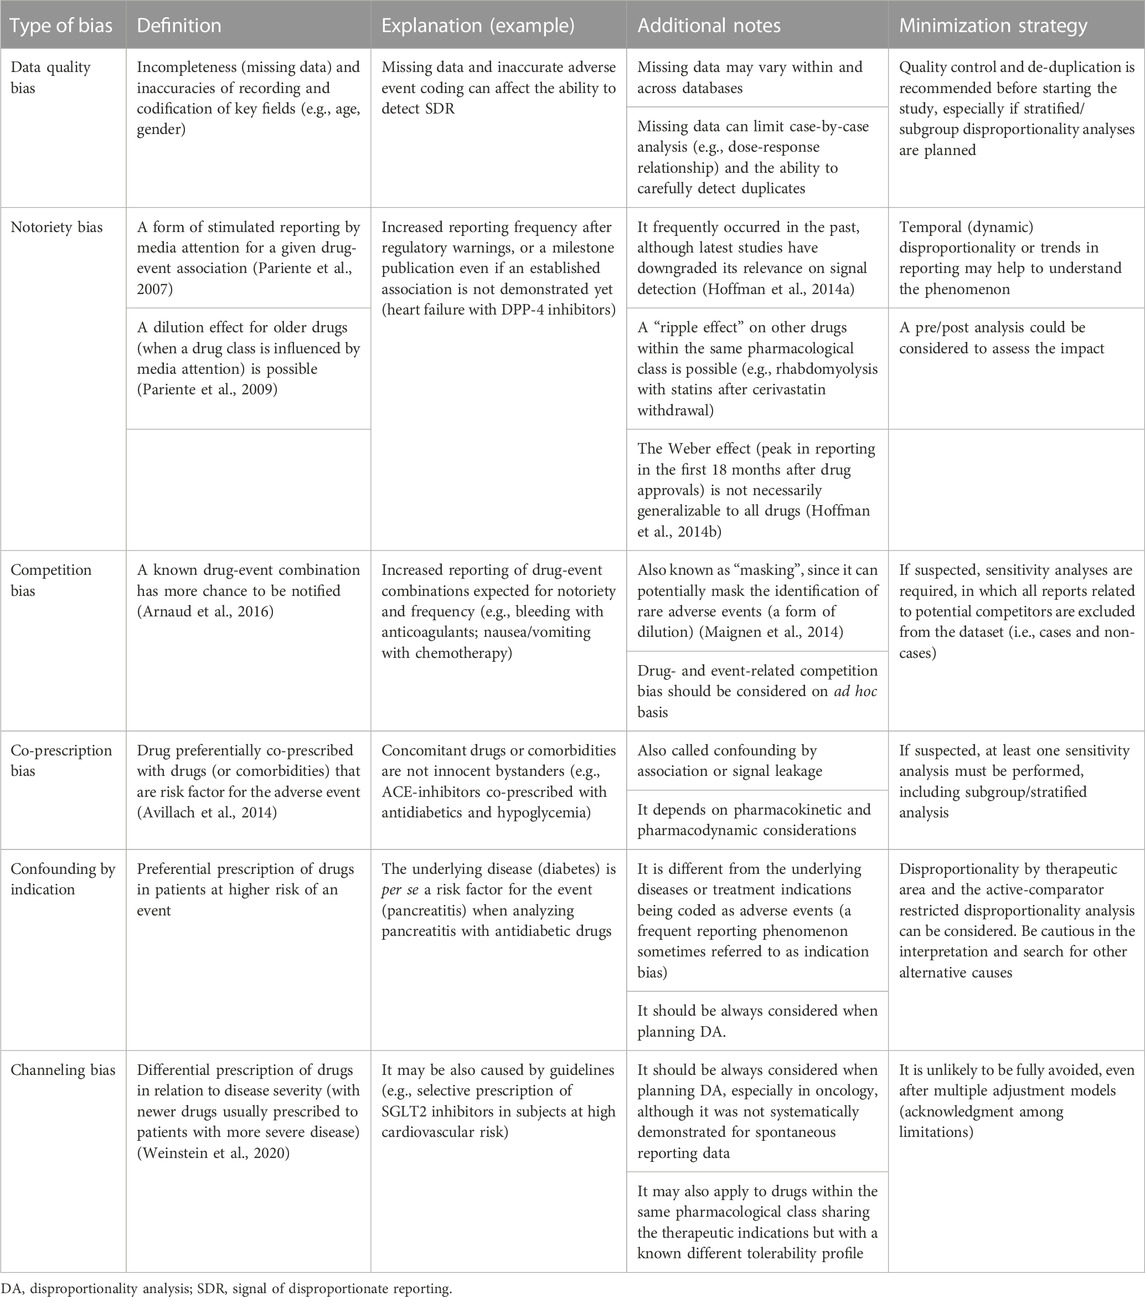
Table 1. Major biases in disproportionality analyses and strategies for their minimization.
The interpretation of negative findings and potential benefits (some beneficial drug protection) remains controversial (Antonazzo et al., 2020; Raschi et al., 2020a; Raschi et al., 2020b). Because disproportionality measures are interdependent, the lack of statistically-significant disproportionality should not be automatically interpreted as a safety endorsement: claiming that a drug is potentially free of any specific risk requires careful consideration of potential biases (e.g., masking) together with a case-by-case analysis to exclude alternative causes (see below) and consistency across other data sources; likewise, interpreting an inverse signal (i.e., a statistically-significant negative disproportionality indicating a lower-than-expected reporting) as a protective drug-related effect may be misleading (it could simply suggest a higher likelihood of underreporting for different reasons). Very recently, DAs have been provisionally explored to identify candidates for drug reposition, which have been subsequently tested in vitro as part of a translational approach (Chrétien et al., 2021). It is important to remark that such novel pioneering approaches should not only take into account all the potential biases that have been described so far, but also the available pharmacological evidence (Battini et al., 2023b). Any potential use of spontaneous reporting databases for drug repurposing should be possibly validated and confirmed in vivo, ex vivo and in clinical trials before becoming a consolidated approach.
7 Inappropriate disproportionality analysis
7.1 Disproportionality used as direct measure of risk
As anticipated, the presentation of results from a DA may be subject to potential misinterpretation, especially for readers and researchers not familiar with peculiarities and limitations of spontaneous reporting data. In fact, by adopting the so-called case/non-case approach (a peculiar case-control design adapted to a spontaneous reporting system), the general belief is that the higher the disproportion (e.g., ROR value), the stronger the association. As a consequence, disproportionality measures might be erroneously presented in terms of risk estimates, namely, relative risk and odds ratio (Borrelli et al., 2018).
In the recent past, different meta-research studies compared relative risks from analytical studies and meta-analyses with estimates from DAs as an aid to estimate the accuracy and performance of DAs as a possible early indicator of the likely clinical importance of an ADR (Maciá-Martínez et al., 2016; Beau-Lejdstrom et al., 2019; Gatti et al., 2021a; Khouri et al., 2021a). The observed moderate-to-weak correlations, restricted to objective type A ADRs not associated with the underlying pathology further corroborated the notion that disproportionality measures per se cannot be used as a proxy/surrogate of relative risk/odds ratio. Only if no data from epidemiological studies or clinical trials existed, using disproportionality measures to prioritize a given drug/event in terms of clinical importance could be acceptable (Khouri et al., 2021a), provided that appropriate biases have been accounted for (Gatti et al., 2021a; Gastaldon et al., 2022).
7.2 The use of restricted dataset as primary analysis
The population selected for DAs is pivotal, and every methodological choice should be justified, including pre-specified subgroup and stratified analyses (e.g., by age, sex, country) to enhance the precision of signal detection and better clarify the generalizability of results, for instance by uncovering a signal in a given subpopulation (Sandberg et al., 2020). A justified background restriction may reduce the noise in signal detection (reducing false positive while increasing true positive drug-event associations) or at least account for potential confounders. For instance, the so-called disproportionality by therapeutic area may be useful to mitigate the confounding by indication (Grundmark et al., 2014), or with the intent of including patients with similar indications through the “active-comparator restricted” DA (Alkabbani and Gamble, 2023).
However, the selection of the comparator, even if correctly chosen based on solid clinical and pharmacological considerations, may inadvertently introduce, or even enhance, the magnitude of selection bias (Gravel and Douros, 2023). For instance, if a potential cardiotoxicity for an anticancer drug emerges as a significant SDR from unrestricted primary DA, this signal could probably disappear by using all other reports in oncological therapeutic area as additional comparator, due to well-known and frequently reported cardiotoxicity associated with other oncologic drugs (resulting in a false negative signal) (Cutroneo et al., 2014). Some studies that evaluated the performance of restricted quantitative signal detection by therapeutic area for specific classes of drugs (i.e., selected anticancer therapies, orphan drugs), also confirmed that such restricted analyses, when used alone, should reduce noise but at the same time may be associated with a decrease in the sensitivity of signal detection process (Hauben et al., 2017; Sardella and Lungu, 2019).
We support, as initial (conservative) approach, the use of the full dataset (without restriction) as a first-pass signal detection approach (Cutroneo et al., 2014). This primary unrestricted analysis could be used as a benchmark for secondary/sensitivity DAs using comparators restricted a priori for minimizing a particular bias. These restricted analyses should be optional rather than a default analysis, especially in the oncological area (Hauben et al., 2017; Raschi et al., 2020c). The use of different (justified) comparators could be considered to assess the robustness of SDRs thus increasing relevant validity and transferability in clinical practice (Raschi et al., 2021).
7.3 Use of DA methods for drug-drug comparisons
Directly comparing the safety profiles of different drugs using DA is not advised. This is due to several biases inherent in spontaneous reporting data, including the lack of denominator, the presence of significant differential reporting patterns and multiple confounding factors (Michel et al., 2017).
Specifically, using DA findings as a direct measure of risk is misleading without a denominator representing drug usage and precise knowledge of the extent of under-reporting for each drug being studied. Ideally, to compare the safety data of different drugs using disproportionality measures it should be demonstrated that the drugs being studied have equal overall reporting rates and no differential reporting.
Another factor to consider is that disproportionality measures are interconnected. Variations in drug reporting patterns and significant changes in disproportionality results for specific combinations could lead to consequential shifts for other related combinations. This means, for example, that drug-AE combinations with high expected counts would need substantial increases in observed counts to yield a significant disproportionality result, and, even if they are true signals, may not emerge quantitatively. Moreover, numerous risk factors could confound apparent positive signals. Even when comparing drugs within the same therapeutic area, specific drug utilization patterns and unmeasured confounders could undermine the reliability of disproportionality findings. This underscores that direct comparisons between drugs based on DA should be approached with caution or even avoided (Greenblatt, 2015; Michel et al., 2017).
7.4 Use of DAs for already known drug-event associations
When conducting DAs, the definition of safety signal should always be considered. Since a signal should provide “information on a new or known adverse event that is potentially caused by a medicine and that warrants further investigation,” the conduction of DAs to describe already well-known ADRs, which are already included in the SmPC (e.g., tricyclic antidepressants-induced memory disorders), may be redundant and unnecessary o even misleading (Norén et al., 2014).
Therefore, a signal should always be characterized by elements of novelty (see paragraph 4.1). The research question of a signal detection study must therefore be directed towards the exploration of associations that are not expected due to their nature or intensity, or that are not reported in the summary of product characteristics. In the case of a known association, the research question may be directed to generate hypotheses relating to populations at higher risk than others (for example, an event may be reported for a drug more frequently in the female population than in the male population than not all other adverse reactions for that drug versus all other drugs) unless this risk has already been confirmed by clinical trials or robust observational studies. These research questions can be answered simply by a descriptive analysis of reported AEs.
In general, a signal detection study can answer to research questions aimed at confirming hypotheses supported by weak evidence such as few case reports, case series or uncontrolled studies. It is important that the notoriety of the identified signal is clearly characterized and discussed by the investigators in order to bring out the elements of novelty. This is particularly important when the analysis is conducted to investigate all possible signals of a specific drug or drug class without a priori hypotheses (Liu et al., 2023; Shu et al., 2023).
7.5 Use of disproportionality analysis when descriptive analyses would be sufficient
Some studies have performed DA using spontaneous reporting databases with the aim of describing the safety profile of a drug or a class of drugs in the real world, for instance in comparison with safety data from clinical trials (Kim et al., 2022) or in special populations (Xue et al., 2023). Providing a list of DAs without a critical insight (except sometimes for the novelty) does not provide useful information for clinicians, regulators, and other stakeholders. These research questions can be answered simply by a descriptive analysis of reported AEs. Moreover, if access to narratives is allowed, individual case assessment is useful to verify pre-existing risk factors or other subjects’ susceptibilities, thus making a cases series highly informative for clinical practice and regulatory measures such as an update of SmPC (Saely et al., 2021).
It is important to underline that the comparison between measures of disproportionality can at best highlight that one signal is stronger than another within a database, but it does not provide any comparative information on the effective risk of developing an event for a drug compared to another. Factors such as the choice of the database in which the analysis is performed and the choice of the reference for the calculation of disproportionality indices are important determinants of the strength of the signal and are independent of the actual exposure of the patients to the drugs and therefore also of the actual risks.
7.6 Use of DAs for adverse events with high background incidences
Although SRSs remain the cornerstone of post-marketing drug safety surveillance, judicious use of other available data sources is essential to allow a better detection, strengthening and validation of safety signals. While rare AEs that are strongly attributable to drugs (e.g., Torsades de Pointes and Stevens-Johnson Syndrome) can be adequately captured by analyses of spontaneous reporting, those that already have a high background incidence (e.g., cardiovascular events and malignancies) can be better investigated in healthcare databases (Patadia et al., 2018).
In addition, while most spontaneous reports typically involve newly marketed drugs, EHRs and claims databases data can potentially identify new risks associated with old medications (due to new indications of use or new generation of users), as well as AEs that are not easily predictable pharmacologically and less likely to be suspected as drug-induced, thus resulting in a lower likelihood of being reported. In our opinion, these systems might complement SRSs in signal detection, also for events that are not easily attributable to drugs due to their multifactorial nature or that may be coincidental (e.g., malignancies and some pregnancy outcomes).
Indeed, pharmacovigilance studies aimed at exploring the scenarios in which EHR-based signal detection systems can enhance already existing SRSs, proved that the contribution of each system to signal detection seemed to correlate with the background incidence of the events, being directly proportional to the incidence in EHR-based systems and inversely proportional in SRS. As a proof of this, it has been demonstrated that using a network of claims databases and electronic medical records could have anticipated the identification of the rofecoxib-related acute myocardial infarction signal of about 4 years before the signal was identified through SRS data (Patadia et al., 2018).
Notably, to the best of our knowledge, there are no national or regional pharmacovigilance systems that regularly and systematically use EHR or similar data to perform signal detection on events with high background rates, or at least not to the same extent as DA is used on SRS. Therefore, DA will likely remain our best option, until methods for signal detection in EHR are validated and implemented for regular use in pharmacovigilance. However, there are several ongoing initiatives that are pursuing the goal of systematically integrating the use of Real World Data to perform signal detection. For instance, the European Medicine Agency announced that with the DARWIN project the use of these data sources will part of this regulatory environment by 2025 (Arlett et al., 2022).
8 Communicating signal of disproportionate reporting to the right audience
Historically, published case reports of ADRs have been means to document the suspicion of occurrence, course, and management of drug-induced effects. Such works primarily carry information targeted to caregivers in specific settings; Sutherland first reported the “gray pallor” following injectable chloramphenicol in 3 neonates (SUTHERLAND, 1959), citing that their deaths were “reported in the hope of stimulating publication of the observations of others which may lead to less tentative conclusions than are possible on the basis of a few uncontrolled case reports.” These findings were confirmed in the same year by Burns et al. (1959), who noted an imbalance of ‘ashen color’ in neonates treated with chloramphenicol compared to no treatment or penicillin/streptomycin. Perhaps more famously, McBride’s letter to the Lancet asked whether readers of the journal had seen other instances of phocomelia following administration of thalidomide to pregnant women (Mcbride, 1961), culminating in the pharmacovigilance we know today. Similarly, at the time of study design, authors of DAs should keep in mind the target audience that may benefit from reading their work. Depending on the message authors of DAs may wish to deliver, regulators, researchers, caregivers, or all these stakeholders in pharmacovigilance, may be eligible audiences.
Communication to regulators can be considered when the authors’ wish is to encourage regulatory action. However, some considerations apply. For example, to the best of our knowledge, no regulatory action is solely supported by published DAs (Dias et al., 2015). Even considering the period subsequent to regulatory action, DA may not play a substantial role: the US FDA maintains a list of findings from DAs applied to FAERS, i.e., “potential signals of serious risk.” The items therein were found to mostly lead to FDA regulatory action (Dhodapkar et al., 2022). However, studies that corroborate these disproportionality signals, i.e., subsequent to and in support of the FDA communications, mainly consist of case reports or series of case reports (Dhodapkar et al., 2022). In brief, there is limited evidence on the usefulness of DAs to either support or corroborate post marketing regulatory decision-making.
When audience is represented by clinicians and other healthcare professionals, authors of DAs should be very careful, especially when drawing conclusion, since the key message may significantly impact on clinical practice, particularly if the study is (will be) published in high-ranking Journals. From a clinical viewpoint, the scientific rationale of the study and the choice of comparator are key aspects in the study design. Moreover, as anticipated, a balanced presentation and proper interpretation of key findings, notably in the abstract, is pivotal to avoid transforming an alert (i.e., a disproportionality signal) automatically into an alarm (Raschi et al., 2020c). The most important clinical implication of a published DAs is to increase awareness, thus supporting proactive monitoring and finally promoting safer prescribing.
From a research perspective, DA results can be communicated to get other researchers working on drug safety involved in the discussion and to stimulate more robust confirmatory investigations. Although the vast majority of DAs remains unnoticed, the publication of a DAs, by definition, should prompt the conduction of analytical pharmaco-epidemiological approaches (e.g., cohort studies) to confirm or refuse the association (Raschi et al., 2020d; Chan et al., 2022). Therefore, DAs should direct subsequent research, provided that a signal is considered robust and valid to be tested/verified in longitudinal healthcare databases (Harpaz et al., 2017). In this regard, the Sentinel initiative, the European Health Data Evidence Network and the Observational Health Data Sciences and Informatics program are multi-stakeholder interdisciplinary collaborative projects aiming to timely safety assessment.
As a final consideration, considering the trans-disciplinary nature of pharmacovigilance (Rocca et al., 2019), we recommend a multidisciplinary team (comprising experts in spontaneous reporting systems, clinicians, biologists, statisticians, biomedical informatics, etc.) when planning, conducting and interpreting a DA, especially in the current era of Big Data and artificial intelligence.
To enhance the validity of DAs, responsible use and publication of their results and relevant clinical transferability, the READUS-PV project (https://readus-statement.org/) is developing dedicated reporting recommendations to assist researchers, reviewers, editors, and readers in critical assessment of a manuscript and its findings, thus promoting the publication of higher-value DAs, ultimately benefiting public health.
9 Conclusion
The availability of large-scale SRSs has attracted considerable interest among clinicians and other stakeholders without consolidated expertise in pharmacovigilance. Of note, these archives provide public access to raw data that can be downloaded, or can be easily queried through online tools (e.g., FAERS public dashboard) by individual researchers, thus offering an unprecedented opportunity to timely and cheaply perform DAs, as demonstrated by the exponential increase in the number of publications on DAs (Wang et al., 2021; Sartori et al., 2023).
However, different meta-research studies have shown lack of transparency in reporting DAs and common misinterpretation (also called spin) of results in published studies (Khouri et al., 2021a; Khouri et al., 2021b; Cortes et al., 2023). Therefore, this review offered a perspective on methodological aspects (and understanding) of DAs, how they are carried out, reported, and could be interpreted to avoid what someone coined “apophenia” (i.e., the perception of meaningful patterns and causal connections among random data) (Gagne, 2014), or the so-called “Pharmacovigilance Syndrome” (Greenblatt, 2015), i.e., the incorrect use of spontaneous reporting systems to infer causality, calculate incidence, or provide risk stratification, which may ultimately result in unjustified alarm. A synopsis of main conceptual and technical aspects of DAs is provided in Table 2.
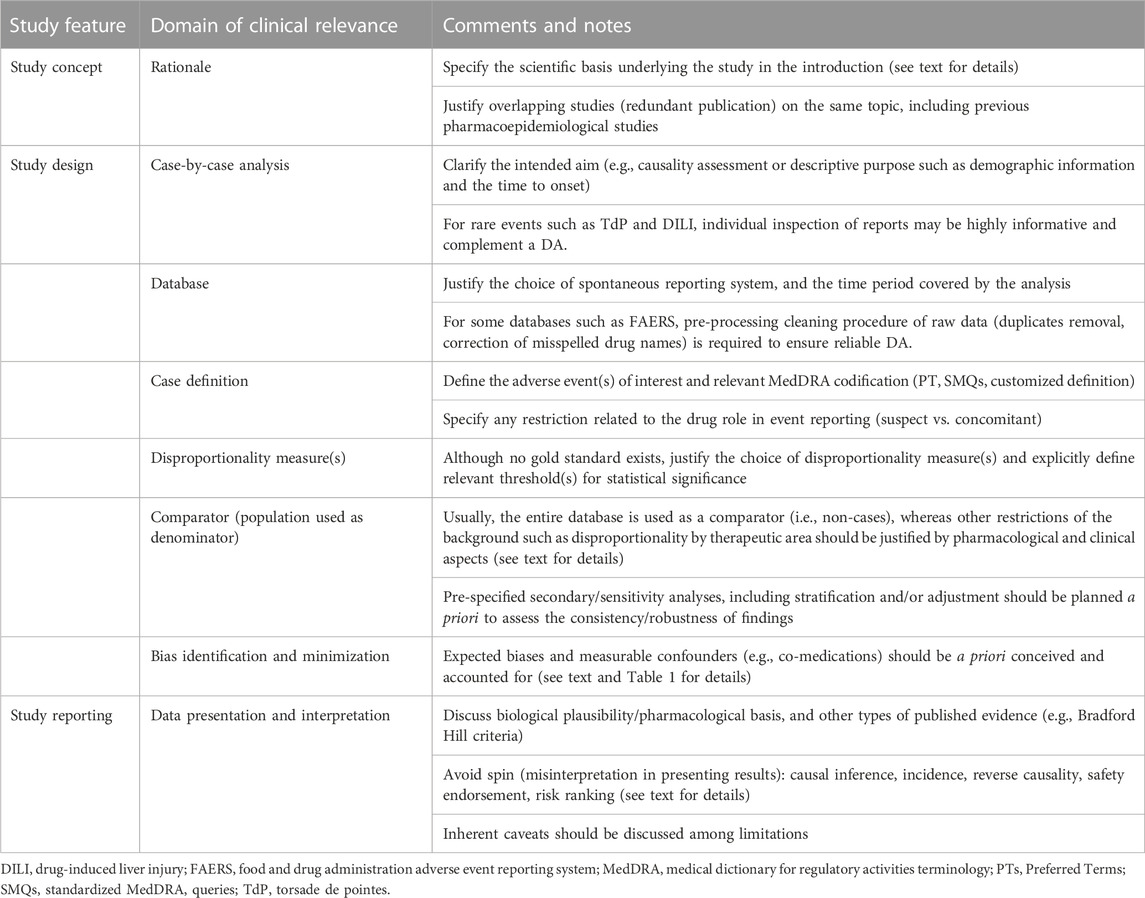
Table 2. Synopsis of conceptual and technical aspects in performing and reporting a DA. Modified from Raschi et al. (2018), Raschi et al. (2020c), and Raschi et al. (2023).
Moreover, the following take-home messages can be derived from our reflections:
• Even when properly designed, conducted, and reported (taking into account limitations), we should not forget that DAs remain hypothesis-generating studies, namely, a signal detection approach, and provide the basis to carefully design prospective cohort studies and pragmatic clinical trials.
• DAs cannot be used per se as a standalone approach to assess a drug-related risk (they do not provide risk quantification and ranking, or safety endorsement) and cannot replace clinical judgment in the individual patient;
• Nonetheless, the role of DAs is indisputable and irreplaceable for rapid detection of rare but unpredictable AEs with strong drug-attributable component (known as designated medical event, such as TdP), especially when combined with a careful case-by-case analysis (individual inspection of reports for causality assessment or to uncover reporting patterns and clinical features), thus supporting clinicians towards proactive monitoring and safer prescribing;
• a multidisciplinary team (comprising experts in pharmacovigilance, clinicians, biologists, statisticians, biomedical informatics) is warranted to manage the various multifaceted aspects of study design and analysis (e.g., data cleaning, statistical analysis, biological plausibility).
We eagerly await the results from the international READUS-PV project (https://readus-statement.org/), which is developing specific reporting recommendations of DAs. This international collaborative effort aims to enhance transparency and support researchers in conveying the methods and results of their research, thus promoting research culture in pharmacovigilance. The project stems from already existing reporting guidelines, especially the strengthening the reporting of observational studies in epidemiology (STROBE) and the reporting of studies conducted using observational routinely collected health data statement for pharmacoepidemiology (RECORD-PE), and will also hopefully assist reviewers, editors, and readers in reproducible publication of higher-value disproportionality studies, ultimately advancing pharmacovigilance as a whole and benefiting public health. We are aware that recommendations and guidelines themselves are not sufficient to guarantee good quality of research in the absence of an appropriate research culture in Pharmacovigilance. However, these tools can support the pharmacovigilance research community in spreading this culture through continuous and constructive discussion.
Author contributions
PC: Conceptualization, Writing–original draft, Writing–review and editing. DS: Writing–original draft, Writing–review and editing. MT: Conceptualization, Writing–original draft, Writing–review and editing. SC: Writing–original draft. VB: Writing–original draft. CC: Writing–original draft. CR: Writing–original draft. AC: Writing–original draft. EP: Writing–original draft. UM: Writing–original draft. ER: Conceptualization, Writing–original draft, Writing–review and editing.
Funding
The authors declare that no financial support was received for the research, authorship, and/or publication of this article.
Acknowledgments
DS is affiliated with the Uppsala Monitoring Centre. This work does not represent the opinions of the Uppsala Monitoring Centre or the World Health Organization.
Conflict of interest
The authors declare that the research was conducted in the absence of any commercial or financial relationships that could be construed as a potential conflict of interest.
The authors declared that they were an editorial board member of Frontiers, at the time of submission. This had no impact on the peer review process and the final decision.
Publisher’s note
All claims expressed in this article are solely those of the authors and do not necessarily represent those of their affiliated organizations, or those of the publisher, the editors and the reviewers. Any product that may be evaluated in this article, or claim that may be made by its manufacturer, is not guaranteed or endorsed by the publisher.
References
Agbabiaka, T. B., Savović, J., and Ernst, E. (2008). Methods for causality assessment of adverse drug reactions: a systematic review. Drug Saf. 31 (1), 21–37. doi:10.2165/00002018-200831010-00003
Al-Aqeel, S. A. (2012). Evaluation of medication package inserts in Saudi Arabia. Drug Healthc. Patient Saf. 4 (1), 33–38. doi:10.2147/DHPS.S29402
Al-Azzawi, F., Mahmoud, I., Haguinet, F., Bate, A., and Sessa, M. (2023). Developing an artificial intelligence-guided signal detection in the food and drug administration adverse event reporting system (FAERS): a proof-of-concept study using galcanezumab and simulated data. Drug Saf. 46 (8), 743–751. doi:10.1007/s40264-023-01317-0
Alkabbani, W., and Gamble, J.-M. (2023). Active-comparator restricted disproportionality analysis for pharmacovigilance signal detection studies of chronic disease medications: an example using sodium/glucose cotransporter 2 inhibitors. Br. J. Clin. Pharmacol. 89 (2), 431–439. doi:10.1111/bcp.15178
Alloza, J. L., and Lasagna, L. (1983). A comparison of drug product information in four national compendia. Clin. Pharmacol. Ther. 33 (3), 269–277. doi:10.1038/clpt.1983.32
Alvarez, Y., Hidalgo, A., Maignen, F., and Slattery, J. (2010). Validation of statistical signal detection procedures in eudravigilance post-authorization data: a retrospective evaluation of the potential for earlier signalling. Drug Saf. 33 (6), 475–487. doi:10.2165/11534410-000000000-00000
Antonazzo, I. C., Poluzzi, E., Forcesi, E., Salvo, F., Pariente, A., Marchesini, G., et al. (2020). Signal of potentially protective drug-drug interactions from spontaneous reporting systems: proceed with caution. Acta Diabetol. 57 (1), 115–116. doi:10.1007/s00592-019-01441-3
Arlett, P., Kjær, J., Broich, K., and Cooke, E. (2022). Real-world evidence in EU medicines regulation: enabling use and establishing value. Clin. Pharmacol. Ther. 111 (1), 21–23. doi:10.1002/cpt.2479
Arnaud, M., Salvo, F., Ahmed, I., Robinson, P., Moore, N., Bégaud, B., et al. (2016). A method for the minimization of competition bias in signal detection from spontaneous reporting databases. Drug Saf. 39 (3), 251–260. doi:10.1007/s40264-015-0375-8
Avillach, P., Salvo, F., Thiessard, F., Miremont-Salamé, G., Fourrier-Reglat, A., Haramburu, F., et al. (2014). Pilot evaluation of an automated method to decrease false-positive signals induced by co-prescriptions in spontaneous reporting databases. Pharmacoepidemiol Drug Saf. 23 (2), 186–194. doi:10.1002/pds.3454
Ball, R., and Dal Pan, G. (2022). “Artificial intelligence” for pharmacovigilance: ready for prime time? Drug Saf. 45 (5), 429–438. doi:10.1007/s40264-022-01157-4
Bate, A., and Evans, S. J. W. (2009). Quantitative signal detection using spontaneous ADR reporting. Pharmacoepidemiol Drug Saf. 18 (6), 427–436. doi:10.1002/pds.1742
Bate, A., Lindquist, M., Edwards, I. R., Olsson, S., Orre, R., Lansner, A., et al. (1998). A Bayesian neural network method for adverse drug reaction signal generation. Eur. J. Clin. Pharmacol. 54 (4), 315–321. doi:10.1007/s002280050466
Battini, V., Carnovale, C., Clementi, E., and Sessa, M. (2023a). Ubrogepant and rimegepant: signal detection using spontaneous reports of adverse events from the Food and Drug Administration Adverse Event Reporting System. Expert Opin. Drug Saf. 22, 1105–1112. doi:10.1080/14740338.2023.2223958
Battini, V., Van Manen, R. P., Gringeri, M., Mosini, G., Guarnieri, G., Bombelli, A., et al. (2023b). The potential antidepressant effect of antidiabetic agents: new insights from a pharmacovigilance study based on data from the reporting system databases FAERS and VigiBase. Front. Pharmacol. 14, 1128387. doi:10.3389/fphar.2023.1128387
Beau-Lejdstrom, R., Crook, S., Spanu, A., Yu, T., and Puhan, M. A. (2019). Adverse drug reaction risk measures: a comparison of estimates from drug surveillance and randomised trials. Pharm. Med. 33 (4), 331–339. doi:10.1007/s40290-019-00287-y
Béné, J., Moulis, G., Bennani, I., Auffret, M., Coupe, P., Babai, S., et al. (2016). Bullous pemphigoid and dipeptidyl peptidase IV inhibitors: a case-noncase study in the French Pharmacovigilance Database. Br. J. Dermatol 175 (2), 296–301. doi:10.1111/bjd.14601
Boland, M. R., Jacunski, A., Lorberbaum, T., Romano, J. D., Moskovitch, R., and Tatonetti, N. P. (2016). Systems biology approaches for identifying adverse drug reactions and elucidating their underlying biological mechanisms. Wiley Interdiscip. Rev. Syst. Biol. Med. 8 (2), 104–122. doi:10.1002/wsbm.1323
Borrelli, E. P., Lee, E. Y., Descoteaux, A. M., Kogut, S. J., and Caffrey, A. R. (2018). Stevens-johnson syndrome and toxic epidermal necrolysis with antiepileptic drugs: an analysis of the US food and drug administration adverse event reporting system. Epilepsia 59 (12), 2318–2324. doi:10.1111/epi.14591
Burns, L. E., Hodgman, J. E., and Cass, A. B. (1959). Fatal circulatory collapse in premature infants receiving chloramphenicol. N. Engl. J. Med. 261, 1318–1321. doi:10.1056/NEJM195912242612604
Candore, G., Juhlin, K., Manlik, K., Thakrar, B., Quarcoo, N., Seabroke, S., et al. (2015). Comparison of statistical signal detection methods within and across spontaneous reporting databases. Drug Saf. 38 (6), 577–587. doi:10.1007/s40264-015-0289-5
Caster, O., Aoki, Y., Gattepaille, L. M., and Grundmark, B. (2020). Disproportionality analysis for pharmacovigilance signal detection in small databases or subsets: recommendations for limiting false-positive associations. Drug Saf. 43 (5), 479–487. doi:10.1007/s40264-020-00911-w
Caster, O., Juhlin, K., Watson, S., and Norén, G. N. (2014). Improved statistical signal detection in pharmacovigilance by combining multiple strength-of-evidence aspects in vigiRank: retrospective evaluation against emerging safety signals. Drug Saf. 37 (8), 617–628. doi:10.1007/s40264-014-0204-5
Chan, Y.-H., Chao, T.-F., Chen, S.-W., Lee, H. F., Chen, W. M., Li, P. R., et al. (2022). Development of interstitial lung disease among patients with atrial fibrillation receiving oral anticoagulants in taiwan. JAMA Netw. open 5 (11), e2243307. doi:10.1001/jamanetworkopen.2022.43307
Chrétien, B., Jourdan, J. P., Davis, A., Fedrizzi, S., Bureau, R., Sassier, M., et al. (2021). Disproportionality analysis in VigiBase as a drug repositioning method for the discovery of potentially useful drugs in Alzheimer’s disease. Br. J. Clin. Pharmacol. 87 (7), 2830–2837. doi:10.1111/bcp.14690
Cortes, B., Jambon-Barbara, C., Cracowski, J.-L., and Khouri, C. (2023). Validity, relevance and interpretation of pharmacovigilance disproportionality analyses. Bone 170, 116685. doi:10.1016/j.bone.2023.116685
Cutroneo, P. M., Isgrò, V., Russo, A., Ientile, V., Sottosanti, L., Pimpinella, G., et al. (2014). Safety profile of biological medicines as compared with non-biologicals: an analysis of the Italian spontaneous reporting system database. Drug Saf. 37 (11), 961–970. doi:10.1007/s40264-014-0224-1
de Jong, H., Saldi, S. R. F., Klungel, O. H., Vandebriel, R. J., Souverein, P. C., Meyboom, R. H. B., et al. (2012). Statin-associated polymyalgia rheumatica. An analysis using WHO global individual case safety database: a case/non-case approach. PLoS One 7 (7), 412899. doi:10.1371/journal.pone.0041289
De Boer, A. (2011). When to publish measures of disproportionality derived from spontaneous reporting databases? Br. J. Clin. Pharmacol. 72 (6), 909–911. doi:10.1111/j.1365-2125.2011.04087.x
Dhodapkar, M. M., Shi, X., Ramachandran, R., Chen, E. M., Wallach, J. D., and Ross, J. S. (2022). Characterization and corroboration of safety signals identified from the US food and drug administration adverse event reporting system, 2008-19: cross sectional study. BMJ 379, 717522. doi:10.1136/bmj-2022-071752
Dias, P., Penedones, A., Alves, C., Ribeiro, C. F., and Marques, F. B. (2015). The role of disproportionality analysis of pharmacovigilance databases in safety regulatory actions: a systematic review. Curr. Drug Saf. 10 (3), 234–250. doi:10.2174/1574886310666150729112903
ENCePP (2013). The European network of centres for pharmacoepidemiology and pharmacovigilance (ENCePP) guide on methodological standards in pharmacoepidemiology (revision 1). ENCePP website 2010, 1–44. Available at: https://www.encepp.eu/standards_and_guidances/documents/01.ENCePPMethodsGuideRev.11.pdf.
European Medicine Agency (2017). Guideline on good pharmacovigilance practices (GVP). Module IX Addendum I – methodological aspects of signal detection from spontaneous reports of suspected adverse reactions. European Medicines Agency website. Available at: https://www.ema.europa.eu/en/documents/scientific-guideline/guideline-good-pharmacovigilance-practices-gvp-module-ix-addendum-i-methodological-aspects-signal_en.pdf.
Evans, S. J., Waller, P. C., and Davis, S. (2001). Use of proportional reporting ratios (PRRs) for signal generation from spontaneous adverse drug reaction reports. Pharmacoepidemiol Drug Saf. 10 (6), 483–486. doi:10.1002/pds.677
Faillie, J.-L. (2019). Case-non-case studies: principle, methods, bias and interpretation. Therapie 74 (2), 225–232. doi:10.1016/j.therap.2019.01.006
Fouretier, A., Malriq, A., and Bertram, D. (2016). Open access pharmacovigilance databases: analysis of 11 databases. Pharm. Med. 30 (4), 221–231. doi:10.1007/s40290-016-0146-6
Fukazawa, C., Hinomura, Y., Kaneko, M., and Narukawa, M. (2018). Significance of data mining in routine signal detection: analysis based on the safety signals identified by the FDA. Pharmacoepidemiol Drug Saf. 27 (12), 1402–1408. doi:10.1002/pds.4672
Fusaroli, M., Giunchi, V., Battini, V., Gringeri, M., Rimondini, R., Menchetti, M., et al. (2023). Exploring the underlying mechanisms of drug-induced impulse control disorders: a pharmacovigilance-pharmacodynamic study. Psychiatry Clin. Neurosci. 77 (3), 160–167. doi:10.1111/pcn.13511
Fusaroli, M., Isgrò, V., Cutroneo, P. M., Ferrajolo, C., Cirillo, V., Del Bufalo, F., et al. (2022). Post-marketing surveillance of CAR-T-cell therapies: analysis of the FDA adverse event reporting system (FAERS) database. Drug Saf. 45 (8), 891–908. doi:10.1007/s40264-022-01194-z
Gagne, J. J. (2014). Finding meaningful patterns in adverse drug event reports. JAMA Intern Med. 174 (12), 1934–1935. doi:10.1001/jamainternmed.2014.3270
Gaimari, A., Fusaroli, M., Raschi, E., Baldin, E., Vignatelli, L., Nonino, F., et al. (2022). Amyotrophic lateral sclerosis as an adverse drug reaction: a disproportionality analysis of the food and drug administration adverse event reporting system. Drug Saf. 45 (6), 663–673. doi:10.1007/s40264-022-01184-1
Gastaldon, C., Schoretsanitis, G., Arzenton, E., Raschi, E., Papola, D., Ostuzzi, G., et al. (2022). Withdrawal syndrome following discontinuation of 28 antidepressants: pharmacovigilance analysis of 31,688 reports from the WHO spontaneous reporting database. Drug Saf. 45 (12), 1539–1549. doi:10.1007/s40264-022-01246-4
Gatti, M., Antonazzo, I. C., Diemberger, I., De Ponti, F., and Raschi, E. (2021a). Adverse events with sacubitril/valsartan in the real world: emerging signals to target preventive strategies from the FDA adverse event reporting system. Eur. J. Prev. Cardiol. 28 (9), 983–989. doi:10.1177/2047487320915663
Gatti, M., Raschi, E., and De Ponti, F. (2021b). Serotonin syndrome by drug interactions with linezolid: clues from pharmacovigilance-pharmacokinetic/pharmacodynamic analysis. Eur. J. Clin. Pharmacol. 77 (2), 233–239. doi:10.1007/s00228-020-02990-1
Gaucher, L., Sabatier, P., Katsahian, S., and Jannot, A.-S. (2023). Pharmacovigilance studies without a priori hypothesis systematic review highlights inappropriate multiple testing correction procedures. J. Clin. Epidemiol. 162, 127–134. doi:10.1016/j.jclinepi.2023.08.010
Giezen, T. J., Mantel-Teeuwisse, A. K., Meyboom, R. H. B., Straus, SMJM, Leufkens, H. G. M., and Egberts, T. C. G. (2010). Mapping the safety profile of biologicals: a disproportionality analysis using the WHO adverse drug reaction database, VigiBase. VigiBase. Drug Saf. 33 (10), 865–878. doi:10.2165/11538330-000000000-00000
Giunchi, V., Fusaroli, M., Hauben, M., Raschi, E., and Poluzzi, E. (2023). Challenges and opportunities in accessing and analysing FAERS data: a call towards a collaborative approach. Drug Saf. 46 (10), 921–926. doi:10.1007/s40264-023-01345-w
Gould, A. L. (2003). Practical pharmacovigilance analysis strategies. Pharmacoepidemiol Drug Saf. 12 (7), 559–574. doi:10.1002/pds.771
Gravel, C. A., and Douros, A. (2023). Considerations on the use of different comparators in pharmacovigilance: a methodological review. Br. J. Clin. Pharmacol. 89, 2671–2676. doi:10.1111/bcp.15802
Greenblatt, D. J. (2015). The pharmacovigilance syndrome. J. Clin. Psychopharmacol. 35 (4), 361–363. doi:10.1097/JCP.0000000000000367
Große-Michaelis, I., Proestel, S., Rao, R. M., Dillman, B. S., Bader-Weder, S., Macdonald, L., et al. (2023). MedDRA labeling Groupings to improve safety communication in product labels. Ther. Innov. Regul. Sci. 57 (1), 1–6. doi:10.1007/s43441-022-00393-1
Grundmark, B., Holmberg, L., Garmo, H., and Zethelius, B. (2014). Reducing the noise in signal detection of adverse drug reactions by standardizing the background: a pilot study on analyses of proportional reporting ratios-by-therapeutic area. Eur. J. Clin. Pharmacol. 70 (5), 627–635. doi:10.1007/s00228-014-1658-1
Harpaz, R., Dumouchel, W., Lependu, P., Bauer-Mehren, A., Ryan, P., and Shah, N. H. (2013). Performance of pharmacovigilance signal-detection algorithms for the FDA adverse event reporting system. Clin. Pharmacol. Ther. 93 (6), 539–546. doi:10.1038/clpt.2013.24
Harpaz, R., DuMouchel, W., Schuemie, M., Bodenreider, O., Friedman, C., Horvitz, E., et al. (2017). Toward multimodal signal detection of adverse drug reactions. J. Biomed. Inf. 76, 41–49. doi:10.1016/j.jbi.2017.10.013
Hauben, M., and Aronson, J. K. (2009). Defining “signal” and its subtypes in pharmacovigilance based on a systematic review of previous definitions. Drug Saf. 32 (2), 99–110. doi:10.2165/00002018-200932020-00003
Hauben, M., and Bate, A. (2009). Decision support methods for the detection of adverse events in post-marketing data. Drug Discov. Today 14 (7-8), 343–357. doi:10.1016/j.drudis.2008.12.012
Hauben, M., Hung, E., Wood, J., Soitkar, A., and Reshef, D. (2017). The impact of database restriction on pharmacovigilance signal detection of selected cancer therapies. Ther. Adv. Drug Saf. 8 (5), 145–156. doi:10.1177/2042098616685010
Hauben, M., Reich, L., DeMicco, J., and Kim, K. (2007). “Extreme duplication” in the US FDA adverse events reporting system database. Drug Saf. 30 (6), 551–554. doi:10.2165/00002018-200730060-00009
Hill, A. B. (1965). The enviroment of the disease: aasociation or causation? Proc. R. Soc. Med. 58 (5), 295–300. doi:10.1177/003591576505800503
Hoffman, K. B., Demakas, A. R., Dimbil, M., Tatonetti, N. P., and Erdman, C. B. (2014a). Stimulated reporting: the impact of US food and drug administration-issued alerts on the adverse event reporting system (FAERS). Drug Saf. 37 (11), 971–980. doi:10.1007/s40264-014-0225-0
Hoffman, K. B., Dimbil, M., Erdman, C. B., Tatonetti, N. P., and Overstreet, B. M. (2014b). The weber effect and the United States food and drug administration’s adverse event reporting system (FAERS): analysis of sixty-two drugs approved from 2006 to 2010. Drug Saf. 37 (4), 283–294. doi:10.1007/s40264-014-0150-2
Hopstadius, J., Norén, G. N., Bate, A., and Edwards, I. R. (2008). Impact of stratification on adverse drug reaction surveillance. Drug Saf. 31 (11), 1035–1048. doi:10.2165/00002018-200831110-00008
ICH. International (2023). Council for harmonisation of technical requirements for pharmaceuticals for human use. Glossary of ICH terms and definitions. CIOMS website. Available at: https://cioms.ch/publications/product/glossary-of-ich-terms-and-definitions (Accessed July 12, 2023).
Inácio, P., Cavaco, A., Allan, E., and Airaksinen, M. (2018). Key pharmacovigilance stakeholders’ experiences of direct patient reporting of adverse drug reactions and their prospects of future development in the European Union. Public Health 155, 119–128. doi:10.1016/j.puhe.2017.11.023
Jeong, S., Kam, G., Li, J., Lee, S., Lee, H., Noh, Y., et al. (2019). Assessment of consistency of drug interaction information in drug labels among the United States, the United Kingdom, China, Japan, and korea. Clin. Pharmacol. Ther. 105 (2), 505–514. doi:10.1002/cpt.1167
Khouri, C., Fusaroli, M., Salvo, F., and Raschi, E. (2023). Interpretation of pharmacovigilance disproportionality analyses. Clin. Pharmacol. Ther. 114, 745–746. doi:10.1002/cpt.2951
Khouri, C., Petit, C., Tod, M., Lepelley, M., Revol, B., Roustit, M., et al. (2021a). Adverse drug reaction risks obtained from meta-analyses and pharmacovigilance disproportionality analyses are correlated in most cases. J. Clin. Epidemiol. 134, 14–21. doi:10.1016/j.jclinepi.2021.01.015
Khouri, C., Revol, B., Lepelley, M., Mouffak, A., Bernardeau, C., Salvo, F., et al. (2021b). A meta-epidemiological study found lack of transparency and poor reporting of disproportionality analyses for signal detection in pharmacovigilance databases. J. Clin. Epidemiol. 139, 191–198. doi:10.1016/j.jclinepi.2021.07.014
Kim, Y. S., Brar, S., D’Albo, N., Dey, A., Shah, S., Ganatra, S., et al. (2022). Five years of sacubitril/valsartan—a safety analysis of randomized clinical trials and real-world pharmacovigilance. Cardiovasc Drugs Ther. 36 (5), 915–924. doi:10.1007/s10557-021-07210-1
Klepper, M. J., and Edwards, B. (2011). Individual case safety reports--how to determine the onset date of an adverse reaction: a survey. Drug Saf. 34 (4), 299–305. doi:10.2165/11588490-000000000-00000
Lee, S. H., Shin, J.-Y., Park, M.-J., and Park, B.-J. (2014). Agreement of label information of cardiovascular drugs in pregnancy among Korea, the USA, the UK, and Japan. Regul. Toxicol. Pharmacol. 68 (3), 363–369. doi:10.1016/j.yrtph.2014.01.013
Lindquist, M., Ståhl, M., Bate, A., Edwards, I. R., and Meyboom, R. H. (2000). A retrospective evaluation of a data mining approach to aid finding new adverse drug reaction signals in the WHO international database. Drug Saf. 23 (6), 533–542. doi:10.2165/00002018-200023060-00004
Liu, P., He, M., Xu, X., He, Y., Yao, W., and Liu, B. (2023). Real-world safety of Lacosamide: a pharmacovigilance study based on spontaneous reports in the FDA adverse event reporting system. Seizure 110, 203–211. doi:10.1016/j.seizure.2023.07.003
Maciá-Martínez, M.-A., de Abajo, F. J., Roberts, G., Slattery, J., Thakrar, B., and Wisniewski, A. F. Z. (2016). An empirical approach to explore the relationship between measures of disproportionate reporting and relative risks from analytical studies. Drug Saf. 39 (1), 29–43. doi:10.1007/s40264-015-0351-3
Maignen, F., Hauben, M., Hung, E., Holle, L. V., and Dogne, J.-M. (2014). A conceptual approach to the masking effect of measures of disproportionality. Pharmacoepidemiol Drug Saf. 23 (2), 208–217. doi:10.1002/pds.3530
Mazhar, F., Pozzi, M., Gentili, M., Scatigna, M., Clementi, E., Radice, S., et al. (2019). Association of hyponatraemia and antidepressant drugs: a pharmacovigilance-pharmacodynamic assessment through an analysis of the US food and drug administration adverse event reporting system (FAERS) database. CNS Drugs 33 (6), 581–592. doi:10.1007/s40263-019-00631-5
Mcbride, W. G. (1961). Thalidomide and congenital abnormalities. Lancet 278 (7216), 1358. doi:10.1016/S0140-6736(61)90927-8
McMahon, D., and Preskorn, S. H. (2014). The package insert: who writes it and why, what are its implications, and how well does medical school explain it? J. Psychiatr. Pract. 20 (4), 284–290. doi:10.1097/01.pra.0000452565.83039.20
Michel, C., Scosyrev, E., Petrin, M., and Schmouder, R. (2017). Can disproportionality analysis of post-marketing case reports be used for comparison of drug safety profiles? Clin. Drug Investig. 37 (5), 415–422. doi:10.1007/s40261-017-0503-6
Montastruc, J. L., Sommet, A., Bagheri, H., and Lapeyre-Mestre, M. (2011). Benefits and strengths of the disproportionality analysis for identification of adverse drug reactions in a pharmacovigilance database. Br. J. Clin. Pharmacol. 72 (6), 905–908. doi:10.1111/j.1365-2125.2011.04037.x
Mouffak, A., Lepelley, M., Revol, B., Bernardeau, C., Salvo, F., Pariente, A., et al. (2021). High prevalence of spin was found in pharmacovigilance studies using disproportionality analyses to detect safety signals: a meta-epidemiological study. J. Clin. Epidemiol. 138, 73–79. doi:10.1016/j.jclinepi.2021.06.022
Noh, Y., Yoon, D., Song, I., Jeong, H. E., Bae, J. H., and Shin, J.-Y. (2018). Discrepancies in the evidence and recommendation levels of pregnancy information in prescription drug labeling in the United States, United Kingdom, Japan, and korea. J. Womens Health (Larchmt) 27 (9), 1086–1092. doi:10.1089/jwh.2017.6792
Norén, G. N., Caster, O., Juhlin, K., and Lindquist, M. (2014). Zoo or savannah? Choice of training ground for evidence-based pharmacovigilance. Drug Saf. 37 (9), 655–659. doi:10.1007/s40264-014-0198-z
Norén, G. N., Hopstadius, J., and Bate, A. (2013). Shrinkage observed-to-expected ratios for robust and transparent large-scale pattern discovery. Stat. Methods Med. Res. 22 (1), 57–69. doi:10.1177/0962280211403604
Pacurariu, A. C., Straus, S. M., Trifirò, G., Schuemie, M. J., Gini, R., Herings, R., et al. (2015). Useful interplay between spontaneous ADR reports and electronic healthcare records in signal detection. Drug Saf. 38 (12), 1201–1210. doi:10.1007/s40264-015-0341-5
Pariente, A., Daveluy, A., Laribière-Bénard, A., Miremont-Salame, G., Begaud, B., and Moore, N. (2009). Effect of date of drug marketing on disproportionality measures in pharmacovigilance: the example of suicide with SSRIs using data from the UK MHRA. Drug Saf. 32 (5), 441–447. doi:10.2165/00002018-200932050-00007
Pariente, A., Gregoire, F., Fourrier-Reglat, A., Haramburu, F., and Moore, N. (2007). Impact of safety alerts on measures of disproportionality in spontaneous reporting databases: the notoriety bias. Drug Saf. 30 (10), 891–898. doi:10.2165/00002018-200730100-00007
Patadia, V. K., Schuemie, M. J., Coloma, P. M., Herings, R., van der Lei, J., Sturkenboom, M., et al. (2018). Can electronic health records databases complement spontaneous reporting system databases? A historical-reconstruction of the association of rofecoxib and acute myocardial infarction. Front. Pharmacol. 9, 594. doi:10.3389/fphar.2018.00594
Pfistermeister, B., Schenk, C., Kornhuber, J., Bürkle, T., Fromm, M. F., and Maas, R. (2013). Different indications, warnings and precautions, and contraindications for the same drug--an international comparison of prescribing information for commonly used psychiatric drugs. Pharmacoepidemiol Drug Saf. 22 (3), 329–333. doi:10.1002/pds.3389
Pham, M., Cheng, F., and Ramachandran, K. (2019). A comparison study of algorithms to detect drug-adverse event associations: frequentist, bayesian, and machine-learning approaches. Drug Saf. 42 (6), 743–750. doi:10.1007/s40264-018-00792-0
Poluzzi, E., Raschi, E., Piccinni, C., and De Ponti, F. (2012). “Data mining techniques in pharmacovigilance: analysis of the publicly accessible FDA adverse event reporting system (AERS),” in Data mining applications in engineering and medicine (United States: InTech). doi:10.5772/50095
Raschi, E., Fusaroli, M., Ardizzoni, A., Poluzzi, E., and De Ponti, F. (2021). Cyclin-dependent kinase 4/6 inhibitors and interstitial lung disease in the FDA adverse event reporting system: a pharmacovigilance assessment. Breast Cancer Res. Treat. 186 (1), 219–227. doi:10.1007/s10549-020-06001-w
Raschi, E., Fusaroli, M., Diemberger, I., and Poluzzi, E. (2020d). Direct oral anticoagulants and interstitial lung disease: emerging clues from pharmacovigilance. Drug Saf. 43 (11), 1191–1194. doi:10.1007/s40264-020-00990-9
Raschi, E., Gatti, M., Gelsomino, F., Ardizzoni, A., Poluzzi, E., and De Ponti, F. (2020c). Lessons to be learnt from real-world studies on immune-related adverse events with checkpoint inhibitors: a clinical perspective from pharmacovigilance. Target Oncol. 15 (4), 449–466. doi:10.1007/s11523-020-00738-6
Raschi, E., Mazzarella, A., Antonazzo, I. C., Bendinelli, N., Forcesi, E., Tuccori, M., et al. (2019b). Toxicities with immune checkpoint inhibitors: emerging priorities from disproportionality analysis of the FDA adverse event reporting system. Target Oncol. 14 (2), 205–221. doi:10.1007/s11523-019-00632-w
Raschi, E., Moretti, U., Salvo, F., Pariente, A., Cosimo Antonazzo, I., De Ponti, F., et al. (2019a). Evolving roles of spontaneous reporting systems to assess and monitor drug safety. Pharmacovigilance 2019, 79986. doi:10.5772/intechopen.79986
Raschi, E., Piccinni, C., Poluzzi, E., Marchesini, G., and De Ponti, F. (2013). The association of pancreatitis with antidiabetic drug use: gaining insight through the FDA pharmacovigilance database. Acta Diabetol. 50 (4), 569–577. doi:10.1007/s00592-011-0340-7
Raschi, E., Poluzzi, E., and De Ponti, F. (2020b). Reduced neuropsychiatric events as “beneficial reactions” to drugs: seek associations with caution. Brain Behav. Immun. 84, 275–276. doi:10.1016/j.bbi.2019.11.011
Raschi, E., Poluzzi, E., Koci, A., Salvo, F., Pariente, A., Biselli, M., et al. (2015). Liver injury with novel oral anticoagulants: assessing post-marketing reports in the US Food and Drug Administration adverse event reporting system. Br. J. Clin. Pharmacol. 80 (2), 285–293. doi:10.1111/bcp.12611
Raschi, E., Poluzzi, E., Salvo, F., Koci, A., Suling, M., Antoniazzi, S., et al. (2016b). The contribution of national spontaneous reporting systems to detect signals of torsadogenicity: issues emerging from the ARITMO project. Drug Saf. 39 (1), 59–68. doi:10.1007/s40264-015-0353-1
Raschi, E., Poluzzi, E., Salvo, F., Pariente, A., De Ponti, F., Marchesini, G., et al. (2018). Pharmacovigilance of sodium-glucose co-transporter-2 inhibitors: what a clinician should know on disproportionality analysis of spontaneous reporting systems. Nutr. Metab. Cardiovasc Dis. 28 (6), 533–542. doi:10.1016/j.numecd.2018.02.014
Raschi, E., Salvo, F., and Khouri, C. (2022). Conceiving, conducting, reporting, interpreting, and publishing disproportionality analyses: a call to action. Br. J. Clin. Pharmacol. 88 (7), 3535–3536. doi:10.1111/bcp.15269
Raschi, E., Salvo, F., La Placa, M., Poluzzi, E., and De Ponti, F. (2020a). Reduced reporting of neuropsychiatric adverse events with tumor necrosis factor alpha inhibitors for hidradenitis suppurativa: caution before concluding for risk reduction. J. Eur. Acad. Dermatol Venereol. 34 (8), e430–e431. doi:10.1111/jdv.16379
Raschi, E., Salvo, F., Poluzzi, E., and De Ponti, F. (2016a). Safety meta-analysis A call for appropriate use of disproportionality measures from spontaneous reporting systems. J. Am. Coll. Cardiol. 67 (18), 2193. doi:10.1016/j.jacc.2016.01.082
Raschi, E., Schoretsanitis, G., Gastaldon, C., Khouri, C., Salvo, F., and De Ponti, F. (2023). Antipsychotics and drug-induced liver injury: toward minimum requirements in reporting pharmacovigilance studies. J. Clin. Psychopharmacol. 43 (1), 81–83. doi:10.1097/JCP.0000000000001647
Roberto, G., Paoletti, O., Ferraro, S., Hyeraci, G., Franchini, M., Gini, R., et al. (2023). Cases of acquired hemophilia A following COVID-19 vaccines: cogent safety signal or possible reporting/detection bias? Preliminary evidence from Tuscany. Italy. Pharmacoepidemiol Drug Saf. 32 (6), 694–699. doi:10.1002/pds.5615
Rocca, E., Copeland, S., and Ralph Edwards, I. (2019). Pharmacovigilance as scientific discovery: an argument for trans-disciplinarity. Drug Saf. 42 (10), 1115–1124. doi:10.1007/s40264-019-00826-1
Rothman, K. J., Lanes, S., and Sacks, S. T. (2004). The reporting odds ratio and its advantages over the proportional reporting ratio. Pharmacoepidemiol Drug Saf. 13 (8), 519–523. doi:10.1002/pds.1001
Saely, S., Croteau, D., Jawidzik, L., Brinker, A., and Kortepeter, C. (2021). Hypertension: a new safety risk for patients treated with erenumab. Headache 61 (1), 202–208. doi:10.1111/head.14051
Salem, J. E., Yang, T., Moslehi, J. J., Waintraub, X., Gandjbakhch, E., Bachelot, A., et al. (2019). Androgenic effects on ventricular repolarization a translational study from the international pharmacovigilance database to iPSC-cardiomyocytes. Circulation 140 (13), 1070–1080. doi:10.1161/CIRCULATIONAHA.119.040162
Sandberg, L., Taavola, H., Aoki, Y., Chandler, R., and Norén, G. N. (2020). Risk factor considerations in statistical signal detection: using subgroup disproportionality to uncover risk groups for adverse drug reactions in VigiBase. Drug Saf. 43 (10), 999–1009. doi:10.1007/s40264-020-00957-w
Sardella, M., and Lungu, C. (2019). Evaluation of quantitative signal detection in EudraVigilance for orphan drugs: possible risk of false negatives. Ther. Adv. drug Saf. 10, 2042098619882819. doi:10.1177/2042098619882819
Sartori, D., Aronson, J. K., Norén, G. N., and Onakpoya, I. J. (2023). Signals of adverse drug reactions communicated by pharmacovigilance stakeholders: a scoping review of the global literature. Drug Saf. 46 (2), 109–120. doi:10.1007/s40264-022-01258-0
Savill, N., and Bushe, C. J. (2012). A systematic review of the safety information contained within the Summaries of Product Characteristics of medications licensed in the United Kingdom for Attention Deficit Hyperactivity Disorder. how does the safety prescribing advice compare with nationa. Child. Adolesc. Psychiatry Ment. Health 6, 2. doi:10.1186/1753-2000-6-2
Sawalha, A. F., Sweileh, W. M., Zyoud, S. H., and Jabi, S. W. (2008). Comparative analysis of patient package inserts of local and imported anti-infective agents in Palestine. Libyan J. Med. 3 (4), 181–185. doi:10.4176/080907
Schilder, J. M., Golembesky, A., Boyle, T. A. C., Ye, G. L., and Kuplast, J. (2023). Commentary: adverse event profiles of PARP inhibitors: analysis of spontaneous reports submitted to FAERS. Front. Pharmacol. 14, 1241524. doi:10.3389/fphar.2023.1241524
Scholl, J. H. G., and van Puijenbroek, E. P. (2012). Hearing impairment associated with oral terbinafine use: a case series and case/non-case analysis in The Netherlands Pharmacovigilance Centre Lareb database and VigiBaseTM. Drug Saf. 35 (8), 685–691. doi:10.2165/11630630-000000000-00000
Shu, Y., Wang, L., Ding, Y., and Zhang, Q. (2023). Disproportionality analysis of abemaciclib in the FDA adverse event reporting system: a real-world post-marketing pharmacovigilance assessment. Drug Saf. 46 (9), 881–895. doi:10.1007/s40264-023-01334-z
Sillo, H. B., Masota, N. E., Kisoma, S., Rago, L., Mgoyela, V., and Kaale, E. A. (2018). Conformity of package inserts information to regulatory requirements among selected branded and generic medicinal products circulating on the East African market. PLoS One 13 (5), 01974900. doi:10.1371/journal.pone.0197490
Slattery, J., Alvarez, Y., and Hidalgo, A. (2013). Choosing thresholds for statistical signal detection with the proportional reporting ratio. Drug Saf. 36 (8), 687–692. doi:10.1007/s40264-013-0075-1
Smith, K., Golder, S., Sarker, A., Loke, Y., O’Connor, K., and Gonzalez-Hernandez, G. (2018). Methods to compare adverse events in twitter to FAERS, drug information databases, and systematic reviews: proof of concept with adalimumab. Drug Saf. 41 (12), 1397–1410. doi:10.1007/s40264-018-0707-6
Soldatos, T. G., Kim, S., Schmidt, S., Lesko, L. J., and Jackson, D. B. (2022). Advancing drug safety science by integrating molecular knowledge with post-marketing adverse event reports. CPT pharmacometrics Syst. Pharmacol. 11 (5), 540–555. doi:10.1002/psp4.12765
Sultana, J., Moretti, U., Addis, A., Caduff, P., Capuano, A., Kant, A., et al. (2019). Workshop on the Italian pharmacovigilance system in the international context: critical issues and perspectives. Drug Saf. 42 (5), 683–687. doi:10.1007/s40264-018-0768-6
Sutherland, J. M. (1959). Fatal cardiovascular collapse of infants receiving large amounts of chloramphenicol. AMA J. Dis. Child. 97 (6), 761–767. doi:10.1001/archpedi.1959.02070010763001
Szarfman, A., Machado, S. G., and O’Neill, R. T. (2002). Use of screening algorithms and computer systems to efficiently signal higher-than-expected combinations of drugs and events in the US FDA’s spontaneous reports database. Drug Saf. 25 (6), 381–392. doi:10.2165/00002018-200225060-00001
Szarfman, A., Tonning, J. M., Levine, J. G., and Doraiswamy, P. M. (2006). Atypical antipsychotics and pituitary tumors: a pharmacovigilance study. Pharmacotherapy 26 (6), 748–758. doi:10.1592/phco.26.6.748
Tarapués, M., Cereza, G., and Figueras, A. (2013). Association of musculoskeletal complaints and gliptin use: review of spontaneous reports. Pharmacoepidemiol Drug Saf. 22 (10), 1115–1118. doi:10.1002/pds.3503
US national Archives (2023). Freedom of information act (FOIA). US national Archives. https://www.archives.gov/foia (Accessed September 12, 2023).
Valdiserra, G., Mores, N., Rocchi, R. E., Sottosanti, L., Felicetti, P., Marchione, P., et al. (2023). Signal management and risk minimization strategy: a case study on obinutuzumab and non-overt disseminated intravascular coagulation. Front. Drug Saf. Regul. 2023, 1–8. doi:10.3389/fdsfr.2023.1194683
Viola, E., Opri, S., Moretti, U., Leone, R., Casini, M. L., Ruggieri, S., et al. (2014). α1-Adrenergic receptor antagonists and gynecomastia. A case series from the Italian spontaneous reporting system and VigiBase(TM). Eur. J. Clin. Pharmacol. 70 (8), 1003–1009. doi:10.1007/s00228-014-1700-3
Wang, D. Y., Salem, J. E., Cohen, J. V., Chandra, S., Menzer, C., Ye, F., et al. (2018). Fatal toxic effects associated with immune checkpoint inhibitors: a systematic review and meta-analysis. JAMA Oncol. 4 (12), 1721–1728. doi:10.1001/jamaoncol.2018.3923
Wang, L., Feng, W., Duan, J., and Liang, J. (2021). Pharmacovigilance bibliometrics: visualizing thematic development in the category of Pharmacology and pharmacy in web of science. Front. Pharmacol. 12, 731757. doi:10.3389/fphar.2021.731757
Wang, W., Battini, V., Carnovale, C., Noordam, R., van Dijk, K. W., Kragholm, K. H., et al. (2023). A novel approach for pharmacological substantiation of safety signals using plasma concentrations of medication and administrative/healthcare databases: a case study using Danish registries for an FDA warning on lamotrigine. Pharmacol. Res. 193, 106811. doi:10.1016/j.phrs.2023.106811
Watson, S., Chandler, R. E., Taavola, H., Härmark, L., Grundmark, B., Zekarias, A., et al. (2018). Safety concerns reported by patients identified in a collaborative signal detection workshop using VigiBase: results and reflections from lareb and Uppsala monitoring Centre. Drug Saf. 41 (2), 203–212. doi:10.1007/s40264-017-0594-2
Weinstein, R. B., Ryan, P. B., Berlin, J. A., Schuemie, M. J., Swerdel, J., and Fife, D. (2020). Channeling bias in the analysis of risk of myocardial infarction, stroke, gastrointestinal bleeding, and acute renal failure with the use of paracetamol compared with ibuprofen. Drug Saf. 43 (9), 927–942. doi:10.1007/s40264-020-00950-3
Wisniewski, A. F. Z., Bate, A., Bousquet, C., Brueckner, A., Candore, G., Juhlin, K., et al. (2016). Good signal detection practices: evidence from IMI PROTECT. Drug Saf. 39 (6), 469–490. doi:10.1007/s40264-016-0405-1
Keywords: disproportionality analyses, disproportionality, signal detection, SDR, adverse drug reactions, spontaneous reporting database
Citation: Cutroneo PM, Sartori D, Tuccori M, Crisafulli S, Battini V, Carnovale C, Rafaniello C, Capuano A, Poluzzi E, Moretti U and Raschi E (2024) Conducting and interpreting disproportionality analyses derived from spontaneous reporting systems. Front. Drug Saf. Regul. 3:1323057. doi: 10.3389/fdsfr.2023.1323057
Received: 17 October 2023; Accepted: 11 December 2023;
Published: 26 January 2024.
Edited by:
Taxiarchis Botsis, Johns Hopkins University, United StatesReviewed by:
Janet Sultana, Mater Dei Hospital, MaltaPantelis Natsiavas, Institute of Applied Biosciences, Centre for Research and Technology Hellas (INAB|CERTH), Greece
Copyright © 2024 Cutroneo, Sartori, Tuccori, Crisafulli, Battini, Carnovale, Rafaniello, Capuano, Poluzzi, Moretti and Raschi. This is an open-access article distributed under the terms of the Creative Commons Attribution License (CC BY). The use, distribution or reproduction in other forums is permitted, provided the original author(s) and the copyright owner(s) are credited and that the original publication in this journal is cited, in accordance with accepted academic practice. No use, distribution or reproduction is permitted which does not comply with these terms.
*Correspondence: Marco Tuccori, bWFyY28udHVjY29yaUBnbWFpbC5jb20=