 Katherine Le
 Amir Servati1,2
 Peyman Servati
- 1Department of Materials Engineering, The University of British Columbia, Vancouver, BC, Canada
- 2Department of Electrical and Computer Engineering, The University of British Columbia, Vancouver, BC, Canada
Electronic textile (e-textile) systems applied to biological signal monitoring are of great interest to the healthcare industry, given the potential to provide continuous and long-term monitoring of healthy individuals and patients. Most developments in e-textiles have focused on novel materials and systems without systematic considerations into how the hierarchical structure of fibrous assemblies may influence performance and compatibility of the materials during use. This study examines mechanisms underlying the stability and quality of textile-based electrocardiogram (ECG) electrodes used in a smart bra. Signal quality of the biometric data obtained affects feedback and user experience and may be influenced by characteristics and properties of the material. Under stationary and dynamic conditions, analysis of the raw ECG signal and heart rate, with respect to textile-electrode material properties have been performed. Currently, there is no standardized procedure to compare the ECG signal between electrode materials. In this study, several methods have been applied to compare differences between silver-based textile electrodes and silver/silver-chloride gel electrodes. The comparison methods serve to complement visual observations of the ECG signal acquired, as possible quantitative means to differentiate electrode materials and their performance. From the results obtained, signal quality, and heart rate (HR) detection were found to improve with increased skin contact, and textile structures with lower stretch and surface resistance, especially under dynamic/movement test conditions. It was found that the performance of the textile electrode materials compared exceeded ECG signal quality thresholds previously established for acceptable signal quality, specifically for the kurtosis (K > 5), and Pearson correlation coefficients (r ≥ 0.66) taken from average ECG waveforms calculated.
Introduction
The wearable devices market is projected to reach $25 billion (USD) by 2022 (Wood, 2017). While current wearable products used in healthcare have focused on monitoring activity in form of accessories, potential for textile-based integrated wearables is significant due to their comfort, ease of use, longer-term monitoring for patients, and to help guide treatment for practitioners. Additionally, there are many opportunities for integration of e-textiles into consumer grade products and applications, for improving lifestyle and health of the general population. Textile structures with flexible electronic components integrated into clothing are advantageous as they offer inherent flexibility, conforming to the shape of the human body, and can be designed as a network of sensors working in combination to measure various vital signs (Cherenack and van Pieterson, 2012). There are four main components of a smart textile system for sensing applications:
1) Sensor, which takes the form of an electronic/smart textile
2) Power source
3) Microcontroller and circuit
4) Data storage
In this study sensing textiles for electrocardiography is explored. Electrocardiography is a technique in which the electrical activity of the heart is recorded in the form of an electrocardiogram (ECG–voltage vs. time graph) through electrodes that are placed on the skin (Mayo Clinic, 2020). The ECG provides information and assessment of cardiac rhythm, and information relevant for the prediction and treatment of coronary events (Xu et al., 2008; VanRiper and VanRiper, 1998). Electrical currents associated with the contractions produced by the heart muscle can be detected on the skin surface (milivolt scale) by electrodes (Xu et al., 2008). In the clinical setting, the standard ECG utilizes 12 viewpoints of the heart’s structure and function through recording associated electrical activity. Each view reflects a potential difference between a positive and negative electrode, referred to as a lead. The focus of this research is on the chest lead, which measures the potential difference between the left and right arm (Xu et al., 2008).
ECG electrodes are sensors used to transduce ionic current from the body to electron current through the electrode. Gel type silver/silver chloride (Ag/AgCl) electrodes, comprising electrolyte (gel) between the skin and electrode are most widely used in clinical settings. However, these materials are unsuitable for long-term use due to dehydration over time thus affecting signal quality, as well as possible skin irritation and allergic reactions caused by their prolonged application (Baek et al., 2008; Xu et al., 2020). Consequently, alternatives to wet-gel electrodes for long-term monitoring have been explored, which have largely included flexible textile-based electrodes. Advantages of textile-based dry electrodes include greater comfort next to skin due to inherent flexibility to the structures, breathability, and unobtrusive integration into apparel. However, drawbacks of these electrode materials include higher sensitivity to motion and muscle artifacts, and long-term durability.
In this study, the performance and signal quality of commerically available silver-based textile electrodes incorporated into the underband region of a prototype bra have been investigated and compared with traditional Ag/AgCl gel electrodes. Most quality assessments for wearable health sensors apply basic quality assessments rather than diagnostic quality approaches. Basic quality assessments refer to the identification and extraction of heart rate (from R-peaks), identification of some arrhythmia types, basic spectral features, and heart rate variability (HRV) information. Diagnostic quality assessments include the identification of other signal segments and features, and can is used for clinical diagnosis of cardiovascular conditions (i.e. myocardial ischemia, coronary heart disease). Diagnostic quality must be performed under static conditions for accurate detection, with minimal instances of motion artifacts. Several methods were applied in this study to compare differences between silver-based textile electrodes and silver/silver chloride gel electrodes, and quantify their performance, to ultimately guide materials selection. The comparison methods in the time domain included, heart rate variability, skewness, kurtosis, and average waveform template matching, and comparison of power spectral densities of the materials in the frequency domain. The performance of the textile electrode materials compared were found to match the gel electrodes and exceeded ECG signal quality thresholds previously established for acceptable signal quality, which is advantageous as dry textile electrodes offer greater comfort and longevity for long-term ECG monitoring.
Materials and Methods
Electrodes
The performance of silver-based textile electrodes was compared to commercially available 2 cm2 surface area disposable Uni-gel Ag/AgCl electrodes (Thought Technology Ltd., Canada). Silver plated nylon-based conductive fabrics of varying structures were used as dry electrodes, summarized in Table 1. It was found that the fabric properties (stitch density, weight, thickness) did not have a significant effect on the ECG signal quality, owing to the fact that the materials were sourced from various suppliers, and thereby had different yarns and silver coating properties. A detailed comparison of the textile structural properties on performance was not included in this study. Textile electrodes, corresponding to the positive, negative, and ground ECG electrodes were cut to 7 cm2 rectangles (L × W: 3.5 cm × 2 cm), bonded with sheet glue, and heat pressed onto the foam underband region of a women’s prototype bra. The positive and negative electrodes were spaced approximately 20 cm apart on the right and left underband region respectively, and ground was placed 0.5 cm from the negative electrode on the right side of the underband.
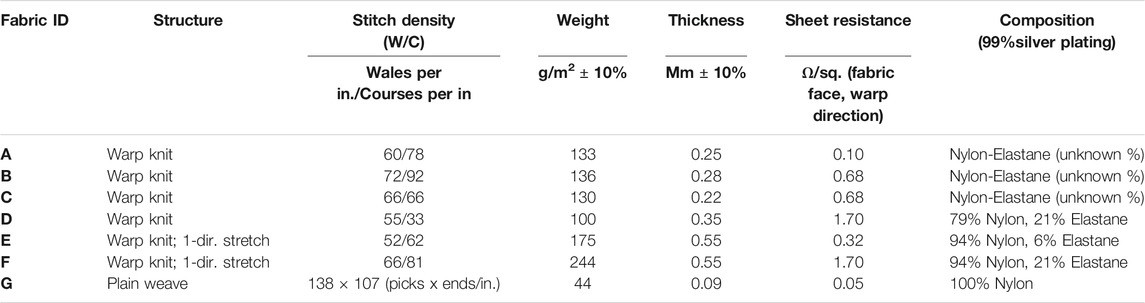
TABLE 1. Conductive fabric (commercially sourced) information.
Sheet Resistance Measurement
Sheet or surface resistance was measured using a four-point probe. Sheet resistance measurements were made for all fabrics tested (face and back of plain fabric, and face of fabric bonded to foam backing). The four-point probe setup consisted of four equally spaced (20 mm) gold metal tips supported by springs, to minimize damage to the sample, and attached to an adjustable stage. The stage height was modified to accommodate different sample thicknesses. A current source (Keithley 2,400 Sourcemeter) supplied current through the two outer probes, and a multimeter (Tektronix DMM 2040) was used to measure the voltage change across the inner two probes, from which the resultant surface resistance was calculated. For a square sample, the sheet resistance is:
where V is the voltage measured by the voltmeter (V), and I is the current that flows through the sample (A). For samples of arbitrary shape, the sheet resistance is defined as:
where k is the geometric correction factor commonly used for non-ideal samples.
k = 4.532 is commonly used when assuming a semi-infinite thin sheet (Heaney, 2003).
From the sheet resistance measurements performed (results in Figure 1), differences were observed when the probe was positioned on the warp and weft directions of the knitted fabrics. In general, lower sheet resistance values were observed in the warp than weft direction, along with lower values for fabrics with higher stitch densities. A possible explanation for this observation may be related to the higher contact points from yarn loops aligned in the warp direction, which is inversely proportional to contact resistance (Wang et al., 2014a; Wang et al., 2014b).
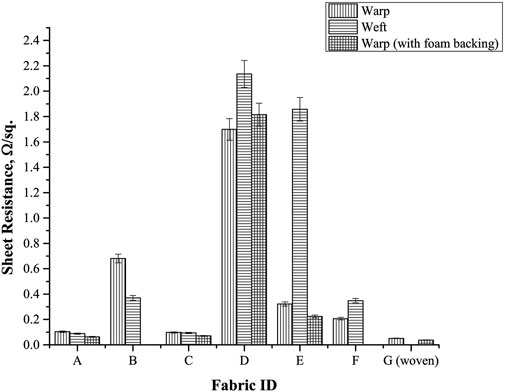
FIGURE 1. Sheet resistance measurement results for conductive fabric. Input source current: 1 mA. (Note: Insufficient material quantity to test Fabric B and F; Fabric G–plain weave, did not display directionality in sheet resistance measurements).
Sheet resistance values were measured to be lower when fabrics were bonded to foam sheets (same foam material used in bra prototype) than plain fabrics (no backing). A possible explanation for this may be due to the material being fixed and slightly contracted when bonded, which could potentially improve and increase the number of contact points from electrode to skin.
Sheet resistance ranking (Table 2), from lowest to highest resistance, specifically taking the warp direction on the face side of the fabrics are listed.

TABLE 2. Sheet resistance measurement ranking–lowest to highest.
Electrode Pair Impedance
Following ANSI/AAMI EC12:2000/(R)2015, Section 4.2.2.1 (ANSI/AAMI, 2015), the average impedance of clamped electrode pairs (7 cm2 rectangles, bonded to 3 mm foam fabric) connected face-to-face was measured using an LCR-bridge meter (HM8118, Hameg Instruments, Germany), summarized in Figure 2. Impedance was scanned from 20 Hz to 10 kHz frequencies. This initial measurement excludes effects from skin-electrode interface and tissue impedance, with ECG lead clamps included in the results. The observed results meet the ANSI/AAMI standard requirement, less than 2 kΩ.
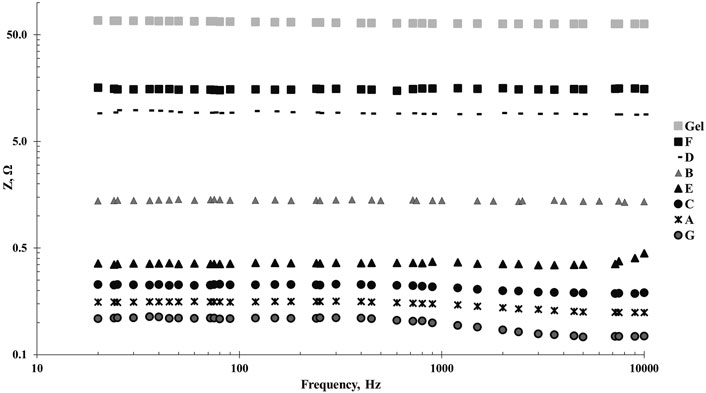
FIGURE 2. Average face-to-face impedance from three measurement trials of electrode pairs.
Electrocardiogram Measurement
ECG was measured using a clinical 1-lead ECG system (2048 samples/sec.) from Thought Technology Ltd. comprising a data acquisition, processing, and analysis software (BioGraph Infiniti). Figure 3 depicts the experimental set up of the clinical system and electrodes. Tests under stationary (sitting) and movement conditions (running on the spot) were performed, with at least three 6 min trials. The placement for both gel and fabric electrodes followed the configuration on the underband positions specified for the women’s bra is shown in Figure 4. The positive and negative electrodes (L x W: 3.5 cm × 2.0 cm) were spaced approximately 20 cm apart on the right and left underband region respectively, and ground was placed 0.5 cm from the negative electrode on the right side of the underband. With skin electrical properties known to vary along different parts of the body, this results in differing contact impedance values for different electrode placements, thereby affecting the signal morphology. As a result, tests for the gel and textile electrodes could not be performed simultaneously, to ensure the same recording locations on the body were used. A set of tests performed with gel electrodes were performed prior to each test with textile electrodes.
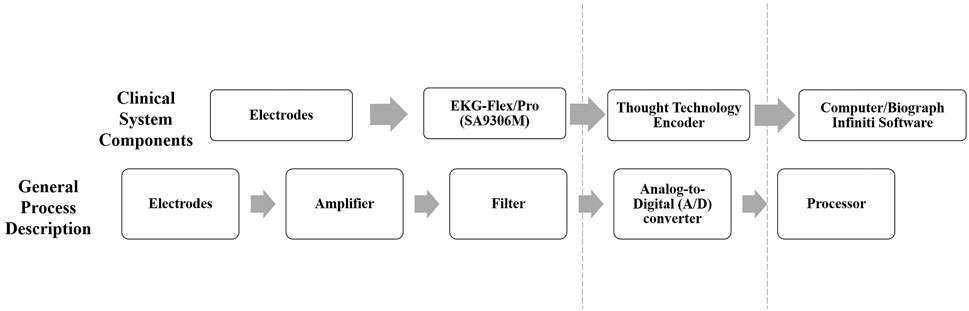
FIGURE 3. Schematic of clinical ECG system setup.
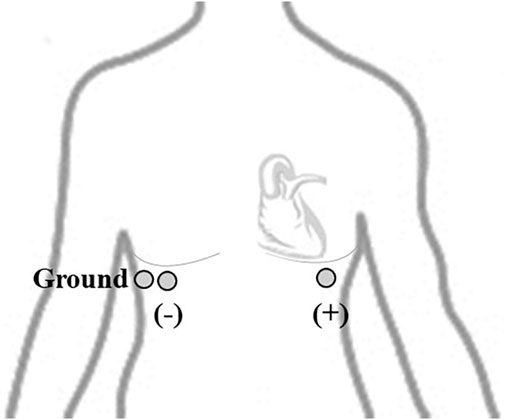
FIGURE 4. Underband electrode placement locations (not to scale).
Electrocardiogram Signal Performance Comparison
The characteristic ECG waveform and its respective components are displayed in Figure 5A. The P wave results from the atrial depolarization. The QRS complex corresponds to the ventricular depolarization, and typically is the largest wave, as the ventricles have larger muscle mass. The T wave corresponds to the ventricular repolarization.
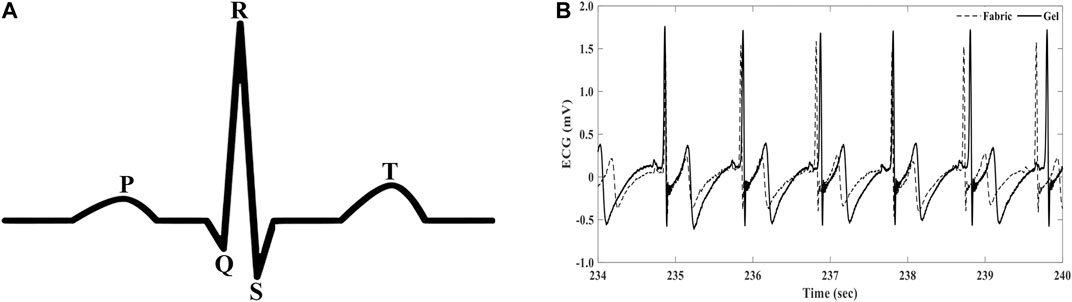
FIGURE 5. (A) Standard ECG waveform. (B) Sample visual comparison stationary recording of conductive textile and gel electrodes (not performed simultaneously).
Most approaches for signal and textile ECG electrode comparison have relied on qualitative visual comparison of the signal (Figure 5B), which limit the ability to compare between candidate materials from standard gel electrodes.
Several methods were investigated to compare ECG signal quality from the different electrode materials.
Time Domain
Variability (coefficient of variation, % CV) in R-R intervals (for inter-beat interval, IBI)
The inter-beat interval (IBI) can be obtained from the ECG signal by measuring the time difference between successive R-R intervals across a test, measured in milliseconds (ms). The number of R wave occurrences in 1 min is used to calculate the heart rate (HR) in beats per minute (bpm). For example: If one IBI or one beat spans 1,000 ms, then over a period of 1 min, the number of beats is 60.
The IBI data across each trial performed was obtained from the BioGraph Infiniti software. The average heart rates were calculated and compared for the materials. From the raw data (IBI values), standard deviations (SD) were calculated, and the average coefficient of variation (CV, the ratio of the SD to Mean, expressed in %) for each material was obtained.
For each set of textile electrodes tested (stationary and movement conditions) a set of gel electrode tests (stationary and movement, standard chest placement) were performed on the same day/session serving as the baseline comparison tests, with results compared in the same manner. Given that the gel and textiles could not be compared simultaneously, owing to variability in signal morphology at different locations on the body, the average HR could not be directly compared. However, it was deemed practical to compare the % CV or spread of the data sets.
Skewness (symmetry of distribution) and Kurtosis (sharpness of distribution peak)
Skewness and Kurtosis are the third and fourth standardized moments of a probability distribution, respectively. Skewness (Eq. 3) is the measure of symmetry in the distribution, taking positive or negative values, which correspond to the right or left tail of the distribution, respectively (Orphanidou, 2018). Kurtosis (Eq. 4) is the measure of sharpness in the peak of the distribution (Orphanidou, 2018). Distributions with many outliers are expected to have lower values of kurtosis, since the probability distribution will be flatter and less symmetrical, while distributions with little to no outliers are expected to be symmetric, with sharper peaks (higher skewness and kurtosis values) (Orphanidou, 2018). Skewness and kurtosis were proposed as quality indices for outliers and noise present in ECG segments, where the kurtosis of 10 s ECG segments was measured and used as a signal quality index (Li et al., 2008; Clifford et al., 2012).
Clifford et al. demonstrated muscle artifacts to have a kurtosis (K) of approximately 5, and baseline wander and power-line interference lower than 5. Orphanidou et al. found the kurtosis of a clean ECG in sinus rhythm to have kurtosis values larger than 5 (Orphanidou, 2018). Expected values for skewness were not defined in ECG quality index methods reported. Skewness and kurtosis functions were calculated in MATLAB® (R2019a, The Mathworks Inc., RRID:SCR_001622).
Figures 6A–C display three examples of 10 s ECG segments and corresponding distributions with skewness and kurtosis values for different signal quality features. Figure 6A shows a clean ECG signal with a large kurtosis value (K = 27.53, S = 4.06). Figure 6B shows an ECG segment where the signal contains a large amount of noise and motion artifact, and a corresponding low kurtosis value (K = 4.27), and relatively symmetric distribution, with a low skewness value (S = 0.29). Figure 6C shows an ECG segment with baseline wander, with K = 3.25, S = 0.54. Signal features from Figures 6B,C follow observations from Clifford et al. with muscle or motion artifacts shown to have a kurtosis value of around 5, and baseline wander to have a kurtosis value lower than 5 (Clifford et al., 2012). Work by (Qin et al., 2019) investigated ECG signal quality of nanowire electrodes with gel electrode materials and applied several statistical signal quality indices to their analysis, including the kurtosis value of greater than or equal to 5 as being “Good Quality” signal.
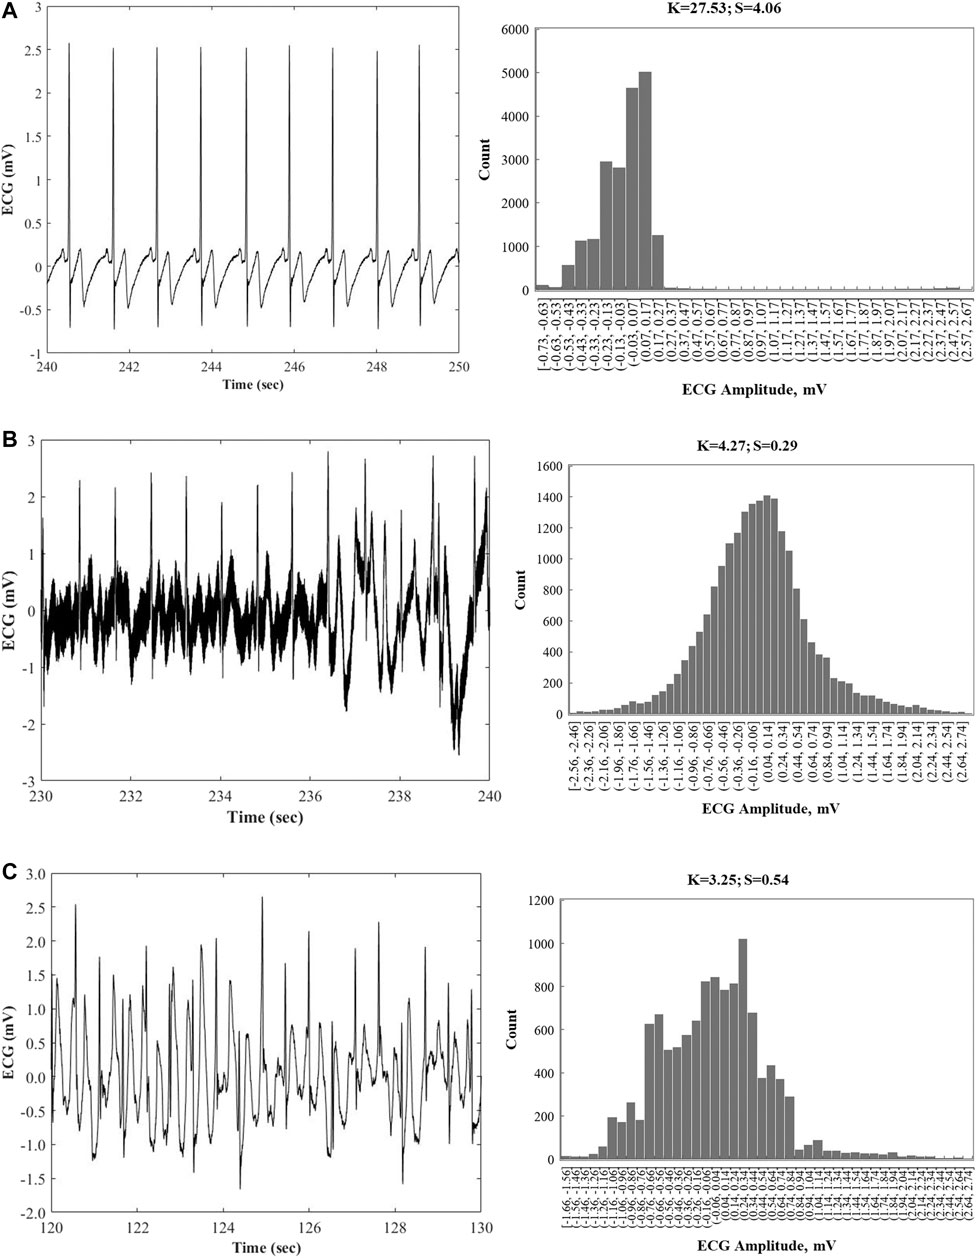
FIGURE 6. Examples of 10 s ECG segments containing notable signal quality features and corresponding distributions, with calculated kurtosis and skewness values. (A) A clean ECG segment with a large kurtosis value (K = 27.53, S = 4.06). (B) The segment contains a large amount of noise and motion artifacts, corresponding to a low kurtosis value (K = 4.27), and relatively symmetric distribution (S = 0.29). (C) Baseline wander is observed in this segment (K = 3.25, S = 0.54).
Average Waveform–Template Matching
The average ECG waveform for each electrode material was obtained across the signals collected (example shown in Figure 7). This trend-based method compares the similarities of the morphology of the ECG waveform. The method was carried out in MATLAB® (R2019a, The Mathworks Inc., RRID:SCR_001622), and modified from Orphanidou’s work (Orphanidou, 2018) to use the entire PQRST waveform, as opposed to only the QRS complex. The following steps were carried out:
1. Determine the location of R peaks in 6 min signal trial (2048 samples/second, 737,280 data points).
2. Determine duration of R-R intervals (number of points) across entire trial, obtain the median value.
3. Apply median as the total time for each data window.
4. Create data windows, centering each R peak around the median (Figure 7).
5. Average all data windows created to obtain the final average waveform across the 6 min trial recording.
6. Calculate the Pearson correlation coefficient between corresponding sets of gel and textile electrodes.
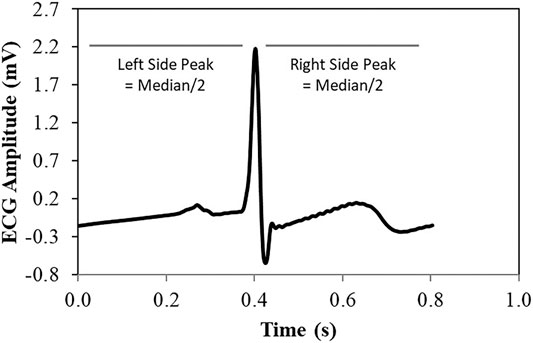
FIGURE 7. Data windows for each waveform in the ECG signal collected were obtained by centering the R-peak around the medial R-R interval duration, from which the average waveform was obtained.
From the final average waveform, the Pearson’s correlation coefficient, PCC (Eq. 5) was calculated between each textile electrode material and corresponding gel electrode trial. Results were compared to the assigned metrics for template matching quality indices determined empirically by Orphanidou (Orphanidou, 2018): PCC >/ = 0.66 acceptable, and <0.66 unacceptable.
Frequency Domain
Power spectral density (PSD) comparison between ECG signals of textile and gel electrodes was carried out, with PSD curves obtained from the averaged time domain waveforms overlapped for a visual examination of the frequency components.
Results and Discussion
Coefficient of Variation in R-R Intervals
The coefficient of variation across R-R intervals of the 6 min trials were measured under stationary and movement conditions and ordered from lowest to highest % CV (for movement conditions), in Table 3. During stationary tests, it was observed that across the two material groups (gel and textile), the average % CV were within the same range, with an average of 6.88 and 6.47% respectively. As expected, the recorded R-R intervals from the gel electrodes were found to have lower variation under movement conditions than textile electrodes, likely owing to increased contact with the skin surface by adhesion and wet gel electrolyte material. From the textile electrodes compared, Fabrics G and F showed lowest variation under movement conditions, likely due to the fact that the materials have limited stretch (Fabric G is a non-stretch woven, Fabric F has stretch in 1-direction), which is likely to result in greater skin contact area and minimal movement next to skin compared to the other fabric materials tested.
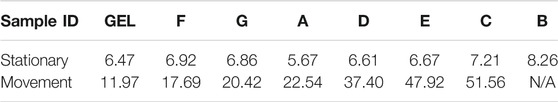
TABLE 3. Average coefficient of variation (%) from three trials, stationary and movement conditions.
Kurtosis and Skewness
Kurtosis and skewness results obtained from 6 min trials (approx. 737,280 data points) from gel and textile electrodes under stationary conditions are summarized in Tables 4,5, with textile electrodes ordered from highest to lowest values. The average standard deviations of the measured kurtosis values across the 10 s segments from each 6 min trial are reported in Table 4. There is a general trend of increasing standard deviation with decreasing kurtosis values, which may be indicative of more signal variation or outliers. Figure 8 shows an example plot of calculated kurtosis values from 10 s segments of a selected test trial for Fabric A, compared to the gel electrode measurement (performed in the same-day session).

TABLE 4. Average kurtosis values, and standard deviation across 10s ECG segments from 6-min trials (stationary condition) ranked in descending order of results.

TABLE 5. Average skewness values from three 6-min ECG trials ranked in descending order of results.
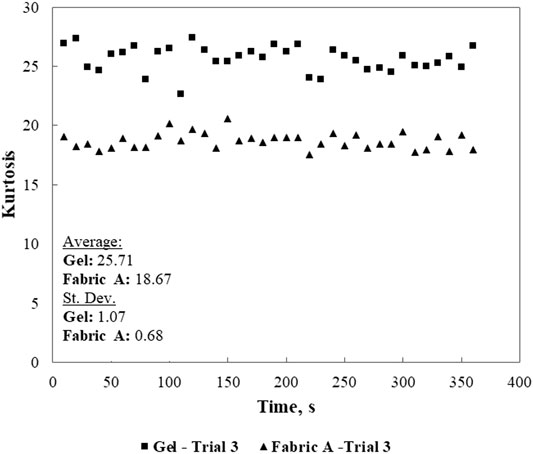
FIGURE 8. Example plot of calculated kurtosis values from 10-s segments of a selected test trial for Fabric A, compared to the gel electrode measurement (performed in the same-day session).
The reported results all have kurtosis values larger than 5, which corresponds to a clean ECG signal as defined and observed by Orphanidou (Orphanidou, 2018) The gel electrodes have the highest kurtosis and skewness values, compared to the textile electrodes. The top three fabrics with higher kurtosis values (A, G, E) were also observed to match the lowest sheet resistance values. This indicates that fabrics with lower sheet resistance (or higher surface conductance) correspond to good signal quality.
Template Matching–Average Waveform
The average ECG waveforms were obtained for stationary ECG tests for each textile electrode material, compared with the standard gel electrode (example waveform for each material shown in Figures 9A-G). It can be observed that the amplitude of the average waveform for the gel electrodes were higher than textile electrodes; however, this difference does not affect the heart rate determination from the signal collected. The Pearson’s correlation coefficient (PCC) values were calculated for each textile electrode compared against the standard gel electrode and summarized in Table 6. PCC values exceeded the minimum acceptable value (>/ = 0.66) defined by Orphanidou (Orphanidou, 2018), further demonstrating similarities between the two material groups.
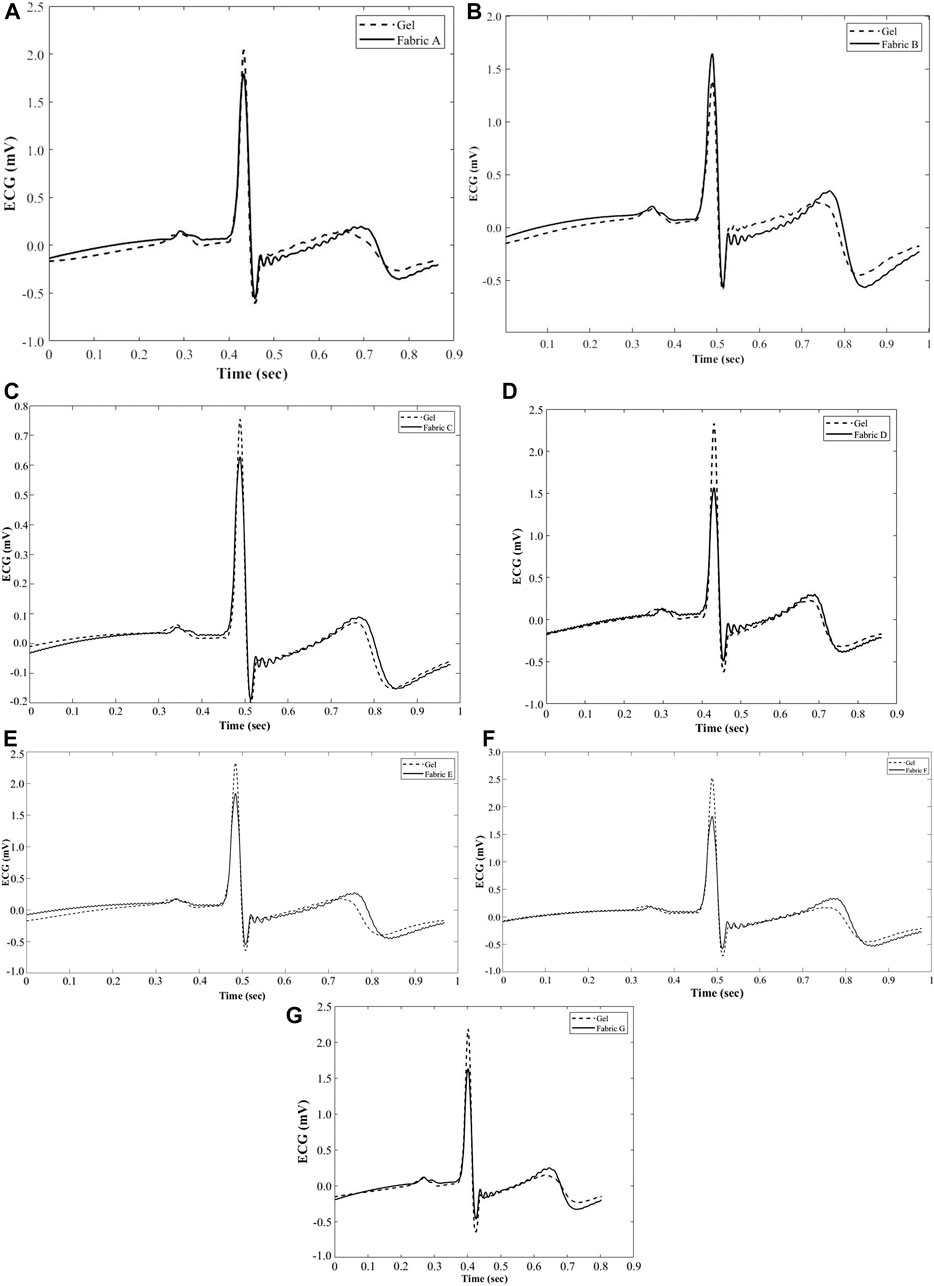
FIGURE 9. (A–G) Example average waveform for each electrode material compared with gel electrode.

TABLE 6. Summary of PCC calculated from textile electrodes compared with standard gel electrode.
Power Spectral Density Comparison
The comparison between PSDs for the different electrode materials are displayed in Figure 10. The analysis was carried out on the ECG signals over the 6-min trials carried out for each material. In general, from a visual observation of the spectral plots, the textile electrodes follow the same trend as the gel electrode, with the corresponding main frequency components, but higher magnitudes.
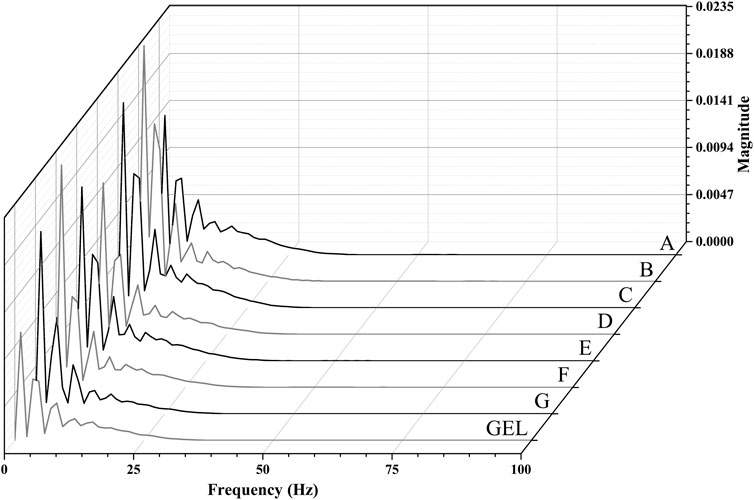
FIGURE 10. Spectral plots for the different electrode materials compared demonstrate that the textiles follow the same trend as the gel electrode, with higher overall magnitudes observed.
Conclusions
The preliminary work presented aims to establish the foundation for the objective evaluation and comparison of signal quality for ECG electrode materials. Under stationary and movement conditions, analysis of ECG signal with respect to textile material properties have been performed. It was found that signal quality and HR detection is improved with increased skin contact, and textile electrodes with lower surface resistance and stretch. Several methods have been identified to quantify and compare differences between the textile and gel electrodes in time and frequency domains. The methods applied serve to complement visual observations of the ECG signal acquired, as possible quantitative means to differentiate electrode materials and their performance. From the signal quality comparison methods selected, the performance of textile electrodes exceeded existing quality thresholds established, specifically for the kurtosis results (K greater than 5), and acceptable Pearson correlation coefficients (r greater than 0.66) taken from the average ECG waveform morphologies. Textile electrodes are promising options for long-term ECG monitoring, and the research has identified the need to establish a standardized approach to compare differences between electrode materials, to ultimately guide the development and objective selection of e-textile systems for health monitoring.
Data Availability Statement
The raw data supporting the conclusion of this article will be made available by the authors, without undue reservation.
Author Contributions
KL: First author in this study, completed experiments and wrote manuscript. AS: Second author, contributed ideas and advice in experimental work and manuscript. SS: Third author, contributed ideas and assembled measurement tool for experimental work. PS and FK: These authors have contributed equally to this study and share last authorship, as principal investigators (PI) on this project.
Funding
Appreciation is expressed to MITACS Accelerate (Award Ref. IT11116), VITALI Wear Inc., the National Sciences and Engineering Research Council (NSERC) and the Canada Foundation for Innovation (CFI) for providing funding for this project.
Conflict of Interest
The authors declare that the research was conducted in the absence of any commercial or financial relationships that could be construed as a potential conflict of interest.
References
ANSI/AAMI (2015). EC12:2000/(R)2015: Disposable ECG Electrodes. The American National Standards Institute (ANSI), and The Association for the Advancement of Medical Instrumentation (AAMI).
Baek, J.-Y., An, J.-H., Choi, J.-M., Park, K.-S., and Lee, S.-H. (2008). Flexible Polymeric Dry Electrodes for the Long-Term Monitoring of ECG. Sensors Actuators A: Phys. 143, 423–429. doi:10.1016/j.sna.2007.11.019
Cherenack, K., and van Pieterson, L. (2012). Smart Textiles: Challenges and Opportunities. J. Appl. Phys. 112, 091301. doi:10.1063/1.4742728
Clifford, G. D., Behar, J., Li, Q., and Rezek, I. (2012). Signal Quality Indices and Data Fusion for Determining Clinical Acceptability of Electrocardiograms. Physiol. Meas. 33, 1419–1433. doi:10.1088/0967-3334/33/9/1419
Heaney, M. B. (2003). “Electrical Conductivity and Resistivity,” in Electrical Measurement, Signal Processing in Displays. Editor J. G. Webster (Boca Raton, FL: CRC Press), 7.1–7.14.
Li, Q., Mark, R. G., and Clifford, G. D. (2008). Robust Heart Rate Estimation from Multiple Asynchronous Noisy Sources Using Signal Quality Indices and a Kalman Filter. Physiol. Meas. 17. doi:10.1109/icbbe.2008.876
Mayo Clinic (2020). Electrocardiogram (ECG or EKG). Available at: https://www.mayoclinic.org/tests-procedures/ekg/about/pac-20384983 (Accessed November 5, 2020).
Orphanidou, C. (2018). Signal Quality Assessment in Physiological Monitoring: State of the Art and Practical Considerations. Cham, Switzerland: Springer International Publishing, 61.
Qin, Q., Li, J., Yao, S., Liu, C., Huang, H., and Zhu, Y. (2019). Electrocardiogram of a Silver Nanowire Based Dry Electrode: Quantitative Comparison with the Standard Ag/AgCl Gel Electrode. IEEE Access 7, 20789–20800. doi:10.1109/ACCESS.2019.2897590
VanRiper, S., and VanRiper, J. (1998). Cardiac Diagnostic Tests: A Guide for Nurses. Philadelphia: W.B. Saunders Company.
Wang, J., Long, H., Soltanian, S., Servati, P., and Ko, F. (2014b). Electro-mechanical Properties of Knitted Wearable Sensors: Part 2 - Parametric Study and Experimental Verification. Textile Res. J. 84, 200–213. doi:10.1177/0040517513490057
Wang, J., Long, H., Soltanian, S., Servati, P., and Ko, F. (2014a). Electromechanical Properties of Knitted Wearable Sensors: Part 1 - Theory. Textile Res. J. 84, 3–15. doi:10.1177/0040517513487789
Wood, L. (2017). Wearable Devices Market - Forecasts from 2017 to 2022 (2017). Available at: https://www.businesswire.com/news/home/20171116005701/en/Wearable-Devices-Market---Forecasts-from-2017-to-2022---Research-and-Markets (Accessed November 5, 2020).
Keywords: e-textiles, electrocardiogram, signal quality, electrode, textiles
Citation: Le K, Servati A, Soltanian S, Servati P and Ko F (2021) Performance and Signal Quality Analysis of Electrocardiogram Textile Electrodes for Smart Apparel Applications. Front. Electron. 2:685264. doi: 10.3389/felec.2021.685264
Received: 24 March 2021; Accepted: 08 June 2021;
Published: 29 June 2021.
Edited by:
In cheol Jeong, Icahn School of Medicine at Mount Sinai, United StatesReviewed by:
Lingyun Wang, City University of Hong Kong, ChinaChinmay Chakraborty, Birla Institute of Technology, Mesra, India
Copyright © 2021 Le, Servati, Soltanian, Servati and Ko. This is an open-access article distributed under the terms of the Creative Commons Attribution License (CC BY). The use, distribution or reproduction in other forums is permitted, provided the original author(s) and the copyright owner(s) are credited and that the original publication in this journal is cited, in accordance with accepted academic practice. No use, distribution or reproduction is permitted which does not comply with these terms.
*Correspondence: Katherine Le, bGVrYXRoZXJAc3R1ZGVudC51YmMuY2E=