 Pablo Armañac-Julián1,2*
 Spyridon Kontaxis1,2
 Andrius Rapalis3,4
 Vaidotas Marozas3,4
 Pablo Laguna1,2
 Raquel Bailón1,2
 Eduardo Gil1,2
 Jesús Lázaro1,2
- 1Biomedical Signal Interpretation and Computational Simulation (BSICoS) Group at the Aragón Institute of Engineering Research (I3A), IIS Aragón, University of Zaragoza, Zaragoza, Spain
- 2CIBER-BBN, Instituto de Salud Carlos III, Madrid, Spain
- 3Biomedical Engineering Institute, Kaunas University of Technology, Kaunas, Lithuania
- 4Department of Electronics Engineering, Kaunas University of Technology, Kaunas, Lithuania
Pulse photoplethysmography (PPG) is a simple and economical technique for obtaining cardiovascular information. In fact, PPG has become a very popular technology among wearable devices. However, the PPG signal is well-known to be very vulnerable to artifacts, and a good quality signal cannot be expected for most of the time in daily life. The percentage of time that a given measurement can be estimated (e.g., pulse rate) is denoted coverage (C), and it is highly dependent on the subject activity and on the configuration of the sensor, location, and stability of contact. This work aims to quantify the coverage of PPG sensors, using the simultaneously recorded electrocardiogram as a reference, with the PPG recorded at different places in the body and under different stress conditions. While many previous works analyzed the feasibility of PPG as a surrogate for heart rate variability analysis, there exists no previous work studying coverage to derive other cardiovascular indices. We report the coverage not only for estimating pulse rate (PR) but also for estimating pulse arrival time (PAT) and pulse amplitude variability (PAV). Three different datasets are analyzed for this purpose, consisting of a tilt-table test, an acute emotional stress test, and a heat stress test. The datasets include 19, 120, and 51 subjects, respectively, with PPG at the finger and at the forehead for the first two datasets and at the earlobe, in addition, for the latter. C ranges from 70% to 90% for estimating PR. Regarding the estimation of PAT, C ranges from 50% to 90%, and this is very dependent on the PPG sensor location, PPG quality, and the fiducial point (FP) chosen for the delineation of PPG. In fact, the delineation of the FP is critical in time for estimating derived series such as PAT due to the small dynamic range of these series. For the estimation of PAV, the C rates are between 70% and 90%. In general, lower C rates have been obtained for the PPG at the forehead. No difference in C has been observed between using PPG at the finger or at the earlobe. Then, the benefits of using either will depend on the application. However, different C rates are obtained using the same PPG signal, depending on the FP chosen for delineation. Lower C is reported when using the apex point of the PPG instead of the maximum flow velocity or the basal point, with a difference from 1% to even 10%. For further studies, each setup should first be analyzed and validated, taking the results and guidelines presented in this work into account, to study the feasibility of its recording devices with respect to each specific application.
1 Introduction
Pulse photoplethysmography (PPG) remains a simple and economical technique to obtain cardiovascular information using sensors that can be placed in different parts of the body such as the wrist, fingertip, earlobe, or forehead (Nitzan et al., 1998; Allen, 2007; Bernardi et al., 2014). These features make PPG a very popular technology among wearable devices. However, the PPG signal is well-known to be very vulnerable to motion artifacts (Ismail et al., 2021). In fact, during daily life when individuals engage in moderate or vigorous physical activity, good quality cannot be expected most of the time.
The potential applications of a wearable device depend on the percentage of time that physiological parameters (e.g., mean pulse rate) can be estimated, which is known as coverage. The PPG coverage is highly dependent on the configuration of the sensor: transmission/reflection, location, and stability of the contact between the sensor and the body. Few works such as Orphanidou et al. (2014) reported measurements of coverage for PPG-based wearable devices, ranging from 14% to 56% (Bonomi et al., 2018; Eerikäinen et al., 2018; Tarniceriu et al., 2018; Bashar et al., 2019).
Choosing the most feasible sensor location and measurement technique for pulse rate variability (PRV) analysis may thus be challenging (Nilsson et al., 2007; Buxi et al., 2015). This work aims to quantify the coverage of PPG-based devices when placing them over different locations of the body. Three different datasets are analyzed, studying the percentage of time that pulses can be detected in different PPG signals recorded at different places of the body and under different conditions. In addition, the feasibility of estimating well-known series dependent on PPG—such as pulse arrival time (PAT) or pulse amplitude variability (PAV)—is also considered.
A large variety of different devices exist to register the PPG signal adapted to different parts of the body, including the forehead, earlobe (Lu et al., 2009; Vescio et al., 2018), in-ear, chest (Chreiteh et al., 2014), abdomen (Spigulis, 2005), vagina, wrist (Grajales and Nicolaescu, 2006; Salehizadeh, 2015), and so on. The most common place for the PPG sensor in clinical practice is the fingertip or the earlobe (Rhee et al., 2001; Wang et al., 2007). In this setup, PPG is usually used for heart rate (HR) and peripheral oxygen saturation monitoring. On the other hand, the wrist is a more common place for PPG acquisition by wearable devices.
Wearable pulse rate (PR) sensors based on PPG signals have become popular for instantaneous assessment of PR (Tamura et al., 2014; Zhang, 2014). Lots of previous studies, such as Charlot et al. (2009), Porto and Junqueira (2009), Gil et al. (2010), Khandoker et al. (2011), Lin et al. (2014), Pinheiro et al. (2016), and Peralta et al. (2019), analyzed the feasibility of PRV as a surrogate of heart rate variability (HRV). These findings show sufficient accuracy under non-stationary conditions, but results regarding the position of the sensor are not conclusive (Schäfer and Vagedes, 2013). However, none analyzed explicitly the coverage of the PPG and compared different setups, body locations, and fiducial points (FPs).
The present work is focused on the coverage of the detection of PPG pulses and their reliability to derive cardiovascular indices such as HR and PAT. The results are obtained using scientific equipment, not commercial wearables, but the results will help to approach future projects based on wearables.
2 Materials
Three datasets are analyzed. These datasets are composed of PPG signals recorded at different body places and electrocardiogram (ECG) signals in three different stress protocols. All signals were simultaneously registered using commercial recording devices. The subjects analyzed for the datasets are independent of each other.
These protocols for stress tests are explained in detail and have been extensively studied in previous studies (Hernando et al., 2016; Peralta et al., 2019; Cernych et al., 2021). These will be summarized in the following three subsections. All the data were collected according to the Declaration of Helsinki, and the specific inclusion-exclusion criteria are mentioned in the corresponding studies (Hernando et al., 2016; Peralta et al., 2019; Cernych et al., 2021). Note that all subjects included in the three datasets are young healthy volunteers with no cardiac comorbidities or cardiovascular problems.
2.1 Tilt-table orthostatic stress test dataset
The tilt-table test (TTT) protocol consisted of 10 min in the early resting supine position (R1), followed by 5 min tilted up 80° (T), and 5 min back to the resting supine position (R2). There are 19 subjects available. As mentioned, note that the total time spent in this protocol is around 20 min.
During TTT, various biomedical signals were recorded, including ECG lead II and PPG at two wavelengths, red (660 nm, R-PPG) and infrared (940 nm, IR-PPG), a transmission-based PPG signal at the finger, and a reflection-based PPG signal at the forehead. All these signals were simultaneously recorded by Cardioholter 6.2-8E78 (Biomedical Engineering Institute of Kaunas University of Technology, Lithuania), using a sampling rate of 500 Hz for the ECG signal and 250 Hz for the PPG signals. Further details can be obtained in the study by Peralta et al. (2019).
2.2 Acute mental stress test dataset
The mental stress test data include ECG and PPG signals recorded from volunteer students at the Autonomous University of Barcelona (UAB), University of Zaragoza (UZ), and Polytechnique University of Madrid (UPM). The ABP 10 module (Medicom 83 System, MTD Ltd., Russia) was used for the simultaneous and synchronized acquisition of the PPG on both forehead and finger sampled at 250 Hz, and the Y orthogonal lead ECG (Frank Lead System), using a sampling rate of 1 kHz for all signals. A total of 120 young healthy subjects, not previously diagnosed with any chronic or psychological disease, performed the stress test. However, due to issues during the recordings, PPG at the forehead is only available for 41 subjects.
All subjects underwent a basal session (BS) and a stress session (SS). The BS session consisted of a total 35-min-length relaxing audition. On another day, during the ES session, emotional stress was induced by means of a modified Trier Social Stress Test. Refer to Hernando et al. (2016) for more information on the protocol. The total time spent in the SS, for each volunteer to complete the different stress stages, is around other 35 min.
2.3 Heat stress dataset
The heat stress test protocol consisted of repetitive exposures to a sauna characterized by air with a relative humidity of 30% and a high temperature of 80–90°C. Before and after sauna exposures, participants were instructed to rest in semi-Fowler’s position in a neutral temperature environment (25°C). The total duration of the protocol was approximately 2 h and 20 min.
The data were acquired simultaneously by using the Nautilus1 (Biomedical Engineering Institute of Kaunas University of Technology, Lithuania). The database includes the conventional three-lead (I, II, and III) ECG data and three PPG signals at two wavelengths, IR-PPG and R-PPG, with the PPG from the right hand, forehead, and earlobe, were recorded at 1,000 Hz, all synchronized. This dataset was recorded at Lithuanian Sports University, and it includes biomedical signals from 51 healthy subjects. Further details are given in Kontaxis et al. (2019) and Cernych et al. (2021).
3 Methods
3.1 Electrocardiogram delineation
The R-wave is detected for each heartbeat by means of a wavelet-based method (Martínez et al., 2004). The time instants of each R-wave are denoted as n R. The time between two successive R-waves defines the RR interval. The inverse of the RR intervals is used to calculate the HR, in beats per minute (bpm).
Ectopic beats and miss-detections are corrected as described in Mateo and Laguna (2003). The exclusion of non-normal RR intervals results in the normal-to-normal (NN) interval series, from which the HR is derived.
3.2 Pulse photoplethysmography delineation
First, PPG signals, denoted as d PPG(n), are band-pass filtered between 0.3 and 15 Hz with a 4th-order Chebyshev type II filter in order to eliminate the baseline contamination and high-frequency noise (see Elgendi (2016)). Forward–backward zero-phase filtering was applied for preserving signal morphology.
Following PPG filtering and before PPG delineation, it is necessary to remove motion artifacts. A wide variety of artifact detectors are available in the literature, from which we chose one based on the energy of the PPG signal (Armanac et al., 2019), aiming to eliminate only those noticeable artifacts characterized by higher energy than clean segments. The detection of energy-based artifacts is performed in the following steps:
1) First, the PPG signal, d PPG(n), is squared to emphasize the segments with artifacts related to high energy:
2) The moving variance signal,
3) The moving median signal, m(n), of
4) The decision criterion is established to
The two window lengths and the decision criteria scalar are set empirically. As commented, the detected segments of artifacts are removed from the original data for further analysis. Figure 1 illustrates the performance of this artifact detector.
After that, cubic spline interpolation was performed over the PPG signals to obtain a 1,000 Hz version of the PPG signals to increase the time resolution to define the FP. Each PPG pulse is detected by an algorithm that determines the maximum up-slope instant of each PPG pulse based on a low-pass differentiator filter and a time-varying threshold (see Lázaro et al. (2013b)). Four FPs are computed and subjected to analysis (see Figure 2). The maximum up-slope instant (maximum in the first derivative) for a PPG pulse is denoted as n D, representing the time instant when the pulse reaches the maximum flow velocity during the ventricular systole. Afterward, the n A and n B instants are denoted by the apex and the basal point of the corresponding PPG pulse. For PR estimation, ectopic beats are corrected for each FP point of each PPG, using the algorithm proposed by Mateo and Laguna (2003).
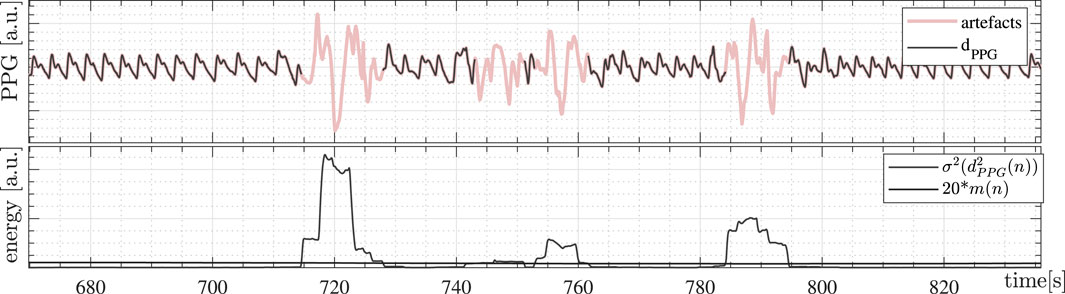
FIGURE 1. PPG artifact detection based on the energy of the signal. Detected PPG artifacts are in red at the top. The estimated energy,
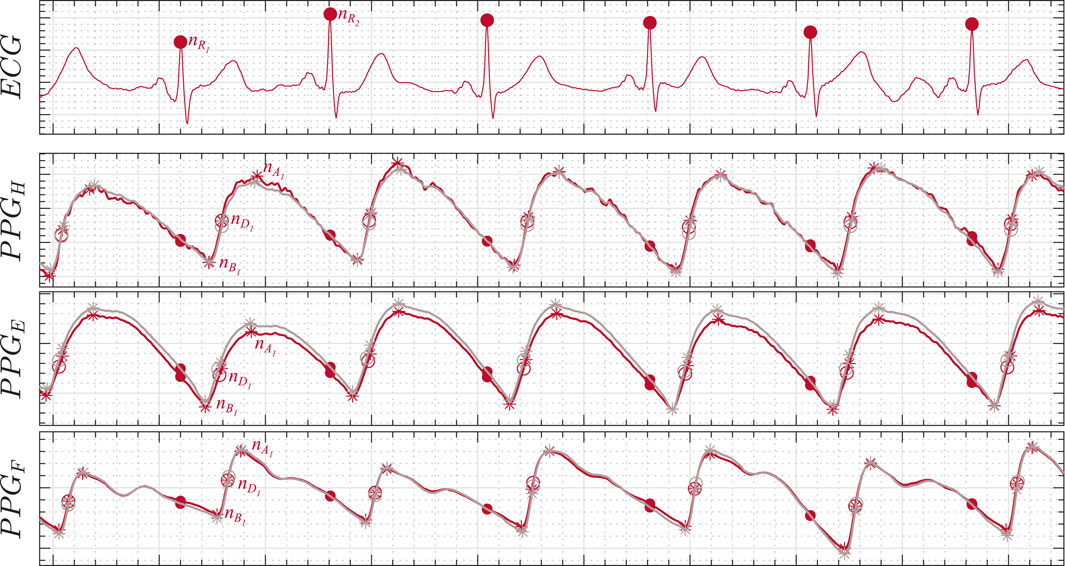
FIGURE 2. ECG and PPG synchronous recording illustration. The three PPG signals are at the forehead (PPGH), at the earlobe (PPGE), and at the finger (PPGF), respectively. The FP delineated are n R for the ECG R-wave instant, n D for the PPG maximum up-slope instant, n A for the PPG apex point, and n B for the PPG basal point. Both red PPG (R-PPG, in red) and infrared PPG (IR-PPG, in gray) lights are also illustrated. Refer Allen (2007) and Charlton et al. (2018) for more information on the morphology of PPG in different body locations.
3.3 Heart rate and pulse rate estimation
For the HR and PR estimation, the IPFM model is used.
The HR is obtained as follows (Mateo and Laguna, 2003):
where “i” represents the index for each heartbeat, δ(⋅) denotes the Kronecker delta function, and the superscript “u” denotes that the signals are unevenly sampled since heartbeats occur unevenly in time.
The PR is obtained as follows (Lázaro et al., 2013a):
3.4 Pulse arrival time estimation
PAT is measured as the difference between those FPs detected at each PPG signal and the time instant of the R-wave, n R, detected in the ECG signal for each heartbeat (Mukkamala et al., 2015):
Note that the number of PAT pulses can be, at most, equal to the number of heartbeats detected on the ECG.
A valid physiological range for
3.5 Pulse amplitude variability estimation
PAV is measured as the amplitude variation at the PPG signal between the apex and the basal points for each pulse (Lázaro et al., 2013a):
where “i” represents the index for each heartbeat, δ(⋅) denotes the Kronecker delta function, and the superscript “u” denotes that the signals are unevenly sampled since pulses occur unevenly in time. Note that the number of PAV pulses may differ from the number of heartbeats detected on the ECG in the same segment.
Then, similarly to PAT estimation, the median-absolute-deviation outlier rejection rule is applied to exclude the spurious pulses of each PAV series (Bailón et al., 2006).
3.6 Coverage measures
The coverage measures are defined based on the HR, taking the ECG as the gold standard. We compare the HR and the PR in consecutive 10-s segments without overlapping for each FP point of each PPG signal. As a result, each segment of PPG is classified as good or bad. This 10-s segment duration is established since it has been shown sufficient to estimate HR (Orphanidou et al., 2014). A segment of PPG pulses is classified as bad if the number of pulse detections within the segment differs by more than 10% from the number of ECG detections in the same segment. Table 1 illustrates one example including 70 s. Note that while HR is perfectly estimated by PR in the average 70 s period, coverage is not 100%.
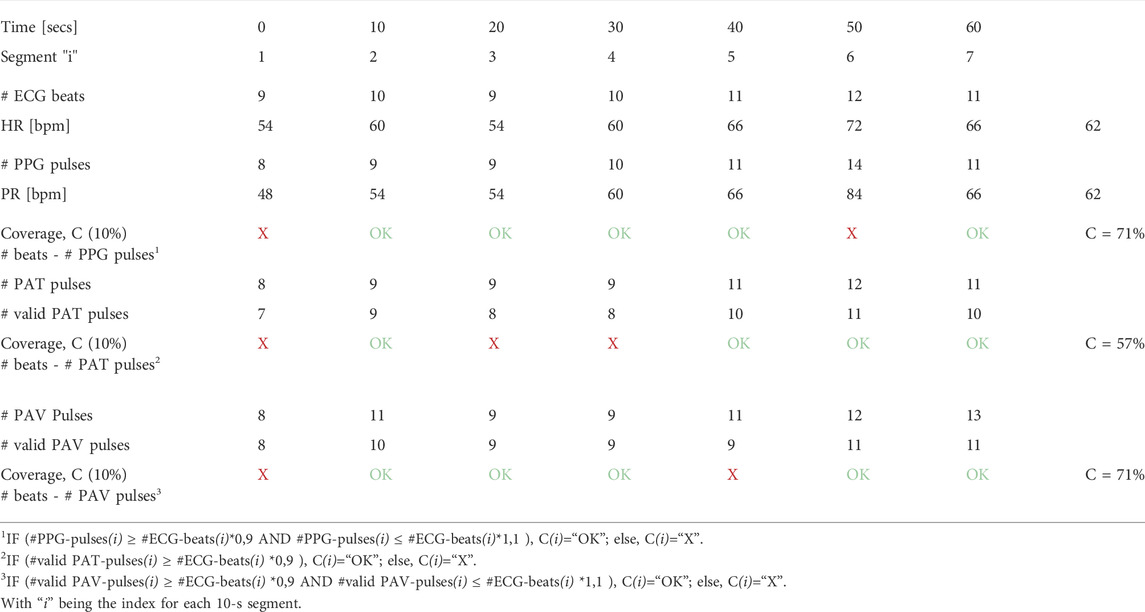
TABLE 1. Illustrative example for the coverage definition. For the PR, good coverage is considered in a 10-s segment if the estimation error of PPG pulses is lower than 10% compared to ECG. For PAT-coverage measurement purposes, a 10-s segment is considered valid if the number of PAT values differs by less than 10% from the number of ECG beats. Note that PAT measures may be omitted either because of being considered out of physiological limits or because the associated PPG pulse is considered spurious. Similar to PAT, this is done for the PAV-coverage measurement.
PPG is useful for more purposes than as a surrogate for the ECG to estimate HR or HRV indices. PPG pulses are largely exploited for calculating cardiovascular indices such as PAT and PAV among others. Therefore, coverage measures based on PAT and PAV are also reported in this work. For this purpose, the number of heartbeats in 10-s consecutive segments is compared with the number of PAT values that can be derived in that same segment. Similarly, coverage based on PAV is studied as well in order to have a measure similar to the PAT but independent of the ECG. See Table 1 for an illustrative example of the coverage definition.
Note that the pulse instant reference differs for the definition of HR (Eq. 1), PR (Eq. 2), PAT (Eq. 3), and PAV (Eq. 4), being at
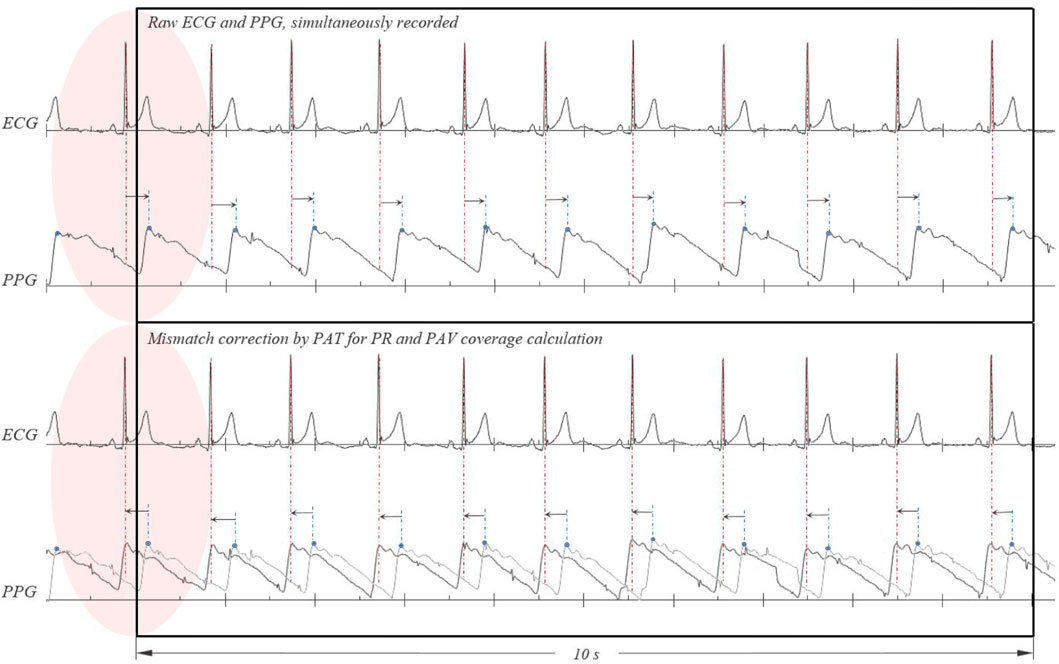
FIGURE 3. Correction of the mismatch in the PPG signal for the calculation of PR and PAV coverage. Before calculating the coverage of the series referenced in the PPG pulses, such as PR or PAV, the average PAT must first be subtracted to align the occurrence of the pulses
As mentioned, three datasets are analyzed, all with different characteristics. The PPG mode of the acquisition devices can be transmission or reflection, in the IR-PPG or R-PPG light wavelengths, and can be placed at the finger, at the forehead, or at the earlobe. Results of total average coverage (C) are reported for each dataset for PR, PAT, and PAV estimation, considering ECG as the gold standard. In addition, the number of artifacts deleted in the PPG signals is also reported.
4 Results
Results are shown in three tables for the three different datasets (Tables 3–5). Each table contains all the coverage information summarized for all the PPG signals: body locations, characteristic protocol stages, PPG light emission wavelength, and FPs delineated.
First, the percentage of artifacts detected from each PPG signal is displayed in Table 2. Note that an artifact is considered only in segments with clearly higher energy than the clean segments. A small percentage of artifacts are suppressed, from 1% to 6% in signals of 20 min and 2 h 20 m, in the tilt-table test and in the heat stress test, respectively. However, the PPG at the forehead in the acute mental stress test was low quality, and almost 20% of the PPG were artifacts.
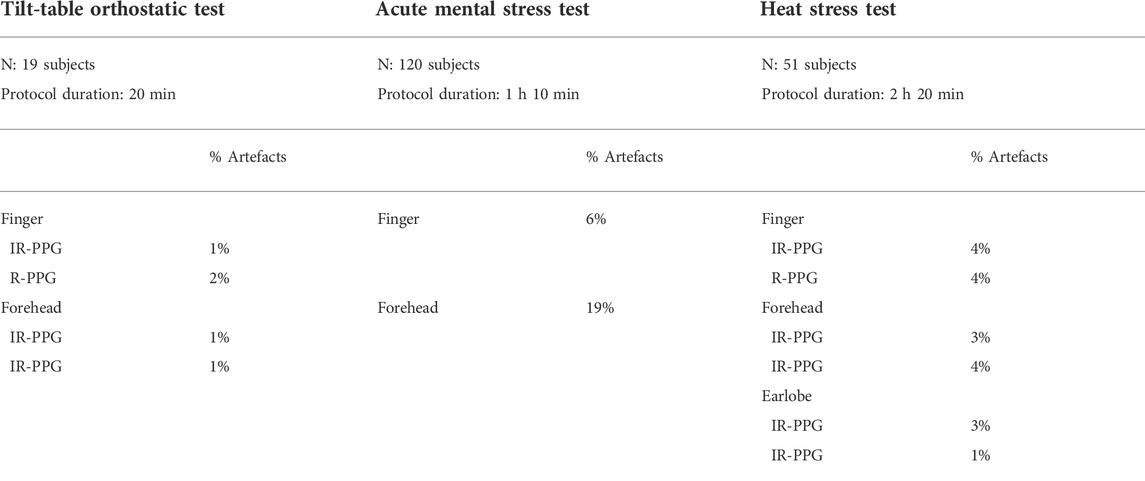
TABLE 2. Percentage of artifacts detected for each PPG signal at the three datasets.
4.1 Tilt-table orthostatic test dataset
Coverage results for the TTT are shown in Table 3. There is good PPG coverage for estimating PR. Around 80–90% of HR can be estimated via PPG with a 10% error or less, regardless of the FP used. The coverage is similar whether using PPG at the finger or at the forehead and for IR-PPG or R-PPG lights as well, although slightly better for IR-PPG.
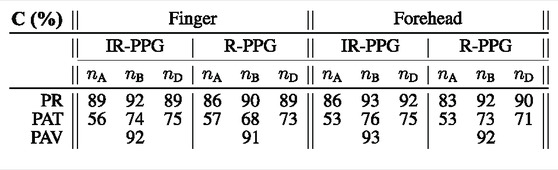
TABLE 3. Coverage results for the TTT dataset. Values of coverage are presented in %, relative to the number of heartbeats (ECG as ground truth).
However, it is remarkable that the coverage deteriorates when we try to estimate the PAT. There is an approximate maximum of 75% PAT pulses that can be properly defined, compared to the number of R-waves delineated. Remember that while an R-wave exists, the corresponding PAT can be omitted, either because of a bad definition in time of the FP, or an outlier, or even a PAT defined out of the physiological range. Even more, whereas the n A appears to be a good FP to estimate the PR, it now presents the worst results of coverage in terms of PAT, with an average coverage of 53–56%. The other FPs report a higher coverage, around 70%.
4.2 Acute mental stress dataset
Results of the mental stress test are shown in Table 4. Again, the coverage of PPG to estimate the PR is notably higher than that used to estimate the PAT. In addition, it can be seen that there is a sudden decrease in the coverage of PPG at the forehead, compared to the coverage at the finger. In fact, looking at the PPG at the forehead, the quality of the signal in this dataset is particularly bad. As a result, an average coverage of 30% is found for estimating PR or PAT.
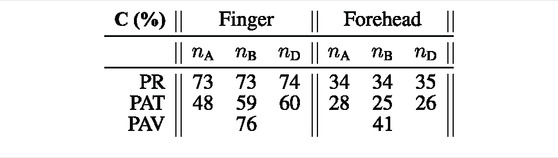
TABLE 4. Coverage results for the acute mental stress test dataset. Values of coverage are presented in %, relative to the number of heartbeats (ECG as ground truth).
4.3 Heat stress dataset
Third, the results of the heat stress test are shown in Table 5. For this dataset, there are 6 PPG signals available for 2.20 h of recordings, including PPG at the finger, forehead, and earlobe, both for IR-PPG and R-PPG lights. In general, except for some particular cases, all PPGs have good signal quality.

TABLE 5. Coverage results for the heat stress test dataset. Values of coverage are presented in %, relative to the number of heartbeats (ECG as ground truth).
Coverage for PR estimation is around 70–80%. In fact, no big differences are found for the coverage either using IR-PPG or R-PPG lights. Moreover, the coverage of PR estimation and of PAT estimation is quite similar. The highest coverage rates are for the PPG at the earlobe using the R-PPG wavelength. Nevertheless, for the PAT estimation using n A, we can see again the smaller coverage rates.
5 Discussion
Coverage for mean PR, PAT, and PAV has been analyzed when using different PPG fiducial points with signals recorded at different parts of the body and light wavelengths. As mentioned earlier, the coverage definition differs depending on the physiological parameters to estimate, that is, PR, PAT, or PAV. On the one hand, regarding PR coverage, a segment is considered valid for PR estimation if PPG can estimate this parameter with an error lower than 10% with respect to the HR estimated from the ECG, which is taken as ground truth. On the other hand, a physiological range restriction and an outlier rejection rule are applied to PAT estimation, and only the outlier rejection rule is applied to PAV. Ground truth is not available for these two estimates since PAT is estimated inside its physiological limits and PAV is a relative measure with arbitrary units. Then, a segment is considered valid if the error in the number of PAT or PAV estimates determinable in the segment is lower than 10% with respect to the number of heartbeats detected from the ECG. In general, the best results in terms of coverage are obtained for the transmission-PPG at the finger, especially using n D or n B as FP. Except for some particular cases, the coverage of PPG when estimating the PR, compared to the coverage of ECG, is equivalent.
Regarding the placement of the PPG, the obtained coverage for the finger and earlobe are higher, whilst the coverage at the forehead is usually lower. This is due to the fact that PPG acquisition is very sensitive to artifacts due to either poor contact or minimal motion artifacts, and PPG at the forehead is predisposed to these (because of facial expression and setup configuration). Moreover, the device to record PPG at the forehead must be dedicated, and signal quality must be ensured before recording as well. We show no fundamental differences and no advantage between using IR-PPG or R-PPG light for PPG recordings. Note that the devices used for the recordings did not include green light, which is the most common wavelength for PPG measurement with wearable devices. An influence of the selected FP in the coverage was observed, especially for PAT and PAV. The end of systole of the PPG pulses is typically smooth, making n A very vulnerable to additive noise, in line with the observations of Rajala et al. (2017). Furthermore, the morphology of the apex of PPG at the earlobe or at the forehead is also usually smoother.
The FP n A might be used for mean PR estimation with a similar performance to that obtained by the other methods. However, results of PAT coverage suggest that the performance weakens for this FP n A. On the contrary, FPs, n D and n B, are less prone to this heterogeneity in morphology. In fact, the FP analysis performed by Peralta et al. (2019) in the TTT dataset, for time domain PRV estimation, reported that n B and n D had the minimum relative errors compared to the HRV estimators based on the ECG, with n D representing the instant of maximum flow velocity for each heartbeat and n B representing the time onset of systole.
In fact, looking at Tables 3, 4, and 5, the coverage for estimating PAT, using n A as FP, is lower than using n D or n B. The coverage for PR estimation using n A is also slightly lower than using n D or n B. However, the coverage for estimating PAV is high. Based on that, we can say that the estimation of the maximum point of a PPG pulse, that is, x PPG(n A), can be done well. Then, for measurements derived from the amplitude, such as PAV, the coverage is good, but if measurements are based on the time instant of detection, that is, n A, the coverage may worsen for estimating both PR and PAT, with the latter getting much worse due to the very small dynamic range intrinsic to PAT. Therefore, the delineation of the FP in time is critical depending on the application of use. In general terms, in order to better suit the smoother shapes of the reflection-based PPG signals and for greater robustness under non-stationary conditions such as wearable scenarios, we suggest using n D or n B as FP to get the best possible coverage rates.
Although many previous works analyzed the feasibility of PRV as a surrogate of HRV, to the best of our knowledge, there are no previous works studying the coverage when deriving other cardiovascular indices such as PR, PAT, or PAV estimation. Different coverage is obtained using the same PPG signal, depending on the PPG pulse fiducial point chosen for delineation. Additionally, for PRV analysis, the sensor results regarding the position are not conclusive (Schäfer and Vagedes, 2013). In this work, some advice and results regarding PPG recording places, delineation, or stress protocols are reported. For further studies, each setup should be first analyzed and validated, taking the results and guidelines presented in this work into account, to study the feasibility of their recording devices with respect to each specific application.
Finally, some limitations should be noted. The forehead-PPG signal was not of main interest for the purposes of the study for which the acute mental stress test dataset was recorded. Thus, the choice of the sensor was not optimal. As a consequence, PPG at the forehead is very noisy, and very low coverage has been obtained for this dataset. In addition, none of the three datasets analyzed included daily life data from wearables, as in the study of Charlton et al. (2020), where a greater impact of artifacts is expected. Consequently, the obtained coverage cannot be extrapolated to daily life in absolute terms. However, these datasets allow us to extract interesting conclusions in relative terms between FP and sensor positions.
6 Conclusion
Finger- and earlobe-PPG signals obtained the higher coverage rates, with coverage ranging from 70% to 90% for estimating the PR, 50–90% for estimating the PAT, and 75–90% for estimating the PAV. Lower coverage has been obtained for forehead-PPG signals, probably due to the smoother shapes of the PPG at this location. The results should be read keeping in mind that coverage has been reported using protocolized datasets in controlled environments, and further studies should be performed using data from daily life for measures of PR, PAT, and PAV.
Different coverage is obtained using the same PPG signal, depending on the PPG pulse fiducial point chosen for delineation. The PPG pulse fiducial point is optimal to derive clinically useful measures such as PR, PAT, or PAV, maximizing the coverage rates is n D, or alternatively, n B, especially in the case of PAT measures.
Data availability statement
The raw data supporting the conclusion of this article will be made available by the authors upon reasonable request.
Ethics statement
Ethical review and approval was not required for the study on human participants in accordance with the local legislation and institutional requirements. The patients/participants provided their written informed consent to participate in this study.
Author contributions
PA-J, SK, and JL implemented the algorithms. PA-J performed the analysis and wrote the manuscript. PA-J, SK, AR, VM, PL, RB, EG, and JL contributed to the analysis and interpretation of the results and revised the manuscript.
Funding
This work was supported by CIBER in Bioengineering, Biomaterials & Nanomedicine through Instituto de Salud Carlos III; by Ministerio de Economía y Competitividad (RTI2018-097723-B-I00), Gobierno de Aragón (Reference Group BSICoS T39-20R) cofunded by the Fondo Europeo de Desarrollo Regional (FEDER) 2014–2020 “Building Europe from Aragón”; by a personal grant to P. Armañac; and by PI16/01606, PI19/01015, integrated in the Plan Nacional de R+D+I and co-funded by the ISCIII-Subdirección General de Evaluación and the FEDER; RTC-2017-6193-1 (AEI/FEDER UE). This work has received funding from the European Regional Development Fund (project no. 01.2.2-LMT-K-718-01-0030) under a grant agreement with the Research Council of Lithuania (LMTLT) and from the European Union’s Framework Programme for Research and Innovation Horizon 2020 (2014–2020) under the Marie Skłodowska-Curie Grant Agreement.
Conflict of interest
The authors declare that the research was conducted in the absence of any commercial or financial relationships that could be construed as a potential conflict of interest.
Publisher’s note
All claims expressed in this article are solely those of the authors and do not necessarily represent those of their affiliated organizations, or those of the publisher, the editors, and the reviewers. Any product that may be evaluated in this article, or claim that may be made by its manufacturer, is not guaranteed or endorsed by the publisher.
References
Allen, J. (2007). Photoplethysmography and its application in clinical physiological measurement. Physiol. Meas. 28, R1–R39. doi:10.1088/0967-3334/28/3/r01
Armanac, P., Lázaro, J., Laguna, P., Bailón, R., and Gil, E. (2019). “Cardiovascular changes induced by acute emotional stress estimated from the pulse transit time difference,” in 2019 Computing in Cardiology (CinC).
Bailón, R., Sornmo, L., and Laguna, P. (2006). A robust method for ecg-based estimation of the respiratory frequency during stress testing. IEEE Trans. Biomed. Eng. 53, 1273–1285. doi:10.1109/tbme.2006.871888
Bashar, S. K., Han, D., Hajeb-Mohammadalipour, S., Ding, E., Whitcomb, C., McManus, D. D., et al. (2019). Atrial fibrillation detection from wrist photoplethysmography signals using smartwatches. Sci. Rep. 9, 15054. doi:10.1038/s41598-019-49092-2
Bernardi, L., Gordin, D., Rosengård-Bärlund, M., Mäkinen, V.-P., Mereu, R., DiToro, A., et al. (2014). Arterial function can be obtained by noninvasive finger pressure waveform. Int. J. Cardiol. 175, 169–171. doi:10.1016/j.ijcard.2014.03.179
Bonomi, A. G., Schipper, F., Eerikäinen, L. M., Margarito, J., van Dinther, R., Muesch, G., et al. (2018). Atrial fibrillation detection using a novel cardiac ambulatory monitor based on photo-plethysmography at the wrist. J. Am. Heart Assoc. 7, e009351. doi:10.1161/jaha.118.009351
Buxi, D., Redoute, J.-M., and Yuce, M. R. (2015). A survey on signals and systems in ambulatory blood pressure monitoring using pulse transit time. Physiol. Meas. 36, R1–R26. doi:10.1088/0967-3334/36/3/r1
Cernych, M., Satas, A., Rapalis, A., Marozas, V., Malciene, L., Lukosevicius, A., et al. (2021). Exposure to total 36-hr sleep deprivation reduces physiological and psychological thermal strain to whole-body uncompensable passive heat stress in young adult men. J. Sleep. Res. 30, e13055. doi:10.1111/jsr.13055
Charlot, K., Cornolo, J., Brugniaux, J. V., Richalet, J.-P., and Pichon, A. (2009). Interchangeability between heart rate and photoplethysmography variabilities during sympathetic stimulations. Physiol. Meas. 30, 1357–1369. doi:10.1088/0967-3334/30/12/005
Charlton, P. H., Celka, P., Farukh, B., Chowienczyk, P., and Alastruey, J. (2018). Assessing mental stress from the photoplethysmogram: A numerical study. Physiol. Meas. 39, 054001. doi:10.1088/1361-6579/aabe6a
Charlton, P. H., Kyriacou, P., Mant, J., and Alastruey, J. (2020). “Acquiring wearable photoplethysmography data in daily life: The ppg diary pilot study,” in Engineering proceedings (Multidisciplinary Digital Publishing Institute), 80.2
Chreiteh, S. S., Belhage, B., Hoppe, K., Branebjerg, J., and Thomsen, E. V. (2014). “Sternal pulse rate variability compared with heart rate variabilit on healthy subjects,” in 2014 36th Annual International Conference of the IEEE Engineering in Medicine and Biology Society (IEEE), 3394–3397.
Eerikäinen, L. M., Bonomi, A. G., Schipper, F., Dekker, L. R., Vullings, R., de Morree, H. M., et al. (2018). Comparison between electrocardiogram-and photoplethysmogram-derived features for atrial fibrillation detection in free-living conditions. Physiol. Meas. 39, 084001. doi:10.1088/1361-6579/aad2c0
Elgendi, M. (2016). Optimal signal quality index for photoplethysmogram signals. Bioengineering 3, 21. doi:10.3390/bioengineering3040021
Gil, E., Orini, M., Bailon, R., Vergara, J. M., Mainardi, L., Laguna, P., et al. (2010). Photoplethysmography pulse rate variability as a surrogate measurement of heart rate variability during non-stationary conditions. Physiol. Meas. 31, 1271–1290. doi:10.1088/0967-3334/31/9/015
Grajales, L., and Nicolaescu, I. V. (2006). “Wearable multisensor heart rate monitor,” in International Workshop on Wearable and Implantable Body Sensor Networks (BSN’06) (IEEE), 4.
Hernando, A., Lázaro, J., Gil, E., Arza, A., Garzón, J. M., López-Antón, R., et al. (2016). Inclusion of respiratory frequency information in heart rate variability analysis for stress assessment. IEEE J. Biomed. Health Inf. 20, 1016–1025. doi:10.1109/jbhi.2016.2553578
Ismail, S., Akram, U., and Siddiqi, I. (2021). Heart rate tracking in photoplethysmography signals affected by motion artifacts: A review. EURASIP J. Adv. Signal Process. 2021, 5. doi:10.1186/s13634-020-00714-2
Khandoker, A. H., Karmakar, C. K., and Palaniswami, M. (2011). Comparison of pulse rate variability with heart rate variability during obstructive sleep apnea. Med. Eng. Phys. 33, 204–209. doi:10.1016/j.medengphy.2010.09.020
Kontaxis, S., Bailón, R., Rapalis, A., Brazaitis, M., Cernych, M., Lázaro, J., et al. (2019). “Autonomic nervous system response to heat stress exposure by means of heart rate variability,” in 2019 Computing in Cardiology (CinC).
Lázaro, J., Gil, E., Bailón, R., Mincholé, A., and Laguna, P. (2013a). Deriving respiration from photoplethysmographic pulse width. Med. Biol. Eng. Comput. 51, 233–242. doi:10.1007/s11517-012-0954-0
Lázaro, J., Gil, E., Vergara, J. M., and Laguna, P. (2013b). Pulse rate variability analysis for discrimination of sleep-apnea-related decreases in the amplitude fluctuations of pulse photoplethysmographic signal in children. IEEE J. Biomed. Health Inf. 18, 240–246. doi:10.1109/jbhi.2013.2267096
Lin, W.-H., Wu, D., Li, C., Zhang, H., and Zhang, Y.-T. (2014). “Comparison of heart rate variability from ppg with that from ecg,” in The international conference on health informatics (Springer), 213–215.
Lu, G., Yang, F., Taylor, J., and Stein, J. (2009). A comparison of photoplethysmography and ecg recording to analyse heart rate variability in healthy subjects. J. Med. Eng. Technol. 33, 634–641. doi:10.3109/03091900903150998
Martínez, J. P., Almeida, R., Olmos, S., Rocha, A. P., and Laguna, P. (2004). A wavelet-based ecg delineator: Evaluation on standard databases. IEEE Trans. Biomed. Eng. 51, 570–581. doi:10.1109/tbme.2003.821031
Mateo, J., and Laguna, P. (2003). Analysis of heart rate variability in the presence of ectopic beats using the heart timing signal. IEEE Trans. Biomed. Eng. 50, 334–343. doi:10.1109/tbme.2003.808831
Mukkamala, R., Hahn, J.-O., Inan, O. T., Mestha, L. K., Kim, C.-S., Töreyin, H., et al. (2015). Toward ubiquitous blood pressure monitoring via pulse transit time: Theory and practice. IEEE Trans. Biomed. Eng. 62, 1879–1901. doi:10.1109/tbme.2015.2441951
Nilsson, L., Goscinski, T., Kalman, S., Lindberg, L.-G., and Johansson, A. (2007). Combined photoplethysmographic monitoring of respiration rate and pulse: A comparison between different measurement sites in spontaneously breathing subjects. Acta Anaesthesiol. Scand. 51, 1250. doi:10.1111/j.1399-6576.2007.01375.x
Nitzan, M., Babchenko, A., Khanokh, B., and Landau, D. (1998). The variability of the photoplethysmographic signal-a potential method for the evaluation of the autonomic nervous system. Physiol. Meas. 19, 93–102. doi:10.1088/0967-3334/19/1/008
Orphanidou, C., Bonnici, T., Charlton, P., Clifton, D., Vallance, D., Tarassenko, L., et al. (2014). Signal-quality indices for the electrocardiogram and photoplethysmogram: Derivation and applications to wireless monitoring. IEEE J. Biomed. Health Inf. 19, 832–838. doi:10.1109/jbhi.2014.2338351
Peralta, E., Lázaro, J., Bailón, R., Marozas, V., and Gil, E. (2019). Optimal fiducial points for pulse rate variability analysis from forehead and finger photoplethysmographic signals. Physiol. Meas. 40, 025007. doi:10.1088/1361-6579/ab009b
Pinheiro, N., Couceiro, R., Henriques, J., Muehlsteff, J., Quintal, I., Goncalves, L., et al. (2016). “Can ppg be used for hrv analysis?,” in 2016 38th Annual International Conference of the IEEE Engineering in Medicine and Biology Society (EMBC) (IEEE), 2945.
Porto, L. G. G., and Junqueira, L. F. (2009). Comparison of time-domain short-term heart interval variability analysis using a wrist-worn heart rate monitor and the conventional electrocardiogram. Pacing Clin. Electrophysiol. 32, 43–51. doi:10.1111/j.1540-8159.2009.02175.x
Rajala, S., Ahmaniemi, T., Lindholm, H., and Taipalus, T. (2017). “Pulse arrival time (pat) measurement based on arm ecg and finger ppg signals-comparison of ppg feature detection methods for pat calculation,” in 2017 39th Annual International Conference of the IEEE Engineering in Medicine and Biology Society (EMBC) (IEEE), 250.
Rhee, S., Yang, B.-H., and Asada, H. H. (2001). Artifact-resistant power-efficient design of finger-ring plethysmographic sensors. IEEE Trans. Biomed. Eng. 48, 795–805. doi:10.1109/10.930904
Salehizadeh, S. M. A. (2015). Motion and noise artifact detection and vital signal reconstruction in ecg/ppg based wearable devices.
Schäfer, A., and Vagedes, J. (2013). How accurate is pulse rate variability as an estimate of heart rate variability?: A review on studies comparing photoplethysmographic technology with an electrocardiogram. Int. J. Cardiol. 166, 15–29. doi:10.1016/j.ijcard.2012.03.119
Spigulis, J. (2005). Optical noninvasive monitoring of skin blood pulsations. Appl. Opt. 44, 1850. doi:10.1364/ao.44.001850
Tamura, T., Maeda, Y., Sekine, M., and Yoshida, M. (2014). Wearable photoplethysmographic sensors—Past and present. Electronics 3, 282–302. doi:10.3390/electronics3020282
Tarniceriu, A., Harju, J., Yousefi, Z. R., Vehkaoja, A., Parak, J., Yli-Hankala, A., et al. (2018). “The accuracy of atrial fibrillation detection from wrist photoplethysmography. a study on post-operative patients,” in 2018 40th Annual International Conference of the IEEE Engineering in Medicine and Biology Society (EMBC) (IEEE), 1.
Vescio, B., Salsone, M., Gambardella, A., and Quattrone, A. (2018). Comparison between electrocardiographic and earlobe pulse photoplethysmographic detection for evaluating heart rate variability in healthy subjects in short-and long-term recordings. Sensors 18, 844. doi:10.3390/s18030844
Wang, L., Lo, B. P., and Yang, G.-Z. (2007). Multichannel reflective ppg earpiece sensor with passive motion cancellation. IEEE Trans. Biomed. Circuits Syst. 1, 235–241. doi:10.1109/tbcas.2007.910900
Keywords: pulse photoplethysmography, coverage, wearable, heart rate variability, pulse transit time, PPG body locations, reliability, stress
Citation: Armañac-Julián P, Kontaxis S, Rapalis A, Marozas V, Laguna P, Bailón R, Gil E and Lázaro J (2022) Reliability of pulse photoplethysmography sensors: Coverage using different setups and body locations. Front. Electron. 3:906324. doi: 10.3389/felec.2022.906324
Received: 28 March 2022; Accepted: 13 July 2022;
Published: 29 September 2022.
Edited by:
Sohmyung Ha, New York University Abu Dhabi, United Arab EmiratesReviewed by:
Shekh Md Mahmudul Islam, University of Dhaka, BangladeshSoon-Jae Kweon, New York University Abu Dhabi, United Arab Emirates
Copyright © 2022 Armañac-Julián, Kontaxis, Rapalis, Marozas, Laguna, Bailón, Gil and Lázaro. This is an open-access article distributed under the terms of the Creative Commons Attribution License (CC BY). The use, distribution or reproduction in other forums is permitted, provided the original author(s) and the copyright owner(s) are credited and that the original publication in this journal is cited, in accordance with accepted academic practice. No use, distribution or reproduction is permitted which does not comply with these terms.
*Correspondence: Pablo Armañac-Julián, cGFybWFuYWNAdW5pemFyLmVz