 Cagri Oztan
 Bengisu Şişik
- Department of Mechanical and Aerospace Engineering, The George Washington University, Washington, DC, WA, United States
Additive manufacturing allows fabrication of custom-shaped thermoelectric materials while minimizing waste, reducing processing steps, and maximizing integration compared to conventional methods. Establishing the process-structure-property relationship of laser additive manufactured thermoelectric materials facilitates enhanced process control and thermoelectric performance. This research focuses on laser processing of bismuth telluride (Bi2Te3), a well-established thermoelectric material for low temperature applications. Single melt tracks under various parameters (laser power, scan speed and number of scans) were processed on Bi2Te3 powder compacts. A detailed analysis of the transition in the melting mode, grain growth, balling formation, and elemental composition is provided. Rapid melting and solidification of Bi2Te3 resulted in fine-grained microstructure with preferential grain growth along the direction of the temperature gradient. Experimental results were corroborated with simulations for melt pool dimensions as well as grain morphology transitions resulting from the relationship between temperature gradient and solidification rate. Samples processed at 25 W, 350 mm/s with 5 scans resulted in minimized balling and porosity, along with columnar grains having a high density of dislocations.
Introduction
Thermoelectric devices offer the potential for a silent, environmentally safe, scalable, and low maintenance approach to thermal management and energy conversion. Thermoelectric devices are solid-state, semiconductor devices that can create an electric potential under the presence of a temperature difference, or vice versa, which makes them a potential option for waste heat recovery in numerous applications in aerospace (Junior et al., 2018), automotive (Yang and Stabler, 2009), wireless sensor networks (Wang et al., 2013), and wearable devices (Leonov and Vullers, 2009). The performance of thermoelectric materials is characterized by the dimensionless figure of merit, ZT, which is defined as ZT = (S2σT/k), where S, σ, T and k denote Seebeck coefficient, electrical conductivity, absolute temperature, and thermal conductivity, respectively. An efficient thermoelectric material has a high ZT. Increasing ZT has been achieved via band engineering to enhance Seebeck coefficient and hierarchical structuring to suppress thermal conductivity by incorporating nano-precipitates, lattice dislocations, point defects or nanostructured interfaces that promote phonon scattering (Kim et al., 2013; Fu et al., 2017; Masood et al., 2018; Zhou et al., 2021).
Another approach to improving thermoelectric device performance is to design devices with minimal parasitic thermal and electrical resistances. However, device design is limited by the way thermoelectric devices are manufactured. Moreover, common manufacturing techniques for thermoelectric devices are laborious and result in considerable waste. Traditional manufacturing techniques only allow planar form factors, making it difficult to adopt custom geometries that result in enhanced power output (Thimont and LeBlanc, 2019; Du et al., 2020; Sisik and LeBlanc, 2020; Aljaghtham and Celik, 2021). There is a need for more versatile fabrication methods with lower cost, higher output, and the capability to create customized shapes. Additive manufacturing has emerged as a technique that enables intricate and/or conformal geometries for thermoelectric materials due to its freeform, layer-by-layer fabrication approach that has the added benefit of minimizing waste of expensive thermoelectric material (Mueller, 2012; Du et al., 2020). Among additive manufacturing techniques, laser powder bed fusion (LPBF, also known by the commercial name selective laser melting) is an innovative technique where a powder material is melted using a laser beam (Zhang et al., 2019).
The physics involved in LPBF, such as surface tension, Marangoni flow, capillary forces, recoil pressure and wetting behavior, are highly complex and dictate the melt pool and scan track formation (Panwisawas et al., 2017). The process requires contending with melt pool instabilities and residual stress emanating from the interaction between the laser and material (King et al., 2015). LPBF processed components possess a microstructure with preferential grain growth aligned with the temperature gradient (Zhang et al., 2019). The process parameters such as scanning speed, scanning strategy and laser power heavily influence the formation of the resultant microstructure. Hence, it is important to understand the process-structure relationship in LPBF processed components.
Previously, laser processing was successfully employed to process thermoelectric materials. In 2015, El-Desouky et al. (2015) achieved complete melting of Bi2Te3 using a Nd:YLF pulsed laser. El-Desouky et al. (2017) then determined a process window for Bi2Te3 where laser powers between 20 W and 25 W melted the material almost completely with high phase purity. Zhang et al. (2018) succeeded in the first characterization of a bulk Bi2Te3 structure fabricated via laser processing where a peak ZT of 0.11 at 50°C was reported. Laser processing of n-type Bi2Te3 was subsequently investigated by Welch et al. (2020); Welch et al. (2021) to reveal the resultant meso-, micro- and nanostructures; high dislocation density and tellurium and bismuth rich areas were reported. A comprehensive process map for n-type Bi2Te2.7Se0.3 was communicated by Mao et al. (2017) where energy densities were used to characterize the effect of process parameters on stoichiometry. The main value proposition of additive manufacturing of thermoelectric materials is the ability to integrate thermoelectric materials into systems to enable even minimal power generation or thermal management functionality. Thus, enhancing ZT has not always been the aim.
Although previous studies provided significant insight into laser processed Bi2Te3, a much deeper understanding of the process-microstructure relationship is needed to effectively utilize the process. In this study, we determine a process window for undoped Bi2Te3 using a normalized enthalpy value instead of energy densities and empirical methods to capture the transition in melting modes. The changes in the microstructure and melt pool shape upon remelting as well as the columnar to equiaxed transition in the grain morphology are investigated. Finite element modeling of the temperature gradients resulting from laser heating enabled predictions of melt pool dimensions as well as the grain morphology transition associated with the ratio of temperature gradient to solidification rate. These predictions are compared quantitatively and qualitatively to the experimental results.
Materials and methods
Laser processing and imaging of Bi2Te3 compacts
Melt tracks were processed on Bi2Te3 powder compacts using a custom laser processing setup. The 99.99% pure undoped Bi2Te3 powder from American Elements (CA, United States) was compacted into 15 mm-wide disks using a Carver press under a compression pressure of 300 MPa. The phase purity of the Bi2Te3 powder was characterized using X-ray diffraction with Cu Kα radiation (XRD, Bruker D8 Advance, Germany). Previous work showed promising laser processing of this material (Zhang et al., 2018). Scanning electron microscope (FEI Teneo LV SEM) images of as-received Bi2Te3 powder and the cross-section of a powder compact are shown in Figure 1. The compacted samples exhibit a slightly porous structure with a relative density of 86%.
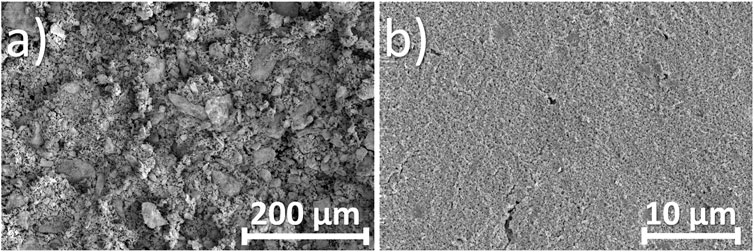
FIGURE 1. Scanning electron micrographs of (A) as-received Bi2Te3 powder and (B) cross section of the compacted Bi2Te3 powder prior to laser processing.
Single scan tracks were created on the compacted disks using a custom LPBF setup (1,070 nm, 50 µm spot size, 100 W YAG laser with an F-theta lens from IPG Photonics, CA, United States) in a chamber with high purity argon atmosphere at an oxygen level of <0.01%, which was monitored using a sensor at the top of the chamber. The laser raster was controlled using an integral galvanometer scanner. Three unidirectional melt tracks spaced 5 mm apart and scanned 1, 3 and 5 times, respectively, were made on each powder compact. Laser powers and scan speeds varying between 20 and 35 W and 250–400 mm/s were used based on the optimum parameters from previous work (Zhang et al., 2018). Laser processed compacts were subsequently imaged with an optical microscope (Leica DM 2700M RL) and polarizer for top-view imaging of the scan tracks. Then, laser processed powder compacts were sectioned in the middle, perpendicular to the laser scanning direction, mounted in epoxy molds, and polished. The final polishing stage was done using a 0.04 µm colloidal silica slurry (Allied HighTech #180–25015). Polished cross sections were imaged with scanning electron microscopy to observe porosity, melt pool geometry, and thermal cracking. Electron backscatter diffraction (EBSD) analysis enabled characterization of the grain orientation in the melt pools. Energy dispersive spectroscopy (EDS) was conducted to characterize the elemental composition of the laser processed samples. A gallium sourced focused-ion beam and scanning electron microscope (FEI Helios FIB SEM) was used to lift-out lamellae from within the melt pool for transmission electron microscopy (TEM) analysis. The TEM samples were 100–200 nm in thickness and enabled nanostructure characterization of selected Bi2Te3 melt tracks. In order to identify the change in thermoelectric properties, 2 mm-thick rectangular prism shaped bulk samples (15 × 5 mm) were fabricated under various process parameters. The temperature-dependent Seebeck coefficient and electrical conductivity of the bulk samples were characterized using a commercial Linseis LSR-3 (Linseis Gmbh, Selb, Germany) in a helium environment.
Simulation
In order to simulate the formation of a melt pool during the laser melting process, the spatial and temporal temperature gradients were modeled via COMSOL Multiphysics Software (Version 5.5). The geometry was defined as a bulk, 3D Bi2Te3 powder bed mounted on a stainless-steel substrate. The symmetry of the problem allowed us to limit modeling to half of the melt track domain, reducing the computational resources required. The dimensions of the powder bed were set to 1 × 0.4 × 0.25 mm as illustrated in Figure 2. Mesh size was dependent on the proximity to the surface where the laser beam is incident. The smallest mesh sizes were at the top surface with a maximum element size of 12 µm whereas the largest mesh sizes were at the bottom with a maximum element size of 120 µm. In the experiments, the powder compacts were mounted on a solid substrate made of 304L stainless steel, so in the simulations the same substrate material was selected with the dimensions of 1 × 0.4 × 0.20 mm in length, width, and height, respectively.
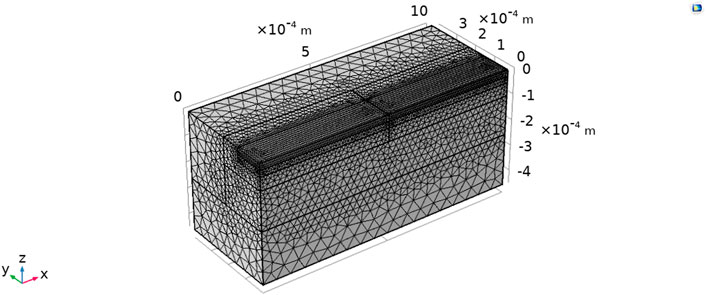
FIGURE 2. Meshed Bi2Te3 geometry used in our simulations.
In the simulations, the heat in the melt pool is dissipated via convection and radiation along the top surface and via conduction into the powder bed. Melting and evaporation of the powder were also incorporated in the model by averaging the evaporation temperatures of Bi and Te due to the lack of an evaporation temperature of Bi2Te3 in the literature. The melt pool formation and temperature distribution were determined by energy conservation as shown in Eq. 1 and consistent with prior laser processing simulation work (Imani Shahabad et al., 2021; Wu et al., 2021; Ansari and Salamci, 2022):
where T, ρ,
The heat transferred by the laser, provided in Eq. 3, was assumed to have a Gaussian distribution as previously used by Rosenthal (Rosenthal, 1941):
where P and σ denote the laser power and laser beam radius irradiated at the x and y coordinates, respectively. Certain effects such as shadowing, multi-reflection and beam angle were neglected (Leitz et al., 2017). The radiative component of heat dissipation was simulated using the Stefan-Boltzmann law provided in Eq. 4 where the terms
The convective heat loss was captured using Eq. 5 where h is the convective heat transfer coefficient. In this work, a constant h value of 25 W/m2K was used to approximate natural convection (Incropera et al., 1996).
The melting and evaporative heat losses were modeled using the apparent heat capacity method. It enabled the latent heat of phase change during melting and evaporation to be computed by modifying the heat capacity term instead of adding a latent heat term in the energy balance (Multiphysics, 2012). An adiabatic boundary condition (
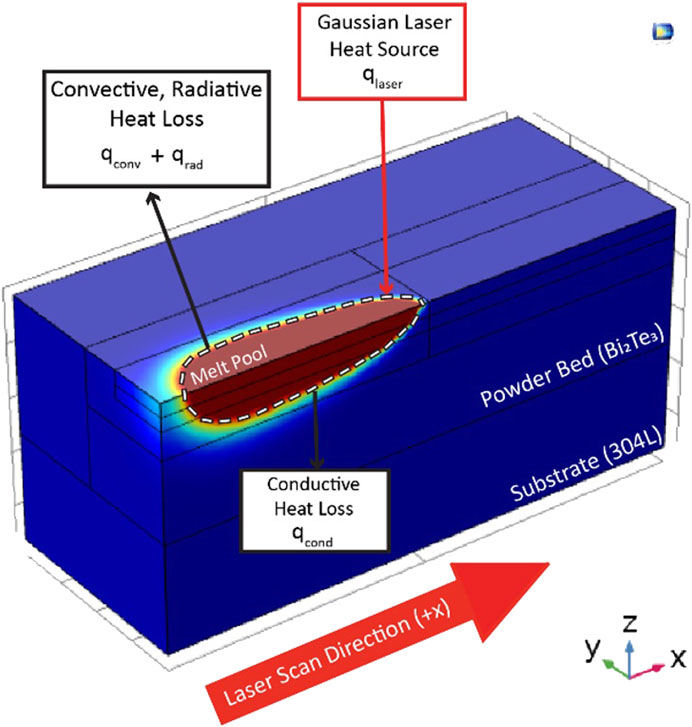
FIGURE 3. Schematic showing boundary conditions applied in the numerical model. The laser heat input and heat dissipation occurred at the top of the Bi2Te3 powder bed whereas the bottom of the powder bed has an adiabatic boundary condition (
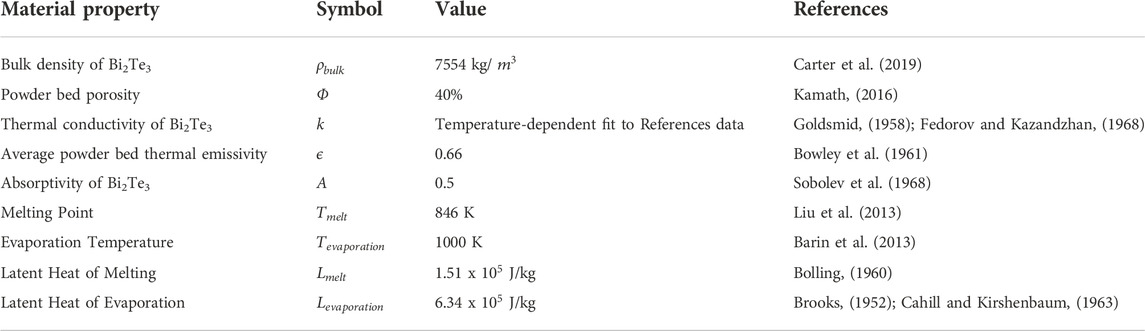
TABLE 1. Material properties of Bi2Te3 powder bed used in the simulations. Though not used in the article, the notations
The density of the Bi2Te3 powder bed was calculated using Eq. 6:
where
Simulations were also used to capture the columnar to equiaxed transition in the grains through computation of the temperature gradients and solidification rates in the melt pool. The temperature gradient,
The solidification rate,
where
Simulations were performed to model the melt pool formation and compare the predicted melt pool geometry and grain morphology to those observed in experimental samples as described in the following section.
Results and discussion
Melted region morphology
This section discusses the morphology of the melted regions and compares experimental results with simulation data for the melt pool dimensions. Experimental and computational analyses of the grain morphologies are provided, as well. To detect the limits of balling in the single melt tracks, top-down optical microscopy images of the melt tracks after single scanning were taken, as shown in Figure 4. Between laser powers of 25—30 W and scan speeds of 300—350 mm/s, melt tracks that were smooth, consistent, and continuous in appearance with minimal balling were observed. A laser power of 35 W resulted in balling at all scan speeds; balling was also prominent for a slower scan speed of 250 mm/s at 25 W and 30 W. At lower laser powers, the melt tracks had inconsistencies in width and shrinkage-induced balling, likely due to the capillary instability effect and reduced wetting (Li et al., 2012). In LPBF, balling is a detrimental effect that occurs under select process parameters such as low laser powers that result in low undercooling or high scan speeds that trigger high capillary instabilities (Gu and Shen, 2009). Thus, selection of laser parameters that eliminate balling in LPBF is important for fabrication of low porosity parts. Additionally, oxidation throughout the process (Das, 2003), such as trace oxygen trapped in the powder compacts during compaction or residual oxygen in the build chamber, may contribute to balling formation. Here, the processing was performed under an oxygen concentration of less than 0.01%, the threshold of the oxygen analyzer.
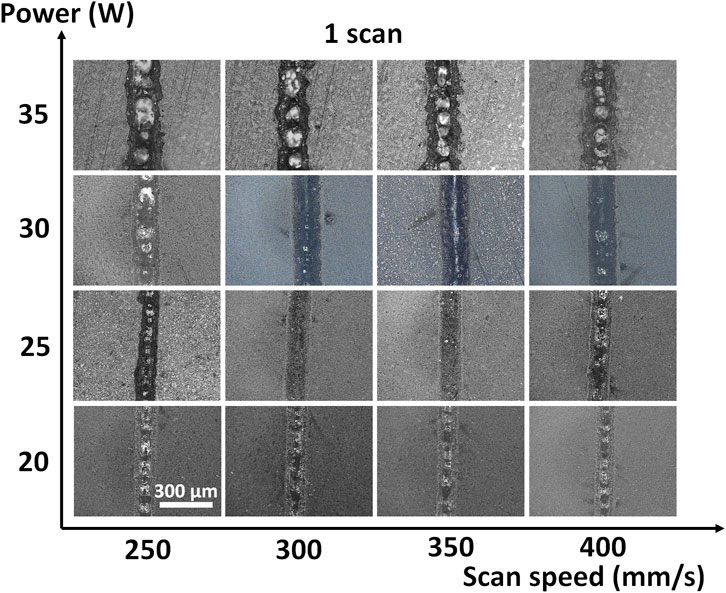
FIGURE 4. Optical microscope images of the top surfaces of the single laser scan melt tracks on Bi2Te3 powder compacts for a range of incident laser power and scan speeds.
The single scanned melt tracks processed between 25—30 W and 300—350 mm/s exhibited little balling. Since a rescanning strategy can further reduce the balling by reducing the capillary instabilities (Li et al., 2012), each melt track was rescanned under the same corresponding process parameters. The optical microscopy images of the melt tracks rescanned 5 times are provided in Figure 5A where a substantial reduction in balling was achieved in all samples after rescanning. While balling was almost completely eliminated at 35 W, indentations in the melt track were present. These indentations were likely created by recoil pressure that caused outward flow and melt expulsion, leading to larger melt tracks. However, this was mitigated at moderate levels of laser power, 25 W and 30 W, leading to more stable melt tracks. Rapid, repeated melting and solidification cycles resulted in needle-like microstructures at the surface of the melt track as shown in Figures 5B–E. The formation of such grains can be ascribed to the rapid cooling (Zhang et al., 2019). Rescanning also resulted in increased residual stress cracking seen in Figures 5C–E due to the brittle behavior of Bi2Te3 (Welch et al., 2020).
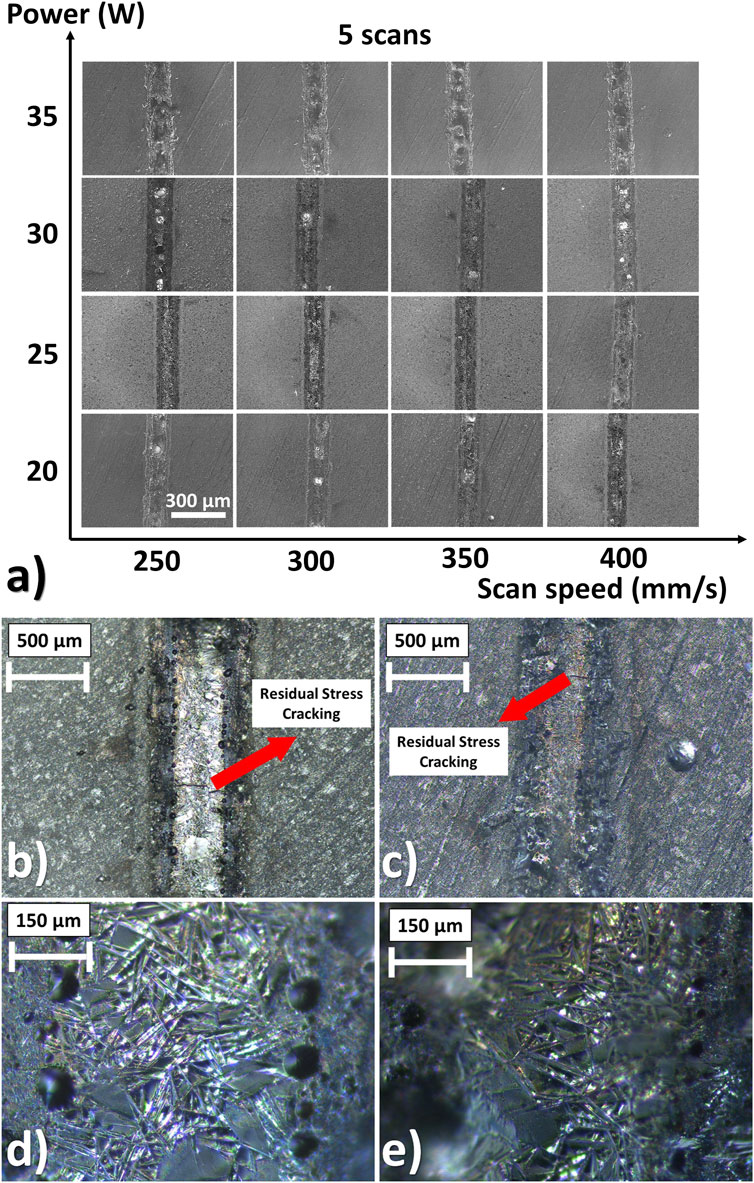
FIGURE 5. (A) Optical microscope views of the top surfaces of the melt tracks scanned five times. Top views of the samples scanned five times at (B,C) 25 W, 350 mm/s, (D,E) 30 W, 300 mm/s.
The grain morphologies of the melt pool cross sections show columnar grains oriented towards the melt centerline as seen in Figure 6. The boundary of the melt pool was determined by inspecting the interface between the melted region and the surrounding powder compact using polarized light in an optical microscope. In many cases, the boundary between the melted material and surrounding powder material had trapped pores that helped indicate the interface. As for the boundaries without significant numbers of trapped pores, the polarization angle of the light was altered until the transitions from the powder compact to oriented grains in the melted region were evident; that transition was taken as the boundary of the melt pool. Melt pool images also indicate a conduction to keyhole mode transition with the higher laser power of 30 W and 3 scans. In LPBF, when the energy transferred to the melt pool is excessively high, a melt pool formation mode known as keyhole mode occurs where the melt pool penetrates deep into the material, owing to the elevation of the melt pool temperatures beyond the boiling point (Bertoli et al., 2017). On the other hand, conduction mode processing is characterized by local melting with insignificant vaporization and a smaller depth-to-width ratio (Gomell et al., 2022).
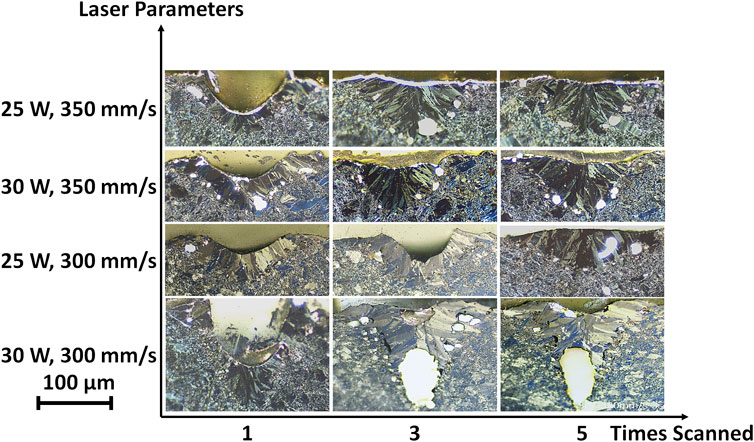
FIGURE 6. Polarized light microscopy images of the melt pool cross sections showing columnar dendritic grains.
Keyhole mode has detrimental effects on the melt pool due to the intense recoil pressure (Le and Lo, 2019). Although numerous studies focused on energy density as a metric to capture the conduction to keyhole transition, energy density is a thermodynamic quantity that neglects certain physics that drive the melt pool formation such as surface tension and recoil forces. Other metrics are able to capture the relevant physics and impact of each process parameter. Eagar and Tsai claimed the maximum temperature and melting mode of a material processed by a Gaussian laser source are proportional to P/
where A, P, D, ν, σ, ΔH and hs are the absorptivity, laser power, thermal diffusivity, laser scan speed, laser beam diameter, deposited energy density, and the enthalpy at melting, respectively. King et al. (2014) used the criterion in Eq. 11 to capture the threshold for conduction-to-keyhole mode transition for 316L stainless steel:
where Tb and Tm are the boiling and melting points of the material, respectively. We evaluated the normalized enthalpy for bismuth telluride using property values taken from (Rammos, 2020). We compare the variation of normalized enthalpy with another dimensionless quantity of melt pool depth (d) normalized by laser spot size (σ) as shown in Figure 7. An approximate transition in the melting mode is evident around a normalized enthalpy of 5.3.
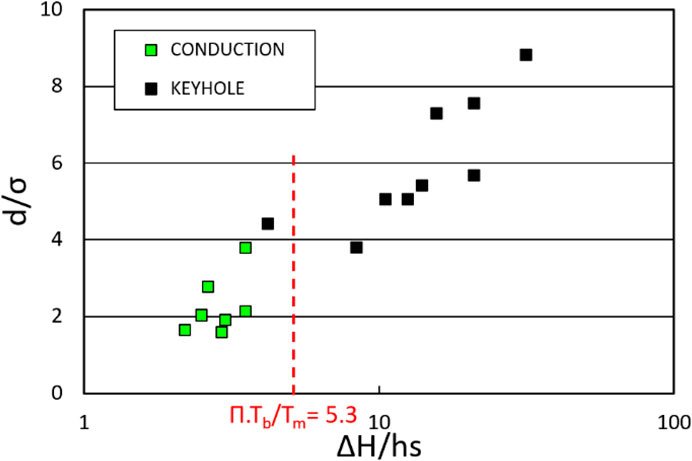
FIGURE 7. Melting regime transition between conduction and keyhole mode for LPBF processed Bi2Te3.
The simulation results for single melt tracks under various laser power and scan speed were compared with the experimental data. An example of the simulation results for the formation of a melt pool is provided in Figure 8. The model neglected recoil forces and Marangoni flow in the melted zone, which are the main driving forces behind the instability of the melt flow. Thus, the model was unable to capture the formation of porosity in and around the melt pool.
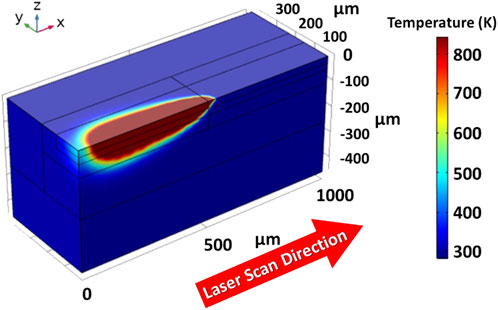
FIGURE 8. Typical visualization of the temperature gradients (and thus indirectly the melt pool) in the simulations. In the instance shown, process parameters were 25 W and 350 mm/s.
The comparison of the simulation data with the experimental results is provided in Figure 9. The simulation and experimental results aligned closely, especially for higher scan speeds. At 25 W and 300 mm/s, the simulation predicted a deeper and narrower melt pool than the experiments. This can be attributed to the lack of Marangoni flow in the model, which prevented modeling of the indentation due to the outward and downward liquid flow direction. For the increased scan speed of 350 mm/s, the simulation yielded even more accurate results due to the higher surface tension which resulted in a reduction in the net force exerted on the melt pool. The model was unable to capture the transition to the keyhole processing regime at 30 W and 300 mm/s. There are two probable reasons for this. First, the recoil pressures that were neglected in the simulations became more dominant over the surface tension, creating a high net downward force. Second, multiple reflections of the laser beam occurring within the powder dramatically enhanced the laser absorptivity, which was constant in the simulations, resulting in more efficient energy transfer into the melt pool (Zhao et al., 2020). This discrepancy was reduced for 350 mm/s due to the transition back to conduction mode in the experiments.
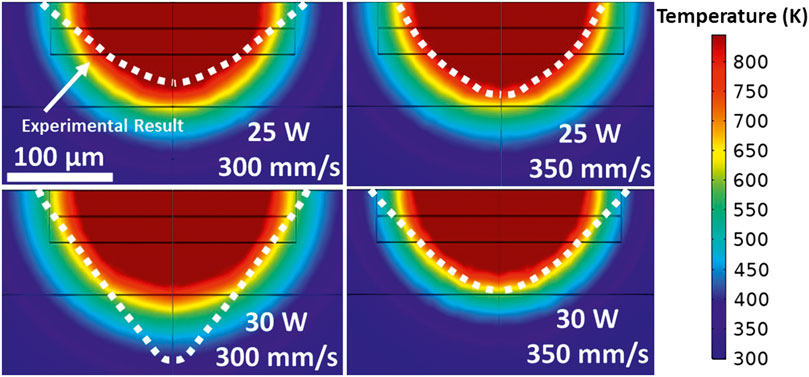
FIGURE 9. Comparison of formation of melt pools shapes determined experimentally and computationally under various laser parameters with single scan strategy. The dashed white lines show the edge of the melt pool as determined from cross-section images of the experimental samples shown in Figure 6.
In LPBF built components, the microstructural feature such as grain size, morphology, and orientation are governed by temperature gradients and solidification rates. Per solidification theory, the ratio of temperature gradient (G) and solidification rate (R) is the cooling rate; cooling rate is the primary parameter governing grain morphology (Olakanmi et al., 2015; Yan et al., 2017). Higher cooling rates result in columnar grains whereas lower cooling rates lead to equiaxed grains (He et al., 2021). Thus, the columnar to equiaxed transition in the microstructure of the sample scanned once under 25 W and 350 mm/s was inferred from the simulation and compared with the experimentally observed columnar to equiaxed transition. From the simulation data, the temperature gradient and solidification rate data were collected from points that were 25 µm apart as shown in Figure 10A. The points colored in purple exhibited comparatively lower cooling rates (i.e., low G/R ratios) and were observed at the center of the melt pool as shown in Figure 10A. The simulations were used to predict the columnar to equiaxed transition around this region. The variation of G with R in each point was plotted in Figure 10B. To mathematically determine the columnar to equiaxed transition limit, the criterion from Kurz et al. (2001) was used, which is given in Eq. 12:
where Cst is the limit where columnar to equiaxed transition occurs, and n is the power index of the temperature gradient function. By fitting the curve in Figure 10B, n and Cst have been calculated as 6.97 and 4.48 × 10³. In other words, the columnar to equiaxed transition will occur when
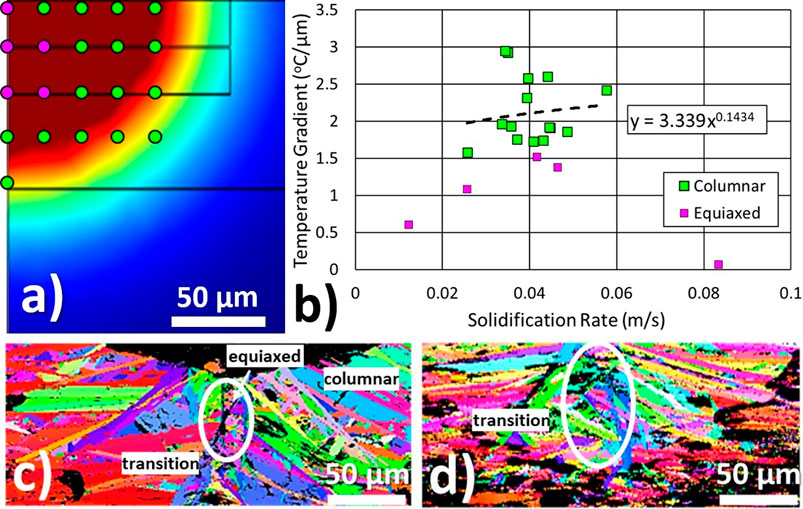
FIGURE 10. (A) The points where temperature gradient G and solidification rate R data were calculated. Computational columnar to equiaxed transition limit occurs around the points colored in purple, (B) Computational G-R data, (C) EBSD image showing the computational columnar to equiaxed transition limit for the sample used in simulations (25 W, 350 mm/s, single scan), (D) EBSD image of the same sample with 5 scans showing a larger columnar to equiaxed transition region.
The simulated columnar to equiaxed transition in Figure 10A was compared with the experimental columnar to equiaxed transition that was obtained using the EBSD map of the sample processed at the same parameters (25 W and 350 mm/s), as illustrated in Figure 10C. The experimental columnar to equiaxed transition was identified around the center of the melt pool, which is in good agreement with the simulations. The grains outside of the experimental columnar to equiaxed transition limit had predominantly columnar microstructure with oriented along the temperature gradient. On the other hand, Figure 10D displays the EBSD image with a substantially larger equiaxed grain region for the same sample scanned five times. From Figure 10D, it appears the rescanning strategy reduces the grain size, resulting in an expansion of the columnar to equiaxed transition region (Griffiths et al., 2018). In bulk samples made via laser additive manufacturing, preferential orientation could occur within grains because Bi2Te3 is a layered compound (Qiu et al., 2019; Qiu et al., 2021). The main driving forces for preferential orientation of grains in Bi2Te3 are high stacking density, electric field, and thermal gradients (Tang et al., 2022). Thus, any manufacturing method that induces thermal gradients, such as LPBF, encourage preferential orientation in Bi2Te3.
Nano-and micro-structure analysis
Since the optical microscopy analysis revealed that the samples processed at the laser powers 25, 30 W and scan speeds 300, 350 mm/s exhibited the most stable melt tracks with minimal balling, SEM analysis was performed on these samples. SEM images shown in Figure 11 suggest that both melt pools obtained after a single scan had a depression formation, which can be attributed to recoil pressures dominating over surface tension. The recoil pressure exerted upon the molten Bi2Te3 caused outward flow, followed by depression formation, as previously explained by Khairallah et al. (2016). For the higher laser power of 30 W, keyhole regime with enhanced laser absorptivity was reached, and recoil pressures had a much more pronounced effect on the melt pool (Zhao et al., 2020). This caused the depression to be deeper than that seen for 25 W. Keyhole-induced porosity previously occurred due to the formation of local cold zones in the melt pool (Bayat et al., 2019), and a re-melting strategy reduces the absorptivity of the powder bed material and causes shallower melt pools (Griffiths et al., 2018). Hence, rescanning in the keyhole regime may worsen the porosity issue. Moreover, the low thermal conductivity of Bi2Te3 exacerbates porosity formation when rescanning is done in keyhole mode due to wider cold zones. Thus, the melt pool scanned five times with 30 W and 300 mm/s exhibited the worst porosity. By contrast, SEM images of the melt pools processed under 25 W and 350 mm/s indicate that rescanning under conduction mode resulted in less porosity and shallower melt pools. This can be attributed to the gradual reduction of the recoil pressure, which is already low compared to keyhole mode processing.
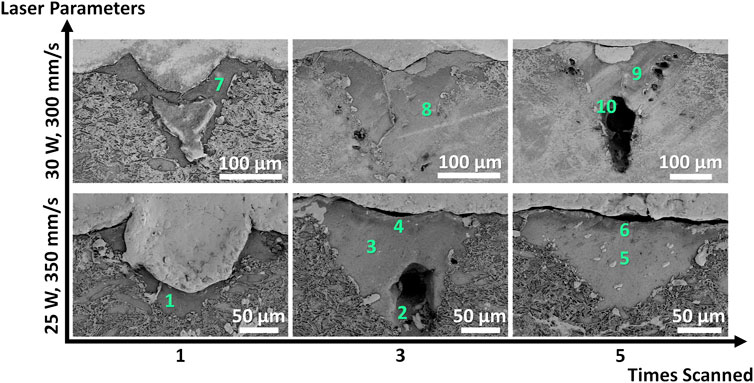
FIGURE 11. Scanning electron microscopy images of the melt pools scanned at each corresponding laser parameter set. Points marked on each figure represent where energy dispersive spectroscopy analyses were performed and correspond to the rows of numerical EDS data in Table 2.
The energy dispersive spectroscopy (EDS) measurements in atomic percentages taken from each point displayed in Figure 11 along with their ratios are summarized in Table 2. EDS data suggest oxygen was present around the pores. The oxygen could be present from formation of the powder compacts (compacted in air due to the size of the compaction press) or residual oxygen in the build chamber during processing. During laser processing, this oxygen could get trapped within pores. In the future, oxidation could be prevented by keeping the powder in an inert gas environment at all times and ensuring oxygen is completely evacuated from the processing chamber. The varying ratios of Teat%/Biat% indicate phase segregation in the processed samples, which agrees with earlier work (Wu et al., 2017; Welch et al., 2020). The sample fabricated with 25 W, 350 mm/s and 5 rescans had Teat%/Biat% ratios that were closest to 1.5, suggesting that this sample had the most similar elemental composition to the original (before laser processing) Bi2Te3 powder material.
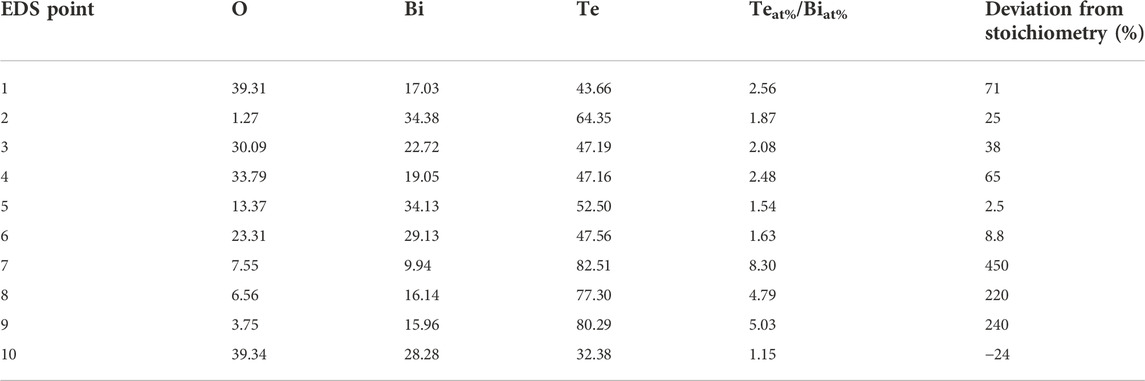
TABLE 2. Variation of atomic percentage of oxygen, bismuth, and tellurium in the corresponding EDS data for points shown in Figure 11.
Figure 12 displays TEM images of a lamella extracted from a sample fabricated at 25 W, 350 mm/s and 5 rescans. Figure 12A shows high grain density (5.08 × 10¹¹ grains/m2) due to rapid localized heating and cooling cycles during laser processing, which is in good agreement with results from other work on n-type Bi2Te3 (Welch et al., 2020). Such interfaces are known to promote phonon scattering, thereby reducing the thermal conductivity (Wan et al., 2012), so LPBF may be a promising way to engineer low thermal conductivity in thermoelectric materials. Figure 12B shows an oxygen-rich region, suggesting the presence of bismuth oxides due to the trace levels of oxygen retained in the build chamber, within the powder compact, or on the powder. Figure 12C displays a distortion in the crystal structures by 59.46°, leading to a localized strain field which may further contribute to phonon scattering (Yu et al., 2017). Figure 12D validates the presence of the aforementioned distortions, as well.
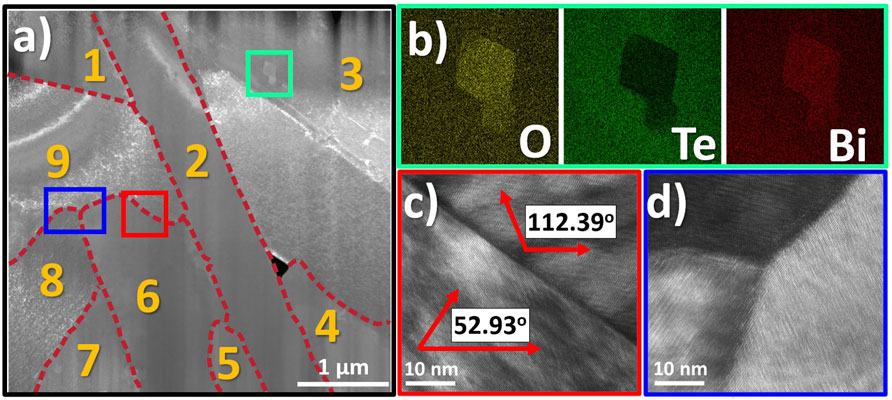
FIGURE 12. Transmission electron microscopy images of laser processed Bi2Te3: (A) High grain and dislocation density in the microstructure, (B) Te-deficient region with bismuth oxide inclusion, (C–D) Difference in crystal orientations that can result in localized strain field.
Conclusion
This work provides insight into the process-microstructure relationship of laser processed undoped Bi2Te3 powder. The morphologies of single melt tracks processed at various scan speed, laser power and number of scans were characterized experimentally and computationally. The process window with stable melt pools was between 25 and 30 W and 300–400 mm/s. Repeated scanning made the melt pool shallower as surface tension became more dominant than recoil forces. Since energy density is a thermodynamic quantity that can merely capture the melting mode in melt pools, an alternative analysis was used with normalized enthalpy and melt pool depth, which showed that transition occurs at a normalized enthalpy of 5.3. The SEM and TEM analyses show the presence of oxides throughout the melt pools, which inevitably occurred despite the minimized oxygen level in the processing chamber. Simulations were also used to capture the columnar to equiaxed grain transition region by computing the temperature gradients and solidification rates in the melt pool. The computational columnar to equiaxed transition was close to the transition observed in experimental samples using EBSD maps. The findings in this research provide deeper understanding of the process-microstructure relationship of laser processed thermoelectric materials. Future efforts can be devoted to investigating the process-structure-property relationship of these materials through fabrication and thermoelectric characterization of bulk samples, and this work can inform the burgeoning interest in laser additive manufacturing of thermoelectric materials.
Data availability statement
The original contributions presented in the study are included in the article/supplementary material, further inquiries can be directed to the corresponding author.
Author contributions
CO: Conceptualization, experiments, microstructural characterization, manuscript writing, BS: Simulations, RW: Transmission electron microscopy, SL: Overall research supervision, manuscript reviewing and editing.
Funding
SL gratefully acknowledges support from the National Science Foundation CAREER Award, Award No. CMMI-1943104 and U.S. Department of Energy, Energy Efficiency and Renewable Energy, Advanced Manufacturing Office Award Nos. DE-EE0009100 and DE-EE009097. SL, CO, BS, and RW acknowledge support from the Office of Naval Research, Award No. N0014-20-1-2365.
Acknowledgments
The authors appreciate the collaboration of The George Washington University Nanofabrication and Imaging Center and Dr. Richard White from University of Virginia for EBSD analysis.
Conflict of interest
The authors declare that the research was conducted in the absence of any commercial or financial relationships that could be construed as a potential conflict of interest.
Publisher’s note
All claims expressed in this article are solely those of the authors and do not necessarily represent those of their affiliated organizations, or those of the publisher, the editors and the reviewers. Any product that may be evaluated in this article, or claim that may be made by its manufacturer, is not guaranteed or endorsed by the publisher.
Supplementary material
The Supplementary Material for this article can be found online at: https://www.frontiersin.org/articles/10.3389/femat.2022.1046694/full#supplementary-material
References
Aljaghtham, M., and Celik, E. (2021). Numerical analysis of energy conversion efficiency and thermal reliability of novel, unileg segmented thermoelectric generation systems. Int. J. Energy Res. 45 (6), 8810–8823. doi:10.1002/er.6416
Ansari, P., and Salamci, M. U. (2022). On the selective laser melting based additive manufacturing of AlSi10Mg: The process parameter investigation through multiphysics simulation and experimental validation. J. Alloys Compd. 890 (2022), 161873. doi:10.1016/j.jallcom.2021.161873
Barin, I., Knacke, O., and Kubaschewski, O. (2013). Thermochemical properties of inorganic substances: Supplement. Berlin: Springer Science & Business Media.
Bayat, M., Thanki, A., Mohanty, S., Witvrouw, A., Yang, S., Thorborg, J., et al. (2019). Keyhole-induced porosities in laser-based powder bed fusion (L-PBF) of Ti6Al4V: High-fidelity modelling and experimental validation. Addit. Manuf. 30, 100835. doi:10.1016/j.addma.2019.100835
Bertoli, U. S., Wolfer, A. J., Matthews, M. J., Delplanque, J. P. R., and Schoenung, J. M. (2017). On the limitations of volumetric energy density as a design parameter for selective laser melting. Mater. Des. 113, 331–340. doi:10.1016/j.matdes.2016.10.037
Bolling, G. F. (1960). Some thermal data for Bi2Te3. J. Chem. Phys. 33 (1), 305–306. doi:10.1063/1.1731116
Bowley, A. E., Cowles, L., Williams, G. J., and Goldsmid, H. J. (1961). Measurement of the figure of merit of a thermoelectric material. J. Sci. Instrum. 38 (11), 433–435. doi:10.1088/0950-7671/38/11/309
Brooks, L. S. (1952). The vapor pressures of tellurium and selenium. J. Am. Chem. Soc. 74 (1), 227–229. doi:10.1021/ja01121a059
Cahill, J. A., and Kirshenbaum, A. D. (1963). The density of liquid bismuth from its melting point to its normal boiling point and an estimate of its critical constants. J. Inorg. Nucl. Chem. 25 (5), 501–506. doi:10.1016/0022-1902(63)80233-x
Carter, M. J., El-Desouky, A., Andre, M. A., Bardet, P., and LeBlanc, S. (2019). Pulsed laser melting of bismuth telluride thermoelectric materials. J. Manuf. Process. 43, 35–46. doi:10.1016/j.jmapro.2019.04.021
Das, S. (2003). Physical aspects of process control in selective laser sintering of metals. Adv. Eng. Mat. 5 (10), 701–711. doi:10.1002/adem.200310099
Du, Y., Chen, J., Meng, Q., Dou, Y., Xu, J., and Shen, S. Z. (2020). Thermoelectric materials and devices fabricated by additive manufacturing. Vacuum 178 (2020), 109384. doi:10.1016/j.vacuum.2020.109384
Eagar, T. W., and Tsai, N. S. (1983). Temperature fields produced by traveling distributed heat sources. Weld. J. 62 (12), 346–355.
El-Desouky, A., Carter, M., Mahmoudi, M., Elwany, A., and LeBlanc, S. (2017). Influences of energy density on microstructure and consolidation of selective laser melted bismuth telluride thermoelectric powder. J. Manuf. Process. 25, 411–417. doi:10.1016/j.jmapro.2016.12.008
El-Desouky, A., Read, A. L., and Bardet, P. M. (2015). “Selective laser melting of a bismuth telluride thermoelectric materials,” in Proc Solid Free Symp, Solid Freeform Fabrication Symposium, Austin, Texas, 1043–1050.
Fedorov, V. I., and Kazandzhan, B. I. (1968). Mechanism of electrical and heat conduction in liquid bismuth chalcogenides. Sov. Phys. Semiconductors-USSR 2, 17.
Fu, L., Yin, M., Wu, D., Li, W., Feng, D., Huang, L., et al. (2017). Large enhancement of thermoelectric properties in n-type PbTe via dual-site point defects. Energy Environ. Sci. 10 (9), 2030–2040. doi:10.1039/c7ee01871a
Goldsmid, H. J. (1958). Heat conduction in bismuth telluride. Proc. Phys. Soc. 72 (1), 17–26. doi:10.1088/0370-1328/72/1/304
Gomell, L., Haeger, T., Roscher, M., Bishara, H., Heiderhoff, R., Riedl, T., et al. (2022). Microstructure manipulation by laser-surface remelting of a full-Heusler compound to enhance thermoelectric properties. Acta Mater. 223 (2022), 117501. doi:10.1016/j.actamat.2021.117501
Griffiths, S., Rossell, M. D., Croteau, J., Vo, N., Dunand, D., and Leinenbach, C. (2018). Effect of laser rescanning on the grain microstructure of a selective laser melted Al-Mg-Zr alloy. Mater. Charact. 143, 34–42. doi:10.1016/j.matchar.2018.03.033
Gu, D., and Shen, Y. (2009). Balling phenomena in direct laser sintering of stainless steel powder: Metallurgical mechanisms and control methods. Mater. Des. 30 (8), 2903–2910. doi:10.1016/j.matdes.2009.01.013
He, Y., Zhong, M., Jones, N., Beuth, J., and Webler, B. (2021). The columnar-to-equiaxed transition in melt pools during laser powder bed fusion of M2 steel. Metall. Mat. Trans. A 52, 4206–4221. doi:10.1007/s11661-021-06380-9
Ho, C. Y., and Chu, T. K. (1977). "Electrical resistivity and thermal conductivity of nine selected AISI stainless steels". Thermophysical and Electronic Properties Information Analysis Center Lafayette.
Imani Shahabad, S., Karimi, G., and Toyserkani, E. (2021). An extended rosenthal’s model for laser powder-bed fusion additive manufacturing: Energy auditing of thermal boundary conditions. Lasers Manuf. Mat. Process. 8 (3), 288–311. doi:10.1007/s40516-021-00148-0
Incropera, F. P., DeWitt, D. P., and Bergman, T. L. (1996). Fundamentals of heat and mass transfer, 6. New York: Wiley.
Junior, O. A., Maran, A., and Henao, N. C. (2018). A review of the development and applications of thermoelectric microgenerators for energy harvesting. Renew. Sustain. Energy Rev. 91, 376–393. doi:10.1016/j.rser.2018.03.052
Kamath, C. (2016). Data mining and statistical inference in selective laser melting. Int. J. Adv. Manuf. Technol. 86 (5), 1659–1677. doi:10.1007/s00170-015-8289-2
Khairallah, S. A., Anderson, A. T., Rubenchik, A., and King, W. E. (2016). Laser powder-bed fusion additive manufacturing: Physics of complex melt flow and formation mechanisms of pores, spatter, and denudation zones. Acta Mater. 108, 36–45. doi:10.1016/j.actamat.2016.02.014
Kim, K. T., Choi, S. Y., Shin, E. H., Moon, K. S., Koo, H. Y., Lee, G. G., et al. (2013). The influence of CNTs on the thermoelectric properties of a CNT/Bi2Te3 composite. Carbon 52, 541–549. doi:10.1016/j.carbon.2012.10.008
King, W., Anderson, A. T., Ferencz, R. M., Hodge, N. E., Kamath, C., and Khairallah, S. A. (2015). Overview of modelling and simulation of metal powder bed fusion process at Lawrence Livermore National Laboratory. Mater. Sci. Technol. 31 (8), 957–968. doi:10.1179/1743284714y.0000000728
King, W. E., Barth, H. D., Castillo, V. M., Gallegos, G. F., Gibbs, J. W., Hahn, D. E., et al. (2014). Observation of keyhole-mode laser melting in laser powder-bed fusion additive manufacturing. J. Mater. Process. Technol. 214 (12), 2915–2925. doi:10.1016/j.jmatprotec.2014.06.005
Kurz, W., Bezençon, C., and Gäumann, M. (2001). Columnar to equiaxed transition in solidification processing. Sci. Technol. Adv. Mater. 2 (1), 185–191. doi:10.1016/s1468-6996(01)00047-x
Le, T., and Lo, Y. (2019). Effects of sulfur concentration and Marangoni convection on melt-pool formation in transition mode of selective laser melting process. Mater. Des. 179, 107866. doi:10.1016/j.matdes.2019.107866
Leitz, K., Singer, P., Plankensteiner, A., Tabernig, B., Kestler, H., and Sigl, L. (2017). Multi-physical simulation of selective laser melting. Metal. Powder Rep. 72 (5), 331–338. doi:10.1016/j.mprp.2016.04.004
Leonov, V., and Vullers, R. (2009). Wearable thermoelectric generators for body-powered devices. J. Electron. Mat. 38 (7), 1491–1498. doi:10.1007/s11664-008-0638-6
Li, R., Liu, J., Shi, Y., Wang, L., and Jiang, W. (2012). Balling behavior of stainless steel and nickel powder during selective laser melting process. Int. J. Adv. Manuf. Technol. 59 (9), 1025–1035. doi:10.1007/s00170-011-3566-1
Liu, C., Wu, H., and Chen, S. (2013). Liquidus projection of the ternary Bi-Sb-Te thermoelectric material system. Metall. Mat. Trans. A 44 (12), 5424–5433. doi:10.1007/s11661-013-1883-8
Mao, Y., Yan, Y., Wu, K., Xie, H., Xiu, Z., Yang, J., et al. (2017). Non-equilibrium synthesis and characterization of n-type Bi 2 Te 2.7 Se 0.3 thermoelectric material prepared by rapid laser melting and solidification. RSC Adv. 7 (35), 21439–21445. doi:10.1039/c7ra02677c
Masood, K. B., Kumar, P., Singh, R. A., and Singh, J. (2018). Odyssey of thermoelectric materials: Foundation of the complex structure. J. Phys. Commun. 2 (6), 062001. doi:10.1088/2399-6528/aab64f
Mueller, B. (2012). Additive manufacturing technologies–Rapid prototyping to direct digital manufacturing. Assem. Autom. 32. doi:10.1108/aa.2012.03332baa.010
Olakanmi, E. O., Cochrane, R. F., and Dalgarno, K. W. (2015). A review on selective laser sintering/melting (SLS/SLM) of aluminium alloy powders: Processing, microstructure, and properties. Prog. Mater. Sci. 74, 401–477. doi:10.1016/j.pmatsci.2015.03.002
Panwisawas, C., Qiu, C., Anderson, M. J., Sovani, Y., Turner, R. P., Attallah, M. M., et al. (2017). Mesoscale modelling of selective laser melting: Thermal fluid dynamics and microstructural evolution. Comput. Mater. Sci. 126, 479–490. doi:10.1016/j.commatsci.2016.10.011
Qiu, J., Yan, Y., Luo, T., Tang, K., Yao, L., Zhang, J., et al. (2019). 3D printing of highly textured bulk thermoelectric materials: Mechanically robust BiSbTe alloys with superior performance. Energy Environ. Sci. 12 (10), 3106–3117. doi:10.1039/c9ee02044f
Qiu, J., Yan, Y., Xie, H., Luo, T., Xia, F., Yao, L., et al. (2021). Achieving superior performance in thermoelectric Bi0. 4Sb1. 6Te3. 72 by enhancing texture and inducing high-density line defects. Sci. China Mat. 64 (6), 1507–1520. doi:10.1007/s40843-020-1548-x
Rammos, P. (2020). Numerical framework for selective laser melting processing of thermoelectric materials.
Rosenthal, D. (1941). Mathematical theory of heat distribution during welding and cutting. Weld. J. 20, 220–234.
Sisik, B., and LeBlanc, S. (2020). The influence of leg shape on thermoelectric performance under constant temperature and heat flux boundary conditions. Front. Mat. 7, 595955. doi:10.3389/fmats.2020.595955
Sobolev, V. V., Shutov, S. D., Popov, Y. V., and Shestatskii, S. N. (1968). Reflectivity spectra of the rhombohedral crystals Bi2Te3, Bi2Se3, and Sb2Te3 over the range from 0.7 to 12.5 eV. Phys. Stat. Sol. 30 (1), 349–355. doi:10.1002/pssb.19680300141
Tang, X., Li, Z., Liu, W., Zhang, Q., and Uher, C. (2022). A comprehensive review on Bi2Te3-based thin films: Thermoelectrics and beyond. Interdiscip. Mater. 1 (1), 88–115. doi:10.1002/idm2.12009
Thimont, Y., and LeBlanc, S. (2019). The impact of thermoelectric leg geometries on thermal resistance and power output. J. Appl. Phys. 126 (9), 095101. doi:10.1063/1.5115044
Wan, C., Wang, Y., Norimatsu, W., Kusunoki, M., and Koumoto, K. (2012). Nanoscale stacking faults induced low thermal conductivity in thermoelectric layered metal sulfides. Appl. Phys. Lett. 100 (10), 101913. doi:10.1063/1.3691887
Wang, W., Cionca, V., Wang, N., Hayes, M., O'Flynn, B., and O'Mathuna, C. (2013). Thermoelectric energy harvesting for building energy management wireless sensor networks. Int. J. Distributed Sens. Netw. 9 (6), 232438. doi:10.1155/2013/232438
Welch, R., Hobbis, D., Birnbaum, A. J., Nolas, G., and LeBlanc, S. (2021). Nano-and micro-structures formed during laser processing of selenium doped bismuth telluride. Adv. Mat. Interfaces 8, 2100185. doi:10.1002/admi.202100185
Welch, R., Hobbis, D., Nolas, G., and LeBlanc, S. (2020). Meso-micro-and nano-structures induced in bismuth telluride thermoelectric materials by laser additive manufacturing. Energy Harvest. Storage Mater. Devices, Appl. X 11387, 1138710. doi:10.1117/12.2558676
Wu, K., Yan, Y., Zhang, J., Mao, Y., Xie, H., Yang, J., et al. (2017). Preparation of n-type Bi2Te3 thermoelectric materials by non-contact dispenser printing combined with selective laser melting. Phys. Status Solidi RRL. 11 (6), 1700067. doi:10.1002/pssr.201700067
Wu, Y., Sun, K., Yu, S., and Zuo, L. (2021). Modeling the selective laser melting-based additive manufacturing of thermoelectric powders. Addit. Manuf. 37 (2021), 101666. doi:10.1016/j.addma.2020.101666
Yan, F., Xiong, W., and Faierson, E. J. (2017). Grain structure control of additively manufactured metallic materials. Materials 10 (11), 1260. doi:10.3390/ma10111260
Yang, J., and Stabler, F. R. (2009). Automotive applications of thermoelectric materials. J. Electron. Mat. 38 (7), 1245–1251. doi:10.1007/s11664-009-0680-z
Yu, Y., Wu, Z., Cojocaru-Mirédin, O., Zhu, B., Wang, X. Y., Gao, N., et al. (2017). Dependence of solidification for Bi 2 Te 3− x Se x alloys on their liquid states. Sci. Rep. 7 (1), 2463–2510. doi:10.1038/s41598-017-02507-4
Zhang, H., Hobbis, D., Nolas, G. S., and LeBlanc, S. (2018). Laser additive manufacturing of powdered bismuth telluride. J. Mat. Res. 33 (23), 4031–4039. doi:10.1557/jmr.2018.390
Zhang, X., Yocom, C. J., Mao, B., and Liao, Y. (2019). Microstructure evolution during selective laser melting of metallic materials: A review. J. Laser Appl. 31 (3), 031201. doi:10.2351/1.5085206
Zhao, C., Parab, N. D., Li, X., Fezzaa, K., Tan, W., Rollett, A. D., et al. (2020). Critical instability at moving keyhole tip generates porosity in laser melting. Science 370 (6520), 1080–1086. doi:10.1126/science.abd1587
Keywords: thermoelectricity, additive manufacturing, microstructure, laser powder bed fusion, simulation
Citation: Oztan C, Şişik B, Welch R and LeBlanc S (2022) Process-microstructure relationship of laser processed thermoelectric material Bi2Te3. Front. Electron. Mater. 2:1046694. doi: 10.3389/femat.2022.1046694
Received: 16 September 2022; Accepted: 09 November 2022;
Published: 08 December 2022.
Edited by:
Ctirad Uher, Department of Physics, University of Michigan, United StatesReviewed by:
Tiejun Zhu, Zhejiang University, ChinaWei Liu, Wuhan University of Technology, China
Christian Stiewe, German Aerospace Center (DLR), Germany
Matthew Burton, Swansea University, United Kingdom
Copyright © 2022 Oztan, Şişik, Welch and LeBlanc. This is an open-access article distributed under the terms of the Creative Commons Attribution License (CC BY). The use, distribution or reproduction in other forums is permitted, provided the original author(s) and the copyright owner(s) are credited and that the original publication in this journal is cited, in accordance with accepted academic practice. No use, distribution or reproduction is permitted which does not comply with these terms.
*Correspondence: Saniya LeBlanc, c2xlYmxhbmNAZ3d1LmVkdQ==