 Miquel Perelló-Amorós1
 Emilio J. Vélez1
 Jaume Vela-Albesa1
 Albert Sánchez-Moya1
 Natàlia Riera-Heredia1
 Ida Hedén2
 Jaume Fernández-Borràs1
 Josefina Blasco1
 Josep A. Calduch-Giner3
 Isabel Navarro1
 Encarnación Capilla1
 Elisabeth Jönsson2
 Jaume Pérez-Sánchez3
 Joaquim Gutiérrez1*
- 1Department of Cell Biology, Physiology and Immunology, Faculty of Biology, University of Barcelona, Barcelona, Spain
- 2Fish Endocrinology Laboratory, Department of Biological and Environmental Sciences, University of Gothenburg, Gothenburg, Sweden
- 3Nutrition and Fish Growth Endocrinology, Institute of Aquaculture Torre de la Sal (CSIC), Castellón, Spain
Ghrelin is involved in the regulation of growth in vertebrates through controlling different functions, such as feed intake, metabolism, intestinal activity or growth hormone (Gh) secretion. The aim of this work was to identify the sequences of preproghrelin and Ghrelin receptors (ghsrs), and to study their responses to different nutritional conditions in gilthead sea bream (Sparus aurata) juveniles. The structure and phylogeny of S. aurata preproghrelin was analyzed, and a tissue screening was performed. The effects of 21 days of fasting and 2, 5, 24 h, and 7 days of refeeding on plasma levels of Ghrelin, Gh and Igf-1, and the gene expression of preproghrelin, ghsrs and members of the Gh/Igf-1 system were determined in key tissues. preproghrelin and the receptors are well conserved, being expressed mainly in stomach, and in the pituitary and brain, respectively. Twenty-one days of fasting resulted in a decrease in growth while Ghrelin plasma levels were elevated to decrease at 5 h post-prandial when pituitary ghsrs expression was minimum. Gh in plasma increased during fasting and slowly felt upon refeeding, while plasma Igf-1 showed an inverse profile. Pituitary gh expression augmented during fasting reaching maximum levels at 1 day post-feeding while liver igf-1 expression and that of its splice variants decreased to lowest levels. Liver Gh receptors expression was down-regulated during fasting and recovered after refeeding. This study demonstrates the important role of Ghrelin during fasting, its acute down-regulation in the post-prandial stage and its interaction with pituitary Ghsrs and Gh/Igf-1 axis.
Introduction
Ghrelin is a peptide hormone secreted mainly by the stomach in vertebrates, but also detected in many other tissues (e.g., intestine, heart, pancreas, and especially pituitary and brain). Ghrelin is synthesized as Preproghrelin, and the mature peptide varies between 12 and 28 amino acids, depending on species and form of Ghrelin, but it shows high sequence homology across vertebrates, including fish (1). Since its discovery, Ghrelin has been involved in many physiological processes like the regulation of feed intake, adiposity, growth, energy and glucose metabolism, intestinal motility and digestive enzymes activity, among others (2). The first characterization of Ghrelin in a fish species, the goldfish (Carassius auratus), was done by Unniappan et al. (3). Later, Kaiya et al. (4) reviewed its function in non-mammalian vertebrates and recently, different publications have investigated its role in other fish species (5–12), but very little is known about this hormone in gilthead sea bream (Sparus aurata) (13).
Ghrelin functions through binding to its receptors, which are also known as the growth hormone secretagogue receptors (Ghsrs). The Ghsrs are a family of transmembrane G-protein coupled receptors, and the Ghsr1a isoform, discovered a few years before Ghrelin (14), is known as the active form. An alternative splice variant named Ghsr1b, was also described by the same authors, but its structure lacks two transmembrane domains leading to the impossibility of this isoform to initiate intracellular signaling. Since the discovery of these two receptors, the Ghsrs family has been widely studied and other numerous isoforms (splice variants and paralogues) have been described in vertebrates (15, 16).
ghsrs mRNA is found in many tissues, including brain, stomach, intestine, and especially pituitary gland. The high expression levels detected in the pituitary in vertebrates confirms the role of Ghsrs in the regulation of growth hormone (Gh) production (17). Gh is one of the key elements of the Gh/insulin-like growth factor-1 (Igf-1) axis, which is the main regulator of growth in vertebrates. Depending on factors such as nutritional state, Gh can directly stimulate anabolic or catabolic processes by binding to the Gh receptors (Ghrs). Moreover, systemic Gh mainly acts in the liver, where it stimulates the production of Igf-1. This growth factor in turn acts in many peripheral tissues stimulating growth-related processes (18). Thus, most of the physiological peripheral roles of Ghrelin appear to be mediated indirectly by the modulation of Gh release (19). In addition, Ghrelin has been described to have an important role in the hypothalamus in mammals, where it acts on different ghsrs-expressing cell populations, leading to enhanced expression and release of orexigenic neuropeptides like neuropeptide Y and Agouti-related peptide, hence stimulating appetite in most vertebrates, including diverse fish species (20). Moreover, it has been recently reported, at least in mammals, that Ghrelin acts over the hypothalamic Gh releasing hormone neurons (21). Although there is a controversy on how the different forms of Ghrelin (acylated and unacylated) cross the blood brain barrier to exert this role (22), adding another complex level of regulation.
Fish are capable to resist long fasting periods (23) and the Gh/Igf-1 system, displays interesting changes to adjust metabolism and growth to nutrient supply. Ghrelin in its double role as a hunger hormone and Gh secretion regulator should play an important role in fasting and refeeding physiology, although these aspects are poorly known in fish, especially in gilthead sea bream (13, 24).
The objective of the present work was to identify and characterize Ghrelin and its receptors by analyzing sequences, phylogeny and gene expression through a tissue screening, and to study their responsiveness upon fasting and refeeding in relation with the Gh/Igf-1 axis in gilthead sea bream juveniles.
Materials and Methods
Fish Maintenance and Distribution
Gilthead sea bream juveniles (initial body weight 50 ± 3 g; length 15.3 ± 0.68 cm) were obtained from a commercial hatchery (Piscimar, Borriana, Spain) and reared in the facilities of the Faculty of Biology. Forty-two fish were randomly distributed in six 200 L seawater tanks (7 fish/tank) and some extra fish for tissue screening were kept in another 200 L tank. Fish were kept in a seawater recirculation system at a constant temperature of 23 ± 1°C and at 12 h light/12 h dark photoperiod through the whole experiment. During the acclimation period (2 weeks), fish were fed to apparent satiety twice a day with a commercial diet (Optibream, Skretting, Burgos, Spain). This study was carried out in accordance with the recommendations of the EU, Spanish and Catalan Government-established norms and procedures. The protocol was approved by the Ethics and Animal Care Committee of the University of Barcelona (permit numbers CEEA 110/17 and DAAM 9488).
Experimental Design
After acclimation, a period of 21 days of fasting and 7 days of refeeding was designed, according to previous experience (25). During the refeeding period, fish were fed once a day to apparent satiety. Samplings were made at the beginning and end of the fasting period (−21 and 0 days, respectively), and at 2, 5, 24 h and 7 days upon refeeding. The −21 days, 24 h and 7 days samplings were made just before feeding, representing one day fasting. The day 0 sampling was done at the same time of the day, and fish were fed right after to start the refeeding. In each sampling, 6 fish were first anesthetized with MS-222 (0.08 g/L), and once blood was extracted, were sacrificed by an overdose of MS-222 (>0.1 g/L). Then, brain, pituitary, liver and stomach were dissected and stored in liquid nitrogen. Before sacrifice, body weight, body length (standard), and liver and viscera weight were measured to calculate distinct biometric indexes: condition factor (CF), hepatosomatic index (HSI), and viscerosomatic index (VSI).
Additionally, 3 fish were sacrificed and sampled for 17 distinct tissues and/or organs. RNA was obtained from tissue samples (30–100 mg) or from the whole pituitary gland and brain with 1 mL of TRI Reagent Solution (Applied Biosystems, Alcobendas, Spain) and reverse transcribed following the procedures previously described (26). Briefly, 1 μg of RNA was treated with DNase I (Life Technologies, Alcobendas, Spain) following the manufacturer's instructions to remove genomic DNA. After DNase treatment, retrotranscription was performed using the Transcriptor First Strand cDNA Synthesis Kit (Roche, Sant Cugat del Vallès, Spain) for 10 min at 25°C, 60 min at 50°C and 5 min at 85°C. Samples were immediately stored at −20°C for further analysis.
Preproghrelin and ghsrs Characterization
Primers for the amplification of the complete codifying sequences of preproghrelin, ghsr1a and ghsr1b were designed using Primer3Plus software (27) with the nucleotide sequences obtained from the Nutrigroup-IATS nucleotide database of gilthead sea bream at http://www.nutrigroup-iats.org/seabreamdb (28, 29)]. The three sequences are deposited in GenBank (NCBI) under accession numbers: MG570187 for preproghrelin; MG570188 for ghsr1a, and MG570189 for ghsr1b. Sequences specificity was confirmed by PCR amplification of transcribed RNA samples from the tissue screening that were run on an agarose gel for size verification.
A multiple Preproghrelin sequence alignment was performed using the default settings of the MAFFT tool online (server) version (http://mafft.cbrc.jp/alignment/server/). The phylogeny was inferred using the JTT + G + I model substitution method and an unrooted tree was constructed using the MEGA X software with a bootstrapping value of 1,000. Previously, using the same software, a test was performed to determine which substitution model was the best for our data (data not shown). Unequivocal identity of ghsr1a and ghsr1b was verified by Blast and BlastX searches, as well as by transmembrane domain analysis by means of TMHMM transmembrane helixes prediction program (http://www.cbs.dtu.dk/services/TMHMM-2.0).
Ghrelin, Gh and Igf-1 Plasma Levels
Plasma levels of acylated Ghrelin were measured using the Ghrelin N- radioimmunoassay (RIA) protocol originally described by Hosoda et al. (30) and modified by Jönsson et al. (7) with the exception that plasma was not extracted, just quickly centrifuged (1,000 rpm, 1 min) before pipetting to the RIA tubes, and iodinated human Ghrelin (NEX388010UC, PerkinElmer, USA) was applied as tracer. Anti-rat Ghrelin [1-11] antisera, which specifically recognizes the conserved n-octanoylated Ser3 epitope on Ghrelin, was used at a final dilution of 1:500000 (gift from Dr. Hiroshi Hosoda, Japan). Standard was made using synthetic rainbow trout acylated Ghrelin (Peptide institute, Japan).
All samples were assayed in duplicate and included in one assay. The Ghrelin RIA was validated for gilthead sea bream, and the slopes of the standard curve and of a serial dilution of plasma samples were parallel (Supplementary Figure 1). Plasma levels of Gh and Igf-1 were measured by corresponding RIAs, as previously described (31, 32).
Gene Expression
The mRNA transcript levels were examined by quantitative real-time PCR (qPCR) according to the requirements of MIQUE guidelines (33) in a CFX384™ Real-Time System (Bio-Rad, El Prat de Llobregat, Spain). All reactions were performed in the conditions previously described (26). The primers used are listed in Table 1. To amplify the two ghsrs the forward primer was designed in a common region, and the reverse primer for ghsr1a in a region overlapping exon 1 and 2, and for ghsrb1 in a region including the differential nucleotides at the end of translation and the 3′-UTR. In addition, elongation factor 1 alpha (ef1a), ribosomal protein S18 (rps18) and b-actin (only in brain) were analyzed and served as reference genes in order to calculate the relative expression of the target genes (34). Both, reference genes stability and relative expression calculation were determined with the Bio-Rad CFX Manager Software (v2.1).
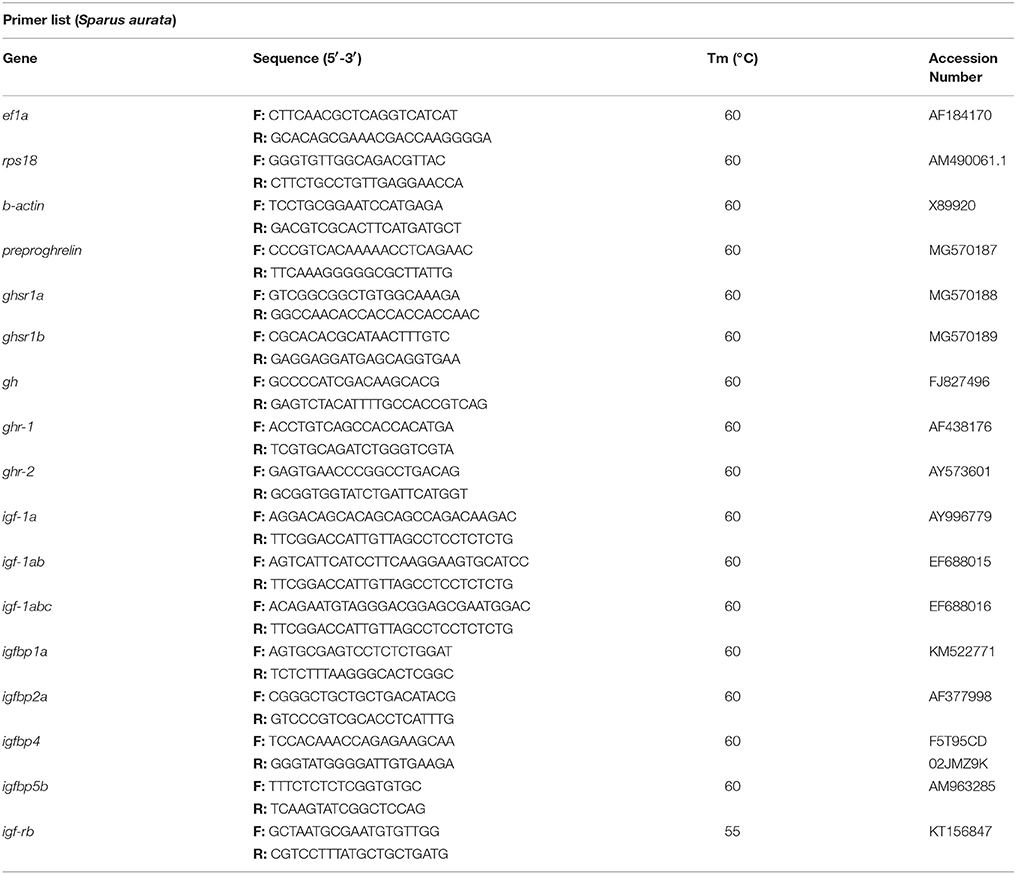
Table 1. Sequences, melting temperatures (Tm) and GenBank accession numbers of the primers used for qPCR.
Statistical Analyses
Data was analyzed using IBM SPSS Statistics 22 and are showed as mean ± standard error of the mean (SEM). Normality and homogeneity of variances were tested with Shapiro-Wilk Test and Levene's, respectively. When data did not follow a normal distribution or did not have homoscedasticity, it was converted by logarithm transformation. Differences among groups were tested by one-way analysis of variance (ANOVA) followed by Tukey HSD or LSD, as post-hoc tests. In case of no homoscedasticity, the non-parametric Kruskal-Wallis test was used with the Dunnett's T3 as post-hoc. The confidence interval for all analyses was set at 5%.
Results
Preproghrelin and Ghsrs Characterization
Translation of preproghrelin nucleotide sequence (907 nucleotide in length) resulted in a 107 amino acid sequence that presented 97% identity with that of another sparid, the blackhead sea bream (Acanthopagrus schlegelii), as the most significant result in a BlastX search. The predicted sequence of gilthead sea bream Preproghrelin contained the conserved N-terminal signal peptide (26 amino acids), that yields Proghrelin after cleavage. In the Proghrelin region, the sequence contained the characteristic Ser3 residue, which is the octanonylation target, as well as the GlyArg amidation and cleavage site to obtain the N-terminal mature Ghrelin (20 amino acids) and the C-terminal Proghrelin peptide (Figure 1A).
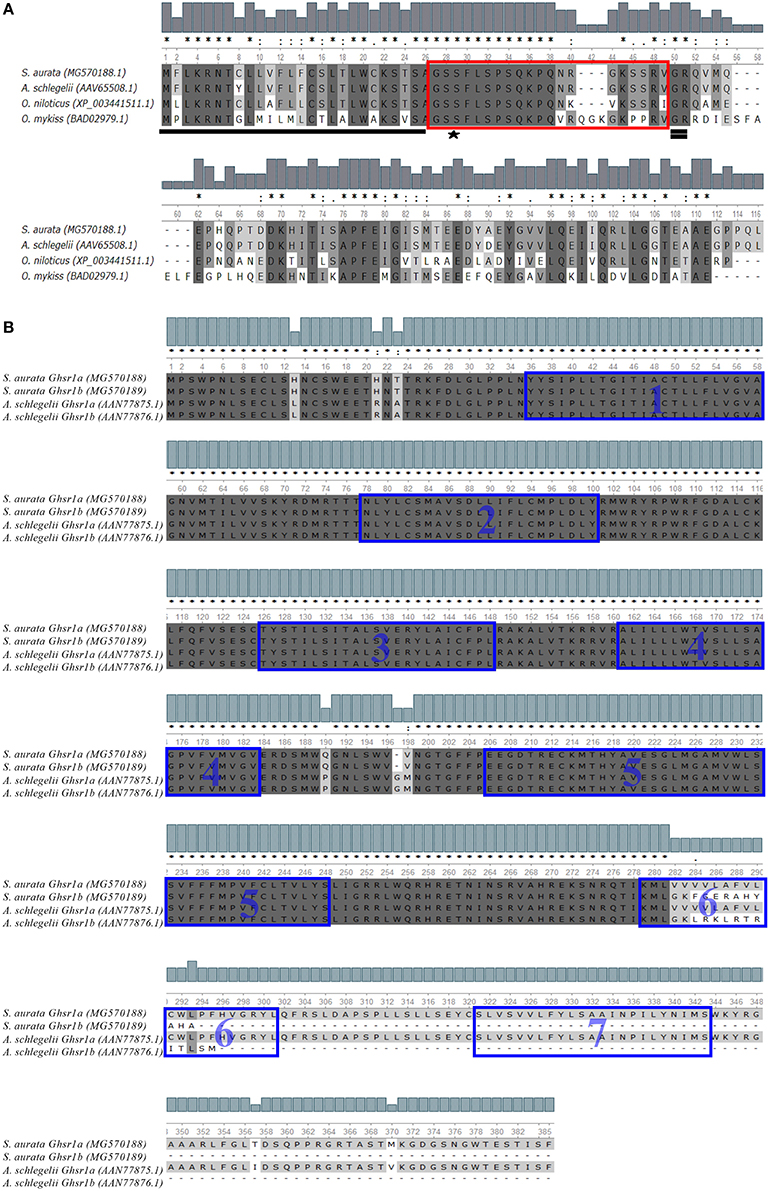
Figure 1. (A) Multiple alignment of the Preproghrelin amino acid sequences corresponding to members of sparidae perciformes (S. aurata and A. schlegelii), cichlidae perciforme (O. niloticus) and salmoniformes (O. mykiss). From N- to C-terminal, the signal peptide (underlined), the mature Ghrelin (red boxed) and C-terminal Proghrelin peptide (rest of the sequence) are highlighted. Moreover, the acylation target Ser3 residue (starred) and the GlyArg amidation and cleavage signal (double underlined) are identified and conserved. (B) Amino acid alignment of the translated sequences of S. aurata Ghsr1a and Ghsr1b with their respective orthologs of the sparidae perciforme (A. schlegelii). Predicted transmembrane domains are blue boxed. Percentage of identity is indicated in grey scale. “*” indicates positions which have a single, fully conserved residue; “:” indicates conservation between groups of strongly similar properties - scoring > 0.5 in the Gonnet PAM 250 matrix and “.” indicates conservation between groups of weakly similar properties - scoring ≤ 0.5 in the Gonnet PAM 250 matrix.
The nucleotide sequences of ghsr1a and ghsr1b (1708 and 1793 nucleotide in length, respectively) encoded for 384 (Ghsr1a) and 292 (Ghsr1b) amino acids sequences that shared a 98% of identity with their respective orthologs in the blackhead sea bream (35). In the same way, the TMHMM transmembrane helixes program predicted the presence of the characteristic seven transmembrane domains in Ghsr1a, whereas Ghsr1b did not retain the last two due to alternative gene splicing (Figure 1B).
The phylogenetic analysis of the Preproghrelin amino acid sequence is shown in Figure 2. The unrooted tree highlights the conservation of this protein in vertebrates, although it presents clusters that separate the different vertebrate classes and fish orders. Results of the preproghrelin and ghsrs gene expression screening are shown in Figures 3A,B, respectively. preproghrelin was mainly expressed in stomach, but weak expression was also detected in many other tissues (i.e., spleen and head kidney). Regarding the receptors, brain, pituitary and liver were the tissues with highest expression of both, ghsr1a and ghsr1b, although low levels of expression were also found in many other. In pituitary and brain, the expression levels of ghsr1a were very similar, but the expression of ghsr1b was higher in liver. Thus, in pituitary and brain the most abundant isoform was ghsr1a while in liver was ghsr1b.
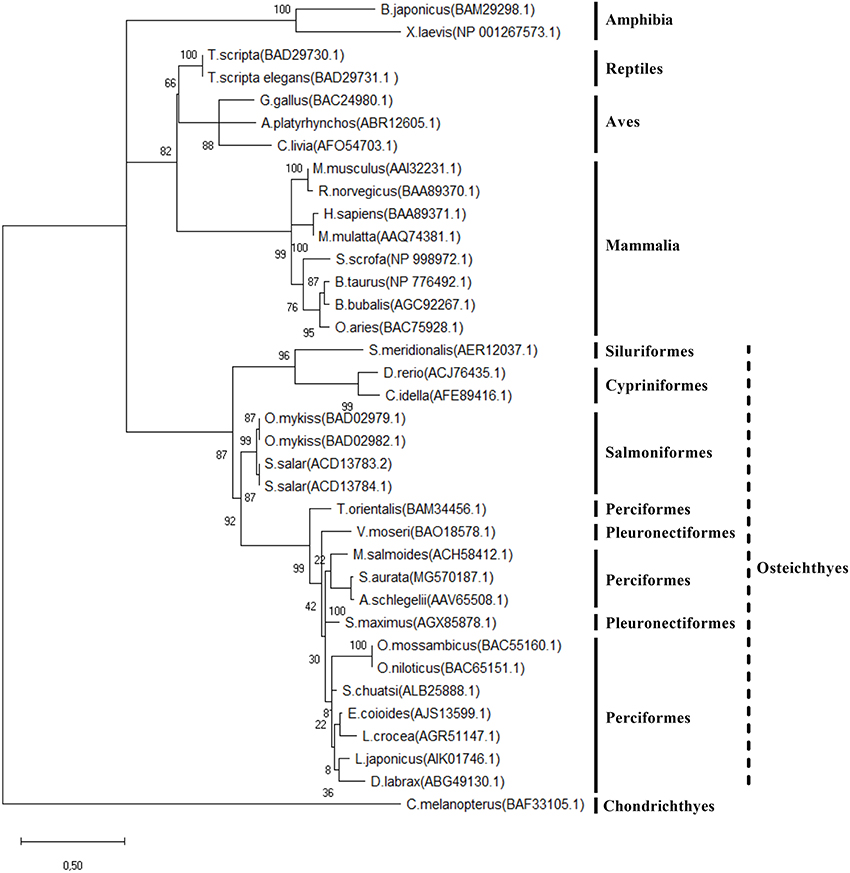
Figure 2. Phylogenetic analysis (unrooted tree) of Preproghrelin among different vertebrates. Multiple alignment was performed using the default settings of the MAFFT tool online (server) version (http://mafft.cbrc.jp/alignment/server/) and a phylogenetic tree by Maximum Likelihood phylogeny was built with the MEGA X tool using the JTT + G + I substitution model. B. japonicus (Bufo japonicus), X. laevis (Xenopus laevis), G. Gallus (Gallus gallus), A. platyrhynchos (Anas platyrhynchos), C. livia (Columba livia) T. scripta (Trachemys scripta), M. musculus (Mus musculus), R. norvegicus (Rattus norvegicus), H. sapiens (Homo sapiens), M. mulatta (Macaca mulatta), S. scrofa (Sus scrofa), O. aries (Ovis aries), B. Taurus (Bos Taurus), B. bubalis (Bubalus bubalis), S. meridionalis (Silurus meridionalis), D. rerio (Danio rerio), C. idella (Ctenopharyngodon idella), O. mykiss (Oncorhynchus mykiss, S. salar (Salmo salar), T. orientalis (Thunnus orientalis), V. moseri (Verasper moseri), M. salmoides (Micropterus salmoides), S. maximus (Scophthalmus maximus), S. aurata (Sparus aurata), A. schlegelii (Acanthopagrus schlegelii), L. japonicus (Lateolabrax japonicus), D. labrax (Dicenthrachus labrax), E. coioides (Epinephelus coioides), L. crocea (Larimichthys crocea), S. chuatsi (Siniperca chuatsi), O. mossambicus (Oreochromis mossambicus), O. niloticus (Oreochromis niloticus), C. melanopterus (Carcharhinus melanopterus). Length of the branches corresponds to number of substitutions per site and confidence values (based on a bootstrap number of 1,000) are shown above and below the lines, respectively.
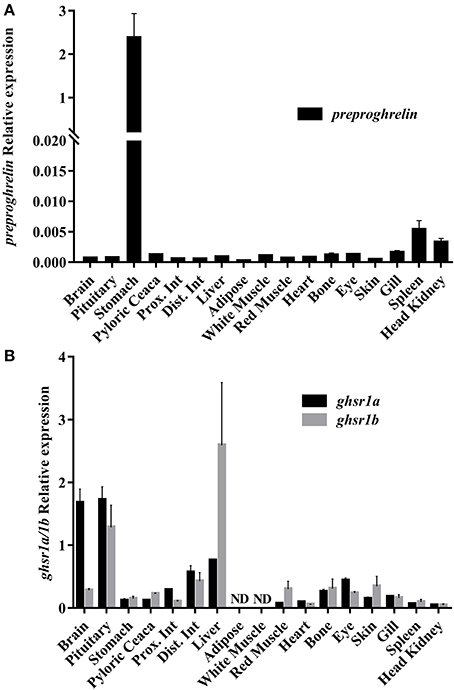
Figure 3. Relative gene expression across a tissue screening of preproghrelin (A) and Ghrelin receptors ghsr1a and ghsr1b (B). Data are shown as means ± SEM from three individual fish (n = 3). Prox. Int, proximal intestine; Dist. Int, distal intestine.
Fasting and Refeeding Experiment
Growth and Morphometric Parameters
Morphometric parameters results are shown in Figures 4A–D. Mean body weight (which was not significantly affected) and CF presented a similar pattern along the fasting/refeeding experiment, decreasing after fasting and slightly increasing afterwards, partially recovering at day 7. Regarding HSI, a significant decrease was observed after fasting, but was significantly increased at day 7 post-refeeding. At 2 h post-prandial the stomach was clearly full, but no food was found in the intestine, whereas at 5 h the stomach had emptied almost all its food content. Thus, VSI was significantly lower after the fasting period. With refeeding, it increased at 2 and 5 h, but at 1 and 7 days the VSI values returned to baseline levels.
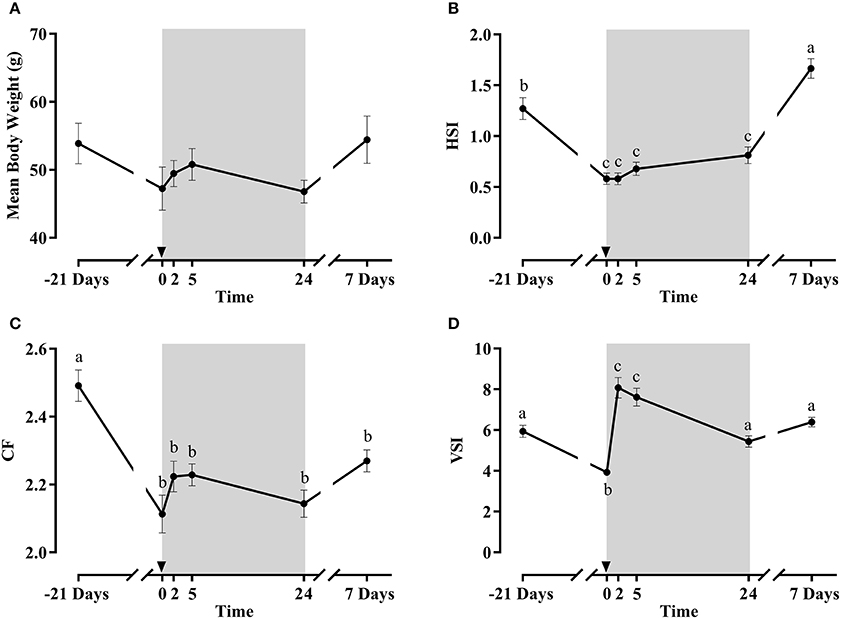
Figure 4. Mean body weight (A), condition factor (CF) (B), hepatosomatic index (HSI) (C) and viscerosomatic index (VSI) (D) of fish during the fasting and refeeding experiment. The postprandial period is shown in gray boxes and the time in hours. Data are shown as means ± SEM (n = 6). Letters indicate significant differences (p < 0.05) by one-way ANOVA and Tukey HSD or LSD test.
Plasma Ghrelin, Gh and Igf-1
Ghrelin, Gh, and Igf-1 plasma concentrations are presented in Figures 5A–C. Plasma Ghrelin showed maximum levels after fasting and at 2 h post-prandial, and a significant dip at 5 h, but then returned to high levels after 1 and 7 days. However, it should be taken into account that those samples, as well as the one before the whole fasting period, were taken after a 24 h fast, which appears to be a potential stimulus for Ghrelin secretion. Circulating Gh increased significantly with fasting. Then, there was no acute post-prandial change but a gradual decrease upon refeeding returning to basal after 7 days. Plasma Igf-1 levels had an inverse pattern to that of Gh; showing significantly lower values after the 21 days fasting period compared to day 0 and then returning to basal levels at 7 days post-refeeding.
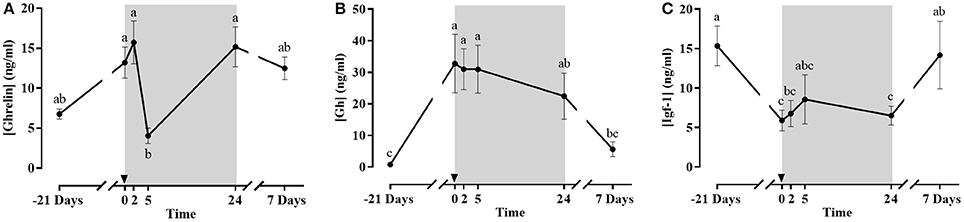
Figure 5. Plasma concentration of Ghrelin (A), Gh (B) and Igf-1 (C) during the fasting and refeeding experiment. The postprandial period is shown in gray boxes and the time in hours. Data are shown as means ± SEM (n = 6). Letters indicate significant differences (p < 0.05) by one-way ANOVA and Tukey HSD or LSD test.
Gene Expression
Preproghrelin and ghsrs
Stomach preproghrelin gene expression (Figure 6A) did not show any change after fasting, but a significant difference was observed after 1 day of refeeding. In the brain, preproghrelin gene expression was much lower than in the stomach (Figure 3A); fasting effects were not found either but at 5 h post-prandial the expression levels in the brain were significantly down-regulated (Figure 6D) compared to the initial sampling (−21 days), and similar low expression values were maintained at 1 and 7 days post-feeding.
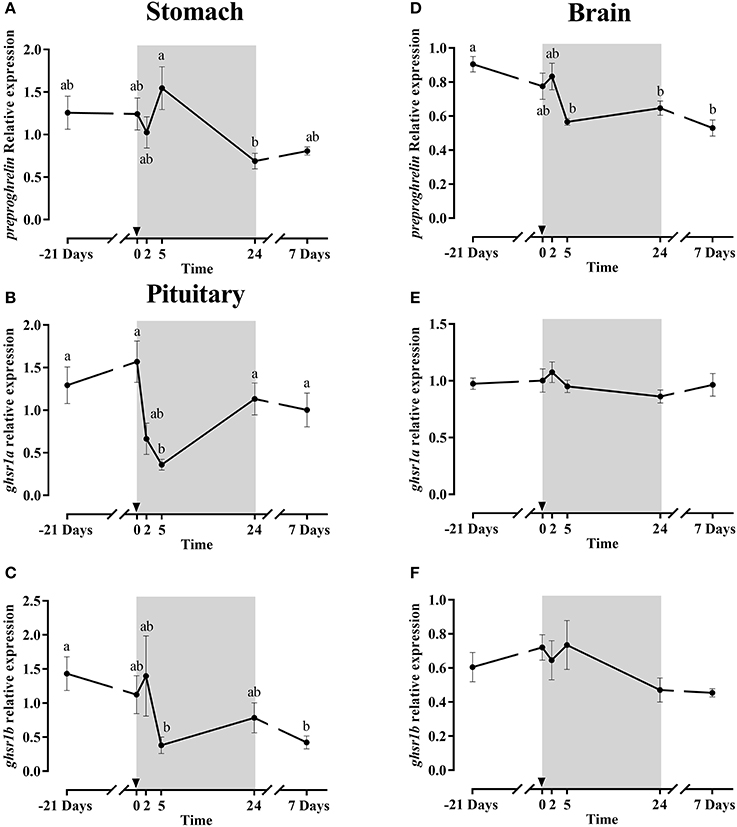
Figure 6. Relative gene expression of stomach preproghrelin (A), pituitary ghsr1a (B) and ghsr1b (C) and brain preproghrelin (D), ghsr1a (E) and ghsr1b (F) during the fasting and refeeding experiment. The postprandial period is shown in gray boxes and the time in hours. Data are shown as means ± SEM (n = 6). Letters indicate significant differences (p < 0.05) by one-way ANOVA and Tukey HSD or LSD test.
The mRNA expression profile of both pituitary ghsrs isoforms (Figures 6B,C) was similar along the experiment, stable during fasting and down-regulated significantly at 5 h refeeding. After 1 and 7 days, the expression of ghsr1a increased significantly reaching the levels as before fasting, while the ghsr1b expression remained low until the end. Moreover, the gene expression patterns of both ghsrs in the brain (Figures 6E,F) were almost identical, being practically irresponsive to either 21 days of fasting or the onset of feeding.
Gh/Igf-1 axis members
Pituitary gh gene expression (Figure 7A), similarly to plasma Gh, progressively increased to reach maximum levels at 1 day post-refeeding, decreasing back to basal levels at day 7.
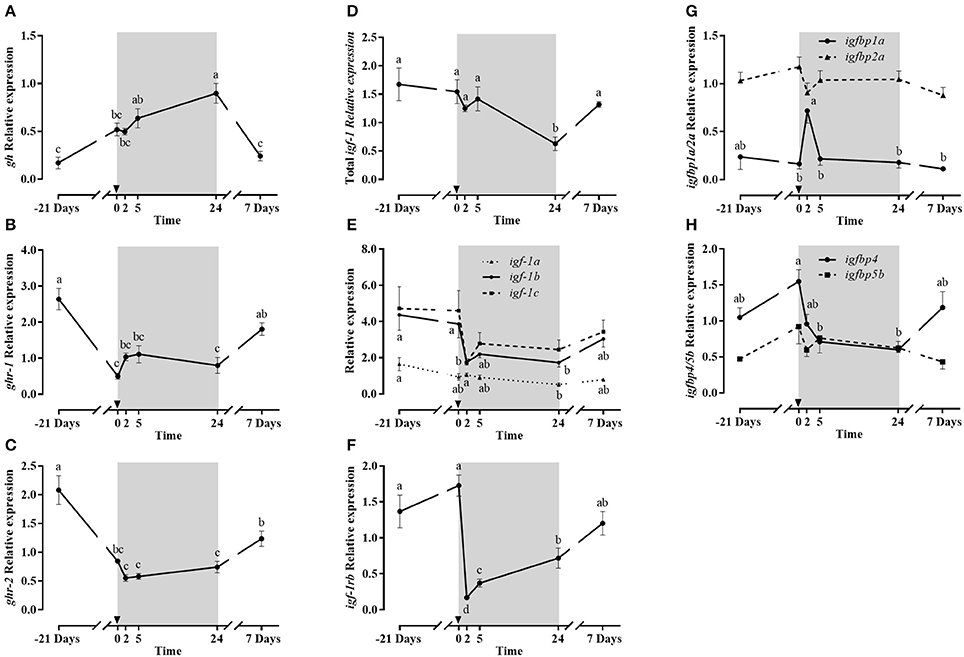
Figure 7. Relative gene expression of pituitary gh (A), liver ghr-1 (B) ghr-2 (C) total igf-1 (D), igf-1 splice variants (E) igf-1rb (F), igfbp1a and igbp2a (G) and igfbp4 and igfbp5b (H) during the fasting and refeeding experiment. The postprandial period is shown in gray boxes and the time in hours. Data are shown as means ± SEM (n = 6). Letters indicate significant differences (p < 0.05) by one-way ANOVA and Tukey HSD or LSD test.
The liver gene expression of total igf-1 (Figure 7D) remained stable after fasting and in the early post-prandial period, but after 1 day, the lowest levels were observed, and at day 7 returned to baseline. The igf-1 splice variants (Figure 7E) showed a similar gene expression profile than that of total igf-1, especially igf-1a with little effects of fasting and lowest expression levels at 1 day post-refeeding, recovering basal values after 7 days. Moreover, igf-1b and igf-1c showed a significant post-prandial dip at 2 h, maintaining still lower values at day 1, to return to basal levels at day 7.
Concerning liver Gh receptors, both were significantly down-regulated due to fasting (Figures 7B,C). However, different post-prandial responses were observed: ghr-1 stopped decreasing at 2 and 5 h, while ghr-2 expression continued to decline until 2 h, remaining low up to 1 day post-refeeding. The expression of both receptors was then up-regulated at day 7 in comparison to early post-prandial measurements. In the case of Igf-1 receptors, the only isoform detected in liver was igf-1rb (Figure 7F). Its expression was not affected by fasting but was significantly down-regulated at 2 h of refeeding, to then recover at 7 days initial expression levels.
The gene expression of four igfbps is shown in Figures 7G,H. igfbp1a and igfbp2a expression had similar stable patterns, except that igfbp1a showed a significant abrupt peak in expression 2 h post-refeeding, returning to basal levels at 5 h. The expression of igfbp4 and igfbp5b was detected for the first time in gilthead sea bream liver. Both presented a similar profile, but igfbp5b did not show significant changes while the response for igfbp-4 was more pronounced, with a significant decrease at 5 h and 24 h post-prandial compared to the onset of refeeding. Then, such low expression level was maintained after 1 day post-refeeding and basal levels were recovered after 7 days.
Discussion
Preproghrelin and Ghsrs Characterization
Since its discovery, the preproghrelin nucleotide and amino acid sequences have been described in many vertebrate species (36). In the present study, phylogenetic analysis of the gilthead sea bream translated sequence highlighted the conservation of the most characteristic features. In fact, Preproghrelin is considered a well-conserved protein, but with a perceptible evolution among classes and orders. The gilthead sea bream Preproghrelin resulted more closely related to other Sparidae species, flatfishes and European sea bass (Dicentrachus labrax), but more distant to salmonids, cypriniformes, siluriformes and chondrictyes.
The expression of preproghrelin was detected mainly in stomach and pyloric caeca, which agrees with previous studies in mammals and other fish species, establishing that the main source of Ghrelin is the stomach (3, 4, 6, 12, 13). Moreover, weak preproghrelin expression was detected in other tissues and organs as in different fish species (5, 6). One of the main targets of Ghrelin is the brain, where it is reported to act in appetite-regulating areas to induce (or decrease in some species) feed intake (19, 22). Thus, the detection of preproghrelin mRNA expression locally in the brain may also contribute to confirm the existing hypothesis that Ghrelin is synthetized both peripherally and centrally (22). In our screening, the low preproghrelin mRNA levels detected in the brain may be due to the fact that the whole brain was taken, instead of only the hypothalamus, which is supposed to be the main production site and target in the brain.
The gene expression screening of the two ghsrs showed that both are widely distributed among multiple tissues and organs, in line with previous research (16). The tissues with higher expression were pituitary, brain and liver, which support that these are the main targets of Ghrelin action in gilthead sea bream, as in many other vertebrate species (15, 37). Furthermore, as far as we know, this is the first time that it is observed that isoform a is more abundant in brain and pituitary, while isoform b is more abundant in liver. Such differential expression in these tissues could suggest that Gh secretion requires the presence of the truncated isoform to achieve better regulation, as suggested (15, 16).
Fasting and Refeeding Effects on Growth Performance and Ghrelin
Although gilthead sea bream tolerates long periods of food deprivation well (25, 38–40), the morphometric parameters reduction after 21 days of fasting confirmed that the fish had entered in a catabolic state, which was progressively reverted upon refeeding, as demonstrated by the recovery of the body indexes at the end of the experiment.
The existing literature reveals that the response of Ghrelin to fasting may be, especially in fish, species-specific. Thus, fasting has been reported to up-regulate, down-regulate or unchange the gastrointestinal tract and brain ghrelin mRNA levels in diverse fish species (7, 41–45). Such a variety of responses could indicate that other factors, such as sex and age of individuals (44), temperature (46), fasting duration (42) or diet (13) may also affect Ghrelin production. Interestingly, during the development of the present work, Babaei et al. (13) also reported a tissue-specific preproghrelin expression response to fasting in gilthead sea bream.
The different response observed to 21 days of fasting with Ghrelin plasma levels and preproghrelin mRNA levels in stomach, is consistent with previous fish studies (45, 47) and suggests that post-transcriptional mechanisms are in place. However, Ghrelin plasma levels were also high at 1 and 7 days post-refeeding probably due to the 24 h fast. In sea bass, a rise in preproghrelin expression was observed during the first days of fasting, to then decrease progressively to fed control values after 21 days of fasting (48). In grass carp, a peak of intestinal ghrelin expression was described after 7 days of fasting (49). In goldfish, Unniappan et al. (42) found that fasting for 3 and 5 days significantly increased Ghrelin plasma levels, while in gut or hypothalamus preproghrelin expression did not increase until after 7 days of fasting. Moreover, in Atlantic salmon, Ghrelin levels were significantly increased after 2, but not 14 days of fasting (50). Together, these observations support the idea that in diverse fish species, the response increasing Ghrelin plasma levels occurs mainly during the early stage of fasting and is not always related to changes in gut gene expression.
Besides, with refeeding Ghrelin plasma levels that were still high at 2 h, were followed by a significant decrease at 5 h, suggesting an inhibitory effect on Ghrelin secretion as food enters the stomach. These decrease in Ghrelin coincided with the beginning of circulating Gh decline, suggesting the relationship between these two hormones. A similar decrease was also observed at 1 h post-prandial in tilapia (51), and in refed striped bass (52). Moreover, such reduced plasma levels coincided with the peak in stomach preproghrelin mRNA levels, whereas the minimum expression 1 day after refeeding corresponded with the recovery of Ghrelin plasma levels, indicating an inverse relationship between the regulation of the gene expression and the circulating hormone. Thus, it appears that during this specific postprandial stage (2, 5, and 24 h) preproghrelin gene expression could be regulated by Ghrelin plasma levels.
Unniappan et al. (42) also observed that in goldfish, preproghrelin mRNA levels (in gut and hypothalamus) and Ghrelin plasma levels were sensitive to feeding when analyzed periprandially. At 3 h pre-meal, Ghrelin plasma and mRNA levels were high, and 1 and 3 h after feed intake were down-regulated in both tissues. Similar results were observed by Hatef et al. (53) in zebrafish, in which preproghrelin mRNA levels in brain and gut were down-regulated 3 h post-meal and increased in fasted fish. These studies are in accordance with the observed decrease in plasma Ghrelin and brain preproghrelin mRNA at 5 h post-feeding in the present experiment, indicating that Ghrelin may be mainly regulated by feed intake also in gilthead sea bream.
Fasting and Refeeding Effects on Ghsrs
The ghsrs responded differentially to refeeding in brain and pituitary. The expression in brain remained constant, while in the pituitary decreased progressively up to 5 h to recover at 1 or 7 days of refeeding the expression of ghsr1a, and to a lesser extent of ghsr1b. In rats, brain and pituitary ghsrs were up-regulated in fasting and decreased after refeeding (15, 54, 55). However, the function of Ghsrs in fish and other non-mammalian vertebrates is still not fully understood. Thus, although Ghsrs have crucial roles in the ghrelinergic system and their expression is finely regulated by nutritional condition, hormonal status and environmental factors, their response is highly variable depending on the species especially in fish, in which a higher number of Ghsrs isoforms has been described (19).
Peddu et al. (51) did not find in Mozambique tilapia brain a clear response to fasting in ghsrs expression, but at feeding time (just before food administration) both receptors were up-regulated to decrease at 1 and 3 h post-feeding. In the same species, a significant change was not observed in brain ghsr1a expression between 1 and 7 days of fasting, while ghsr1b increased after 3 but not 5 fasting days (56). In Atlantic salmon, a fasting period of 2 or 14 days did not change ghsr1a brain expression (50), neither it did 15 days of fasting in zebrafish ghsrs (57). Contrarily, Kaiya et al. (58) found that 7 days of fasting induced a decrease in the expression of ghsr1a in the vagal lobe of goldfish. Thus, although species differences exist it seems that there is regulation of ghsrs depending on the alimentary condition.
Ghrelin receptors in fish pituitary have been poorly investigated, but low basal expression levels have been found in tilapia (56), goldfish (59, 60) or yellow catfish (61). In the case of grass carp, 14, 21, and 28 days of fasting resulted in increased pituitary gene expression of ghsr1a that correlated with increased plasma Gh and preproghrelin pituitary gene expression (62). Moreover, these authors found that Ghrelin administration provoked an increase in pituitary ghsr1a expression. In the present study, the decrease in ghsrs expression during the post-prandial stage was noticeable and related with circulating Ghrelin, pointing to a slowdown of the system during food intake. To summarize, Ghrelin receptors expression in the brain do not show a uniform regulation among fish species and seem to be less influenced by the nutritional condition in comparison to mammals. Furthermore, less is known about pituitary Ghsrs dynamics during fasting in fish, but in gilthead sea bream, both isoforms present a similar response that parallels Ghrelin plasma levels.
Fasting and Refeeding Effects on the Gh/Igf Axis
The rise of circulating Gh during fasting was parallel to gh mRNA levels in the pituitary, being significantly high at 5 h post-feeding. The expression of gh remained high until 1 day of refeeding, and similarly to plasma Gh, returned to basal values after 7 days, thus indicating the important and extended effect of fasting in this hormone. This response of Gh to fasting and refeeding has been observed in previous studies in various fish species, such as Chinese perch (Siniperca chuatsi), tilapia and black sea bream (Spondyliosoma cantharus) (63–65). Plasma Igf-1 also responded to nutritional state, presenting an inverse pattern to that of Gh, decreasing with fasting and slowly increasing with refeeding. Liver total igf-1 gene expression as well as its splice variants partially recovered after 7 days of refeeding. These results are in line with previous works (63, 66). The inverse correlation between Gh and Igf-1 plasma levels during fasting was pointed out in gilthead sea bream previously (38, 67, 68), and has been described in several other fish species (e.g., coho salmon, chinook salmon, channel catfish, Nile tilapia or gilthead sea bream) in diverse conditions (26, 47, 66, 69–71). Moreover, the results support that the circulating Gh/Igf-1 ratio is a good indicator of metabolic state in gilthead sea bream and that it is clearly affected by feeding condition (67, 72). Picha et al. (52) suggested that during fasting in striped bass, high Ghrelin levels contribute to counteract the negative feedback normally exerted by Igf-1 on Gh release, in order to maintain Gh secretion.
The gene expression of ghrs in the liver also reflected the nutritional status. The dramatic down-regulation of both ghr-1 and ghr-2 expression, along with increased Gh plasma levels, suggests a Gh liver desensitization during the fasting period (23). After refeeding, a rapid increase in the mRNA levels of ghr-1, the isoform mostly related with anabolic processes in this species was observed, and later in the expression of ghr-2, indicating that ingested nutrients may have initiated growth promotion (23). Furthermore, liver igf-1rb showed a similar tendency to that of ghrs after refeeding and its abrupt post-prandial expression drop at 2 h was not recovered until the end of the trial. It is interesting that this response is parallel to igf-1b and c hepatic gene expression. Down-regulation of liver igf-1rb expression was also observed in gilthead sea bream during exercise (26), but as far as we know, this is the first time that this effect is found in refed fish.
The expression of igfbps was stable during fasting while 7 days of refeeding recovered their basal values. Nevertheless, igfbp-4 presented the highest expression after 21 fasting days in agreement with its Igf-1 conservative function, while the increase of igfbp-1a at 2 h post-feeding fitted well with its recognized role in mobilization conditions in this species. Similarly, in a fasting and refeeding experiment in rainbow trout, Gabillard et al. (73) observed different responses for igfbps. Hevrøy et al. (50) described the effects of fasting on Ghrelin and Gh/Igf-1 system in Atlantic salmon, in which Igfbp-1 seemed to be a marker of catabolic state. Breves et al. (63) demonstrated different roles of Igfbps during fasting, and indicated that Igfbp-1b may operate to reduce Igf-1 signaling during fasting in tilapia. The functional relationship between Gh, Igf-1 and Ghrelin during fasting in fish needs to be further investigated.
To summarize, the full preproghrelin, ghsr1a and ghsr1b nucleotide sequences and their response during fasting/refeeding have been described for the first time in gilthead sea bream. Both, long term (21 days) and short term (24 h) fasting increased circulating Ghrelin, which showed the lowest values few hours post-prandial. The plasma Ghrelin dip was also reflected by pituitary ghsrs, suggesting that Ghrelin's stimulatory action on Gh secretion is modulated by feeding. Plasma Gh levels were elevated in parallel with its pituitary gene expression returning to basal levels after 7 days of refeeding, although at this time circulating Ghrelin was again increased. Taken together, the data suggest that Ghrelin can be a regulator of Gh secretion in gilthead sea bream, but the metabolic state itself and other regulatory molecules may exert important effects. Finally, this study indicates that in gilthead sea bream, Ghrelin secretion is mainly related to the progress of the digestive process, showing a down-regulation in the post-prandial period to rise again just before feeding.
Author Contributions
MP-A, EV, and JG conceived and designed the experiments; MP-A, EV, JV-A, AS-M, NR-H, JF-B, JB, IN, EC, and JG performed the experiments; MP-A, EV, JV-A, AS-M, NR-H, IH, JF-B, JB, JC-G, IN, EC, EJ, JP-S, and JG analyzed the data and interpreted the results; JF-B, JB, IN, EC, EJ, JP-S, and JG contributed reagents, materials, analysis tools; MP-A, EV, JV-A, AS-M, NR-H, IH, JF-B, JB, JC-G, IN, EC, EJ, JP-S, and JG wrote and revised the paper.
Data Availability Statement
The three sequences obtained in the present study are deposited in GenBank (NCBI) under accession numbers: MG570187 for preproghrelin; MG570188 for ghsr1a, and MG570189 for ghsr1b. All relevant data is contained within the manuscript.
Conflict of Interest Statement
The authors declare that the research was conducted in the absence of any commercial or financial relationships that could be construed as a potential conflict of interest.
Acknowledgments
The authors thank the personnel from the animal facilities at the School of Biology for the fish maintenance and to Piscimar for providing the fish. We also thank Prof. Jordi Garcia for his help on sequence analysis and primer design of Ghsrs. MP-A, EV, and NR-H are supported by predoctoral fellowships from the Ministerio de Economía y Competitividad (MINECO) BES-2016-078697, BES-2013-062949 and BES-2015-074654, respectively. This study was supported by the projects from the MINECO AGL2014-57974-R to IN and EC. and AGL2015-70679-R to JG, and the Xarxa de Referència d'R+D+I en Aqüicultura and the 2014SGR-01371 from the Generalitat de Catalunya.
Supplementary Material
The Supplementary Material for this article can be found online at: https://www.frontiersin.org/articles/10.3389/fendo.2018.00399/full#supplementary-material
References
1. Kojima M, Ida T, Sato T. Structure of mammalian and nonmammalian ghrelins. Vitam Horm. (2007) 77:31–46. doi: 10.1016/S0083-6729(06)77003-0
2. Müller TD, Nogueiras R, Andermann ML, Andrews ZB, Anker SD, Argente J, et al. Ghrelin. Mol Metab. (2015) 4:437–60. doi: 10.1016/j.molmet.2015.03.005
3. Unniappan S, Lin X, Cervini L, Rivier J, Kaiya H, Kangawa K, et al. Goldfish ghrelin: molecular characterization of the complementary deoxyribonucleic acid, partial gene structure and evidence for its stimulatory role in food intake. Endocrinology (2002) 143:4143–6. doi: 10.1210/en.2002-220644
4. Kaiya H, Miyazato M, Kangawa K, Peter RE, Unniappan S. Ghrelin: a multifunctional hormone in non-mammalian vertebrates. Comp Biochem Physiol A Mol Integr Physiol. (2008) 149:109–28. doi: 10.1016/j.cbpa.2007.12.004
5. Kaiya H, Kojima M, Hosoda H, Riley LG, Hirano T, Grau EG, et al. Amidated fish ghrelin: purification, cDNA cloning in the Japanese eel and its biological activity. J Endocrinol. (2003) 176:415–23. doi: 10.1677/joe.0.1760415
6. Kaiya H, Kojima M, Hosoda H, Moriyama S, Takahashi A, Kawauchi H, et al. Peptide purification, complementary deoxyribonucleic acid (DNA) and genomic DNA cloning, and functional characterization of ghrelin in rainbow trout. Endocrinology (2003) 144:5215–26. doi: 10.1210/en.2003-1085
7. Jönsson E, Forsman A, Einarsdottir IE, Kaiya H, Ruohonen K, Björnsson BT. Plasma ghrelin levels in rainbow trout in response to fasting, feeding and food composition, and effects of ghrelin on voluntary food intake. Comp Biochem Physiol A Mol Integr Physiol. (2007) 147:1116–24. doi: 10.1016/j.cbpa.2007.03.024
8. Jönsson E, Kaiya H, Björnsson BT. Ghrelin decreases food intake in juvenile rainbow trout (Oncorhynchus mykiss) through the central anorexigenic corticotropin-releasing factor system. Gen Comp Endocrinol. (2010) 166:39–46. doi: 10.1016/j.ygcen.2009.11.001
9. Tinoco AB, Näslund J, Delgado MJ, de Pedro N, Johnsson JI, Jönsson E. Ghrelin increases food intake, swimming activity and growth in juvenile brown trout (Salmo trutta). Physiol Behav. (2014) 124:15–22. doi: 10.1016/j.physbeh.2013.10.034
10. Salmerón C, Navarro I, Johnston IA, Gutiérrez J, Capilla E. Characterisation and expression analysis of cathepsins and ubiquitin-proteasome genes in gilthead sea bream (Sparus aurata) skeletal muscle. BMC Res Notes (2015) 8:149. doi: 10.1186/s13104-015-1121-0
11. Blanco AM, Gómez-Boronat M, Redondo I, Valenciano AI, Delgado MJ. Periprandial changes and effects of short- and long-term fasting on ghrelin, GOAT, and ghrelin receptors in goldfish (Carassius auratus). J Comp Physiol B Biochem Syst Environ Physiol. (2016) 186:727–38. doi: 10.1007/s00360-016-0986-0
12. Breves JP, Veillette PA, Specker JL. Ghrelin in the summer flounder: immunolocalization to the gastric glands and action on plasma cortisol levels. Comp Biochem Physiol A Mol Integr Physiol. (2009) 152:268–72. doi: 10.1016/j.cbpa.2008.10.020
13. Babaei S, Sáez A, Caballero-Solares A, Fernández F, Baanante IV, Metón I. Effect of dietary macronutrients on the expression of cholecystokinin, leptin, ghrelin and neuropeptide Y in gilthead sea bream (Sparus aurata). Gen Comp Endocrinol. (2017) 240:121–8. doi: 10.1016/j.ygcen.2016.10.003
14. Howard AD, Feighner SD, Cully DF, Arena JP, Liberator PA, Rosenblum CI, et al. A receptor in pituitary and hypothalamus that functions in growth hormone release. Science (1996) 273:974–977. doi: 10.1126/science.273.5277.974
15. Kaiya H, Kangawa K, Miyazato M. Molecular evolution of GPCRs: ghrelin/ghrelin receptors. J Mol Endocrinol. (2013) 52:T87–100. doi: 10.1530/JME-13-0175
16. Kaiya H, Kangawa K, Miyazato M. Ghrelin receptors in non-mammalian vertebrates. Front Endocrinol (Lausanne) (2013) 4:81. doi: 10.3389/fendo.2013.00081
17. Kojima M, Hosoda H, Date Y. Ghrelin is a growth-hormone- releasing acylated peptide from stomach. Nature (1999) 402:656–60.
18. Reindl KM, Sheridan MA. Peripheral regulation of the growth hormone-insulin-like growth factor system in fish and other vertebrates. Comp Biochem Physiol A Mol Integr Physiol. (2012) 163:231–45. doi: 10.1016/j.cbpa.2012.08.003
19. Kaiya H, Kangawa K, Miyazato M. What is the general action of ghrelin for vertebrates? – Comparisons of ghrelin's effects across vertebrates. Gen Comp Endocrinol. (2013) 181:187–91. doi: 10.1016/j.ygcen.2012.10.015
20. Delgado MJ, Cerdá-Reverter JM, Soengas JL. Hypothalamic integration of metabolic, endocrine, and circadian signals in fish: involvement in the control of food intake. Front Neurosci. (2017) 11:354. doi: 10.3389/fnins.2017.00354
21. Khatib N, Gaidhane S, Gaidhane AM, Simkhada P, Gode D, Zahiruddin QS. Ghrelin: ghrelin as a regulatory peptide in growth hormone secretion. J Clin Diagnostic Res. (2014) 8:13–17. doi: 10.7860/JCDR/2014/9863.4767
22. Edwards A, Abizaid A. Clarifying the ghrelin system's ability to regulate feeding behaviours despite enigmatic spatial separation of the GHSR and its endogenous ligand. Int J Mol Sci. (2017) 18:E859. doi: 10.3390/ijms18040859
23. Won ET, Borski RJ. Endocrine regulation of compensatory growth in fish. Front Endocrinol. (Lausanne) (2013) 4:74. doi: 10.3389/fendo.2013.00074
24. Yeung CM, Chan CB, Woo NYS, Cheng CHK. Seabream ghrelin: cDNA cloning, genomic organization and promoter studies. J Endocrinol. (2006) 189:365–79. doi: 10.1677/joe.1.06593
25. Montserrat N, Gómez-Requeni P, Bellini G, Capilla E, Pérez-Sánchez J, Navarro I, et al. Distinct role of insulin and IGF-I and its receptors in white skeletal muscle during the compensatory growth of gilthead sea bream (Sparus aurata). Aquaculture (2007) 267:188–98. doi: 10.1016/j.aquaculture.2007.04.024
26. Vélez EJ, Azizi S, Millán-Cubillo A, Fernández-Borràs J, Blasco J, Chan SJ, et al. Effects of sustained exercise on GH-IGFs axis in gilthead sea bream ( Sparus aurata ). Am J Physiol Regul Integr Comp Physiol. (2016) 310:R313–22. doi: 10.1152/ajpregu.00230.2015
27. Untergasser A, Nijveen H, Rao X, Bisseling T, Geurts R, Leunissen JAM. Primer3Plus, an enhanced web interface to Primer3. Nucleic Acids Res. (2007) 35:71–4. doi: 10.1093/nar/gkm306
28. Vélez EJ, Azizi S, Salmerón C, Chan SJ, Nematollahi MA, Amiri BM, et al. Characterization data of gilthead sea bream (Sparus aurata) IGF-I receptors (IGF-IRa/Rb). Data Br. (2016) 6:507–13. doi: 10.1016/j.dib.2015.12.046
29. Calduch-Giner JA, Bermejo-Nogales A, Benedito-Palos L, Estensoro I, Ballester-Lozano G, Sitjà-Bobadilla A, et al. Deep sequencing for de novo construction of a marine fish (Sparus aurata) transcriptome database with a large coverage of protein-coding transcripts. BMC Genomics (2013) 14:178. doi: 10.1186/1471-2164-14-178
30. Hosoda H, Kojima M, Matsuo H, Kangawa K. Ghrelin and Des-acyl Ghrelin: two major forms of rat ghrelin peptide in gastrointestinal tissue. Biochem Biophys Res Commun. (2000) 279:909–13. doi: 10.1006/bbrc.2000.4039
31. Martínez-Barberá JP, Pendón C, Martí-Palanca H, Calduch-Giner JA, Rodríguez RB, Valdivia MM, et al. The use of recombinant gilthead sea bream (Sparus aurata) growth hormone for radioiodination and standard preparation in radioimmunoassay. Comp Biochem Physiol A Physiol. (1995) 110:335–40. doi: 10.1016/0300-9629(94)00178-V
32. Vega-Rubín De Celis S, Rojas P, Gómez-Requeni P, Albalat A, Gutiérrez J, Médale F, et al. Nutritional assessment of somatolactin function in gilthead sea bream (Sparus aurata): concurrent changes in somatotropic axis and pancreatic hormones. Comp Biochem Physiol A Mol Integr Physiol. (2004) 138:533–42. doi: 10.1016/j.cbpb.2004.06.007
33. Bustin SA, Benes V, Garson JA, Hellemans J, Huggett J, Kubista M, et al. The MIQE guidelines: minimum information for publication of quantitative Real-Time PCR experiments. Clin Chem. (2009) 55:611–22. doi: 10.1373/clinchem.2008.112797
34. Pfaffl MW. A new mathematical model for relative quantification in real-time RT-PCR. Nucleic Acids Res. (2001) 29:45e–45. doi: 10.1093/nar/29.9.e45
35. Chan CB, Cheng CHK. Identification and functional characterization of two alternatively spliced growth hormone secretagogue receptor transcripts from the pituitary of black seabream Acanthopagrus schlegeli. Mol Cell Endocrinol. (2004) 214:81–95. doi: 10.1016/j.mce.2003.11.020
36. Kaiya H, Miyazato M, Kangawa K. Recent advances in the phylogenetic study of ghrelin. Peptides (2011) 32:2155–74. doi: 10.1016/j.peptides.2011.04.027
37. Jönsson E. The role of ghrelin in energy balance regulation in fish. Gen Comp Endocrinol. (2013) 187:79–85. doi: 10.1016/j.ygcen.2013.03.013
38. Company R, Astola A, Pendón C, Valdivia MM, Pérez-Sánchez J. Somatotropic regulation of fish growth and adiposity: growth hormone and somatolactin relationship. Comp Biochem Physiol C130 (2001) 435–45. doi: 10.1016/S1532-0456(01)00269-1
39. Salmerón C, Johansson M, Angotzi AR, Rønnestad I, Jönsson E, Björnsson BT, et al. Effects of nutritional status on plasma leptin levels and in vitro regulation of adipocyte leptin expression and secretion in rainbow trout. Gen Comp Endocrinol. (2015) 210:114–23. doi: 10.1016/j.ygcen.2014.10.016
40. Salmerón C, García de la serrana D, Jiménez-Amilburu V, Fontanillas R, Navarro I, Johnston IA, et al. Characterisation and expression of calpain family members in relation to nutritional status, diet composition and flesh texture in gilthead sea bream (Sparus aurata). PLoS ONE (2013) 8:e75349. doi: 10.1371/journal.pone.0075349
41. Murashita K, Kurokawa T, Nilsen TO, Rønnestad I. Ghrelin, cholecystokinin, and peptide YY in Atlantic salmon (Salmo salar): molecular cloning and tissue expression. Gen Comp Endocrinol. (2009) 160:223–235. doi: 10.1016/j.ygcen.2008.11.024
42. Unniappan S, Canosa LF, Peter RE. Orexigenic actions of ghrelin in goldfish: feeding-induced changes in brain and gut mRNA expression and serum levels, and responses to central and peripheral injections. Neuroendocrinology (2004) 79:100–8. doi: 10.1159/000076634
43. Volkoff H. Cloning, tissue distribution and effects of fasting on mRNA expression levels of leptin and ghrelin in red-bellied piranha (Pygocentrus nattereri). Gen Comp Endocrinol. (2015) 217–8:20–27. doi: 10.1016/j.ygcen.2015.05.004
44. Parhar IS, Sato H, Sakuma Y. Ghrelin gene in cichlid fish is modulated by sex and development. Biochem Biophys Res Commun. (2003) 305:169–75. doi: 10.1016/S0006-291X(03)00729-0
45. Xu M, Volkoff H. Molecular characterization of ghrelin and gastrin-releasing peptide in Atlantic cod (Gadus morhua): cloning, localization, developmental profile and role in food intake regulation. Gen Comp Endocrinol. (2009) 160:250–8. doi: 10.1016/j.ygcen.2008.12.004
46. Nieminen P, Mustonen AM, Hyvärinen H. Fasting reduces plasma leptin- and ghrelin-immunoreactive peptide concentrations of the burbot (Lota lota) at 2°C but not at 10°C. Zoolog Sci. (2003) 20:1109–15. doi: 10.2108/zsj.20.1109
47. Fox BK, Breves JP, Hirano T, Grau EG. Effects of short- and long-term fasting on plasma and stomach ghrelin, and the growth hormone/insulin-like growth factor I axis in the tilapia, Oreochromis mossambicus. Domest Anim Endocrinol. (2009) 37:1–11. doi: 10.1016/j.domaniend.2009.01.001
48. Terova G, Rimoldi S, Bernardini G, Gornati R, Saroglia M. Sea bass ghrelin: molecular cloning and mRNA quantification during fasting and refeeding. Gen Comp Endocrinol. (2008) 155:341–51. doi: 10.1016/j.ygcen.2007.05.028
49. Feng KE, Zhang GR, Wei KJ, Xiong BX. Molecular cloning, tissue distribution, and ontogenetic expression of ghrelin and regulation of expression by fasting and refeeding in the grass carp (Ctenopharyngodon idellus). J Exp Zool Part A Ecol Genet Physiol. (2013) 319:202–12. doi: 10.1002/jez.1784
50. Hevrøy EM, Azpeleta C, Shimizu M, Lanzén A, Kaiya H, Espe M, et al. Effects of short-term starvation on ghrelin, GH-IGF system, and IGF-binding proteins in Atlantic salmon. Fish Physiol Biochem. (2011) 37:217–32. doi: 10.1007/s10695-010-9434-3
51. Peddu SC, Breves JP, Kaiya H, Gordon Grau E, Riley LG. Pre- and postprandial effects on ghrelin signaling in the brain and on the GH/IGF-I axis in the Mozambique tilapia (Oreochromis mossambicus). Gen Comp Endocrinol. (2009) 161:412–8. doi: 10.1016/j.ygcen.2009.02.008
52. Picha ME, Strom CN, Riley LG, Walker AA, Won ET, Johnstone WM, et al. Plasma ghrelin and growth hormone regulation in response to metabolic state in hybrid striped bass: effects of feeding, ghrelin and insulin-like growth factor-I on in vivo and in vitro GH secretion. Gen Comp Endocrinol. (2009) 161:365–72. doi: 10.1016/j.ygcen.2009.01.026
53. Hatef A, Yufa R, Unniappan S. Ghrelin O-Acyl Transferase in zebrafish is an evolutionarily conserved peptide upregulated during calorie restriction. Zebrafish (2015) 12:327–38. doi: 10.1089/zeb.2014.1062
54. Kim MS, Yoon CY, Park KH, Shin CS, Park KS, Kim SY, et al. Changes in ghrelin and ghrelin receptor expression according to feeding status. Neuroreport (2003) 14:1317–20. doi: 10.1097/00001756-200307180-00006
55. Nogueiras R, Tovar S, Mitchell SE, Rayner DV, Archer ZA, Dieguez C, et al. Regulation of growth hormone secretagogue receptor gene expression in the arcuate nuclei of the rat by leptin and ghrelin. Diabetes (2004) 53:2552–2558. doi: 10.2337/diabetes.53.10.2552
56. Riley LG, Fox BK, Breves JP, Kaiya H, Dorough CP, Hirano T, et al. Absence of effects of short-term fasting on plasma ghrelin and brain expression of ghrelin receptors in the tilapia, Oreochromis mossambicus. Zoolog Sci. (2008) 25:821–7. doi: 10.2108/zsj.25.821
57. Eom J, Hong A, Kang YH, Yoo HJ, Chang EJ, Kang SW, et al. Molecular cloning, regulation, and functional analysis of two GHS-R genes in zebrafish. Exp Cell Res. (2014) 326:10–21. doi: 10.1016/j.yexcr.2014.06.002
58. Kaiya H, Miura T, Matsuda K, Miyazato M, Kangawa K. Two functional growth hormone secretagogue receptor (ghrelin receptor) type 1a and 2a in goldfish, Carassius auratus. Mol Cell Endocrinol. (2010) 327:25–39. doi: 10.1016/j.mce.2010.06.004
59. Sánchez-Bretaño A, Blanco AM, Unniappan S, Kah O, Gueguen MM, Bertucci JI, et al. In situ localization and rhythmic expression of ghrelin and ghs-r1 ghrelin eceptor in the brain and gastrointestinal tract of goldfish (Carassius auratus). PLoS ONE (2015) 10:1–13. doi: 10.1371/journal.pone.0141043
60. Bertucci JI, Blanco AM, Canosa LF, Unniappan S. Estradiol and testosterone modulate the tissue-specific expression of ghrelin, ghs-r, goat and nucb2 in goldfish. Gen Comp Endocrinol. (2016) 228:17–23. doi: 10.1016/j.ygcen.2016.01.006
61. Zhang J, Ma W, He Y, Wu J, Dawar FU, Ren F, et al. Sex biased expression of ghrelin and GHSR associated with sexual size dimorphism in yellow catfish. Gene (2016) 578:169–76. doi: 10.1016/j.gene.2015.12.017
62. Cai W, Yuan X, Yuan Y, Xie S, Gong Y, Su H, et al. Sequence, genomic organization and expression of ghrelin receptor in grass carp, Ctenopharyngodon idellus. Comp Biochem Physiol Part A Mol Integr Physiol. (2015) 179:54–61. doi: 10.1016/j.cbpa.2014.09.009
63. Breves JP, Tipsmark CK, Stough BA, Seale AP, Flack BR, Moorman BP, et al. Nutritional status and growth hormone regulate insulin-like growth factor binding protein (igfbp) transcripts in Mozambique tilapia. Gen Comp Endocrinol. (2014) 207:66–73. doi: 10.1016/j.ygcen.2014.04.034
64. Lu X, Gu Y, Hou X, Wang H, Wang P, Xu P, et al. Molecular characterization, tissue distribution, and expression regulation from fasting and re-feeding of two growth hormone receptors in mandarin fish Siniperca chuatsi. Fish Sci. (2016) 82:155–69. doi: 10.1007/s12562-015-0941-0
65. Deng L, Zhang WM, Lin HR, Cheng CHK. Effects of food deprivation on expression of growth hormone receptor and proximate composition in liver of black seabream Acanthopagrus schlegeli. Comp Biochem Physiol B Biochem Mol Biol. (2004) 137:421–32. doi: 10.1016/j.cbpc.2004.01.008
66. Pierce AL, Shimizu M, Beckman BR, Baker DM, Dickhoff WW. Time course of the GH/IGF axis response to fasting and increased ration in chinook salmon (Oncorhynchus tshawytscha). Gen Comp Endocrinol. (2005) 140:192–202. doi: 10.1016/j.ygcen.2004.10.017
67. Pérez-Sánchez J. The involvement of growth hormone in growth regulation, energy homeostasis and immune function in the gilthead sea bream (Sparus aurata): a short review. Fish Physiol Biochem (2000) 22:135. doi: 10.1023/A:1007816015345
68. Mingarro M, Vega-RubínDe Celis S, Astola A, Pendón C, Valdivia MM, Pérez-Sánchez J. Endocrine mediators of seasonal growth in gilthead sea bream (Sparus aurata): the growth hormone and somatolactin paradigm. Gen Comp Endocrinol (2002) 128:102–11. doi: 10.1016/S0016-6480(02)00042-4
69. Duan C, Plisetskaya EM. Nutritional regulation of insulin-like growth factor-I mRNA expression in salmon tissues. J Endocrinol. (1993) 139:243–252.
70. Small BC, Peterson BC. Establishment of a time-resolved fluoroimmunoassay for measuring plasma insulin-like growth factor I (IGF-I) in fish: effect of fasting on plasma concentrations and tissue mRNA expression of IGF-I and growth hormone (GH) in channel catfish (Ictalurus punctatus). Domest Anim Endocrinol. (2005) 28:202–15. doi: 10.1016/j.domaniend.2004.09.002
71. Blasco J, Moya A, Millán-Cubillo A, Vélez EJ, Capilla E, Pérez-Sánchez J, et al. Growth-promoting effects of sustained swimming in fingerlings of gilthead sea bream (Sparus aurata L.). J Comp Physiol B Biochem Syst Environ Physiol. (2015) 185:859–68. doi: 10.1007/s00360-015-0933-5
72. Pérez-Sánchez J, Le Bail PY. Growth hormone axis as marker of nutritional status and growth performance in fish. Aquaculture (1999) 177:117–28. doi: 10.1016/S0044-8486(99)00073-3
Keywords: ghrelin, GHSR1a, growth hormone, IGF-1, fasting and refeeding
Citation: Perelló-Amorós M, Vélez EJ, Vela-Albesa J, Sánchez-Moya A, Riera-Heredia N, Hedén I, Fernández-Borràs J, Blasco J, Calduch-Giner JA, Navarro I, Capilla E, Jönsson E, Pérez-Sánchez J and Gutiérrez J (2018) Ghrelin and Its Receptors in Gilthead Sea Bream: Nutritional Regulation. Front. Endocrinol. 9:399. doi: 10.3389/fendo.2018.00399
Received: 19 April 2018; Accepted: 27 June 2018;
Published: 30 July 2018.
Edited by:
Suraj Unniappan, University of Saskatchewan, CanadaReviewed by:
Ayelén Melisa Blanco, University of Vigo, SpainHiroyuki Kaiya, National Cerebral and Cardiovascular Center, Japan
Copyright © 2018 Perelló-Amorós, Vélez, Vela-Albesa, Sánchez-Moya, Riera-Heredia, Hedén, Fernández-Borràs, Blasco, Calduch-Giner, Navarro, Capilla, Jönsson, Pérez-Sánchez and Gutiérrez. This is an open-access article distributed under the terms of the Creative Commons Attribution License (CC BY). The use, distribution or reproduction in other forums is permitted, provided the original author(s) and the copyright owner(s) are credited and that the original publication in this journal is cited, in accordance with accepted academic practice. No use, distribution or reproduction is permitted which does not comply with these terms.
*Correspondence: Joaquim Gutiérrez, jgutierrez@ub.edu