 Huiwen Ren
 Xiaoyu Ma
 Ying Shao
 Jinyu Han
 Min Yang
 Qiuyue Wang
- 1Department of Endocrinology, The First Hospital Affiliated of China Medical University, Shenyang, China
- 2The Cadre Department, The First Hospital of China Medical University, Shenyang, China
- 3Department of Endocrinology, The Second Hospital Affiliated of China Medical University, Shenyang, China
- 4Department of Laboratory Medicine, The First Hospital Affiliated of China Medical University, Shenyang, China
Purpose: To investigate the serum levels of miR-154-5p, osteocalcin (OC), and other clinical parameters in male and post-menopausal female type 2 diabetes mellitus (T2DM) patients with different urinary albumin creatinine ratio (UACR) levels and to discuss the relationship between miR-154-5p and glycolipid metabolism, bone metabolism, and different urinary albumin excretion rate in T2DM.
Methods: Seven hundred thirty-eight T2DM patients were categorized into six groups, including 374 men and 364 post-menopausal women who were sub-divided into three groups based on albumin excretion that involved normal albuminuria, microalbuminuria, and large amount of albuminuria (138, 127, 109, 135, 125, and 104 cases, UACR<30, 30–300, and >300 mg/g, M1, M2, M3, F1, F2, and F3). Measurement of circulating miR-154-5p, OC, and other biochemical indicators were performed by real-time PCR, ELISA, and chemiluminescence assays in T2DM patients and in 141 M0 and 139 F0 control subjects.
Results: There are few differences appeared between groups. Comparing with men, women had higher age, waist-to-hip ratio (WHR), adiponectin (ADPN), connective tissue growth factor (CTGF), UACR, procollagen type 1 N-terminal propeptide (P1NP), β-C-terminal telopeptide of type I collagen (β-CTx), OC, and miR-154-5p, but lower FPG, HOMA-IR, and HbA1c. T2DM patients with albuminuria (micro or macro) had lower bone turnover markers (P1NP, β-CTx, and OC) and adiponectin, but higher HbA1c, CTGF, and miR-154-5p. In addition, after regression analysis, UACR was positively correlated with CTGF, HbA1c, and miR-154-5p, and negatively correlated with ADPN and bone turnover markers (P1NP, β-CTx, and OC). However, OC showed a positive correlation with ADPN and other bone turnover markers (P1NP and β-CTx), but negative correlation with CTGF, UACR, and miR-154-5p in all three groups.
Conclusion: These findings suggested that increased serum levels of miR-154-5p and decreased OC levels may influence osteogenesis and proteinuria in T2DM and may identify novel targets for diagnosis and treatment of diabetic kidney disease and osteoporosis.
Highlights
- Serum miR-154-5p was elevated in post-menopausal female T2DM patients and increased successively with UACR.
- Serum miR-154-5p was found to positively correlate with UACR and negatively correlate with OC.
- OC and UACR were associated with glycolipid metabolism, bone metabolism, and urinary albumin.
Introduction
Type 2 diabetes mellitus (T2DM), recognized as a global epidemic by the World Health Organization, is a long-term metabolic disorder characterized by high blood glucose, insulin resistance, and relative lack of insulin. One of the chronic complications of T2DM is diabetic kidney disease (DKD) that causes glomerular fibrosis, persistent proteinuria, and eventually, end-stage renal disease (ESRD) (1, 2). Another chronic complication of T2DM is diabetic osteoporosis (DOP). Clinical evidences indicate that the risk of low bone mass, osteoporosis, and fracture increases in T2DM, especially in elder men and post-menopausal women (3–7). The pathogenesis of these diseases has not been fully elucidated and is considered related to renal dysfunction and abnormal bone metabolism caused by glucolipid metabolism-related disorders (1–7).
The balance between osteoblasts and osteoclasts activities determines bone mass and osteocytes orchestrate these communications in reaction to endocrine and mechanical stimuli. Osteocalcin (OC), procollagen type 1 N-terminal propeptide (P1NP), and alkaline phosphatase (ALP) are the markers of bone formation, while β-C-terminal telopeptide of type I collagen (β-CTx) is the characteristic biochemical indicator of bone resorption. Moreover, 25(OH) Vitamin D3 [25(OH) VD3] and parathyroid hormone (PTH) promote absorption of calcium and phosphorus and increase blood calcium (Ca) and phosphorus (P) concentration thereby promoting bone calcification (8, 9). Previous studies have reported that these bone metabolic indicators may be involved in the crosstalk between bone, islet, and adipose tissues (8, 10–13) and may be associated with early renal damage in DKD (14, 15). However, these findings remain controversial and inconclusive.
MiR-154, a recently discovered microRNA with anti-cancer effects, is involved in pathophysiology of various disorders (16–20). It has been reported that miR-154-5p, a mature serum sequence of miR-154 (21–23), regulates osteogenic and differentiation of mesenchymal stem cells derived from adipose (24) and may be involved in renal fibrosis (25–27). These data suggest a potential association between miR-154-5p and pathology of osteogenic differentiation and urinary protein increasing in chronic kidney diseases.
We investigated the relationship between serum levels of miR-154-5p and other clinical parameters such as glucolipid metabolism and bone metabolism in male and post-menopausal female T2DM patients with different UACR levels.
Materials and Methods
Subjects
We conducted a cross-sectional cohort study of 738 T2DM patients initially diagnosed and treated at the Department of Endocrinology of the First Hospital Affiliated of China Medical University from August 2017 to December 2018. The normal control groups (141 and 139 cases for M0 and F0, respectively) were from the Health Examination Center of the First Hospital Affiliated to China Medical University. This study was approved by the Ethics Committee of China Medical University and all participants signed informed consent.
Inclusion criteria included: men diagnosed with T2DM based on ADA standard (26) and post-menopausal women diagnosed with both T2DM and spontaneous menstruation for more than 1 year. Exclusion criteria included: (1) diabetic hyperosmolar coma, diabetic ketoacidosis or other acute diabetic complications in the last 3 months; (2) cerebrovascular diseases, liver function damage, infectious diseases, hemolysis induced by related diseases, or a history of malignant tumor; (3) recent stress, such as infection, surgery, trauma, or special physical conditions, such as pregnancy and lactation; (4) patients using angiotensin-converting enzyme inhibitors (ACEI) or angiotensin-receptor blockers (ARB) to affect the excretion rate of urinary albumin; (5) history of fracture within 1 year, osteoporosis, thyroid, parathyroid diseases, or other endocrine diseases; (6) use of agents that may affect bone metabolism such as thiazolidinediones, vitamin K, warfarin, vitamin D, calcium supplement, bisphosphonates, estrogen, and hormones, and agents that may lower lipid levels.
The subjects included 374 males and 364 post-menopausal females with T2DM. All the subjects were divided into six groups among males and post-menopausal females: (1) normal albuminuria male group (138 cases, UACR <30 mg/g, M1), (2) microalbuminuria male group (127 cases, UACR 30–300 mg/g, M2), (3) large amount of albuminuria male group (109 cases, UACR>300 mg/g, M3); (4) normal albuminuria post-menopausal female group (135 cases, UACR <30 mg/g, F1), (5) microalbuminuria post-menopausal female group (125 cases, UACR 30–300 mg/g, F2), and (6) large amount of albuminuria post-menopausal female group (104 cases, UACR>300 mg/g, F3) based on urinary albumin excretion rate (UACR) (27). Meanwhile, the age-matched normal control male and post-menopausal female groups (141 and 139 cases for M0 and F0, respectively) were included from physical examination center during the same period.
Fasting blood samples were collected from T2DM patients using standard venipuncture (28) including non-hemolized samples with an absorbance <0.2 at 414 nm (29). Two samples of 5 ml venous blood were collected without anticoagulant and kept at room temperature for 30 min. The first sample was centrifuged for 15 min (1,000 × g, 4°C) for enzyme-linked immunosorbent assay (ELISA) and the second sample was centrifuged for 5 min (2,000 × g, 4°C) for real-time PCR assay as we conducted in the previous research (30). The serum samples were collected, sealed, and stored at −80°C till further use.
Measurements
All volunteers were asked about age, course of T2DM and menstrual history. The height (H), weight (W), waist circumference, hip circumference, and blood pressure (SBP, DBP) were monitored according to a standard protocol (31). Body mass index (BMI) was calculated as H (m)2/W (kg) while waist hip rate (WHR) was calculated as waist circumference (cm)/hip circumference (cm). Fasting blood samples by standard venipuncture and moderate morning urine were collected from all subjects. Double centrifugation with a Beckman J-6M Induction Drive Centrifuge (Beckman Coulter, Inc., Brea, CA, USA) was used to separate the serum. All urine, serum, and plasma samples were stored at −80°C until final analysis.
Sandwich ELISA was used to measure adiponectin (ADPN, product number: CSB-E07270h; detection range: 1.56 −100 ng/ml; CUSABIO, Wuhan, P.R.China) and connective tissue growth factor (CTGF, product number: CSB-E07875h; detection range: 3.75–120 pg/ml; CUSABIO, Wuhan, P.R.China) in the serum samples according to the manufacturers' instructions. Inter- and intra-assay coefficients of variation was between <8 and <10%, respectively.
Glucose oxidase examined by double-antibody radioimmunoassay were used to measure fasting plasma glucose (FPG), fasting plasma insulin (FINS), and fasting c-peptide (FCP) levels. The homeostasis model assessment of insulin resistance (HOMA-IR) was used to estimate insulin resistance as follows: FINS (mU/L) × FPG (mmol/L)/22.5 and insulin sensitive index (ISI = −ln[FPG × FINS]). Glycosylated hemoglobin (HbA1c) was detected using an automated HbA1c analyzer (Bio-Rad, Hercules, CA, USA).
An automated biochemical analyzer (Beckman Coulter, Inc., Brea, CA, USA) was used to measure urinary albumin, urinary creatinine (uCr), total triglyceride (TG), total cholesterol (TC), low-density lipoprotein cholesterol (LDL-C), high-density lipoprotein cholesterol (HDL-C), Ca, P, PTH, 25(OH)VD3, ALP, OC, P1NP, as well as β-CTx in the Laboratory Medicine, Nephrology Laboratory, Central Laboratory and the Laboratory of Endocrine and Metabolism of the First Hospital of China Medical University. UACR (urinary albumin/creatinine ratio) was calculated to estimate the levels of urinary proteins (32, 33).
MiRNA Isolation and Quantitative PCR Analysis
MiRNA was extracted from 400 μL serum samples using a miRcute miRNA isolation kit (DP501, Beijing Tiangen) (34). Before extraction, the C. elegans synthetic miRNA- cel-miR-39- mimic (Qiagen, Hilden, Germany) was added to each serum sample to correct for extraction errors. Strand of cDNA modified by tail reverse transcription was synthesized using a miRcute miRNA First-Strand cDNA Synthesis Kit (Tiangen, Beijing, China) (35). Real-time PCR detection of miR-154-5p in 3.0 μL cDNA template was performed using a miRcute miRNA qPCR Detection Kit (FP401, SYBR Green, Tiangen, Beijing, China) on Takara Thermal Cycler Dice Real Time System. PCR amplification was performed using the following conditions: initial denaturation at 94°C for 2 min, 45 cycles denaturation at 95°C for 5 s, annealing and extension at 60°C for 40 s. Absolute quantification of miR-154-5p in each sample was calculated using the 2∧ (-ΔCt) method (26, 36).
Statistical Analysis
IBM SPSS Statistics (V.22.0, IBM Corp., Armonk, NY, USA) was used for data analysis. The normality of each group was judged according to the previous literature and normality test. All values were expressed as the mean ± SD for normally distributed values and as median (interquartile range) for non-parametric values. Difference between UACR groups was analyzed by one-way ANOVA and sex groups by Student's t-test for normally distributed values and Kruskal-Wallis H-test for non-parametric values. The least-significant difference t-test or Mann-Whitney U-test were used for pairwise comparison of differences among multiple groups. After logarithmic transformation was used for non-parametric values, clinical parameters related to OC and Ln UACR (Natural logarithmic UACR) were analyzed using Pearson correlation and multiple linear regression analysis. When there was collinearity, ridge regression analysis was performed to determine the association between the clinical parameters. All P-values were two-tailed, and P < 0.05 was considered statistically significant.
Results
Serum miR-154-5p Levels and Clinical Characteristic in the Male and Post-menopausal Female Groups
1018 volunteers participated in our study, included 515 males and 503 post-menopausal females. We observed significant differences in age and levels of WHR, FPG, HOMA-IR, HbA1c, ADPN, P1NP, β-CTx, OC, CTGF, UACR, and miR-154-5p (P < 0.05, Table 1 and Figure 1A) between the two groups. Compared to the male group, age, WHR, ADPN, P1NP, β-CTx, OC, CTGF, UACR, and miR-154-5p were elevated and FPG, HOMA-IR, and HbA1c were significantly reduced in the post-menopausal female group (P < 0.05). However, no significant difference was observed in other parameters between different genders (P > 0.05).
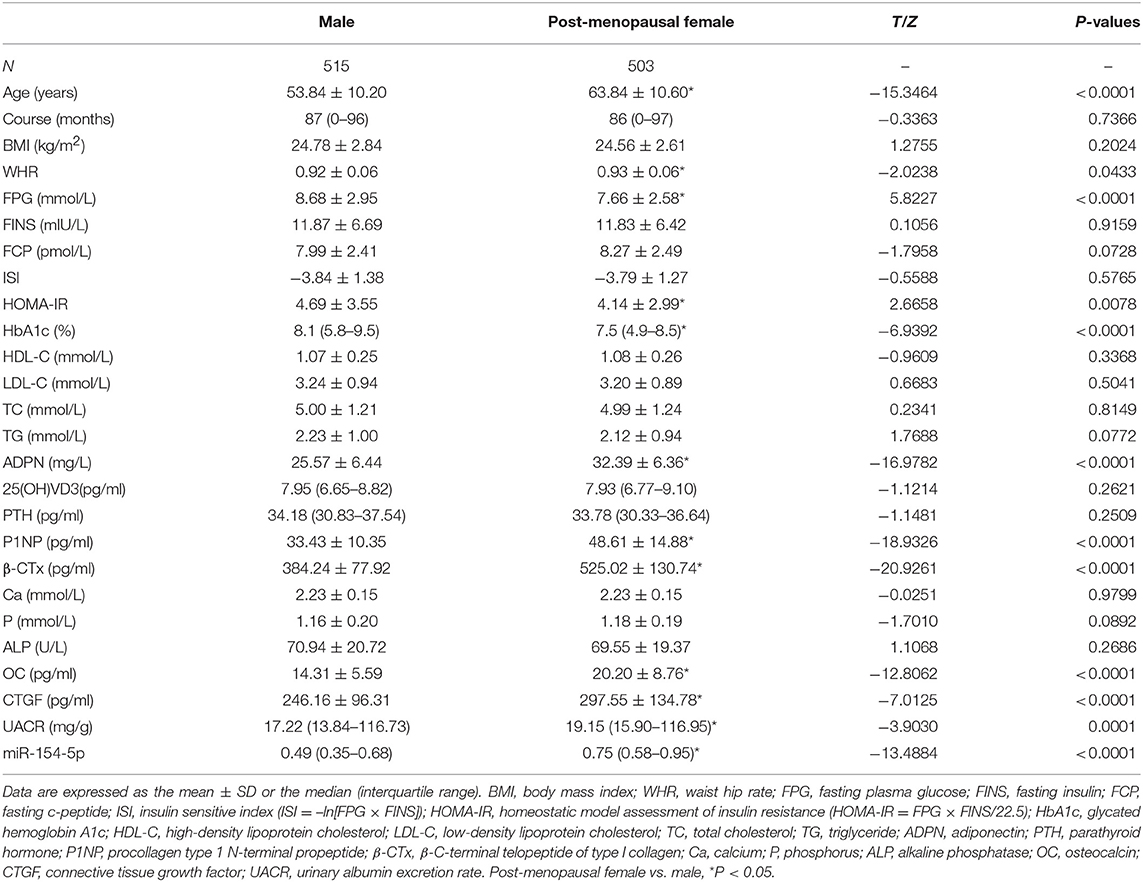
Table 1. Levels of serum miR-154-5p and clinical characteristic in the studied groups.
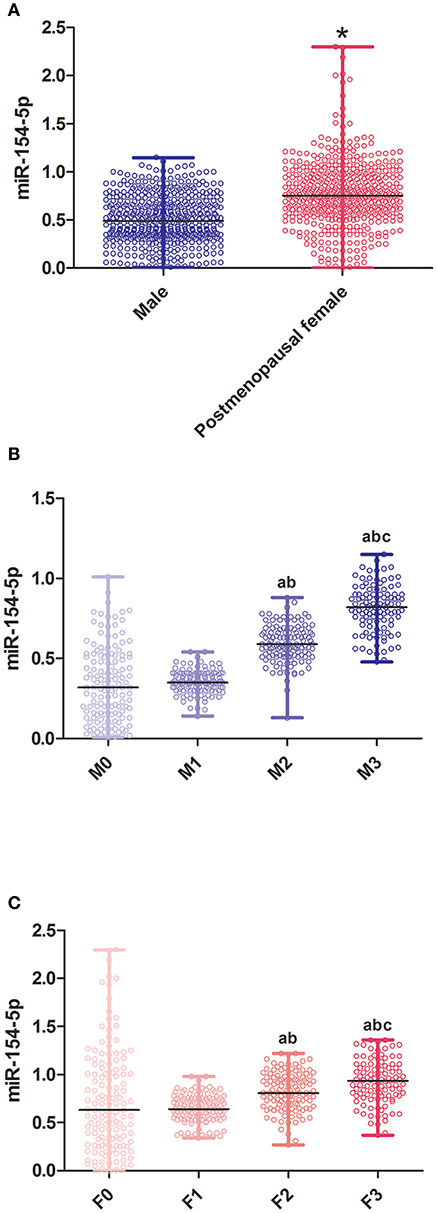
Figure 1. Relative expression of miR-154-5p in different sex and UACR groups. (A) Between genders, *post-menopausal female vs. Male, P < 0.05; (B) different UACR in male patients, a F1-3 vs. F0, P < 0.05, b F3, F2 vs. F1, P < 0.05, c F3 vs. F2, P < 0.05; and (C) different UACR in post-menopausal female patients, a M1-3 vs. M0, P < 0.05, b M3, M2 vs. M1, P < 0.05, c M3 vs. M2, P < 0.05. Data were expressed by median (quartile). M0, the normal control male group; M1-3, the normal albuminuria, microalbuminuria, and large amount of albuminuria male groups; F0, the normal control post-menopausal female group; F1-3, the normal albuminuria, microalbuminuria, and large amount of albuminuria post-menopausal female groups; UACR, urinary albumin excretion rate.
Serum miR-154-5p Levels and Clinical Characteristic in Male T2DM Groups With Different UACR
Table 2 and Figure 1B illustrates the changes in serum biological markers in male T2DM patients with different UACR. Compared to the M0 group, course, FPG, FINS, FCP and HOMA-IR in T2DM patients were significantly increased and the ISI levels were significantly decreased (P < 0.05). The levels of HbA1c, CTGF, UACR, and miR-154-5p increased successively in the M1-3 groups while ADPN, P1NP, β-CTx, and OC decreased significantly (P < 0.05).

Table 2. Levels of serum miR-154-5p and clinical characteristic in male T2DM groups with different UACR.
Serum miR-154-5p Levels and Clinical Characteristic in Post-menopausal Female T2DM Groups With Different UACR
Compared to the F0 group, course, FPG, FINS, FCP and HOMA-IR in T2DM patients were significantly increased and the ISI levels were significantly decreased (P < 0.05) in the T2DM female group. Moreover, HbA1c, CTGF, UACR, and miR-154-5p levels in the post-menopausal female T2DM patients increased successively in the F1-3 groups while the levels of ADPN, P1NP, β-CTx, and OC were reduced (P < 0.05, Table 3 and Figure 1C).
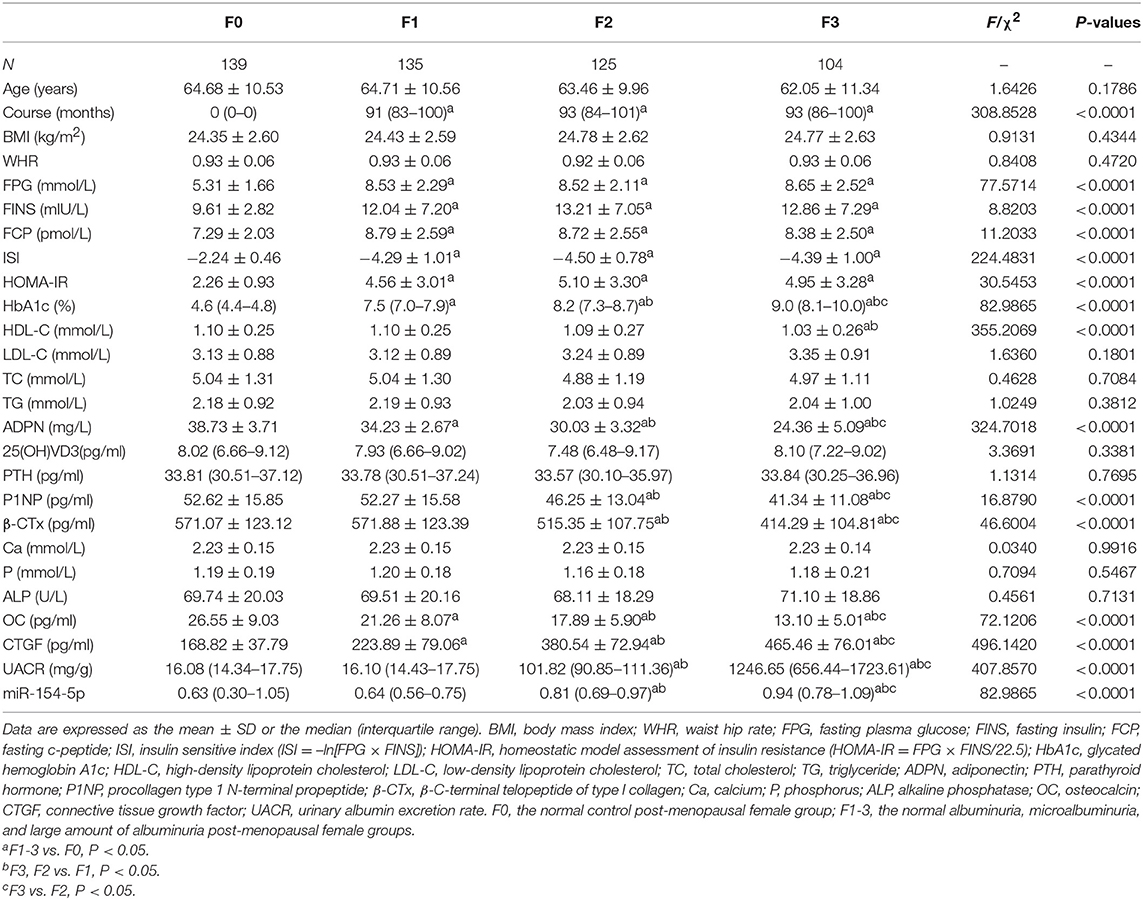
Table 3. Levels of serum miR-154-5p and clinical characteristic in post-menopausal female T2DM groups with different UACR.
Correlation Between OC, UACR, and Other Clinical Parameters in Male and Post-menopausal Female T2DM Patients
Table 4 and Figures 2–4 shows the correlation analysis in all the groups of T2DM patients. Ln UACR was found to be positively correlated with CTGF, Ln HbA1c and Ln miR-154-5p and negatively correlated with ADPN, P1NP, β-CTx, and OC (P < 0.05). In contrast, OC showed a positive correlation with ADPN, P1NP, and β-CTx and negative correlation with Ln HbA1c, CTGF, Ln UACR, and Ln miR-154-5p (P < 0.05).
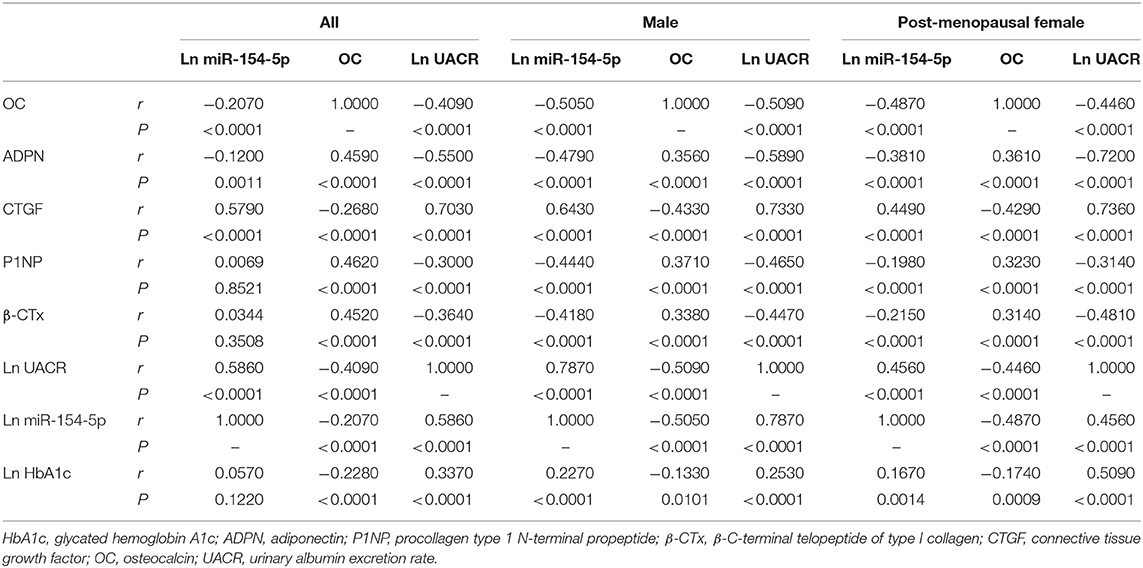
Table 4. Correlation between OC, UACR, Ln miR-154-5p, and other clinical parameters in male and post-menopausal female T2DM patients.
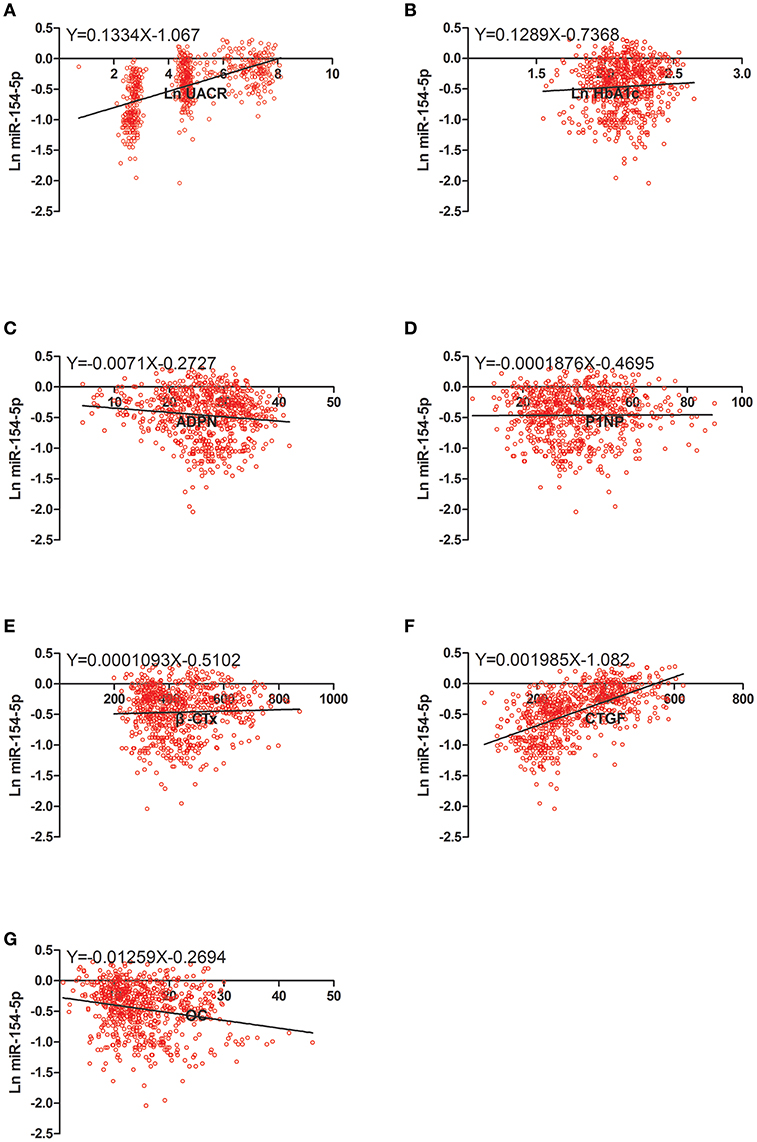
Figure 2. Scatter dot plots between Ln miR-154-5p and (A) Ln UACR, (B) Ln HbA1c, (C) ADPN, (D) P1NP, (E) β-CTx, (F) CTGF, (G) OC. UACR, urinary albumin excretion rate; HbA1c, glycated hemoglobin A1c; ADPN, adiponectin; P1NP, procollagen type 1 N-terminal propeptide; β-CTx, β-C-terminal telopeptide of type I collagen; CTGF, connective tissue growth factor; OC, osteocalcin.
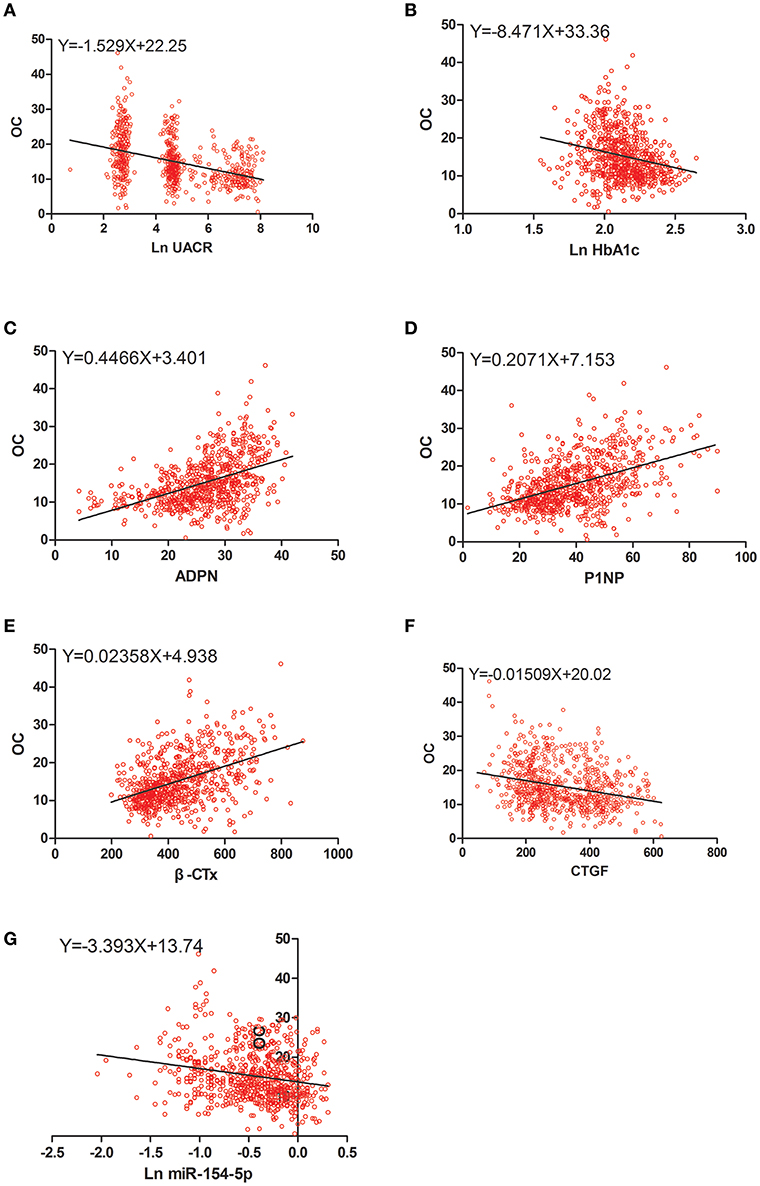
Figure 3. Scatter dot plots between OC and (A) Ln UACR, (B) Ln HbA1c, (C) ADPN, (D) P1NP, (E) β-CTx, (F) CTGF, (G) Ln miR-154-5p. UACR, urinary albumin excretion rate; HbA1c, glycated hemoglobin A1c; ADPN, adiponectin; P1NP, procollagen type 1 N-terminal propeptide; β-CTx, β-C-terminal telopeptide of type I collagen; CTGF, connective tissue growth factor; OC, osteocalcin.
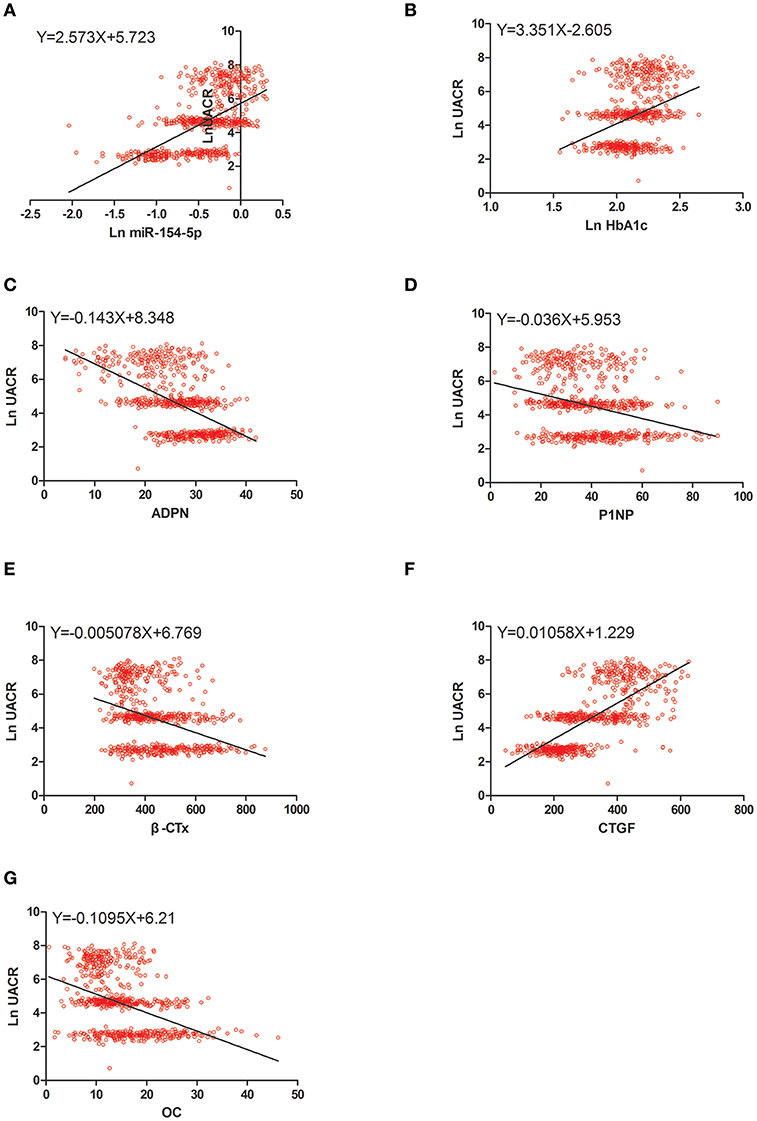
Figure 4. Scatter dot plots between Ln UACR and (A) Ln miR-154-5p, (B) Ln HbA1c, (C) ADPN, (D) P1NP, (E) β-CTx, (F) CTGF, (G) OC. UACR, urinary albumin excretion rate; HbA1c, glycated hemoglobin A1c; ADPN, adiponectin; P1NP, procollagen type 1 N-terminal propeptide; β-CTx, β-C-terminal telopeptide of type I collagen; CTGF, connective tissue growth factor; OC, osteocalcin.
Moreover, Ln miR-154-5p was positively correlated with Ln HbA1c, CTGF, and Ln UACR and negatively correlated with ADPN and OC (P < 0.05). However, Ln miR-154-5p was negatively correlated with P1NP and β-CTx of single gender groups (P < 0.05), while no significant correlation was observed among two genders (P > 0.05).
Ridge Regression Analysis of OC, UACR Levels, and Clinical Parameters in T2DM Patients
Multiple regression analysis was conducted by taking the indicators significantly related to Ln HbA1c, ADPN, P1NP, β-CTx, CTGF, OC, Ln UACR, and Ln miR-154-5p as independent variables and Ln UACR, OC as dependent variables. Exploratory multiple regression analysis showed that there was a significant correlation between the respective variables. As common linear regression analysis revealed severe colinearity (the colinearity diagnosis found that the maximum conditional index>30, variance expansion factor>10, variance component>0.5), we adopted a ridge regression analysis to address this problem.
The ridge trace shown in Figure 5 (x1–x7 = OC, ADPN, P1NP, β-CTx, Ln HbA1c, Ln miR-154-5p, and CTGF, respectively) with Ln UACR as the dependent variable in all, men and post-menopausal women T2DM patients indicated that when the ridge parameter was set at k = 0.4, standardized regression coefficients of each independent variable tended to be stable. Results showed that Ln UACR was affected by OC, ADPN, P1NP, β-CTx, CTGF, Ln HbA1c, and Ln miR-154-5p in all the three groups (P < 0.05, Table 5). Combined with the regression coefficients, we concluded that an increase in CTGF, Ln HbA1c, and Ln miR-154-5p resulted in an increase in Ln UACR, while an increase in ADPN, P1NP, β-CTx, and OC resulted in a decrease in Ln UACR.
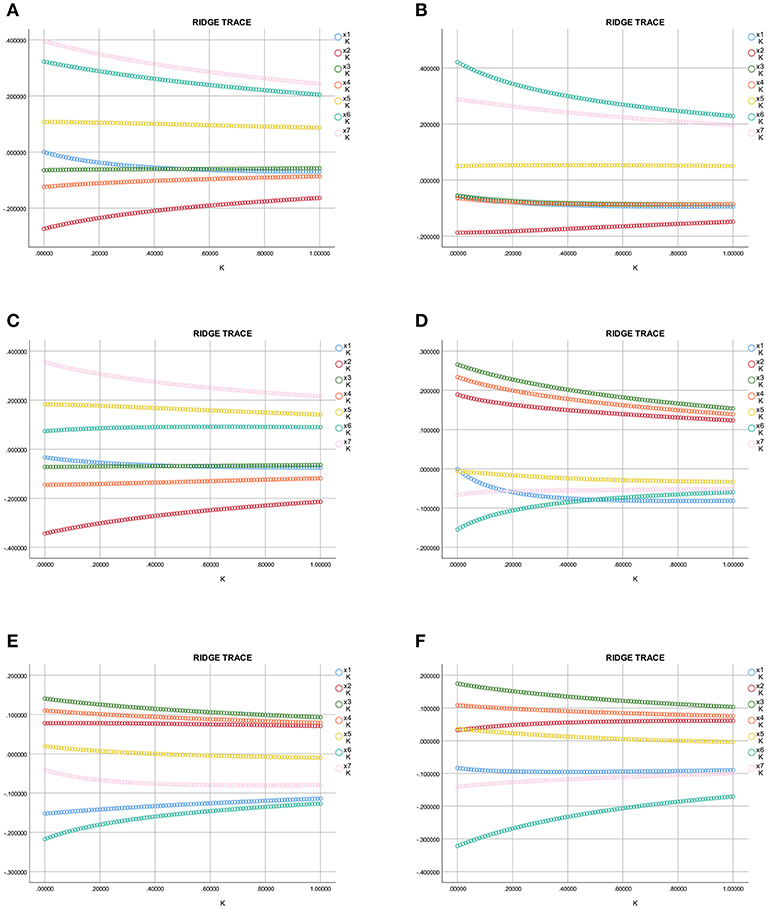
Figure 5. Ridge trace curve of the association between Ln UACR, OC, and the clinical parameters. (A–C) y = Ln UACR as dependent variables in all (A), male (B), and post-menopausal female (C) patients, and x1–x7 = OC, ADPN, P1NP, β-CTx, Ln HbA1c, Ln miR-154-5p, and CTGF as the independent variables, respectively; (D–F) y = OC as dependent variables in all (D), male (E), and post-menopausal female (F) patients, and x1–x7 = Ln UACR, ADPN, P1NP, β-CTx, Ln HbA1c, Ln miR-154-5p, and CTGF as the independent variables, respectively. UACR, urinary albumin excretion rate; HbA1c, glycated hemoglobin A1c; ADPN, adiponectin; P1NP, procollagen type 1 N-terminal propeptide; β-CTx, β-C-terminal telopeptide of type I collagen; CTGF, connective tissue growth factor; OC, osteocalcin.
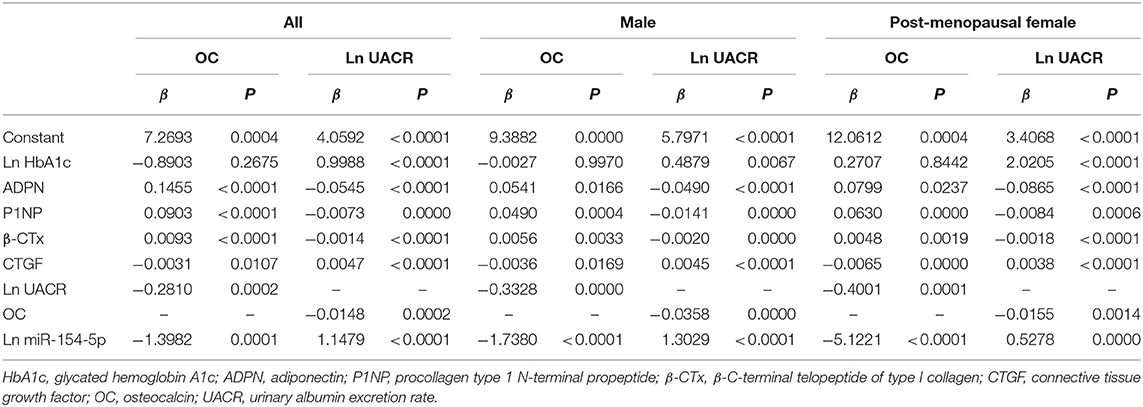
Table 5. Ridge regression analysis of OC, UACR, and clinical parameters in male and post-menopausal female T2DM patients.
The ridge trace was performed with Ln UACR, ADPN, P1NP, β-CTx, Ln HbA1c, Ln miR-154-5p, and CTGF as independent variables and OC as a dependent variable. Parameter estimation of the ridge regression was performed with k = 0.4 (k = 0.6 in Figure 5F). Using these settings, we found that OC was affected by ADPN, P1NP, β-CTx, CTGF, Ln UACR, and Ln miR-154-5p (P < 0.05, Table 5), but was not associated with Ln HbA1c (P > 0.05). Combined with the regression coefficients, it can be concluded that ADPN, P1NP, and β-CTx were positively correlated with OC while CTGF, Ln UACR and Ln miR-154-5p were negatively correlative with OC.
Discussion
Mir-154 is a recently discovered microRNA with protective effect on cancer as demonstrated by two miRNA sequences (37, 38), miR-154-5p and miR-154-3p (39–41). Only a few studies have reported the role of miR-154-3p in cancer, and the exact target mRNA and molecular function of miR-154-3p remain unexplored (42, 43). The other mature sequence in human serum, miR-154-5p, is localized to the chromosome 14q32 microRNA with multiple binding elements and is involved in several diseases related to fibrosis (25, 26, 41, 44, 45). As chronic renal diseases can lead to proteinuria through renal fibrosis (27), miR-154-5p may affect the production of urinary protein.
A similar fundamental study documented that overexpression of miR-154-5p inhibited osteogenic differentiation of adipose-derived mesenchymal stem cells by suppressing expression of osteogenic marker gene and matrix mineralization. In contrast, inhibition of endogenous miR-154-5p promoted osteogenic differentiation (24).These findings indicate a negative regulatory role of miR-154-5p on osteogenic differentiation and warrant further investigation.
Based on the previous studies, we propose the hypothesis that serum miR-154-5p levels may be related to the mechanism of fibrosis in DKD and osteogenic differentiation of DOP in T2DM patients.
UACR is recommended as one of the basic classification standard of DKD by American Diabetes Association (ADA) and Kidney Disease: Improving Global Outcomes (KDIGO) (46, 47). Serum OC is a marker of bone formation and regeneration as well as an important indicator of bone conversion in DOP, which has been observed to correlate with microRNAs in post-menopausal females (8, 48, 49). To test our hypothesis, we investigated the expression levels of serum miR-154-5p and OC in men and post-menopausal women T2DM patients with different UACR, and analyzed correlation between these parameters. To clarify the effect of miR-154-5p in T2DM patients, we performed a cross-sectional cohort study and detected serum miR-154-5p and other glycolipid metabolic pathways, bone metabolism, urine albumin, and other biochemical indicators.
We observed significant differences in the levels of miR-154-5p, OC, and UACR between male and post-menopausal female patients groups and between the normal control groups and the T2DM groups with different UACR levels. In groups of single-sex T2DM patients, miR-154-5p increased, while OC decreased successively with UACR. Serum miR-154-5p was positively correlated with UACR and negatively correlated with OC. Collectively, our data suggest that circulating miR-154-5p may be involved in the pathological process of glycolipid metabolism, bone metabolism, and proteinuria.
There are two types of cells responsible for bone homeostasis, osteoblasts for secreting new bone, and osteoclasts for breaking bone down. The close cooperation between these cells determines the structure of bones in addition to supplying adequate of calcium. P1NP and ALP are markers of bone formation and β-CTx, a segment of collagen degradation excreted by the kidney during bone remodeling, is a marker of bone resorption. β-CTx is also one of the important clinical parameters utilized in the diagnosis and treatment of osteoporosis (9). As a sign of bone formation and regeneration, serum OC has been proven to be closely related to the above two processes in previous studies (8). 25 (OH) VD3 can promote the absorption of calcium and phosphorus in the intestinal tract and the re-absorption of calcium by renal tubules. PTH can strengthen osteolysis, enhance reabsorption of calcium by renal tubules, mobilize calcium into the blood, and increase blood calcium. All of these can increase the concentration of Ca and P in the blood and promote bone calcification (8, 9). In addition, all these biomarkers can affect the whole process of bone metabolism.
To further confirm the correlation between miR-154-5p and bone metabolism, we detected the serum levels of the bone metabolism related indicators (P1NP, β-CTx, 25[OH] VD3, PTH, ALP, Ca, and P) and found that P1NP and β-CTx were significantly increased in post-menopausal female compared to the male group. However, no significant difference was observed in the other bone metabolism factors (25[OH] VD3, PTH, ALP, Ca, and P) between the two groups. Compared to the normal control group, P1NP and β-CTx decreased successively with UACR in T2DM men and post-menopausal women. Pearson correlation analysis showed that miR-154-5p was significantly negatively correlated with P1NP and β-CTx in males and post-menopausal females with T2DM suggesting that miR-154-5p may be involved in the metabolic process of bone formation and absorption.
Our results also showed that serum miR-154-5p and HbA1c increased with the rise of UACR. Serum miR-154-5p and HbA1c were positively correlated with UACR indicating that miR-154-5p may be associated with chronic elevated blood glucose levels, thus involved in the pathological changes in DKD. However, the pathological mechanisms of the changes in urine protein caused by miR-154-5p remain unknown. CTGF is thought to regulate the progression of fibrosis in almost all diseases especially in renal tissues (50). Our data showed that CTGF increased with UACR and was positively correlated with UACR, providing supplementary evidence for the relationship between urinary protein changes and renal fibrosis. Further, we measured the levels of serum fibrosis factor CTGF and used correlation analysis to examine a possible relationship between miR-154-5p and CTGF. It was found that Ln miR-154-5p positively correlated with CTGF indicating that miR-154-5p is involved in the pathological process of renal injury by regulating fibrosis factors and causes the continuous increase of urinary protein.
Our study also found that OC, P1NP, and β-CTx were significantly reduced in male and post-menopausal female patients with different UACR, but there was no significant correlation with other bone metabolism indicators, consistent with previous literature that early chronic kidney disease can cause abnormal bone mineral metabolism and appearance of abnormal bone metabolic markers such as OC, P1NP, and β-CTx (14, 15). In addition, the levels of ADPN were significantly reduced and UACR was found to be negatively correlated with ADPN, an insulin–sensitizing hormone and blood lipid regulator, but not significantly correlated with other blood lipid indicators revealing a relationship between UACR and lipid metabolism, or potential associations with early metabolic processes such as insulin resistance and coronary atherosclerosis.
Our study showed that OC, P1NP, and β-CTx were significantly increased in post-menopausal women presenting a high bone transition state. OC positively correlated with P1NP and β-CTx adding to the evidence that OC is closely related to the osteogenesis process of bone formation and resorption. OC, encoded by bone gamma-carboxyglutamic acid-containing protein (BGLAP) gene in humans, is a specific protein solely secreted by osteoblasts in the general circulatory system during osteogenesis (51). As a hormone, OC plays a role in the metabolic regulation, bone mineralization, calcium ion homeostasis, is pro- osteoblastic, and involved in bone-building process.
OC can also cause islet beta cells to release more insulin and direct fat cells to release the hormone adiponectin thus increasing sensitivity to insulin (8). Clinical trials have reported that low OC levels were associated with metabolic syndrome, glucose, and lipid metabolism (10–13) suggesting that osteocalcin may be involved in the interactive relationship between bone and islet, adipose tissues. Studies investigating the relationship between OC and glucolipid metabolism have yielded conflicting data and the underlying mechanisms remain unclear (11, 52–56). Similar observations in our research have showed OC positively correlated with ADPN and negatively correlated with HbA1c, but no significant differences were observed between OC and other glucose and lipid metabolism indicators (FPG, FINS, FCP, ISI, HOMA-IR, and blood lipids) which is consistent with the clinical evidence and our previous study (57, 58). The relationship between OC, blood glucose and insulin may be interrupted by no limit of hypoglycemic drugs, and unmeasured undercarboxylated OC (ucOC), the active form of OC (59). In addition, different race selection, experimental design, index measurement, and analysis may account for these differences.
We adopted men and post-menopausal women as the research volunteers to avoid the effect of estrogen on metabolism, resulting in the age-mismatched phenomenon in different genders. Age, WHR, ADPN, P1NP, β-CTx, OC, CTGF, UACR, and mir-154-5p were significantly increased in post-menopausal women, while FPG, HOMA-IR and HbA1c decreased compared with the male group. However, according to the results of correlation analysis, glucolipid, and bone metabolic factors had no significant correlation with age, thus excluding significant differences resulting from age differences, revealing that changes in metabolic factors are caused by DOP rather than senile osteoporosis.
However, there are several limitations of this study: (1) as a cross-sectional cohort study, this study only indicates a correlation between miR-154-5p, OC, and UACR. There is a need for a follow-up and long-term observational trials and survival analyses to validate these observations. (2) Subjects with pre-diabetes were not included and the quality control of hypoglycemic drugs was not conducted. (3) We used ridge regression to solve the problem of collinearity in multiple regression which means a modified analysis of least squares estimation by abandoning the unbiasedness of least squares. The regression coefficient is obtained at the cost of partial information loss and accuracy reduction, however, the fitting of pathological data is stronger than that of least squares.
In summary, our study speculates that serum miR-154-5p levels is positively correlated with HbA1c, UACR, and CTGF and negatively correlated with ADPN, OC, P1NP, and β-CTx. These findings indicate that miR-154-5p may participate in the pathological process of glucolipid, bone metabolism, and renal fibrosis, which may further contribute to novel target development for DKD and DOP. However, the specific mechanisms of miR-154-5p remain elusive and still present a challenge to medical research field.
Ethics Statement
This study was approved by the Ethics Committee of the First Affiliated Hospital of China Medical University. All procedures were performed in accordance with the ethical standards as mentioned in the 1964 Declaration of Helsinki and its later amendments or comparable ethical standards.
Statement of Informed Consent
Informed consent was obtained from all participants included in the study.
Author Contributions
HR and QW designed the experiments and wrote the manuscript. HR, XM, YS, MY, and JH carried out the experiments and collected the cases and data. HR analyzed the experimental results.
Funding
This study was supported by the Higher School High-end Talent Team Construction of Liaoning Province (No. [2014]187), and the Natural Science Foundation of Liaoning Province [201602862], Liaoning Province, P.R., China.
Conflict of Interest Statement
The authors declare that the research was conducted in the absence of any commercial or financial relationships that could be construed as a potential conflict of interest.
References
2. National Diabetes Data Group National Institute of Diabetes and Digestive Kidney Diseases. Diabetes in America. Vol. 95. National Institutes of Health, National Institute of Diabetes and Digestive and Kidney Diseases (1995).
3. Martinez-Laguna D, Tebe C, Nogues X, Kassim Javaid M, Cooper C, Moreno V, et al. Fracture risk in type 2 diabetic patients: a clinical prediction tool based on a large population-based cohort. PLoS ONE. (2018) 13:e0203533. doi: 10.1371/journal.pone.0203533
4. Kanazawa I, Takeno A, Tanaka KI, Yamane Y, Sugimoto T. Osteoporosis and vertebral fracture are associated with deterioration of activities of daily living and quality of life in patients with type 2 diabetes mellitus. J Bone Miner Metab. (2018) 37:503–11. doi: 10.1007/s00774-018-0948-6
5. Ni Y, Fan D. Diabetes mellitus is a risk factor for low bone mass-related fractures: A meta-analysis of cohort studies. Medicine. (2017) 96:e8811. doi: 10.1097/MD.0000000000008811
6. Lee RH, Sloane R, Pieper C, Lyles KW, Adler RA, et al. Clinical fractures among older men with diabetes are mediated by diabetic complications. J Clin Endocrinol Metab. (2018) 103:281–7. doi: 10.1210/jc.2017-01593
7. Chen FP, Kuo SF, Lin YC, Fan CM, Chen JF. Status of bone strength and factors associated with vertebral fracture in postmenopausal women with type 2 diabetes. Menopause. (2018) 26:182–8. doi: 10.1097/GME.0000000000001185
8. Lee NK, Sowa H, Hinoi E, Ferron M, Ahn JD, Confavreux C, et al. Endocrine regulation of energy metabolism by the skeleton. Cell. (2007) 130:456–69. doi: 10.1016/j.cell.2007.05.047
9. Iglesias P, Arrieta F, Pinera M, Botella-Carretero JI, Balsa JA, Zamarron I, et al. Serum concentrations of osteocalcin, procollagen type 1 N-terminal propeptide and beta-CrossLaps in obese subjects with varying degrees of glucose tolerance. Clin Endocrinol. (2011) 75:184–8. doi: 10.1111/j.1365-2265.2011.04035.x
10. Tan A, Gao Y, Yang X, Zhang H, Qin X, Mo L, et al. Low serum osteocalcin level is a potential marker for metabolic syndrome: results from a Chinese male population survey. Metabolism. (2011) 60:1186–92. doi: 10.1016/j.metabol.2011.01.002
11. Rui X, Xu B, Su J, Pan C, Zhan C, Su B, et al. Differential pattern for regulating insulin secretion, insulin resistance, and lipid metabolism by osteocalcin in male and female T2DM patients. Med Sci Monit. (2014) 20:711–9. doi: 10.12659/MSM.890130
12. Bador KM, Wee LD, Halim SA, Fadi MF, Santhiran P, Rosli NF, et al. Serum osteocalcin in subjects with metabolic syndrome and central obesity. Diabetes Metab Syndr. (2016) 10(1 Suppl. 1):S42–5. doi: 10.1016/j.dsx.2015.09.009
13. Chen Y, Zhao Q, Du G, Xu Y. Association between serum osteocalcin and glucose/lipid metabolism in Chinese Han and Uygur populations with type 2 diabetes mellitus in Xinjiang: two cross-sectional studies. Lipids Health Dis. (2017) 16:139. doi: 10.1186/s12944-017-0512-8
14. Tejwani V, Qian Q. Calcium regulation and bone mineral metabolism in elderly patients with chronic kidney disease. Nutrients. (2013) 5:1913–36. doi: 10.3390/nu5061913
15. Kochanek M, Said A, Lerma EV. Mineral metabolism in chronic kidney disease. Dis Mon. (2015) 61:425–33. doi: 10.1016/j.disamonth.2015.08.003
16. Lin X, Yang Z, Zhang P, Liu Y, Shao G. miR-154 inhibits migration and invasion of human non-small cell lung cancer by targeting ZEB2. Oncol Lett. (2016) 12:301–6. doi: 10.3892/ol.2016.4577
17. Dambal S, Giangreco AA, Acosta AM, Fairchild A, Richards Z, Deaton R, et al. microRNAs and DICER1 are regulated by 1,25-dihydroxyvitamin D in prostate stroma. J Steroid Biochem Mol Biol. (2017) 167:192–202. doi: 10.1016/j.jsbmb.2017.01.004
18. Luk JM, Burchard J, Zhang C, Liu AM, Wong KFk, Shek FH, et al. DLK1-DIO3 genomic imprinted microRNA cluster at 14q32.2 defines a stemlike subtype of hepatocellular carcinoma associated with poor survival. J Biol Chem. (2011) 286:30706–13. doi: 10.1074/jbc.M111.229831
19. Xin C, Zhang H, Liu Z. miR-154 suppresses colorectal cancer cell growth and motility by targeting TLR2. Mol Cell Biochem. (2014) 387:271–7. doi: 10.1007/s11010-013-1892-3
20. Gardiner E, Beveridge NJ, Wu JQ, Carr V, Scott RJ, Tooney PA, et al. Imprinted DLK1-DIO3 region of 14q32 defines a schizophrenia-associated miRNA signature in peripheral blood mononuclear cells. Mol Psychiatry. (2012) 17:827–40. doi: 10.1038/mp.2011.78
21. Huang J, Wu J, Li Y, Li X, Yang T, Yang Q, et al. Deregulation of serum microRNA expression is associated with cigarette smoking and lung cancer. Biomed Res Int. (2014) 2014:364316. doi: 10.1155/2014/364316
22. Zheng Y, Zhu C, Ma L, Shao P, Qin C, Li P, et al. miRNA-154-5p inhibits proliferation, migration and invasion by targeting E2F5 in prostate cancer cell lines. Urol Int. (2017) 98:102–10. doi: 10.1159/000445252
23. Ding J, Jilin LI, Mingkun YU, Neurosurgery DO. Expression of miRNA-154 in astrocytomas and its clinical significance. Chinese Clini Oncol. (2017). Available online at: http://www.en.cnki.com.cn/Article_en/CJFDTOTAL-LCZL201704006.htm
24. Li J, Hu C, Han L, Liu L, Jing W, Tang W, et al. MiR-154-5p regulates osteogenic differentiation of adipose-derived mesenchymal stem cells under tensile stress through the Wnt/PCP pathway by targeting Wnt11. Bone. (2015) 78:130–41. doi: 10.1016/j.bone.2015.05.003
25. Milosevic J, Pandit K, Magister M, Rabinovich E, Ellwanger DC, Yu G, et al. Profibrotic role of miR-154 in pulmonary fibrosis. Am J Respir Cell Mol Biol. (2012) 47:879–87. doi: 10.1165/rcmb.2011-0377OC
26. Kaminski N, Benos P, Corcoran D, Pandit KV, Milosevic J, Yousef H. MicroRNAs in idiopathic pulmonary fibrosis. In: Pandit KV, Milosevic J, Kaminski N, editors. Translational Research. Mosby, Inc. (2011). p. 191–9. doi: 10.1016/j.trsl.2011.01.012
27. Li Y, Hu F, Xue M, Jia YJ, Zheng ZJ, Wang L, et al. Klotho down-regulates Egr-1 by inhibiting TGF-beta1/Smad3 signaling in high glucose treated human mesangial cells. Biochem Biophys Res Commun. (2017) 487:216–22. doi: 10.1016/j.bbrc.2017.04.036
28. American Diabetes Association. Standards of medical care in diabetes−2014. Diabetes Care. (2014) 37(Suppl. 1):S14–80. doi: 10.2337/dc14-S014
29. Schorr GS, Falcone EA, Moretti DJ, Andrews RD. First long-term behavioral records from Cuvier's beaked whales (Ziphius cavirostris) reveal record-breaking dives. PLoS ONE. (2014) 9:e92633. doi: 10.1371/journal.pone.0092633
30. Lv C, Zhou YH, Wu C, Shao Y, Lu CL, Wang QY. The changes in miR-130b levels in human serum and the correlation with the severity of diabetic nephropathy. Diabetes Metab Res Rev. (2015) 31:717–24. doi: 10.1002/dmrr.2659
31. Chalmers J. The 1999 WHO-ISH guidelines for the management of hypertension. Med J Aust. (1999) 171:458–9. doi: 10.5694/j.1326-5377.1999.tb123747.x
32. Chaturvedi S, Suri V, Pant I, Rusia U. Blood collection procedures in hematology: knowledge and practice among laboratory personnel. Indian J Pathol Microbiol. (2006) 49:381–4. Available online at: http://europepmc.org/abstract/MED/17001890
33. Chobanian AV, Bakris GL, Black HR, Cushman WC, Green LA, Izzo JLJr, et al. The seventh report of the joint national committee on prevention, detection, evaluation, and treatment of high blood pressure: the JNC 7 report. JAMA. (2003) 289:2560–72. doi: 10.1001/jama.289.19.2560
34. Yu R, Yang Y, Tian Y, Zhang Y, Lyu G, Zhu J, et al. The mechanism played by 1,25-dihydroxyvitamin D3 in treating renal fibrosis in diabetic nephropathy. Chin J End Met. (2015). doi: 10.3760/cma.j.issn.1000-6699.2015.09.013
35. Disease K. Improving Global Outcomes (KDIGO) CKD Work Group. KDIGO 2012 clinical practice guideline for the evaluation and management of chronic kidney disease. Polskie Archiwum Medycyny Wewnȩtrznej. (2013) 120:300–6. doi: 10.1038/kisup.2012.73
36. Wang YC, Li Y, Wang XY, Zhang D, Zhang H, Wu Q, et al. Circulating miR-130b mediates metabolic crosstalk between fat and muscle in overweight/obesity. Diabetologia. (2013) 56:2275–85. doi: 10.1007/s00125-013-2996-8
37. Ng EK, Chong WW, Jin H, Lam EK, Shin VY, Yu J, et al. Differential expression of microRNAs in plasma of patients with colorectal cancer: a potential marker for colorectal cancer screening. Gut. (2009) 58:1375–81. doi: 10.1136/gut.2008.167817
38. Ortega FJ, Mercader JM, Moreno-Navarrete JM, Rovira O, Guerra E, Esteve E, et al. Profiling of circulating microRNAs reveals common microRNAs linked to type 2 diabetes that change with insulin sensitization. Diabetes Care. (2014) 37:1375–83. doi: 10.2337/dc13-1847
39. Williams AE, Moschos SA, Perry MM, Barnes PJ, Lindsay MA. Maternally imprinted microRNAs are differentially expressed during mouse and human lung development. Dev Dyn. (2007) 236:572–80. doi: 10.1002/dvdy.21047
40. Niu JT, Zhang LJ, Huang YW, Li C, Jiang N, Niu YJ. MiR-154 inhibits the growth of laryngeal squamous cell carcinoma by targeting GALNT7. Biochem Cell Biol. (2018) 96:752–60. doi: 10.1139/bcb-2018-0047
41. Dong P, Liu WJ, Wang ZH. MiR-154 promotes myocardial fibrosis through beta-catenin signaling pathway. Eur Rev Med Pharmacol Sci. (2018) 22:2052–60. doi: 10.26355/eurrev_201804_14735
42. Cazzoli R, Buttitta F, Di Nicola M, Malatesta S, Marchetti A, Rom WN, et al. microRNAs derived from circulating exosomes as noninvasive biomarkers for screening and diagnosing lung cancer. J Thorac Oncol. (2013) 8:1156–62. doi: 10.1097/JTO.0b013e318299ac32
43. Gururajan M, Josson S, Chu GC, Lu CL, Lu YT, Haga CL, et al. miR-154* and miR-379 in the DLK1-DIO3 microRNA mega-cluster regulate epithelial to mesenchymal transition and bone metastasis of prostate cancer. Clin Cancer Res. (2014) 20:6559–69. doi: 10.1158/1078-0432.CCR-14-1784
44. Sun LY, Bie ZD, Zhang CH, Li H, Li LD, Yang J. MiR-154 directly suppresses DKK2 to activate Wnt signaling pathway and enhance activation of cardiac fibroblasts. Cell Biol Int. (2016) 40:1271–9. doi: 10.1002/cbin.10655
45. Bernardo BC, Nguyen SS, Gao XM, Tham YK, Ooi JY, Patterson NL, et al. Inhibition of miR-154 protects against cardiac dysfunction and fibrosis in a mouse model of pressure overload. Sci Rep. (2016) 6:22442. doi: 10.1038/srep22442
46. National Diabetes Data Group National Institute of Diabetes Digestive and Kidney Disease. Diabetes in America. National Institutes of Health, National Institute of Diabetes and Digestive and Kidney Diseases (1995).
47. Zitkus BS. American diabetes association standards of medical care in diabetes. Nurse Practitioner. (2014) 30(Suppl. 1):S12–54. doi: 10.1097/01.NPR.0000451880.48790.50
48. Chen J, Zhao X, Li X, Wu Y. Calycosin induces apoptosis by the regulation of ERβ/miR-17 signaling pathway in human colorectal cancer cells. Food Funct. (2015) 6:3091–7. doi: 10.1039/C5FO00374A
49. Tian J, Wang Y, Zhang X, Ren Q, Li R, Huang Y. Calycosin inhibits the in vitro and in vivo growth of breast cancer cells through WDR7-7-GPR30 signaling. J Exp Clin Cancer Res. (2017) 36:153. doi: 10.1186/s13046-017-0660-8
50. Ellina O, Chatzigeorgiou A, Kouyanou S, Lymberi M, Mylona-Karagianni C, Tsouvalas E, et al. Extracellular matrix-associated (GAGs, CTGF), angiogenic (VEGF) and inflammatory factors (MCP-1, CD40, IFN-gamma) in type 1 diabetes mellitus nephropathy. Clin Chem Lab Med. (2012) 50:167–74. doi: 10.1515/cclm.2011.881
51. Villafan-Bernal JR, Sanchez-Enriquez S, Munoz-Valle JF. Molecular modulation of osteocalcin and its relevance in diabetes. Int J Mol Med. (2011) 28:283–93. doi: 10.3892/ijmm.2011.706
52. Choudhury AB, Sarkar PD, Sakalley DK, Petkar SB. Role of adiponectin in mediating the association of osteocalcin with insulin resistance and type 2 diabetes: a cross sectional study in pre- and post-menopausal women. Arch Physiol Biochem. (2014) 120:73–9. doi: 10.3109/13813455.2013.877488
53. Chen L, Li Q, Yang Z, Ye Z, Huang Y, He M, et al. Osteocalcin, glucose metabolism, lipid profile and chronic low-grade inflammation in middle-aged and elderly Chinese. Diabet Med. (2013) 30:309–17. doi: 10.1111/j.1464-5491.2012.03769.x
54. Liu DM, Guo XZ, Tong HJ, Tao B, Sun LH, Zhao HY, et al. Erratum to: Association between osteocalcin and glucose metabolism: a meta-analysis. Osteoporos Int. (2015) 26:2835–6. doi: 10.1007/s00198-015-3286-8
55. Shu H, Pei Y, Chen K, Lu J. Significant inverse association between serum osteocalcin and incident type 2 diabetes in a middle-aged cohort. Diabetes Metab Res Rev. (2016) 32:867–74. doi: 10.1002/dmrr.2808
56. Wang Q, Zhang B, Xu Y, Xu H, Zhang N. The relationship between serum osteocalcin concentration and glucose metabolism in patients with type 2 diabetes mellitus. Int J Endocrinol. (2013) 2013:842598. doi: 10.1155/2013/842598
57. Maddaloni E, D'Onofrio L, Lauria A, Maurizi AR, Strollo R, Palermo A, et al. Osteocalcin levels are inversely associated with Hba1c and BMI in adult subjects with long-standing type 1 diabetes. J Endocrinol Invest. (2014) 37:661–6. doi: 10.1007/s40618-014-0092-7
58. Ma XY, Chen FQ, Hong H, Lv XJ, Dong M, Wang QY. The relationship between serum osteocalcin concentration and glucose and lipid metabolism in patients with type 2 diabetes mellitus - the role of osteocalcin in energy metabolism. Ann Nutr Metab. (2015) 66:110–6. doi: 10.1159/000370198
Keywords: type 2 diabetes mellitus, miR-154-5p, osteocalcin, diabetic kidney disease, diabetic osteoporosis
Citation: Ren H, Ma X, Shao Y, Han J, Yang M and Wang Q (2019) Correlation Between Serum miR-154-5p and Osteocalcin in Males and Postmenopausal Females of Type 2 Diabetes With Different Urinary Albumin Creatinine Ratios. Front. Endocrinol. 10:542. doi: 10.3389/fendo.2019.00542
Received: 12 December 2018; Accepted: 19 July 2019;
Published: 06 August 2019.
Edited by:
Jan Polák, Charles University, CzechiaReviewed by:
Yu Ye, Guangxi Medical University, ChinaKamyar Asadipooya, University of Kentucky, United States
Copyright © 2019 Ren, Ma, Shao, Han, Yang and Wang. This is an open-access article distributed under the terms of the Creative Commons Attribution License (CC BY). The use, distribution or reproduction in other forums is permitted, provided the original author(s) and the copyright owner(s) are credited and that the original publication in this journal is cited, in accordance with accepted academic practice. No use, distribution or reproduction is permitted which does not comply with these terms.
*Correspondence: Qiuyue Wang, wqycmu123@163.com