 Su-qin Shi1,2Shan-shan Li2Xiao-ya Zhang2Zhe Wei2Wen-zhen Fu2Jin-wei He2Yun-qiu Hu2Miao Li2
 Li-li Zheng3*
 Zhen-lin Zhang2*
- 1Department of Endocrinology, The First Affiliated Hospital of Henan University of Chinese Medicine, Zhengzhou, China
- 2Metabolic Bone Disease and Genetic Research Unit, Department of Osteoporosis and Bone Disease, Shanghai Jiao Tong University Affiliated Sixth People’s Hospital, Shanghai, China
- 3Department of Endocrinology, The First Affiliated Hospital of Zhengzhou University, Zhengzhou, China
Objective: The current study was conducted to determine whether peak bone mineral density (BMD) and obesity phenotypes are associated with certain LGR4 gene polymorphisms found in Chinese nuclear families with female children.
Methods: A total of 22 single nucleotide polymorphisms (SNPs) located in and around the LGR4 gene were identified in 1,300 subjects who were members of 390 Chinese nuclear families with female children. Then, BMD readings of the femoral neck, total hip, and lumbar spine as well as measurements of the total lean mass (TLM), total fat mass (TFM), and trunk fat mass were obtained via dual-energy X-ray absorptiometry. The quantitative transmission disequilibrium test was used to analyze the associations between specific SNPs and LGR4 haplotypes and peak BMD as well as between LGR4 haplotypes and TLM, percent lean mass, TFM, percent fat mass, trunk fat mass, and body mass index (BMI).
Results: Here, rs7936621 was significantly associated with the BMD values for the total hip and lumbar spine, while rs10835171 and rs6484295 were associated with the trunk fat mass and BMI, respectively. Regarding the haplotypes, we found significant associations between GAA in block 2 and trunk fat mass and BMI, between AGCGT in block 3 and total hip BMD, between TGCTCC in block 5 and femoral neck BMD, and between TACTTC in block 5 and both lumbar spine and femoral neck BMD (all P-values < 0.05).
Conclusion: Genetic variations of the LGR4 gene are related to peak BMD, BMI, and trunk fat mass.
Introduction
Osteoporosis and obesity are common occurrences during the aging process, and both are subject to environmental and genetic influences. Individuals with osteoporosis have a low bone mineral density (BMD) and an increased risk of fracture due to degradation of their bone microstructure. It is currently estimated that >200 million people have osteoporosis worldwide. In the United States, osteoporosis is an underlying cause of 1.3 million fractures, which cost $10 billion per year to repair (1). As a complex quantitative trait that is 50%–85% heritable, BMD can serve as a surrogate marker for osteoporosis (2–4). Obesity occurs due to an excessive accumulation of body fat and is closely associated with metabolic, cardiovascular, and physical disabilities (5). While body mass index (BMI) is the most commonly used index of obesity, it does not directly measure the total amount of body fat. Alternative ways of measuring obesity include measurements of the total fat mass, trunk fat mass, and percent body fat. Studies of twins and families in several populations have shown that BMI is strongly influenced by genetics and is 40%–70% inheritable (6).
While osteoporosis and obesity were once viewed as non-related disorders, they are now thought to be closely associated with each other. Increased body weight, as a form of mechanical loading, can induce osteogenesis and protect against bone loss (7). Mesenchymal stem cells (MSCs) in bone marrow give rise to both osteoblasts and adipocytes. Obesity induces the MSCs to generate greater numbers of adipocytes than osteoblasts, which leads to decreased bone formation (8). As an endocrine organ, adipose tissue secretes estrogen-synthesizing enzymes that increase estrogen levels. The resulting increased levels of estrogen then enhance osteoclast apoptosis (9) and inhibit osteoblast apoptosis (10), thereby decreasing bone tissue resorption. Moreover, adipose tissue also produces various cytokines and adipokines, whose dysregulation promotes a cascade of metabolic alterations that lead to bone loss (11, 12), possibly by creating and maintaining a low-grade inflammatory environment (13). Moreover, certain molecules produced by bone (e.g., osteopontin and osteocalcin) are known to help regulate body weight and maintain appropriate glucose levels (14). When examined at the genetic level, BMD and BMI share a 10%–20% genetic variation (15). Several studies have identified pleiotropic genes [e.g., VDR, ESR1 (16), and FTO (17)] that assist in regulating both body composition and the osteoporosis process.
The gene that encodes the LGR4 protein, a leucine-rich protein also known as GPR48, maps to chromosome 11p14.1, which comprises 18 exons and 19 introns. The LGR4 protein consists of 951 amino acids, including 17 N-terminal leucine-rich repeats. The protein also contains a seven-transmembrane region (18). It contributes to the physiological function of several organs through the role it plays in both Wnt and cyclic AMP/protein kinase A (PKA) signaling (19, 20). A recent large-scale study conducted in Iceland identified a strong association between the nonsense mutation c.376C>T [p.R126Xc.367C-T; arg126 to ter; R126Xarg126 to ter; R126Xarg126 to ter; R126Xarg126 to ter; R126Xarg126 to ter; R126Xarg126 to ter; R126Xarg126 to ter; R126X)] found within the LGR4 gene and both lower BMD values and osteoporotic fracture rates (21). Moreover, LGR4 has been found to help control body weight by regulating the conversion of white fat into brown fat (22). Furthermore, a Chinese study that compared obese subjects with control subjects found that a heterogenous variant of c.2248G>A within LGR4 is associated with obesity (23). These results suggest that LGR4 can influence the phenotype of both osteoporosis and obesity. To investigate the validity of this hypothesis, we used the quantitative transmission disequilibrium test (QTDT) to examine whether LGR4 polymorphisms are associated with variations in peak BMD and obesity-related phenotypes in a large cohort of female nuclear family members residing in China.
Materials and Methods
Subjects
The study protocol was reviewed and approved by the Shanghai Jiao Tong University Affiliated Sixth People’s Hospital Ethics Committee. Each study participant signed a written informed consent form prior to enrollment. The study participants resided in Shanghai City and were of Chinese Han ethnic descent.
From 2008 to 2015, we recruited 1,300 individuals who were members of 390 Chinese female-offspring nuclear families (24). The DNA samples obtained from 38 of the individuals were of poor quality and could not be sufficiently amplified to allow for discrimination of the genotypes. Thus, 1,262 individuals who were members of 379 different female nuclear families were included in our final analysis. Among them were 379 parents (mean age, 61.6 ± 7.5 years), 467 female children (mean age, 34.1 ± 6.8 years), and 37 male children (mean age, 34.6 ± 4.7 years). The families had a mean size of 3.33 individuals, as 268, 97, and 14 families included one, two, and three children, respectively. Each enrolled subject was asked to answer questions concerning their demographic characteristics, lifestyle, dietary habits, and tobacco/alcohol use. The study participant exclusion criteria were as follows: (1) significant health problems due to cerebral vascular disease; (2) diabetes; (3) chronic kidney, liver, or lung disease; (4) alcoholism; (5) pharmacologic doses of corticosteroids for >3 months; (6) anticonvulsant therapy for >6 months; (7) evidence of other hereditary or metabolic bone diseases; (8) rheumatoid arthritis or a collagen disease; (9) major gastrointestinal disease within the last year; (10) any major endocrinopathy that would affect bone mass such as hyperthyroidism, hypogonadism, or hypercortisolism; (11) any neurological or musculoskeletal condition that might cause secondary low bone mass (16, 24–30).
Phenotype Measurements
A dual-energy X-ray absorptiometry (DXA) densitometer manufactured by Lunar Corporation (Madison, WI, U.S.A.) and operated in fan-beam mode was used to measure the bone density in the lumbar spine (L1–4) and left proximal femur (including the femoral neck and total hip) as well as to obtain measurements of the total lean mass (TLM), total fat mass (TFM), and trunk fat mass. The individual ratios of TFM to body weight and TLM to body weight were used as measurements of the percent fat mass (PFM) and percent lean mass (PLM), respectively. The densitometer was calibrated on a daily basis. Fifteen different individuals were each measured three times, and the results were used to calculate the coefficients of variability (CVs). The CV values of the measurements for the lumbar spine, femoral neck, total hip, and trochanter were 1.39%, 2.22%, 0.7%, and 1.41%, respectively. With regard to body composition, the CV values for the TLM, TFM, and trunk fat mass were 1.18%, 3.72%, and 2.52% respectively (28). The weekly phantom measurements taken during the course of our study showed that the DXA data had a reproducibility of 0.45% (16, 28). Standard methods were used to measure each subject’s height and weight, and the BMI was calculated as the weight in kilograms divided by the square of the height in meters.
Single Nucleotide Polymorphism Selection and Genotyping
The 376 C>T mutation sites and 21 tagSNPs located in and around the LGR4 gene were chosen for evaluation. The tagSNPs were selected based on information contained in the HapMap and dbSNP databases as well as factors that included: (1) whether the tag SNP had been validated in a Chinese population; (2) the amount of heterozygosity (minor allele frequency [MAF] >0.05); (3) whether the pairwise linkage disequilibrium (LD) of the algorithm bin tagSNP had an r2 value >0.8; (4) the reported functional importance of the tagSNP. Each study subject fasted overnight, after which a blood sample (5 mL) was taken and treated with disodium ethylenediaminetetraacetic acid. A chloroform–phenol solution was used to extract genomic DNA from peripheral blood leukocytes. Genotyping was performed with the combined use of an imLDR Multiplex Kit (Genesky Biotechnologies, Shanghai), an RT-PCR system (Mx300p; Stratagene, La Jolla, CA, U.S.A.), and the GeneMapper 4.1 software (Applied Biosystems, Foster City, CA, U.S.A.).
Haplotype and LD Analysis
A process described by Stephens et al. (2001) was used in combination with the PHASE software (version 2.1) (31) to obtain haplotypes from the study population’s genotype data. The Haploview software (version 4.2) was used to assess the significance of the LD that existed between the LGR4 gene markers (32). We also examined Lewontin’s D’ and LD coefficients (r2) between all pairs of biallelic loci. The genotype and haplotype frequencies were determined using genotype information obtained from non-related parents in the nuclear families.
Statistical Analysis
The genotype occurrences of each of the 22 polymorphic sites identified in the parents in each nuclear family were analyzed with the χ2 test to assess their conformity to the Hardy–Weinberg equilibrium. The QTDT (orthogonal model) was performed to evaluate the parameters of population stratification, total association, linkage, and within-family associations between the various SNPs, haplotypes, BMD phenotypes, and obesity-related phenotypes. This method of using the QTDT to analyze data relevant to quantitative traits in conjunction with genotype data obtained from siblings and parents is very effective and was implemented herein using QTDT software (33). All children in the nuclear families were daughters, and the possible effects of the parental phenotypes were not analyzed by the QTDT; therefore, we did not use sex as a covariate when adjusting for variations in phenotype. Instead, the raw BMD values were adjusted using covariates that included height, age, and weight, and age was used to adjust the obesity phenotypes. To avoid false-positive results being obtained after multiple tests, the QTDT software package was used to perform 1,000 Monte Carlo permutations to obtain P-values that could be used to determine the accuracy of our results (34–36). The statistical power for each SNP is 0.8. A P-value <0.05 was shown to be statistically significant for all our analyses. The QTDT software package used can be downloaded at http://www.sph.umich.edu/csg/abecasis/QTDT/.
Results
Clinical Characteristics
This study enrolled 1,262 subjects who were members of 379 nuclear families with female children. The subjects included 758 parents and 467 female offspring. As we did not use the QTDT to analyze the effects of parental phenotypes, only the body compositions of the daughters were obtained. The characteristics of the enrolled subjects are listed in Table 1.
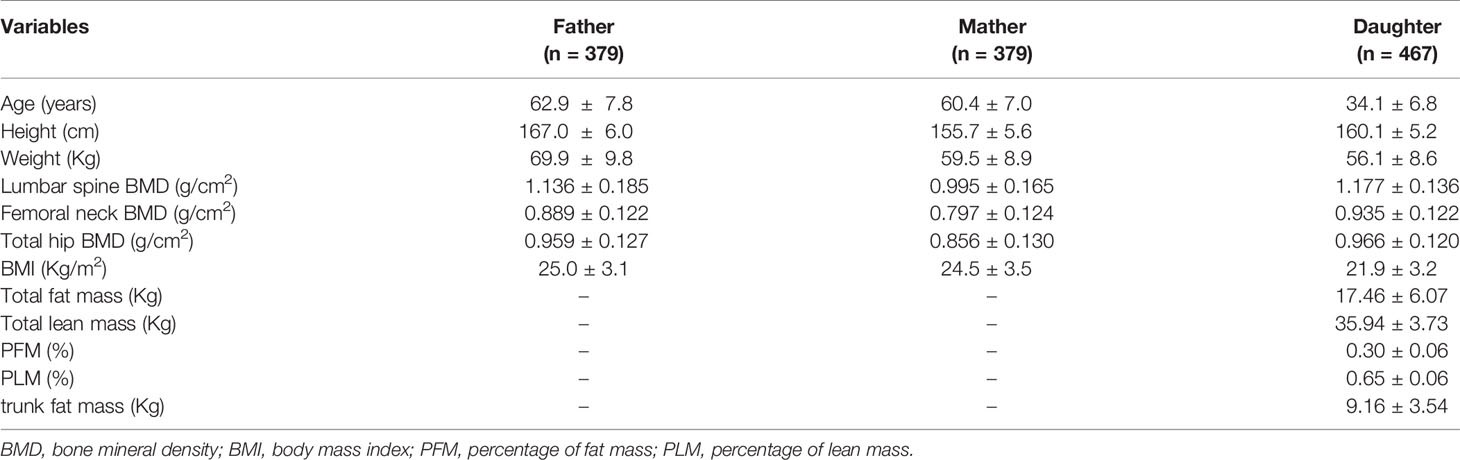
Table 1 The basic characteristics of the female-offspring nuclear families (mean ± SD).
SNP Characterization and LD
We initially examined 22 SNPs located within and around LGR4. Because our genotype analysis showed that only one C376T genotype (GG) was present, C376T was excluded from our final statistical analysis. Moreover, rs11029986 had a MAF <0.05 and was also excluded. However, 20 SNPs had a MAF ≥0.07 and displayed Hardy–Weinberg equilibrium. Data obtained from 758 unrelated nuclear family parents were used to calculate the MAF values of the SNPs examined in our study. Detailed information concerning the SNPs is provided in Table 2.
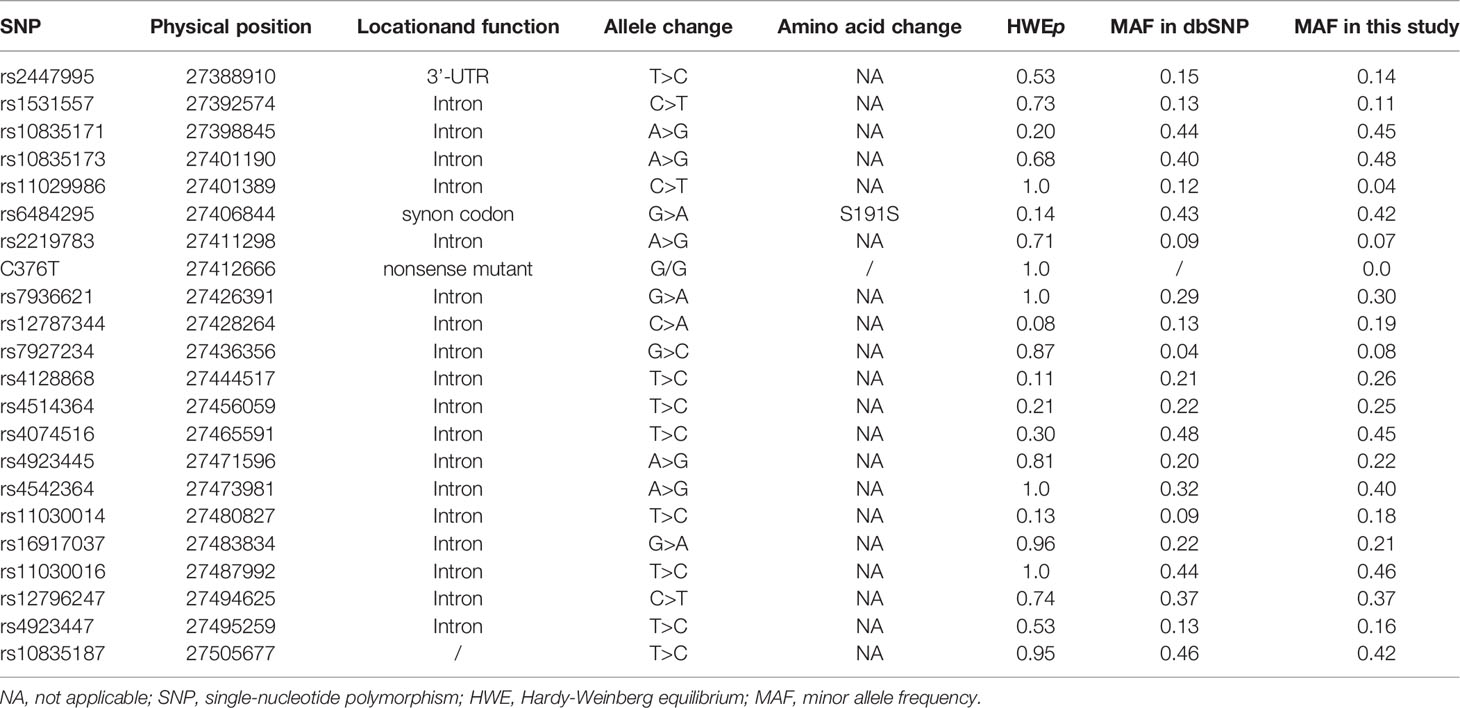
Table 2 Information of the analyzed LGR4 SNPs in this study.
We used the D’ values obtained from Haploview to identify five LD blocks in our study population, which ranged from 3 to 33 kb in size. The SNP rs4542364 had little LD with any of the other SNPs and, thus, could not be assigned to any block. The LD patterns of blocks 1–5 are shown in Figure 1. The blocks had D’ values ranging from 0.93 to 1.0. The results of our analysis using the PHASE software suggested the presence of different haplotypes in our population. The frequencies of haplotypes >1% were counted. The frequencies of haplotypes TC, CT, and CC in block 1 were 87.0%, 10.3%, and 2.5%, respectively (D′ = 0.978, r2 = 0.744), those of haplotypes AGG, GAA, AAG, and GAG in block 2 were 47.4%, 42.0%, 6.9%, and 3.6%, respectively (D′ = 1, 0.647 ≤ r2 ≤ 0.861), and those of haplotypes AGCGT, AAAGC, GACCC, and AACGT in block 3 were 69.6%, 18.8%, 6.8%, and 3.4%, respectively (0.949 ≤ D′ ≤ 1, 0.018 ≤ r2 ≤ 0.86). Moreover, those of haplotypes TCA, CTA, TTG, and TTA in block 4 were 44.4%, 25.6%, 21.7%, and 8.3%, respectively (D′ = 1, 0.095 ≤ r2 ≤ 0.27), and those of haplotypes TGTCTT, TACTTC, CGCCTC, TGCTCC, and TGTCTC in block 5 were 41.4%, 21.3%, 16.7%, 15.0%, and 4.6%, respectively (0.837 ≤ D′ ≤ 1, 0.028 ≤ r2 ≤ 0.828).
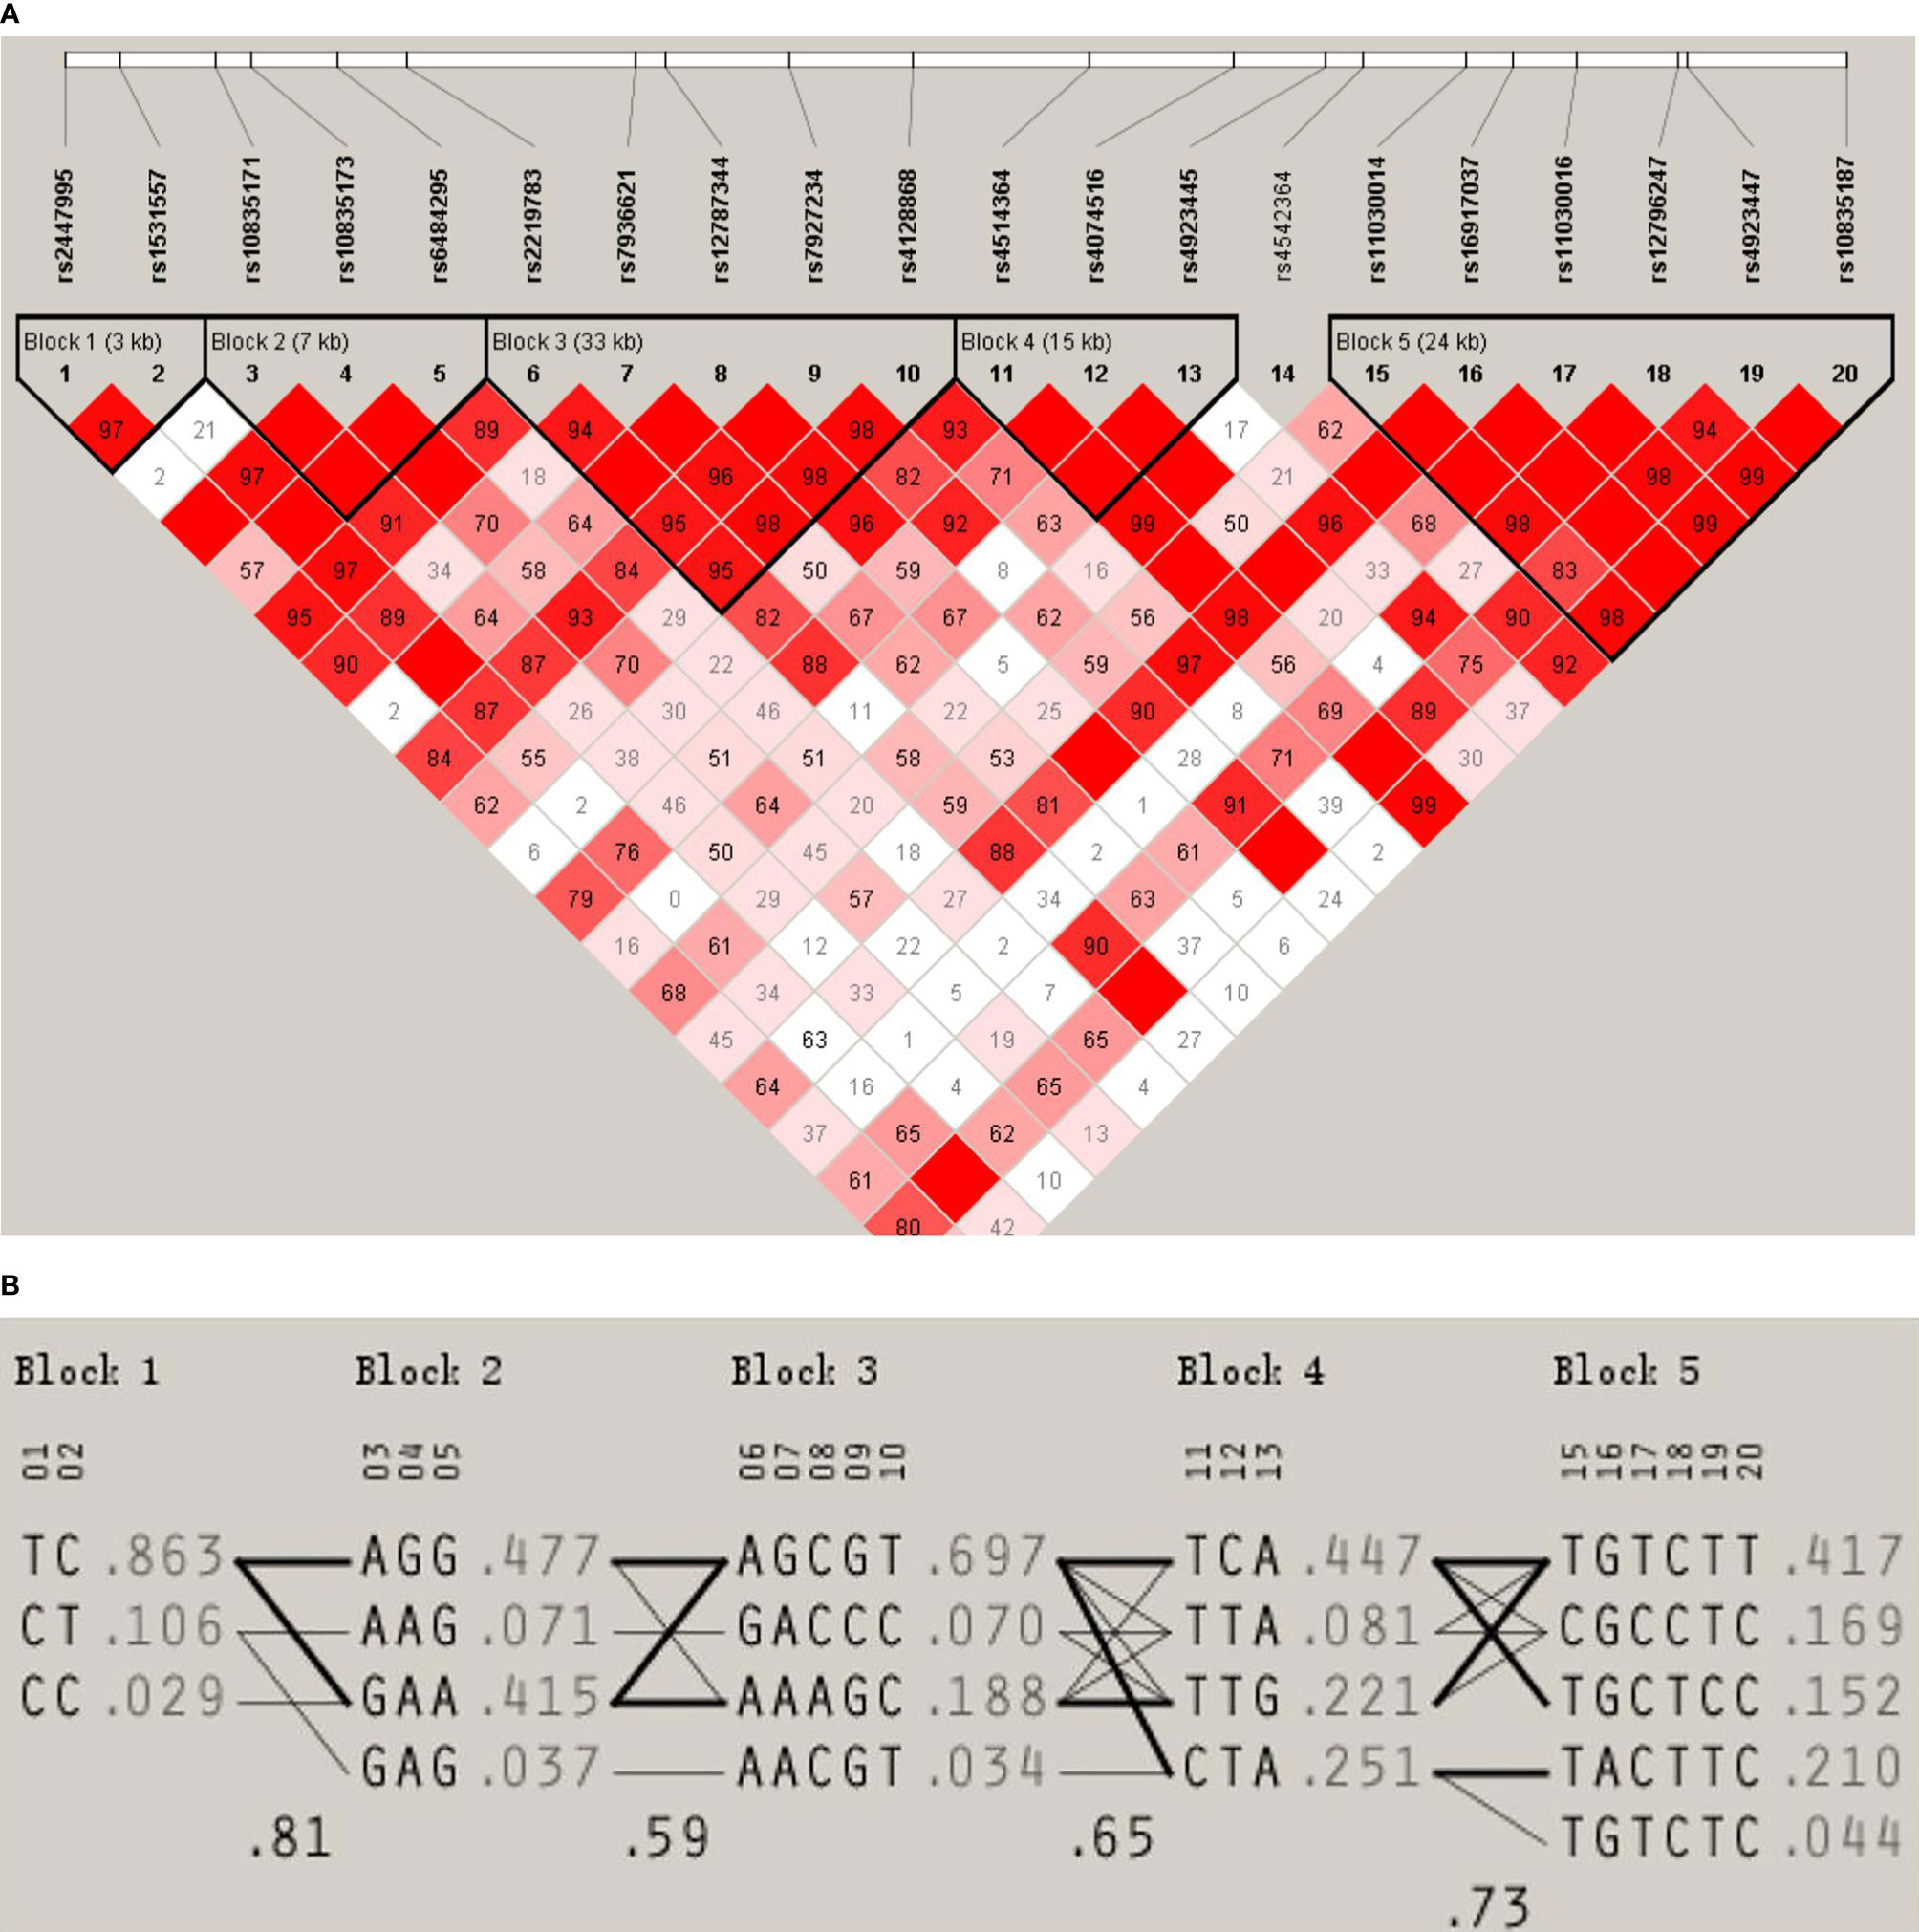
Figure 1 (A) LD pattern for the LGR4 gene. The LD block structure is described by Haploview. From white to red, the increase in color indicates an increase in the strength of the LD. The values in the cells are the pairwise degrees of the LD. (B) Haplotype frequencies of the LGR4 gene.
Association Between SNPs and Peak BMD/Body Composition
We used the QTDT program to analyze the association between the SNPs present in LGR4 and the peak BMD and obesity phenotypes in our female-offspring nuclear families. Totals of 152, 126, 281, 281, 285, 92, 238, 200, 96, 238, 215, 263, 215, 268, 178, 205, 274, 263, 171, and 272 informative nuclear families were included in our QTDT analyses of rs2447995, rs1531557, rs10835171, rs10835173, rs6484295, rs2219783, rs7936621, rs12787344, rs7927234, rs4128868, rs4514364, rs4074516, rs4923445, rs4542364, rs11030014, rs16917037, rs11030016, rs12796247, rs4923447, and rs1083518, respectively. At least one parent who was heterozygous was present in each of those families. The significant P-values of the SNPs obtained from the QTDT are shown in Table 3, and the non-significant P-values of the SNPs are shown in Table S1. We found evidence of population stratification for rs4074516 and femoral neck BMD (P = 0.048), rs4542364 and trunk fat mass (P = 9.00E-29), rs11030014 and lumbar spine BMD (P = 0.04), rs4923447 and TFM, PFM, and PLM (P = 0.041, 0.013, and 0.017, respectively), and rs10835187 and PFM and PLM (P = 0.040 and 0.03, respectively). Total associations were found between rs2447995 and trunk fat mass (P = 7.00E-29), rs10835173 and trunk fat mass (P = 7.00E-29), rs7936621 and femoral neck and total hip BMD and trunk fat mass (P = 0.003, 0.013, and 9.00E-29, respectively), rs1278734 and femoral neck BMD and trunk fat mass (P = 0.025 and 9.00E-29, respectively), rs1103001 and femoral neck, total hip, and lumbar spine BMD and trunk fat mass (P = 0.011, 0.024, 0.037, and 9.00E-29, respectively), rs16917037 and femoral neck BMD (P = 0.037), and rs10835187 and femoral neck and total hip BMD (P = 0.032 and 0.015, respectively). Our analyses conducted to detect within-family associations found significant associations between rs2447995 and trunk fat mass (P = 6.00E-29), rs10835173 and trunk fat mass (P = 6.00E-29), rs7936621 and femoral neck, total hip, and lumbar spine BMD (P = 0.031, 0.020, and 0.017, respectively), rs4128868 and trunk fat mass (P = 7.00E-29), and rs11030014 and trunk fat mass (P = 1.00E-28). To avoid bias caused by multiple tests, the P-values calculated for the within-family associations were obtained after performing 1,000 Monte Carlo permutations. After those permutations were completed, rs7936621 remained significantly associated with the BMD values for the femoral neck, total hip, and lumbar spine (P = 0.038, 0.029, and 0.031, respectively), while rs10835171 and rs6484295 were significantly associated with trunk fat mass (P = 0.045) and BMI (P = 0.043).
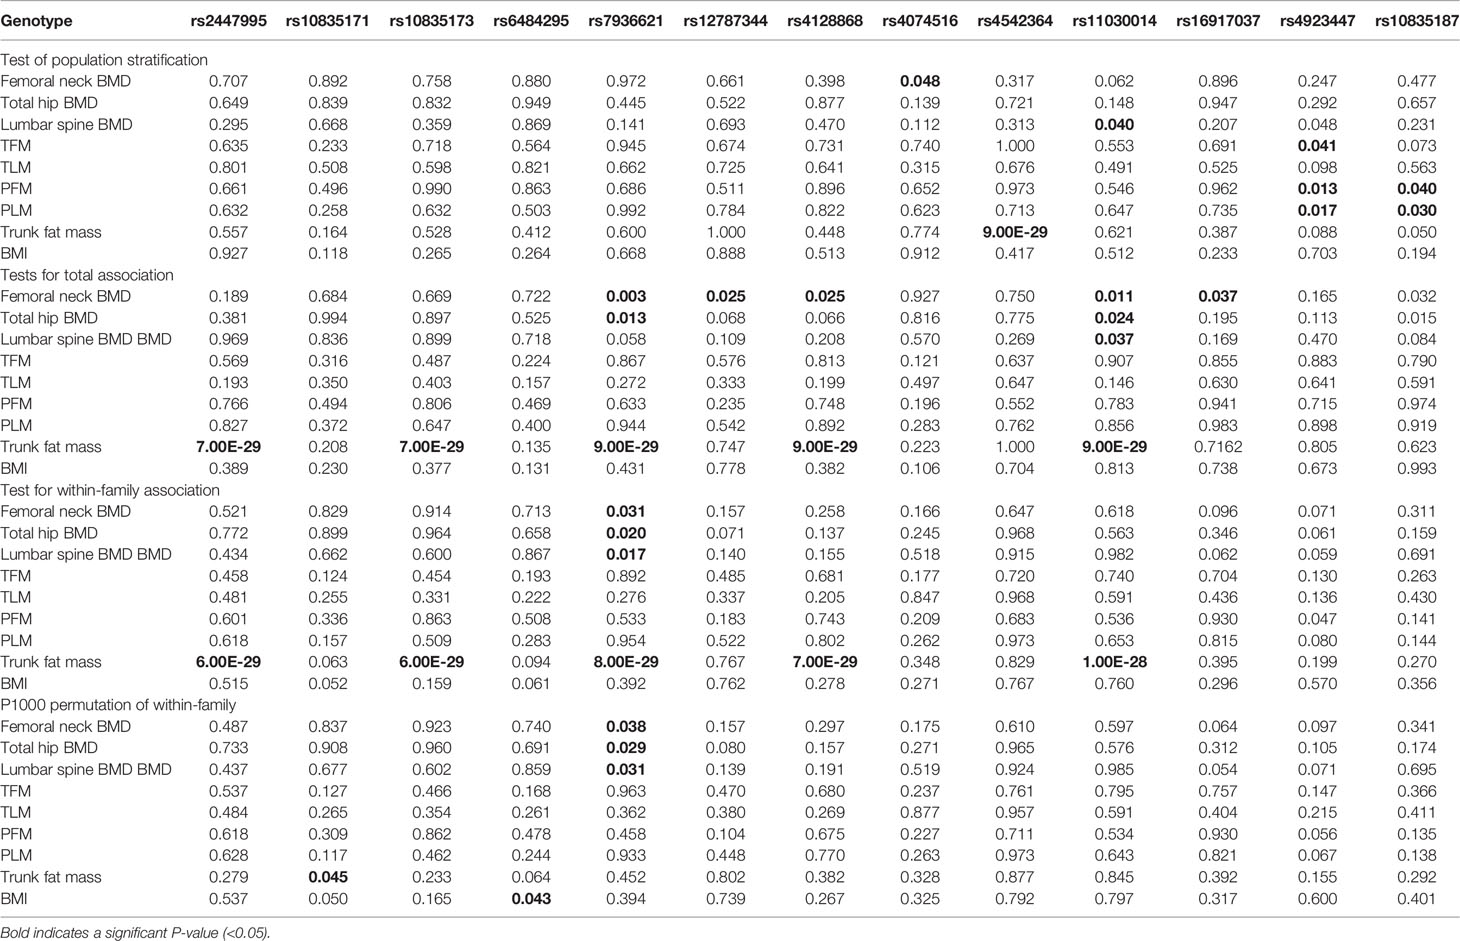
Table 3 QTDT results regarding the associations between the single nucleotide polymorphisms and phenotypic variations.
Association Between Haplotypes and Peak BMD/Body Composition
The genotype data obtained from our SNP analysis were used to perform a haplotype analysis that identified groups of three, four, four, four, and five haplotypes in blocks 1, 2, 3, 4, and 5, respectively; these haplotypes accounted for 99.8%, 99.9%, 98.6%, 100%, and 99.0%, respectively, of the unrelated parents in the blocks. We next used the QTDT program to examine how different haplotypes might be associated with peak BMD and obesity phenotypes. Totals of 43, 126, and 149 informative families were used for the QTDT of haplotypes CC, CT, and TC in block 1, respectively; 48, 288, 284, and 90 informative families were used for the QTDT of haplotypes GAC, GAA, AGG, and AAG in block 2, respectively; and 240, 45, 204, and 86 informative families were used for the QTDT of haplotypes AGCGT, AACGT, AAAGC, and GACCC in block 3, respectively, Moreover, 215, 112, 215, and 267 informative families were used for the QTDT of haplotypes CTA, TTA, TTG, and TCA in block 4, respectively, and 163, 57, 277, 205, and 174 informative families were used for the QTDT of haplotypes TGCTCC, TGTCTC, TGTCTT, TACTTC, and CGCCTC in block 5, respectively. Haplotype TGTCTT in block 5 showed significant degrees of population stratification with TFM, PFM, PLM, and trunk fat mass (P = 0.022, 0.014, 0.011, and 0.023, respectively). We also found significant total associations between trunk fat mass and haplotypes CC, CT, and TC in block 1 (P = 1.00E-28, 9.00E-29, and 6.00E-29, respectively), between AGCGT in block 3 and both femoral neck and total hip BMD (P = 0.009 and 0.026, respectively), between TGTCTT and total hip BMD (P = 0.029), between TACTTC and femoral neck BMD (P = 0.027), and between CGCCTC and femoral neck, total hip, and lumbar spine BMD in block 5 (P = 0.013, 0.031, and 0.038, respectively). Significant within-family associations were detected between trunk fat mass and haplotypes CC, CT, and TC in block 1 (P = 1.00E-28, 7.00E-29, and 5.00E-29, respectively), between GAA in block 2 and both BMI and trunk fat mass (P = 0.031 and 0.043, respectively), between AGCGT in block 3 and total hip BMD (P = 0.032), between GACCC in block 3 and trunk fat mass (P = 0.049), between TTA in block 4 and TFM (P = 0.033), between TGCTCC in block 5 and both femoral neck and total hip BMD (P = 0.015 and 0.041, respectively), and between TACTTC in block 5 and lumbar spine BMD (P = 0.040). Furthermore, after 1,000 permutations had been performed, significant within-family associations remained between GAA in block 2 and both trunk fat mass and BMI (P = 0.027 and 0.019, respectively), between AGCGT in block 3 and total hip BMD (P = 0.043), between TGCTCC in block 5 and femoral neck BMD (P = 0.025), and between TACTTC in block 5 and both femoral neck and lumbar spine BMD (P = 0.024 and 0.037, respectively). In contrast, no significant within-family associations after 1,000 permutations were found in either block 1 or block 4. The significant haplotype P-values obtained with the QTDT are listed in Table 4, and the non-significant P-values are listed in Table S2.
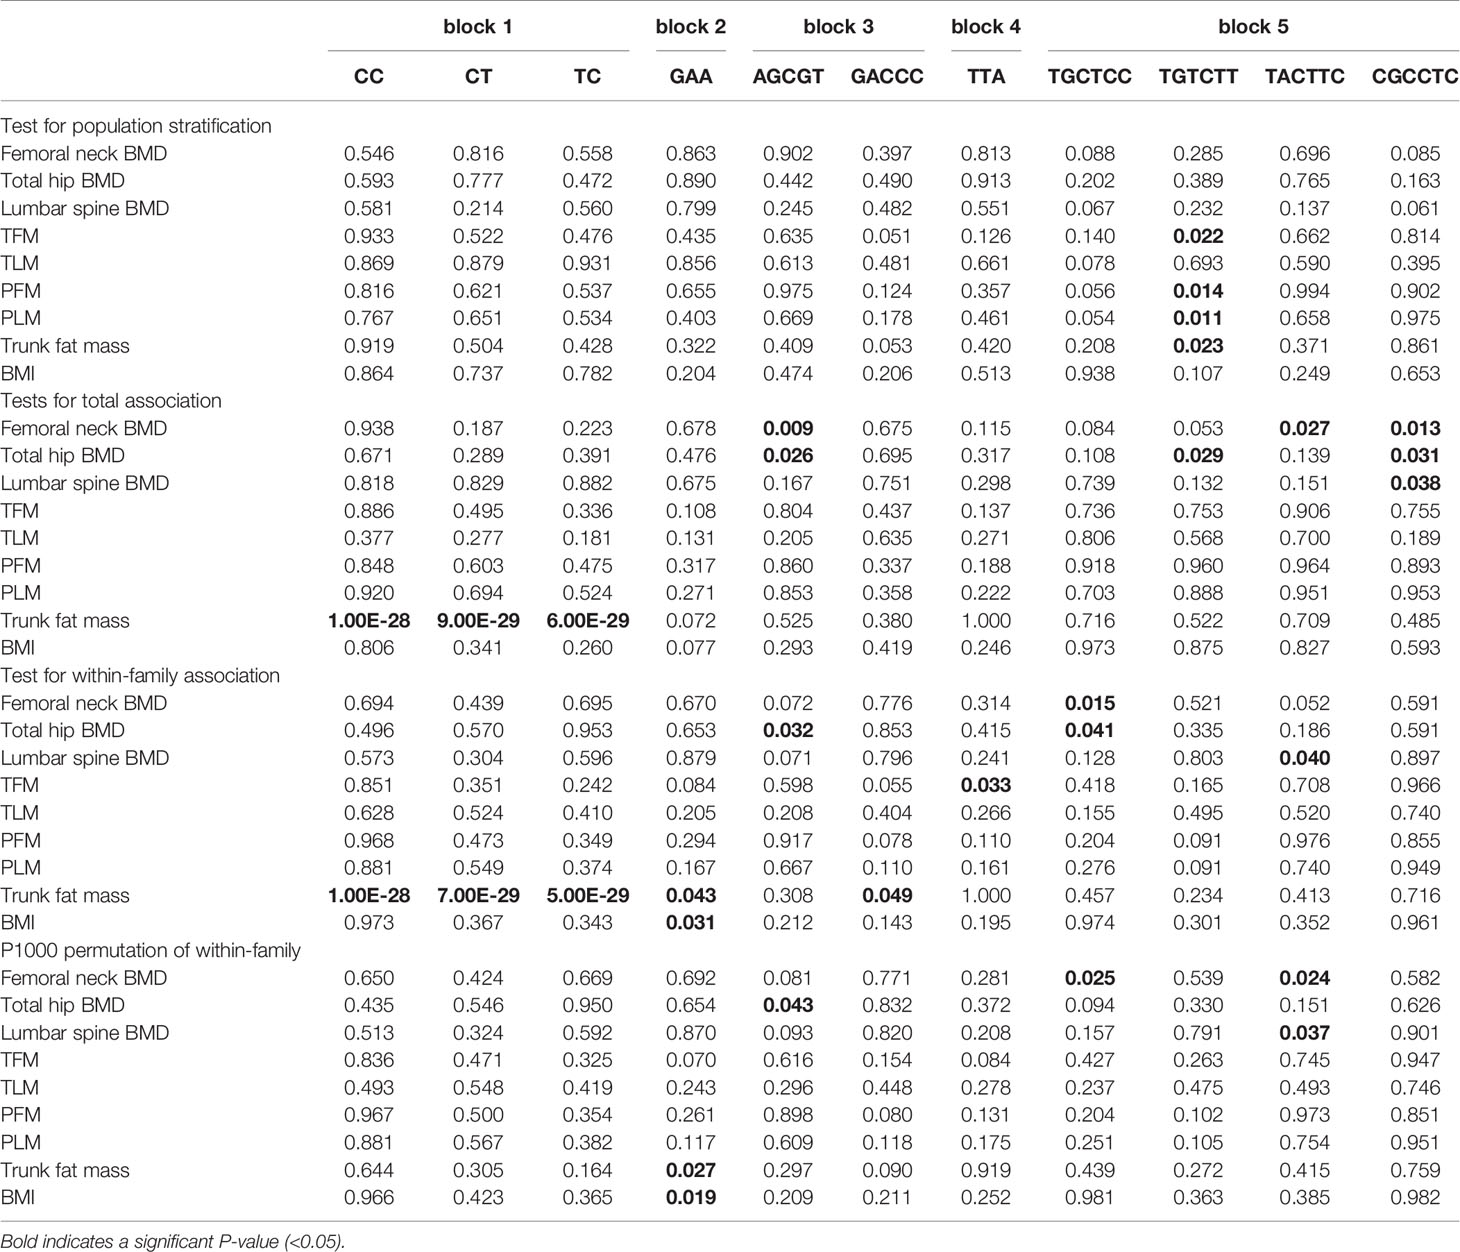
Table 4 QTDT results for the associations between the haplotype and phenotype variations.
Discussion
Few studies have examined the association between LGR4 gene polymorphisms and osteoporosis and obesity phenotypes. In 2013, Styrkarsdottir et al. (21) reported the presence of a nonsense mutation [c.376C>T (p.R126X)] in the LCR4 gene of an Icelandic population. This mutation resulted in the production of a truncated and non-functional LGR4 protein, with the resultant physiological effect being a reduction in peak bone mass instead of an increased rate of bone loss, related to increasing age. Luo et al. (37) found that LGR4-/-and LGR4 CKO mice exhibit low levels of BMD, and a subsequent morphometric study showed that the mean number, size, and surface area of the mouse osteoclasts as well as the amounts of eroded bone surface area in those mice were all significantly higher compared with those parameters in the control mice. These investigators also proposed that LGR4 and RANK compete for RANKL binding sites on osteoclasts; thus, LGR4 inhibits osteoclast differentiation and bone tissue remodeling. In contrast, LGR4 appears to function differently in osteoblasts, where it acts through the cAMP-PKA-CREB pathway to regulate ATF4 expression levels. Thus, LGR4 promotes both the differentiation of osteoblasts and the formation of new bone tissue (38). Based on those studies, we focused on examining whether LGR4 SNPs could affect BMD in humans. However, none of our study subjects carried the c.376C>T mutation, consistent with results reported by Zou et al. (23). Our study found significant associations between the polymorphism rs7936621 and the BMD values for the femoral neck, total hip, and lumbar spine. An examination of the haplotype associations in five blocks with BMD values revealed strong associations between haplotype AGCGT in block 3 and total hip BMD, haplotype TGCTCC in block 5 and femoral neck BMD, and haplotype TACTTC in block 5 and both femoral neck and lumbar spine BMD. Based on this biological and statistical evidence, we propose that LGR4 plays a role in regulating BMD or the osteoporotic process.
Additionally, an in vitro study showed that LGR4 ablation potentiates the white-to-brown fat transition that occurs in areas of visceral fat. Meanwhile, a significant correlation has been identified between the LGR4 c.2248G>A variant and both the waist circumference and waist-to-height ratio of young individuals as well as the amount of abdominal visceral fat in young obese subjects (23). Our study identified an association between rs10835171 and trunk fat mass as well as between rs6484295 and BMI, and our Haploview analysis showed that both of these SNPs were located in block 2. We also found that haplotype GAA in block 2 displayed significant within-family associations with trunk fat mass and BMI. Moreover, rs10835172, which is near rs10831571 and was found in block 2, has been reported to significantly correlate with BMI in Chinese individuals (22). In fact, we also observed a relationship between LGR4 SNPs and appendicular fat mass but did not find any association between them. Therefore, we can suppose that either rs10835171 and rs6484295 by themselves or the region around them in block 2 may influence fat metabolism, especially central obesity, which is a known risk factor for both metabolic syndrome and type 2 diabetes. Further studies are required to elucidate how these SNPs may alter protein function and contribute to human central obesity.
This study has several strengths worth mentioning. First, to ensure a comprehensive analysis of the entire LGR4 gene, we chose to study all 21 of its tagSNPs instead of only a small subset of the SNPs. Second, we chose peak BMD as the osteoporosis phenotype for examination, as this parameter is believed to be genetically controlled. Moreover, a larger number of phenotypes related to obesity were examined in this study than in previous studies. In addition to BMI, our study also examined other parameters including TFM, TLM, PFM, PLM, and trunk fat mass. A recent study showed that trunk fat mass as measured by DAX can be a reliable indicator of total abdominal fat (39), which is closely associated with various metabolic and cardiovascular diseases (38, 40). Third, due to the large number of Chinese nuclear families included in our study, our QTDT analysis was able to identify 281, 285, 288, 240, 205, and 163 informative nuclear families suitable for transition disequilibrium analysis at rs1083517, rs6484295, and haplotype GAA in block 2, haplotype AGCGT in block 3, TGCTCC in block 5, and haplotype TACTTC in block 5, respectively. This large sample size enhances the validity of our results. However, the study also has limitations that should be mentioned: First, DAX cannot distinguish between trunk subcutaneous and visceral mass. Second, information concerning the effects of environmental factors such as dietary fat intake and physical exercise, as well as the reproductive history (number of pregnancies, number of children and duration of breastfeeding), years since menopause, physical activity, estrogen replacement therapy or calcium supplements is lacking.
In conclusion, we identified common polymorphisms and haplotypes of LGR4 that are associated with peak BMD, trunk fat mass, and BMI in young Chinese females.
Data Availability Statement
The original contributions presented in the study are publicly available. This data can be found here: https://www.ncbi.nlm.nih.gov/SNP/snp_viewTable.cgi?handle=LGR4-SNP.
Ethics Statement
The study protocol was reviewed and approved by the Shanghai Jiao Tong University Affiliated Sixth People’s Hospital Ethics Committee. Written informed consent to participate in this study was provided by the participants’ legal guardian/next of kin.
Author Contributions
S-qS, L-lZ and Z-lZ conceived the idea and conceptualized the study. S-sL,X-yZ, ZW, W-zF and J-wH collected the data. ML and Y-qH analyzed the data. S-qS, L-lZ, and Z-lZ drafted the manuscript. All authors contributed to the article and approved the submitted version.
Funding
This study was supported by the National Natural Science Foundation of China (81370978) and the Science and Technology Commission of Shanghai Municipality (16411954500). The funding body had no role in the design of the study and collection, analysis, and interpretation of data and in writing the manuscript.
Conflict of Interest
The authors declare that the research was conducted in the absence of any commercial or financial relationships that could be construed as a potential conflict of interest.
Publisher’s Note
All claims expressed in this article are solely those of the authors and do not necessarily represent those of their affiliated organizations, or those of the publisher, the editors and the reviewers. Any product that may be evaluated in this article, or claim that may be made by its manufacturer, is not guaranteed or endorsed by the publisher.
Supplementary Material
The Supplementary Material for this article can be found online at: https://www.frontiersin.org/articles/10.3389/fendo.2021.656077/full#supplementary-material
References
1. Nayak NK, Khedkar CC, Khedkar GD, Khedkar CD. Osteoporosis. In: Caballero B, Paul F, Toldra F, editors. Encyclopedia of Food and Health. Oxford, Academic Press (2016). p. 181–5. Available at: https://www.sciencedirect.com/science/article/pii/B9780123849472005079.
2. Slemenda CW, Turner CH, Peacock M, Christian JC, Sorbel J, Hui SL, et al. The Genetics of Proximal Femur Geometry, Distribution of Bone Mass and Bone Mineral Density. Osteoporos Int (1996) 6:178–82. doi: 10.1007/BF01623944
3. Arden NK, Baker J, Hogg C, Baan K, Spector TD. The Heritability of Bone Mineral Density, Ultrasound of the Calcaneus and Hip Axis Length: A Study of Postmenopausal Twins. J Bone Miner Res (1996) 11:530–4. doi: 10.1002/jbmr.5650110414
4. Smith DM, Nance WE, Kang KW, Christian JC, Johnston CC. Genetic Factors in Determining Bone Mass. J Clin Invest (1973) 52:2800–8. doi: 10.1172/JCI107476
6. Maes HH, Neale MC, Eaves LJ. Genetic and Environmental Factors in Relative Body Weight and Human Adiposity. Behav Genet (1997) 27:325–51. doi: 10.1023/A:1025635913927
7. Hannan MT, Felson DT, Anderson JJ. Bone Mineral Density in Elderly Men and Women: Results From the Framingham Osteoporosis Study. J Bone Miner Res (1992) 7:547–53. doi: 10.1002/jbmr.5650070511
8. Cao JJ. Effects of Obesity on Bone Metabolism. J Orthop Surg Res (2011) 6:30. doi: 10.1186/1749-799X-6-30
9. Kameda T, Mano H, Yuasa T, Mori Y, Miyazawa K, Shiokawa M, et al. Estrogen Inhibits Bone Resorption by Directly Inducing Apoptosis of the Bone-Resorbing Osteoclasts. J Exp Med (1997) 186:489–95. doi: 10.1084/jem.186.4.489
10. Bradford PG, Gerace KV, Roland RL, Chrzan BG. Estrogen Regulation of Apoptosis in Osteoblasts. Physiol Behav (2010) 99:181–5. doi: 10.1016/j.physbeh.2009.04.025
11. Magni P, Dozio E, Galliera E, Ruscica M, Corsi MM. Molecular Aspects of Adipokine-Bone Interactions. Curr Mol Med (2010) 10:522–32. doi: 10.2174/1566524011009060522
12. Tilg H, Moschen AR. Inflammatory Mechanisms in the Regulation of Insulin Resistance. Mol Med (2008) 14:222–31. doi: 10.2119/2007-00119.Tilg
13. Hotamisligil GS. Inflammation and Metabolic Disorders. Nature (2006) 444:860–7. doi: 10.1038/nature05485
14. Gómez-Ambrosi J, Rodríguez A, Catalán V, Frühbeck G. The Bone-Adipose Axis in Obesity and Weight Loss. Obes Surg (2008) 18:1134–43. doi: 10.1007/s11695-008-9548-1
15. Deng FY, Lei SF, Li MX, Jiang C, Dvornyk V, Deng HW. Genetic Determination and Correlation of Body Mass Index and Bone Mineral Density at the Spine and Hip in Chinese Han Ethnicity. Osteoporos Int (2006) 17:119–24. doi: 10.1007/s00198-005-1930-4
16. Gu JM, Xiao WJ, He JW, Zhang H, Hu WW, Hu YQ, et al. Association Between VDR and ESR1 Gene Polymorphisms With Bone and Obesity Phenotypes in Chinese Male Nuclear Families. Acta Pharmacol Sin (2009) 30:1634–42. doi: 10.1038/aps.2009.169
17. Guo Y, Liu H, Yang TL, Li SM, Li SK, Tian Q, et al. The Fat Mass and Obesity Associated Gene, FTO, Is Also Associated With Osteoporosis Phenotypes. PloS One (2011) 6:e27312. doi: 10.1371/journal.pone.0027312
18. Loh ED, Broussard SR, Kolakowski LF. Molecular Characterization of a Novel Glycoprotein Hormone G-Protein-Coupled Receptor. Biochem Biophys Res Commun (2001) 282:757–64. doi: 10.1006/bbrc.2001.4625
19. Weng J, Luo J, Cheng X, Jin C, Zhou X, Qu J, et al. Deletion of G Protein-Coupled Receptor 48 Leads to Ocular Anterior Segment Dysgenesis (ASD) Through Down-Regulation of Pitx2. Proc Natl Acad Sci USA (2008) 105:6081–6. doi: 10.1073/pnas.0708257105
20. Zhu C, Zheng XF, Yang YH, Li B, Wang YR, Jiang SD, et al. LGR4 Acts as a Key Receptor for R-Spondin 2 to Promote Osteogenesis Through Wnt Signaling Pathway. Cell Signal (2016) 28:989–1000. doi: 10.1016/j.cellsig.2016.04.010
21. Styrkarsdottir U, Thorleifsson G, Sulem P, Gudbjartsson DF, Sigurdsson A, Jonasdottir A, et al. Nonsense Mutation in the LGR4 Gene Is Associated With Several Human Diseases and Other Traits. Nature (2013) 497:517–20. doi: 10.1038/nature12124
22. Wang J, Liu R, Wang F, Hong J, Li X, Chen M, et al. Ablation of LGR4 Promotes Energy Expenditure by Driving White-to-Brown Fat Switch. Nat Cell Biol (2013) 15:1455–63. doi: 10.1038/ncb2867
23. Zou Y, Ning T, Shi J, Chen M, Ding L, Huang Y, et al. Association of a Gain-of-Function Variant in LGR4 With Central Obesity. Obes (Silver Spring) (2017) 25:252–60. doi: 10.1002/oby.21704
24. Wang C, Hu YM, He JW, Gu JM, Zhang H, Hu WW, et al. Association Between Low Density Lipoprotein Receptor-Related Protein 2 Gene Polymorphisms and Bone Mineral Density Variation in Chinese Population. PloS One (2011) 6:e28874. doi: 10.1371/journal.pone.0028874
25. Ke YH, Xiao WJ, He JW, Zhang H, Yu JB, Hu WW, et al. Association of ALOX15 Gene Polymorphisms With Obesity-Related Phenotypes in Chinese Nuclear Families With Male Offspring. Acta Pharmacol Sin (2012) 33:201–7. doi: 10.1038/aps.2011.167
26. Xiao WJ, He JW, Zhang H, Hu WW, Gu JM, Yue H, et al. ALOX12 Polymorphisms Are Associated With Fat Mass But Not Peak Bone Mineral Density in Chinese Nuclear Families. Int J Obes (Lond) (2011) 35:378–86. doi: 10.1038/ijo.2010.157
27. Xiao WJ, Ke YH, He JW, Zhang H, Yu JB, Hu WW, et al. Polymorphisms in the Human ALOX12 and ALOX15 Genes Are Associated With Peak Bone Mineral Density in Chinese Nuclear Families. Osteoporos Int (2012) 23:1889–97. doi: 10.1007/s00198-011-1835-3
28. Yue H, He JW, Zhang H, Wang C, Hu WW, Gu JM, et al. Contribution of Myostatin Gene Polymorphisms to Normal Variation in Lean Mass, Fat Mass and Peak BMD in Chinese Male Offspring. Acta Pharmacol Sin (2012) 33:660–7. doi: 10.1038/aps.2012.12
29. Yue H, He JW, Zhang H, Hu WW, Hu YQ, Li M, et al. No Association Between Polymorphisms of Peroxisome [Corrected] Proliferator-Activated Receptor-Gamma Gene and Peak Bone Mineral Density Variation in Chinese Nuclear Families. Osteoporos Int (2010) 21:873–82. doi: 10.1007/s00198-009-1028-5
30. Zhao F, Gao LH, Li SS, Wei ZY, Fu WZ, He JW, et al. Association Between SNPs and Haplotypes in the METTL21C Gene and Peak Bone Mineral Density and Body Composition in Chinese Male Nuclear Families. J Bone Miner Metab (2017) 35:437–47. doi: 10.1007/s00774-016-0774-7
31. Stephens M, Scheet P. Accounting for Decay of Linkage Disequilibrium in Haplotype Inference and Missing-Data Imputation. Am J Hum Genet (2005) 76:449–62. doi: 10.1086/428594
32. Barrett JC, Fry B, Maller J, Daly MJ. Haploview: Analysis and Visualization of LD and Haplotype Maps. Bioinformatics (2005) 21:263–5. doi: 10.1093/bioinformatics/bth457
33. Abecasis GR, Cardon LR, Cookson WO. A General Test of Association for Quantitative Traits in Nuclear Families. Am J Hum Genet (2000) 66:279–92. doi: 10.1086/302698
34. Deng FY, Liu MY, Li MX, Lei SF, Qin YJ, Zhou Q, et al. Tests of Linkage and Association of the COL1A2 Gene With Bone Phenotypes' Variation in Chinese Nuclear Families. Bone (2003) 33:614–9. doi: 10.1016/S8756-3282(03)00234-5
35. Lau HH, Ng MY, Cheung WM, Paterson AD, Sham PC, Luk KD, et al. Assessment of Linkage and Association of 13 Genetic Loci With Bone Mineral Density. J Bone Miner Metab (2006) 24:226–34. doi: 10.1007/s00774-005-0676-6
36. McIntyre LM, Martin ER, Simonsen KL, Kaplan NL. Circumventing Multiple Testing: A Multilocus Monte Carlo Approach to Testing for Association. Genet Epidemiol (2000) 19:18–29. doi: 10.1002/1098-2272(200007)19:1<18::AID-GEPI2>3.0.CO;2-Y
37. Luo J, Zhou W, Zhou X, Li D, Weng J, Yi Z, et al. Regulation of Bone Formation and Remodeling by G-Protein-Coupled Receptor 48. Development (2009) 136:2747–56. doi: 10.1242/dev.033571
38. Freemantle N, Holmes J, Hockey A, Kumar S. How Strong Is the Association Between Abdominal Obesity and the Incidence of Type 2 Diabetes. Int J Clin Pract (2008) 62:1391–6. doi: 10.1111/j.1742-1241.2008.01805.x
39. Clasey JL, Bouchard C, Teates CD, Riblett JE, Thorner MO, Hartman ML, et al. The Use of Anthropometric and Dual-Energy X-Ray Absorptiometry (DXA) Measures to Estimate Total Abdominal and Abdominal Visceral Fat in Men and Women. Obes Res (1999) 7:256–64. doi: 10.1002/j.1550-8528.1999.tb00404.x
Keywords: LGR4, SNP, osteoporosis, obesity, peak bone mineral density, fat mass, QTDT
Citation: Shi S-q, Li S-s, Zhang X-y, Wei Z, Fu W-z, He J-w, Hu Y-q, Li M, Zheng L-l and Zhang Z-l (2021) LGR4 Gene Polymorphisms Are Associated With Bone and Obesity Phenotypes in Chinese Female Nuclear Families. Front. Endocrinol. 12:656077. doi: 10.3389/fendo.2021.656077
Received: 25 January 2021; Accepted: 14 June 2021;
Published: 11 October 2021.
Edited by:
Ling-Qing Yuan, Central South University, ChinaReviewed by:
Patricia Canto, Universidad Nacional Autónoma de México, MexicoXi-Yu Wu, Central South University, China
Copyright © 2021 Shi, Li, Zhang, Wei, Fu, He, Hu, Li, Zheng and Zhang. This is an open-access article distributed under the terms of the Creative Commons Attribution License (CC BY). The use, distribution or reproduction in other forums is permitted, provided the original author(s) and the copyright owner(s) are credited and that the original publication in this journal is cited, in accordance with accepted academic practice. No use, distribution or reproduction is permitted which does not comply with these terms.
*Correspondence: Zhen-lin Zhang, zhangzl@sjtu.edu.cn; Li-li Zheng, zhenglily921@21cn.com