 Jiamei Le1,2
 Yi Fu1,2
 Qiuqin Han1,2
 Xindong Wei1,3
 Houlin Ji1,4
 Yifan Chen1,2
 Qiuying Wang1,2
 Peixian Pi1,2
 Jilei Li1,2
 Xinjie Lin1,2
 Xiaoying Zhang5
 Yong Zhang5
 Jianping Ye5,6,7*
- 1Shanghai University of Medicine & Health Sciences Affiliated Zhoupu Hospital, Shanghai, China
- 2Shanghai Key Laboratory of Molecular Imaging, Collaborative Innovation Center for Biomedicine, Shanghai University of Medicine & Health Sciences, Shanghai, China
- 3Department of Surgical Oncology, Nanjing University of Chinese Medicin Affiliated 81st Hospital, Nanjing, China
- 4Graduate School, Shanghai University of Traditional Chinese Medicine, Shanghai, China
- 5Metabolic Disease Research Center, Zhengzhou Central Hospital Affiliated to Zhengzhou University, Zhengzhou, China
- 6Center for Advanced Medicine, College of Medicine, Zhengzhou University, Zhengzhou, China
- 7Shanghai Diabetes Institute, Shanghai Jiaotong University Affiliated Sixth People’s Hospital, Shanghai, China
Metformin (MET), the most common medicine for type 2 diabetes (T2DM), improves insulin sensitivity by targeting the liver, intestine and other organs. Its impact on expression of the solute carrier (Slc) transporter genes have not been reported in the mechanism of insulin sensitization. In this study, we examined Slc gene expression in the liver and colon of diet-induced obese (DIO) mice treated with MET by transcriptomic analysis. There were 939 differentially expressed genes (DEGs) in the liver of DIO mice vs lean mice, which included 34 Slc genes. MET altered 489 DEGs in the liver of DIO mice, in which 23 were Slc genes. Expression of 20 MET-responsive Slc DEGs was confirmed by qRT-PCR, in which 15 Slc genes were altered in DIO mice and their expressions were restored by MET, including Slc2a10, Slc2a13, Slc5a9, Slc6a14, Slc7a9, Slc9a2, Slc9a3, Slc13a2, Slc15a2, Slc26a3, Slc34a2, Slc37a1, Slc44a4, Slc51b and Slc52a3. While, there were only 97 DEGs in the colon of DIO mice with 5 Slc genes, whose expression was not restored by MET. The data suggest that more genes were altered in the liver over the colon by the high fat diet (HFD). There were 20 Slc genes with alteration confirmed in the liver of DIO mice and 15 of them were restored by MET, which was associated with improvement of insulin sensitivity and obesity. The restoration may improve the uptake of glucose, amino acids, mannose, fructose, 1,5-anhydro-D-glucitol and bumetanide in hepatocytes of the liver of DIO mice. The study provides new insight into the mechanism of metformin action in insulin sensitization and obesity.
Introduction
Metformin (MET), a guanidine derivative initially extracted from the plant Galega officinalis (French lilac), is the first-line medicine in the treatment of type 2 diabetes (T2DM) (1). In addition, MET activity has been reported in the treatment of many other diseases, such as cancer, obesity, nonalcoholic fatty liver disease (NAFLD) and inflammation (2). In the treatment of T2DM, MET is considered to act in the liver by inhibition of gluconeogenesis through a couple of mechanisms, such as inhibition of mitochondrial redox shuttle (3), suppression of the Complex I of mitochondrial respiratory chain (4), activation of the cellular energy sensor AMP-activated protein kinase (AMPK) (5). Additionally, MET is reported to act in the intestine to regulate bile acids (6), microbiota (7) and GLP-1 secretion (8) in the improvement of insulin sensitivity. However, the relative importance of liver and intestine remains to be established in the mechanism of insulin sensitization by MET.
Solute carrier (Slc) proteins are a group of transmembrane transporters that mediate solute influx and efflux across the plasma and intracellular membranes. The members of Slc5, Slc13, Slc16, Slc25, and Slc30 families, which are studied in the liver, intestine, pancreas, skeletal muscle, adrenal glands, adipose tissue, etc., have been linked to the metabolic disease, such as obesity, NAFLD and T2DM in human and mouse studies (9). It was reported that Slc22A1, Slc22A2, Slc22A3, Slc47A1 played an important role in the kidney, fat and liver for bioavailability, clearance, and pharmacological action of metformin in T2DM (10–12). However, systemic examination of Slc genes has not been reported in obesity.
MET inhibits hepatic gluconeogenesis through a direct action in hepatocytes. It is up taken by the organic cation transporters (Slc22A1 and Slc22A3) and secreted to the bile through an efflux transporter (Slc47A1). DNA methylation of these transporter genes (Slc22A1, Slc22A 3 and Slc47A1) are reduced by MET in the human liver, and increased by hyperglycemia and obesity (13). Metformin increases free fatty acid (FFA) uptake under hypoxic conditions, partially through up-regulation of fatty acid transporter Slc27A4 gene expression in the rat L6 skeletal muscle cells (14). However, an impact of MET in expression of the Slc transporters has not been examined extensively using transcriptome in the liver and colon. In this study, we systematically investigated the MET impact in the liver and colon of DIO mice using transcriptomic analysis, and provided new insight into the mechanism of metformin action in Slc mRNA expression.
Materials and Methods
Animals and Materials
Male C57BL/6J mice at 8 weeks of age (SPF grade) were obtained from the Shanghai Slac Laboratory Animal Co. Ltd. (Shanghai, China). The mice were kept in the animal facility of Shanghai Jiao Tong University with a controlled temperature (20 ± 2°C), humidity (60 ± 5%) and a 12 h dark/light cycle. The control mice were fed a regular chow diet (NCD mice, n=10, A5002,13.5% Kcal from fat, Shanghai Slac Laboratory Animal Co. Ltd). A total of 20 mice were fed on HFD (# D12492, 60% Kcal from fat, Research diets) for 16 weeks to generate DIO mice as previously described (15). The DIO mice were divided randomly into 2 groups: the HFD control group (HFD mice, n=10) and the MET treated HFD group (HFD+MET mice, n=10). MET was administrated at 100 mg/kg/day through the drinking water. MET (metformin hydrochloride) was purchased from Sigma-Aldrich Co. Ltd. (Shanghai, China). The mice were treated with MET for 8 weeks.
At the end of the treatment, the mice were subjected to tissue collection under anesthesia with intraperitoneal injection of pentobarbital (35 mg/kg). Orbital bleeding was applied in the blood collection. Serum was isolated by centrifugation at 3000 g at 4°C for 10 min and stored at −80°C until the biochemical assays. The mice were sacrificed by cervical dislocation after blood collection. The visceral adipose tissues, livers and colons were collected from the animals and immediately weighed. The samples were flushed with phosphate-buffered saline (PBS, pH7.4) and instantly frozen in liquid nitrogen and then stored at −80°C until subsequent analysis. The animal experiments were conducted in accordance with the protocol approved by the Institutional Animal Care and Use Committee (IACUC) of Shanghai Jiao Tong University. Other chemicals were purchased from Sigma-Aldrich Co. Ltd. (Shanghai, China) unless stated otherwise.
Histological Analysis
The livers were fixed in 10% phosphate-buffered formalin acetate at 4°C overnight and embedded in paraffin wax. Paraffin sections (5 μm) were cut and mounted on glass slides for hematoxylin and eosin (H&E) staining. Cryosections of the livers were stained by oil red O and counterstained with hematoxylin to visualize the lipid droplets.
Glucose Tolerance Test and Insulin Tolerance Test
Glucose tolerance test (GTT) and Insulin tolerance test (ITT) were respectively performed in the mice after 16 h fasting with peritoneal injection of glucose (2 g/kg) and 6 h fasting with peritoneal injection of insulin (1 U/kg). Blood glucose was tested in the tail vein blood at 0, 15, 30, 60, and 120 min using a One Touch glucometer (ACCU-CHEK® performa, Roche).
Insulin Sensitivity and Blood Lipids
The insulin sensitivity index HOMA-IR [=fasting insulin (mU/l) × fasting glucose (mmol/l)/22.5] was calculated according to the fasting insulin and glucose concentration as previously described (15). Blood lipid profile was examined for serum triglyceride, total cholesterol, high-density lipoprotein cholesterol, and low-density lipoprotein cholesterol using an autoanalyzer (Hitachi 7600-020, automatic analyzer).
RNA Extraction
Total RNA from liver and colon were extracted using Trizol reagent kit (Invitrogen, Carlsbad, CA, USA) according to manual instruction. About 60 mg of tissues were ground into powder by liquid nitrogen in a 2 mL tube, followed by being homogenized for 2 minutes and rested horizontally for 5 minutes. The mix was centrifuged for 5 minutes at 12,000×g at 4°C, then the supernatant was transferred into a new EP tube with 0.3 mL chloroform/isoamyl alcohol (24:1). The mix was shacked vigorously for 15s, and then centrifuged at 12,000×g for 10 minutes at 4°C. After centrifugation, the upper aqueous phase where RNA remained was transferred into a new tube with equal volume of supernatant of isopropyl alcohol, then centrifuged at 13,600 rpm for 20 minutes at 4°C. After deserting the supernatant, the RNA pellet was washed twice with 1 mL 75% ethanol, then the mix was centrifuged at 13,600 rpm for 3 minutes at 4°C to collect residual ethanol, followed by the pellet air dry for 5-10 minutes in the biosafety cabinet. Finally, 25μL~100μL of DEPC-treated water was added to dissolve the RNA. Subsequently, total RNA was qualified and quantified using a Nano Drop and Agilent 2100 bioanalyzer (Thermo Fisher Scientific, MA, USA).
mRNA Library Construction and Sequencing
Oligo(dT)-attached magnetic beads were used to purified mRNA. Purified mRNA was fragmented into small pieces with fragment buffer at appropriate temperature. Then First-strand cDNA was generated using random hexamer-primed reverse transcription, followed by a second-strand cDNA synthesis. afterwards, A-Tailing Mix and RNA Index Adapters were added by incubating to end repair. The cDNA fragments obtained from previous step were amplified by PCR, and products were purified by Ampure XP Beads, then dissolved in EB solution. The product was validated on the Agilent Technologies 2100 bioanalyzer for quality control. The double stranded PCR products from previous step were heated denatured and circularized by the splint oligo sequence to get the final library. The single strand circle DNA (ssCir DNA) was formatted as the final library. The final library was amplified with phi29 to make DNA nanoball (DNB) which had more than 300 copies of one molecular, DNBs were loaded into the patterned nanoarray and pair end 100 bases reads were generated on BGIseq500 platform (BGI-Shenzhen, China).
RNA-Seq Data Quality Analysis
In order to ensure data quality for the following analyses, the raw data of 9 samples were firstly filtered with SOAPnuke (v1.5.2) (https://github.com/BGI-flexlab/SOAPnuke) (16). Finally, clean data were obtained by (1) removing reads sequencing adapter, (2) removing reads whose low-quality base ratio (base quality less than or equal to 5) is more than 20%, (3) removing reads whose unknown base (‘N’ base) ratio is more than 5%. All the downstream analyses were based on the clean data with high quality.
Differentially Expressed Genes Analysis
The differentially expressed genes (DEGs) analysis was performed using the DESeq2 (v1.4.5) (http://www.bioconductor.org/packages/release/bioc/html/DESeq2.html) (17). We identified genes with a fold change (FC) ≥ 2 and Q value ≤ 0.05 in a comparison as significant DEGs.
Gene Ontology and KEGG Pathway Enrichment Analysis
To take insight to the change of phenotype, Gene Ontology (GO) (http://www.geneontology.org/) and Kyoto Encyclopedia of Genes and Genomes (KEGG) (https://www.kegg.jp/) enrichment analysis of annotated different expressed gene was performed by Phyper (https://en.wikipedia.org/wiki/Hypergeometric_distribution) based on Hypergeometric test. The significant levels of terms and pathways were corrected by Q value with a rigorous threshold (Q value ≤ 0.05), as previously described (18).
Real Time Quantitative RT-PCR
To confirm the transcriptomic data, MET-responsive Slc transporters DEGs were selected and validated through qRT-PCR. Total RNA was extracted using the EastepTM Total RNA Super Extraction Kit (promega, Shanghai, China) according to the manufacturer’s instruction and quantified with a Denovix DS-11 Spectrophotometer (Denovix, Inc., Wilmington DE, USA). cDNA was synthesized from total RNA (1 μg: 20 μl final reaction volume) using ReverTra Ace® qPCR RT Master Mix with gDNA Remover (TOYOBO Bio-Technology, CO., Shanghai, China) in a SimpliAmp Thermal Cycler (Applied Biosystems, Thermo Fisher Scientific, Inc., Waltham, MA, USA). A 20 μl PCR reaction system included 2 μl cDNA, 10 μl TB mixture, 0.4 μl forward primer, 0.4 μl reverse primer, 0.4 μl ROX Reference Dye II and 6.8 μl deionized water. After mixing, the PCR reaction was performed using ABI Prism TM 7500 Real-Time qPCR System (Applied Biosystems; Thermo Fisher Scientific, Inc.). The GAPDH was used as a house gene to normalize the expression level of the test genes, and the relative gene expression level was analyzed using the 2−ΔΔCT method. All samples were analyzed in triplicate. Primers were synthesized by GENEWIZ (Suzhou, China) and were listed in the Supplementary Table 1.
Statistical Analysis
The results are expressed as the mean ± SEM. The tissue weight, serum blood lipid levels, and mRNA expression were analysed using one-way ANOVA followed by Brown-Forsythe and Welch multiple comparisons tests. The body weight, fasting blood glucose, fasting serum insulin, HOMA-IR index, AUCglucose during GTT and ITT were analysed by two-way (repeated measures) ANOVA followed by Holm-Šídák multiple comparisons tests (note: each time was analysed separately). All statistical analyses were performed using GraphPad Prism 9.0 software (La Jolla, CA, USA) with a statistical significance set at P < 0.05.
Results
Inhibitory Effect of MET on Hepatic Steatosis, Hyperlipidemia, and Obesity
The DIO mice were generated in C57BL/6 mice with HFD feeding for 16 wks. In the MET-treated DIO mice, the hepatic steatosis was decreased for a reduction in the hepatic intracellular vacuoles observed by H&E staining and oil red O staining of the liver tissue (Figures 1A, B). The pathological changes in liver for pale fatty color, the number of hepatic fat vacuoles and hepatomegaly were reversed by MET (Figures 1A–C). A reduction in the fat mass (epididymal and perirenal fat) and liver weight were observed in the MET-treated mice (Figure 1C). An improvement in hyperlipidemia was observed with parameters including the low-density lipoprotein C, total cholesterol, and total triglyceride (Figure 1D). Moreover, the high-density lipoprotein C was increased (Figure 1D). A reduction in the body weight gain was observed in the MET-treated group as indicated by the weekly body weight data (Figure 1E). These data suggest that the model was successfully established for MET efficacy in the DIO mice.
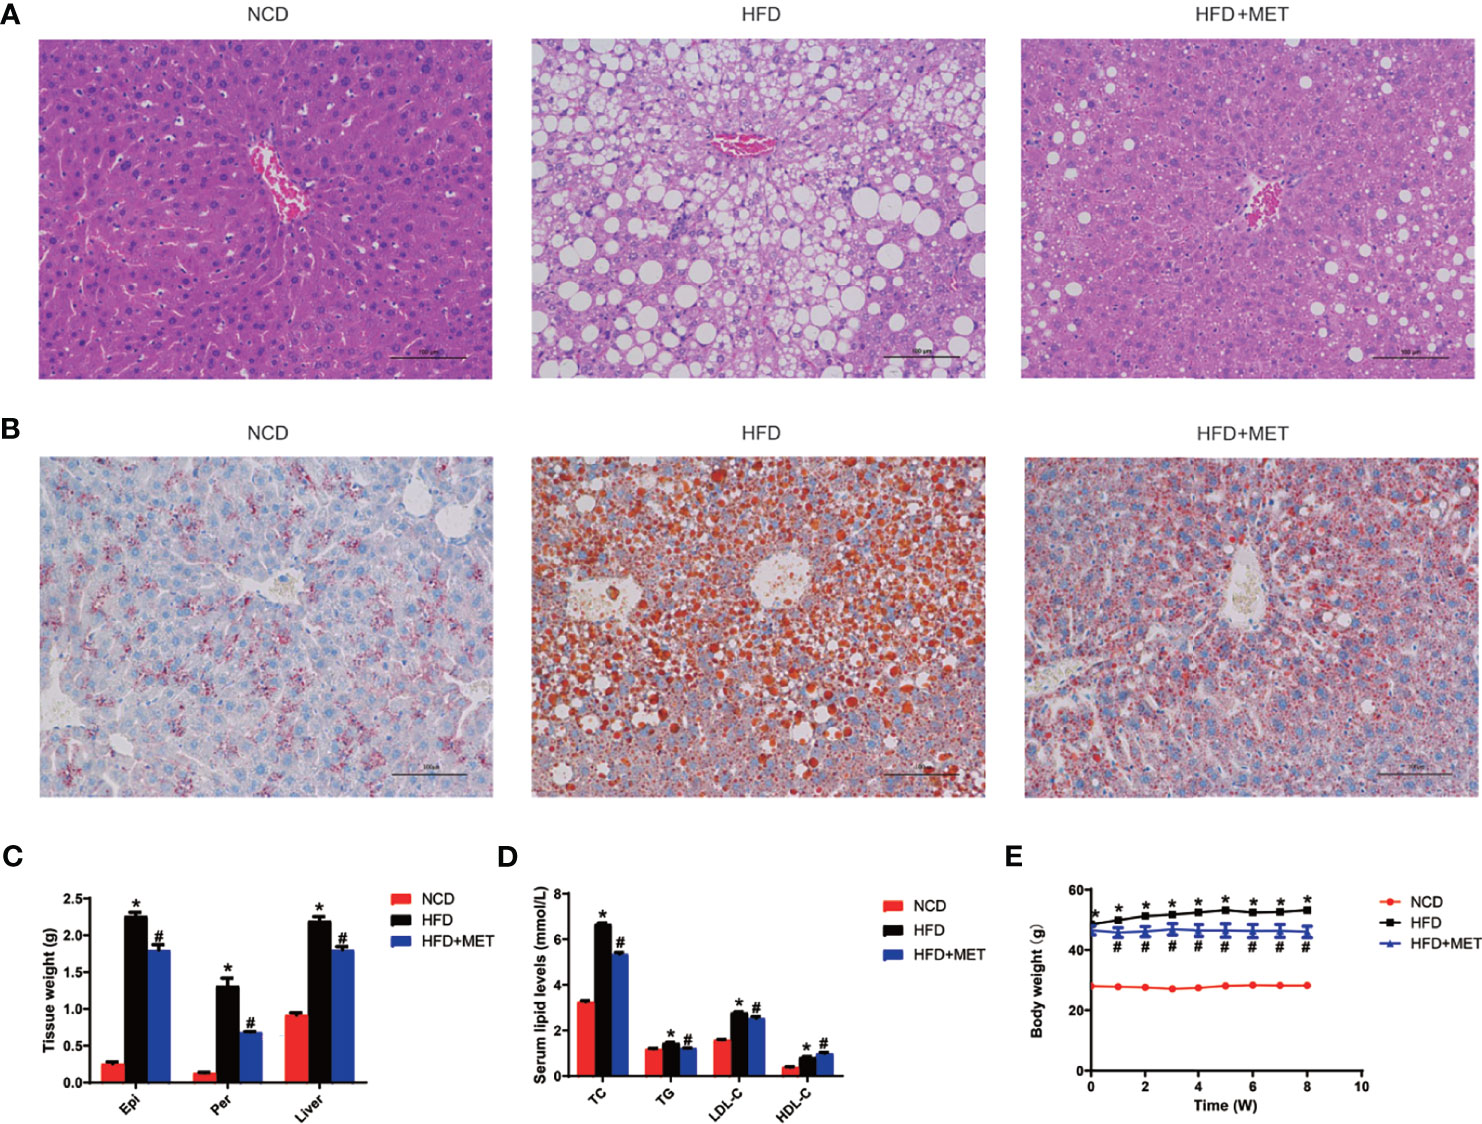
Figure 1 Inhibition of hepatic steatosis, hyperlipidemia, and obesity by MET. (A) Liver hematoxylin and eosin (H&E) staining. (B) Liver oil red O staining, ×200 (scale bars, 100 μm). (C) Tissue weight of perirenal fat, epididymal fat and liver after 8 weeks of treatment. (D) Serum lipid levels after 8 weeks of treatment. (E) Curve of body weight change from 0 to 8 weeks of treatment. The MET treatment was administrated for 8 weeks in HFD mice after 16 weeks on high-fat diet. Data are presented as the mean ± SEM (n = 10). *P < 0.05 HFD versus NCD, #P < 0.05 HFD+MET versus HFD.
Improvement of Insulin Sensitivity by MET
Glucose metabolism was examined in the DIO mice at the 0, 4 and 8 weeks of the MET-treatment. An improvement in insulin sensitivity by MET was supported by the reduction in fasting glucose and fasting insulin (Figures 2A, B), which led to a favorite change in the index of HOMA-IR for insulin sensitization (Figure 2C). The improvement was extended in other tests including GTT and ITT at 4 and 8 weeks (Figures 2D, E). This group of data suggests that the insulin sensitivity was improved by MET in the DIO mice to support the MET efficacy in the DIO model.
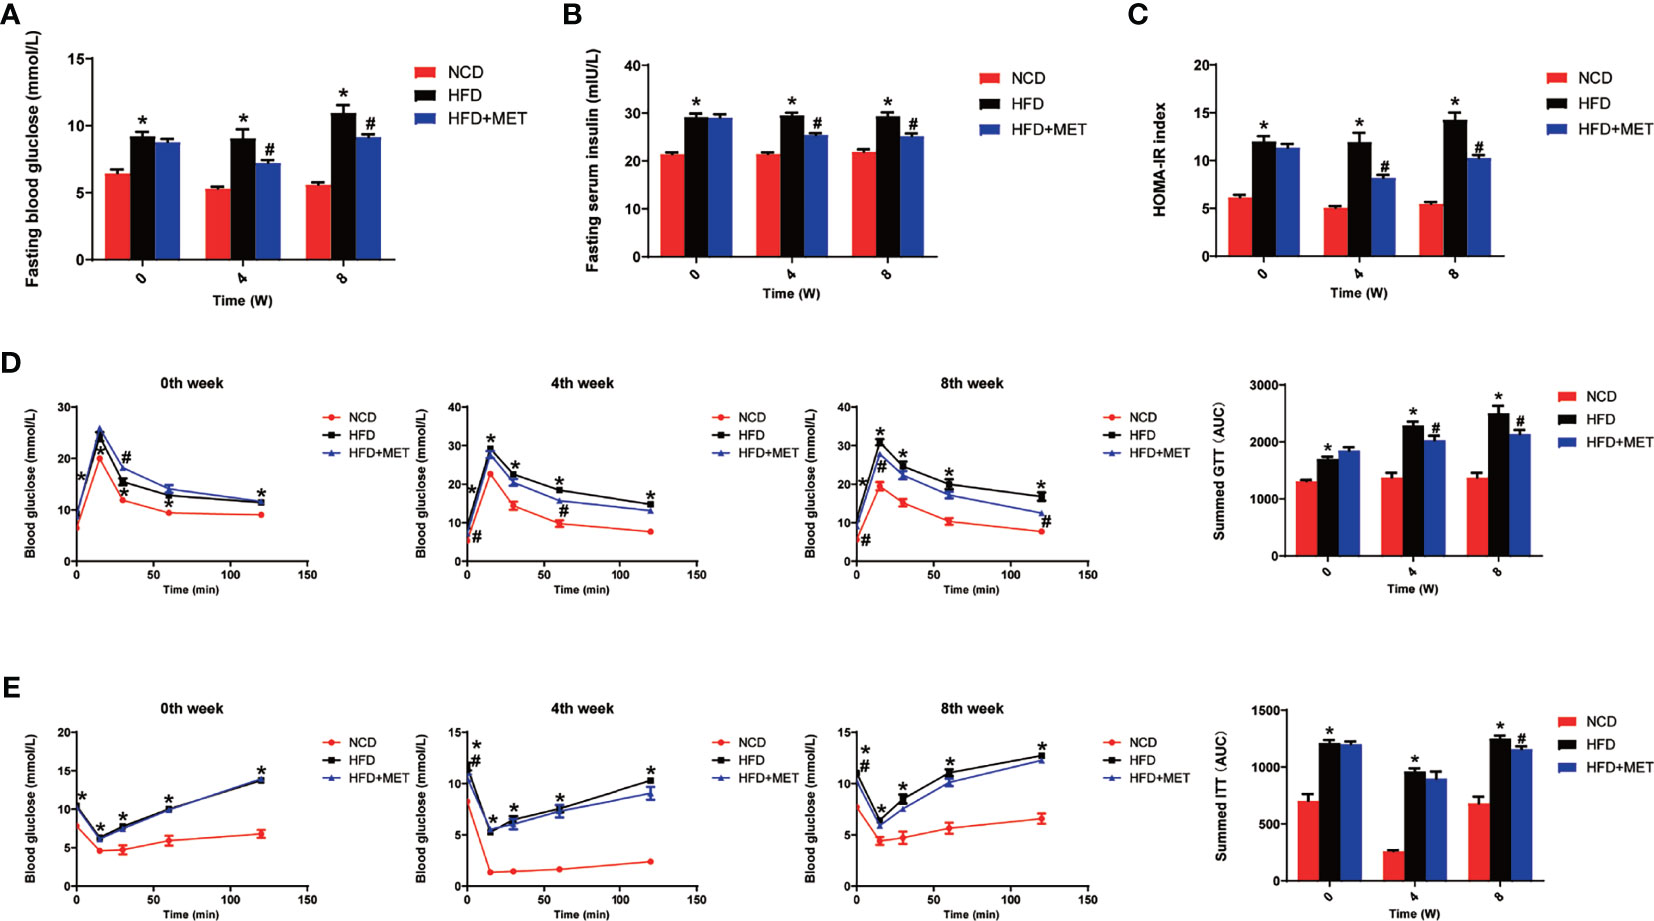
Figure 2 Improvement of insulin sensitivity by MET. (A) Fasting blood glucose. (B) Fasting serum insulin. (C) HOMA-IR. (D) GTT at 0, 4, 8 weeks of MET treatment. (E) ITT at 0, 4, 8 weeks of MET treatment. GTT and ITT was performed by intraperitoneal injection of glucose and insulin. Data are presented as the mean ± SEM (n = 10). *P < 0.05 HFD versus NCD, #P < 0.05 HFD+MET versus HFD.
DEGs in liver of DIO mice
The liver gene expression was examined using the RNA-seq technology to investigate the mechanism of MET action. The differentially expressed genes (DEGs) were identified by the gene expression levels determined with fragments per kilobase of exon per million fragments mapped (FPKM) method. The differential expression in all samples was comprehensively analyzed with the criteria of FC≥2 and P ≤ 0.01. In the liver, 939 DEGs were identified in the DIO mice (HFD vs NCD), and 489 DEGs were found in the MET-treated DIO mice (HFD+MET vs HFD) (Figures 3A, B). In DEGs of DIO mice, 137 were upregulated and 802 downregulated (Figure 3A). In the DEGs of MET-treated group, 451 were upregulated and 38 downregulated (Figure 3B). Among the HFD-responsive DEGs, there were 34 Slc genes with 32 downregulated and 2 upregulated in the DIO mice (HFD vs NCD) (Table 1), and in the MET-responsive DEGs, there were 23 Slc genes upregulated in the MET-treated DIO mice (HFD+MET vs HFD) (Table 2). Venn diagram analysis of the DEGs revealed that MET did not up-regulate any DEGs that were up in the liver of DIO mice (Figure 3C). MET did not down-regulate any DEGs that were down in the DIO mice (Figure 3D). However, MET upregulated 365 out of 802 DEGs that were downregulated in the DIO mice (HFD+MET vs HFD) (Figure 3E). MET downregulated 11 DEGs out of 137 that were upregulated in the liver of DIO mice (HFD+MET vs HFD) (Figure 3F). mRNA of 20 out of 32 Slc genes that were downregulated in the DIO mice were upregulated in the MET-treated DIO mice (Table 3). The data suggest that the liver had a dramatic response to HFD with mRNA expression as suggested by DEGs, and MET were able to counter-regulate almost half of them.
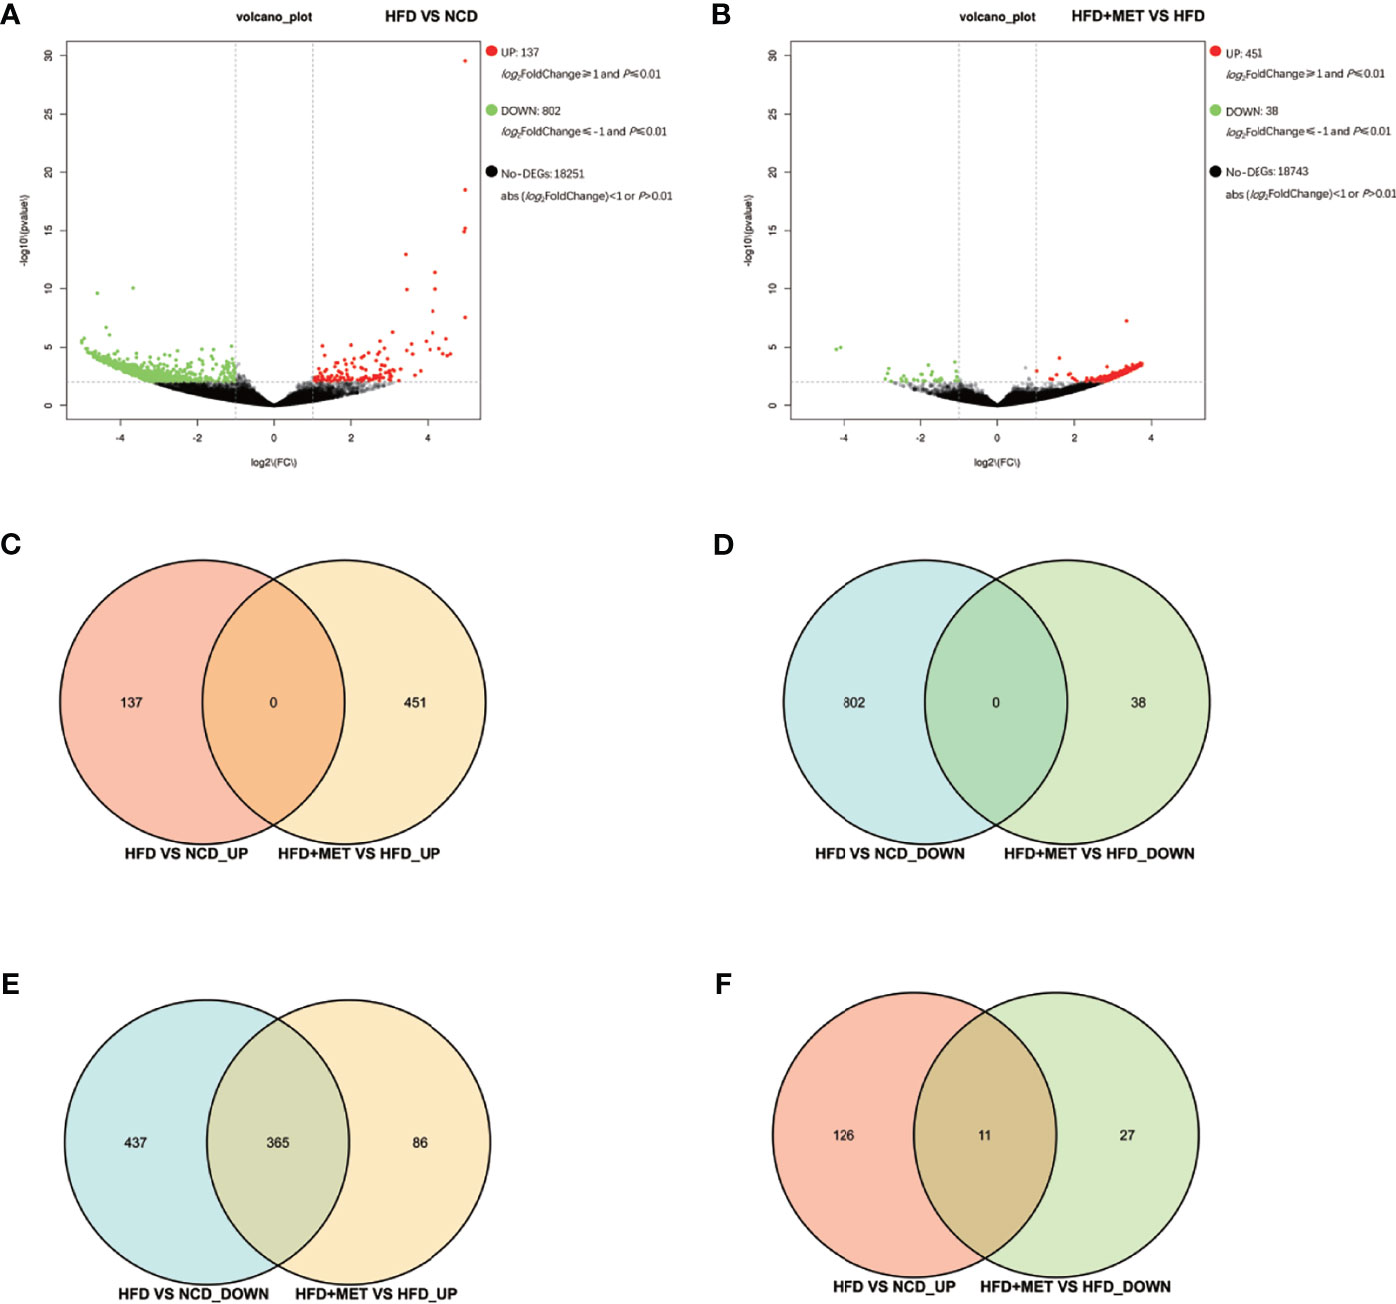
Figure 3 Differentially expressed genes (DEGs) analysis in liver. The volcano plot showed distribution pattern of DEGs in the comparison of HFD vs NCD (A) and HFD+MET vs HFD (B). Venn diagram of upregulated common DEGs (C) and downregulated common DEGs (D) in two comparisons of HFD vs NCD and HFD+MET vs HFD. Venn diagram of common DEGs showing opposite expression changes in two comparisons of HFD vs NCD and HFD+MET vs HFD (E, F). Red color or positive number indicates upregulation, and green color or negative number indicates down-regulation.
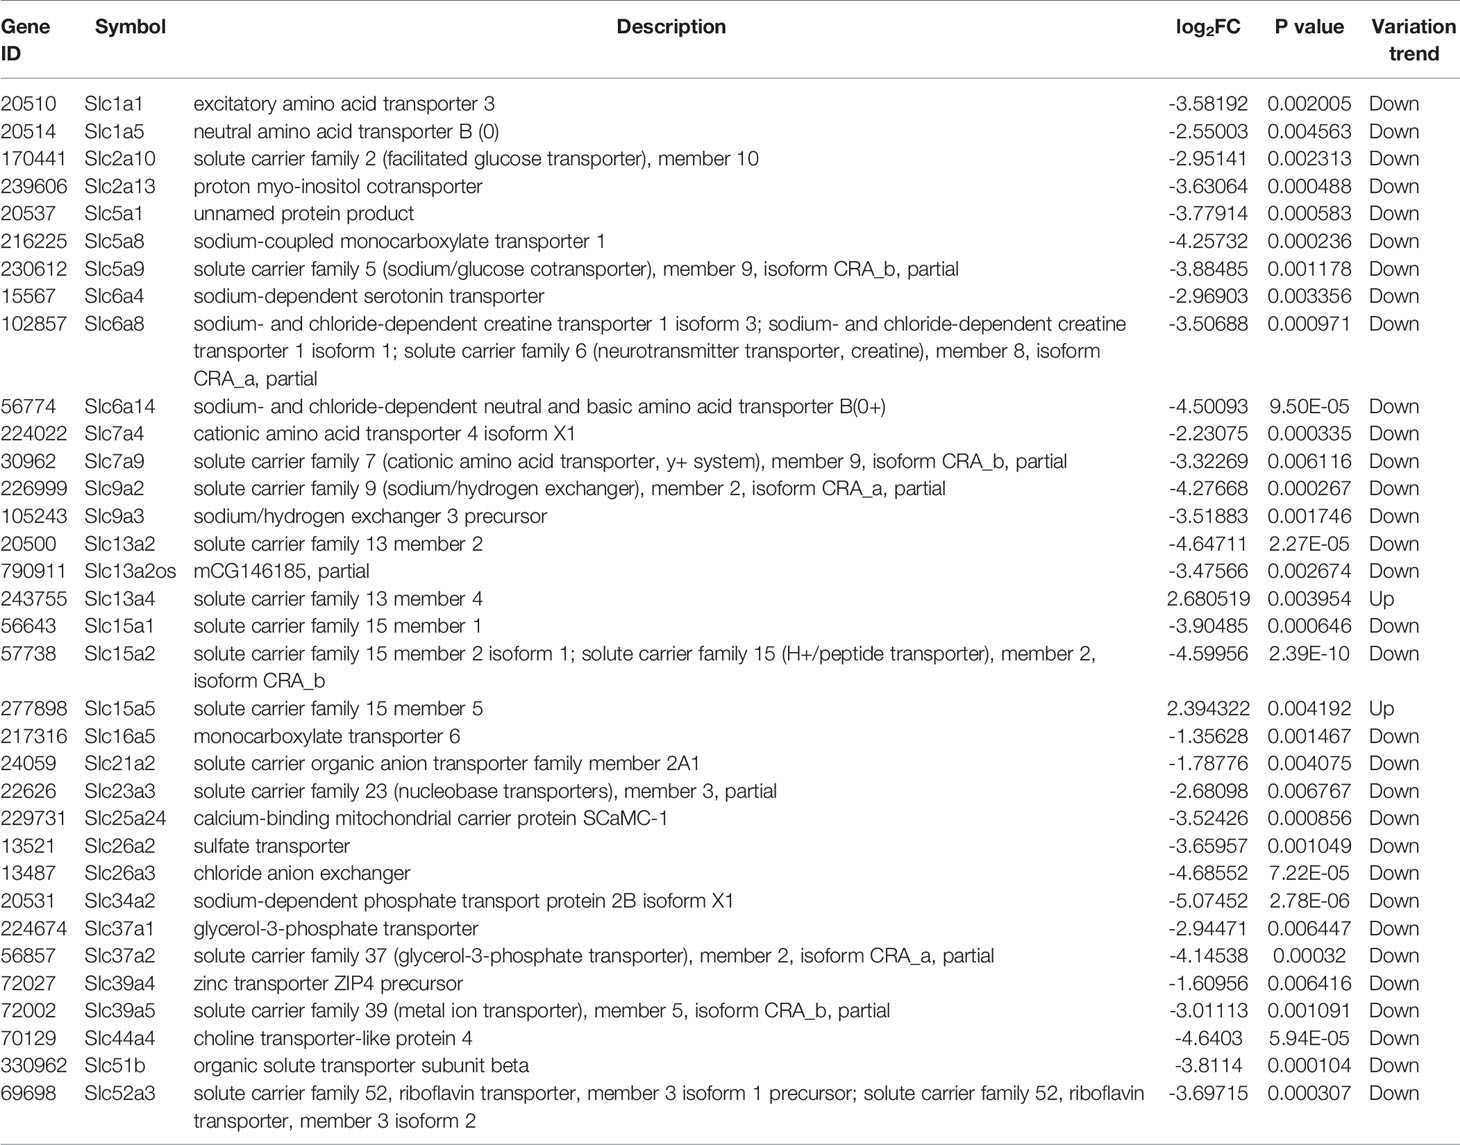
Table 1 Slc transporters DEGs in liver compared between HFD group and NCD group (\log2FC\≥1 and P<0.01).
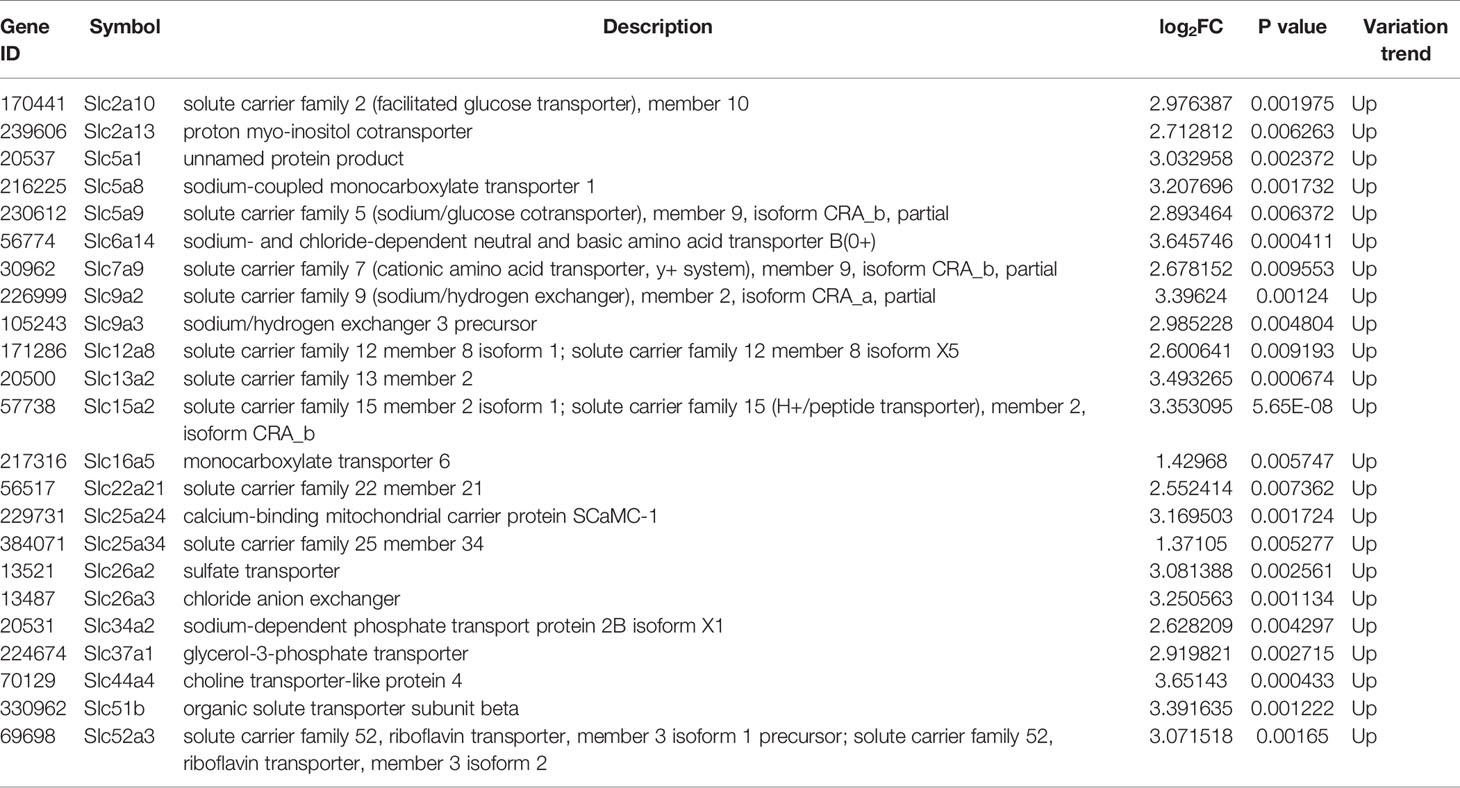
Table 2 Slc transporters DEGs in liver compared between HFD+MET group and HFD group (\log2FC\≥1 and P<0.01).
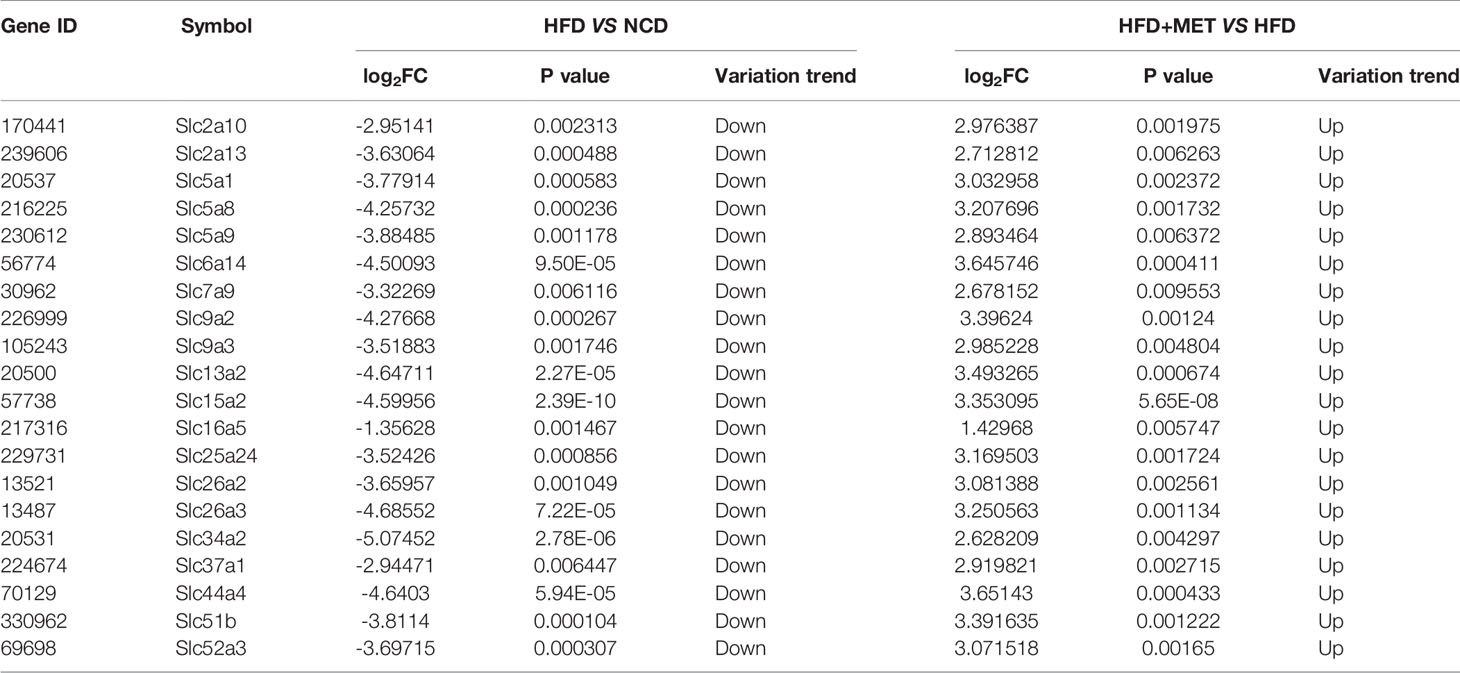
Table 3 MET-responsive Slc transporters DEGs in liver (\log2FC\≥1 and P<0.01).
DEGs in Colon of DIO Mice
The gene expression was examined in the colon tissue in the same mice by RNA-seq to test the impact of MET in intestine. In response to HFD, 97 DEGs were identified in the colon of DIO mice (HFD vs NCD) and 92 DEGs were identified in the MET-treated DIO mice (HFD+MET vs HFD) with the criteria of FC≥2 and P ≤ 0.01 (Figures 4A, B). In the DIO mice, 23 DEGs were upregulated and 74 downregulated (Figure 4A). In the MET-treated DIO mice, 62 DEGs were upregulated and 30 downregulated (Figure 4B). There were 5 Slc genes in the DEGs of DIO mice, and 2 Slc genes in the MET-treaded DIO mice, respectively (Supplementary Table 2). Venn diagram analysis of the DEGs revealed that HFD-responsive and MET-responsive DEGs did not share the same direction of changes (Figures 4C, D). In contrast, MET counter-regulated 24 DEGs that were downregulated in the DIO mice (Figure 4E) and 3 DEGs that were upregulated in the DIO mice (Figure 4F). Expression of several Slc transporters was changed in the DIO, and none of them were restored by MET in the DIO mice (Supplementary Table 2). The data suggest that the colon responded to HFD with fewer DGEs, which was 1/8 of those in the liver. MET upregulated 24 downregulated DEGs in the colon of DIO mice and none of them was Slc gene.
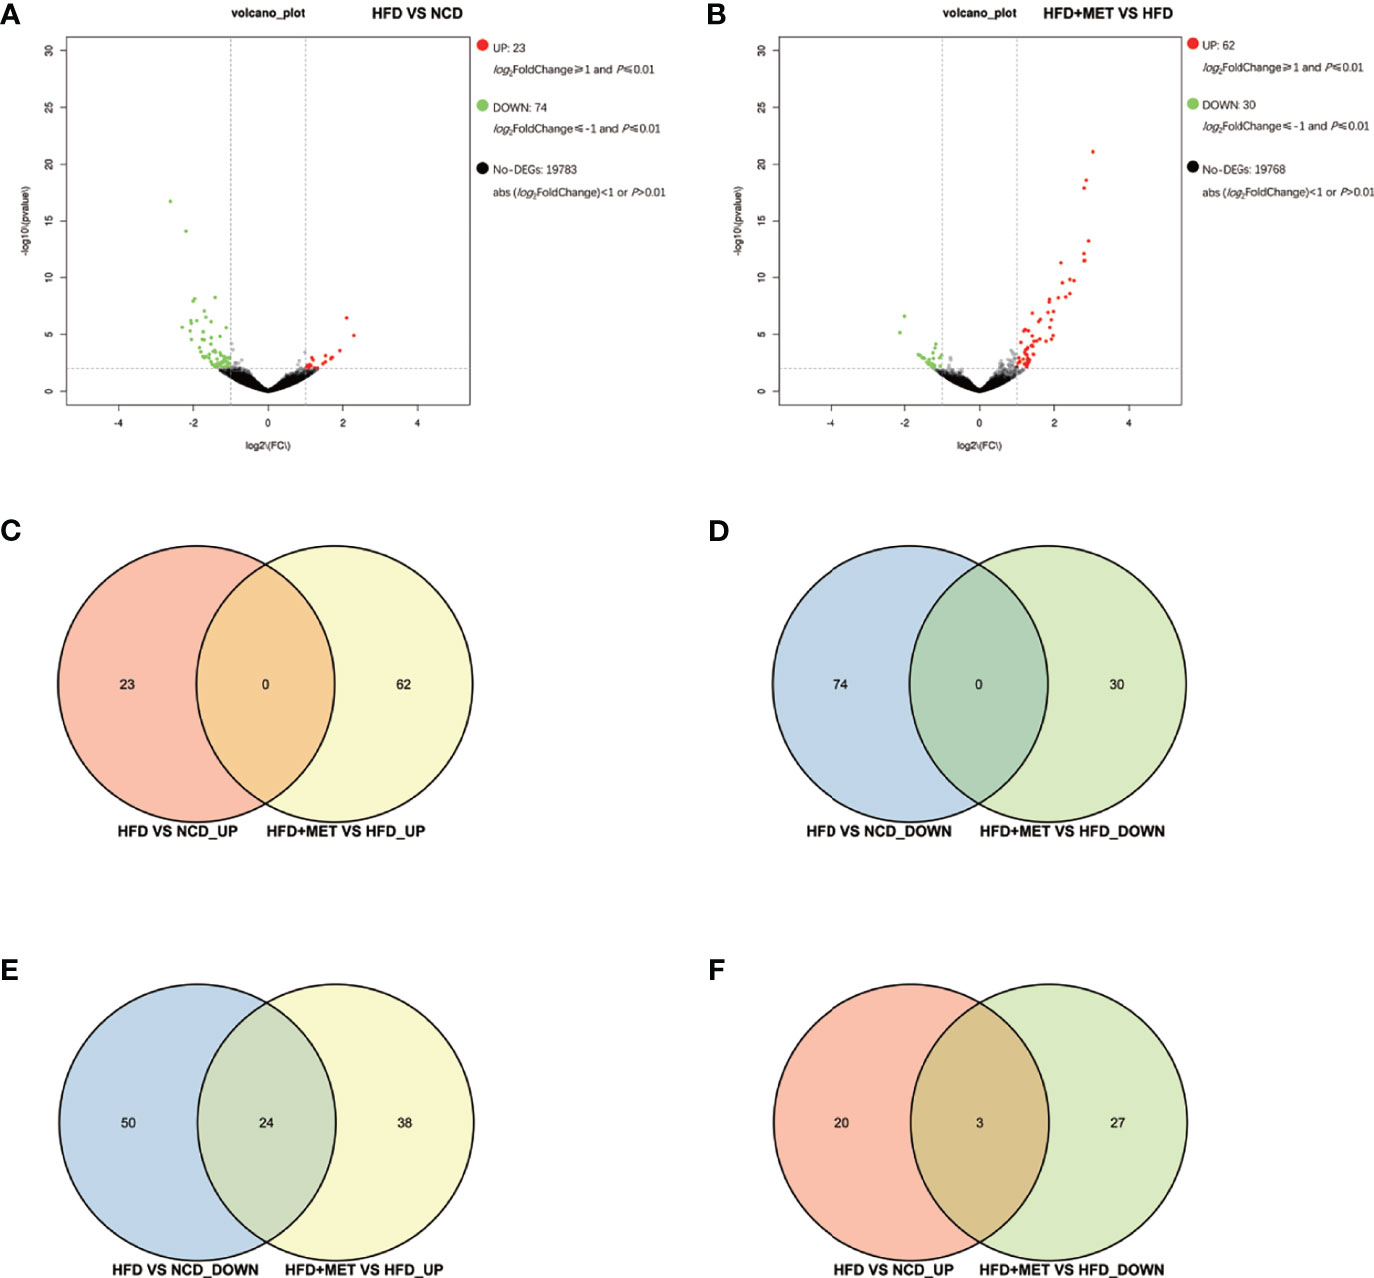
Figure 4 Differentially expressed genes (DEGs) analysis in colon. The volcano plot showed distribution pattern of DEGs in the comparison of HFD vs NCD (A) and HFD+MET vs HFD (B). Venn diagram of upregulated common DEGs (C) and downregulated common DEGs (D) in two comparisons of HFD vs NCD and HFD+MET vs HFD. Venn diagram of common DEGs showing opposite expression changes in two comparisons of HFD vs NCD and HFD+MET vs HFD (E, F). Red color or positive number indicates upregulation, and green color or negative number indicates down-regulation.
GO Enrichment Analysis of MET-Responsive Slc Genes in Liver
To investigate the function of the candidate DEGs of Slc transporters, we conducted GO enrichment analyses on the 20 common DEGs of Slc transporter genes (Figure 5). As shown in Figure 5A, the localization, cellular process and biological regulation were the subcategory of highest percentages in the biological processes (BP); the membrane and membrane part were the main significant terms in the cellular component (CC); the transporter activity was the most representative functions in the molecular function (MF). The 20 common DEGs of Slc genes in liver were mainly enriched in the BP associated with the transmembrane transport of sodium, ion, carbohydrate, anion transmembrane, glucose transmembrane, proton transmembrane, oxalate, glucose, sulfate, monocarboxylic acid, bicarbonate, propanoate (Figure 5B). As for the CC, the Slc gene products were mainly enriched in the brush border membrane, apical plasma membrane, integral component of membrane, plasma membrane, integral component of plasma membrane, microvillus membrane and vesicle (Figure 5C). The results for MF analysis demonstrated that the Slc gene products were mainly related to the functions of transmembrane transporter including symporter, antiporter, glucose: sodium symporter, potassium: porton antiporter, oxalate, secondary active sulfat, sulfate, sodium: proton antiporter, myo-insositol: proton symporter, high-affinity oligopeptide, propionate, short-chain fatty acid, thiamine pyrophosphate (Figure 5D). The data suggest that the cross-membrane transporter activities may be decreased by alteration in their mRNA expression in the liver of DIO mice. MET may restore the transporter activities by rescuing the gene expression.
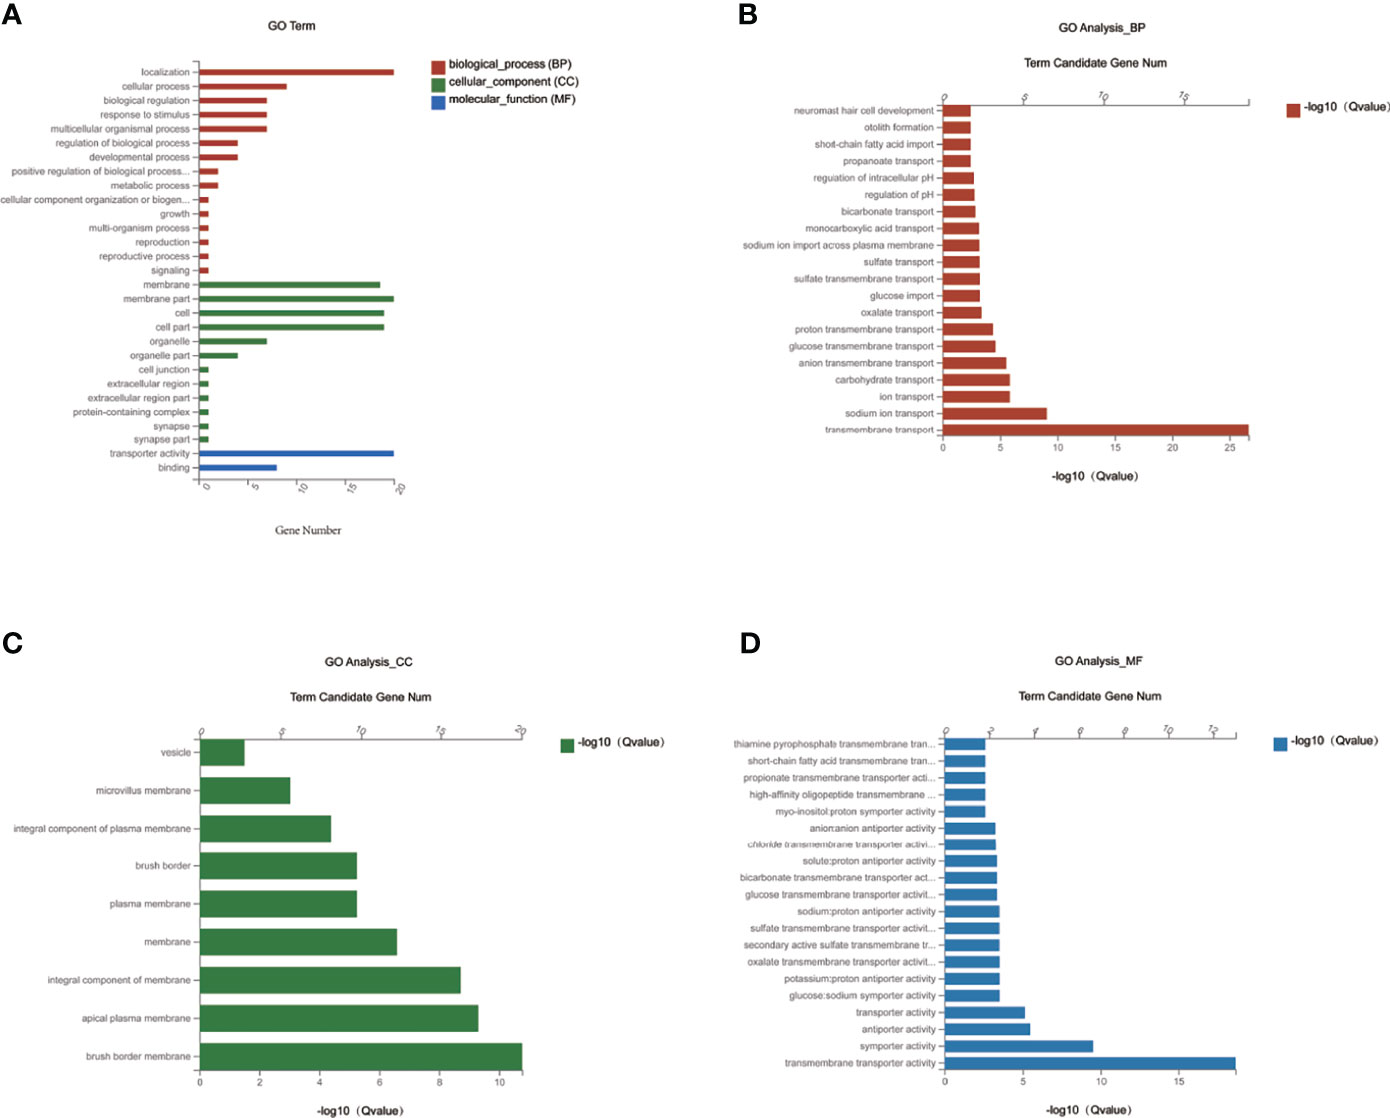
Figure 5 GO enrichment analysis of MET-responsive Slc genes in liver. (A) The annotation and classification of GO functional enrichment analysis with the common DEGs of Slc transporters in the liver. The functional enriched classes of the common DEGs of Slc transporters in the liver annotated by biological processes (BP) (B), and cell components (CC) (C), molecular function (MF) (D) sub-ontologies of GO enrichment analysis.
KEGG Pathway Enrichment Analysis of MET-Responsive Slc Genes in Liver
To investigate the impact of MET-responsive Slc genes in the liver metabolism, we conducted an analysis of the metabolic pathway using the Kyoto Encyclopedia of Genes and Genomes (KEGG). The 20 Slc genes were clustered into 2 main categories, including organismal systems and human diseases, which were further divided into 4 subcategories (Figure 6A). They were mainly enriched in the mineral absorption, bile secretion, protein digestion and absorption, vitamin digestion and absorption, carbohydrate digestion and absorption, synthesis, secretion and action of parathyroid hormone, pancreatic secretion, which were associated with metabolic balance (Figure 6B). The data suggests that HFD may change digestion and absorption of proteins, carbohydrates, minerals, and vitamins in the liver. MET may target these pathways by restoring the expression of Slc genes in the improvement of insulin sensitivity.
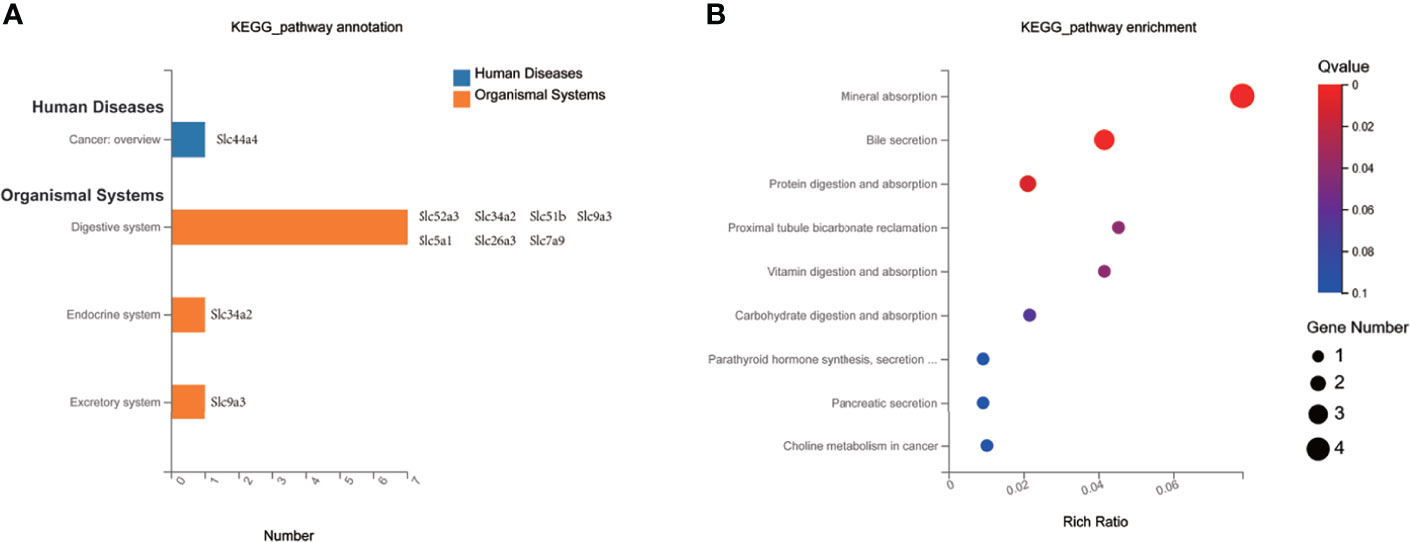
Figure 6 KEGG pathway enrichment analysis of MET-responsive Slc genes in liver. (A) KEGG pathway annotation and classification of common Slc transporters DEGs in liver. (B) Scatterplot of KEGG enrichment pathways associated with metabolic balance of common Slc transporters DEGs in liver.
Validation of MET-Responsive Slc Genes in Liver
The 20 MET-responsive Slc genes were validated with qRT-PCR assays (Figure 7). Among the 20 genes, 15 genes with downregulation in the DIO mice were confirmed in qRT-PCR, which included Slc2a10, Slc2a13, Slc5a9, Slc6a14, Slc7a9, Slc9a2, Slc9a3, Slc13a2, Slc15a2, Slc26a3, Slc34a2, Slc37a1, Slc44a4, Slc51b and Slc52a3 (Figures 7A–G, J–O). Their up-regulation by MET was also confirmed in qRT-PCR (Figures 7A–G, J–O). Three of them with upregulation in the DIO mice (including Slc16a5, Slc25a24 and Slc26a2) were confirmed in qRT-PCR and their expression was further upregulated by MET as confirmed in qRT-PCR (Figures 7H–J). MET upregulated two Slc genes, Slc5a1 and Slc5a8, which were not changed in the untreated DIO mice (Figure 7B).
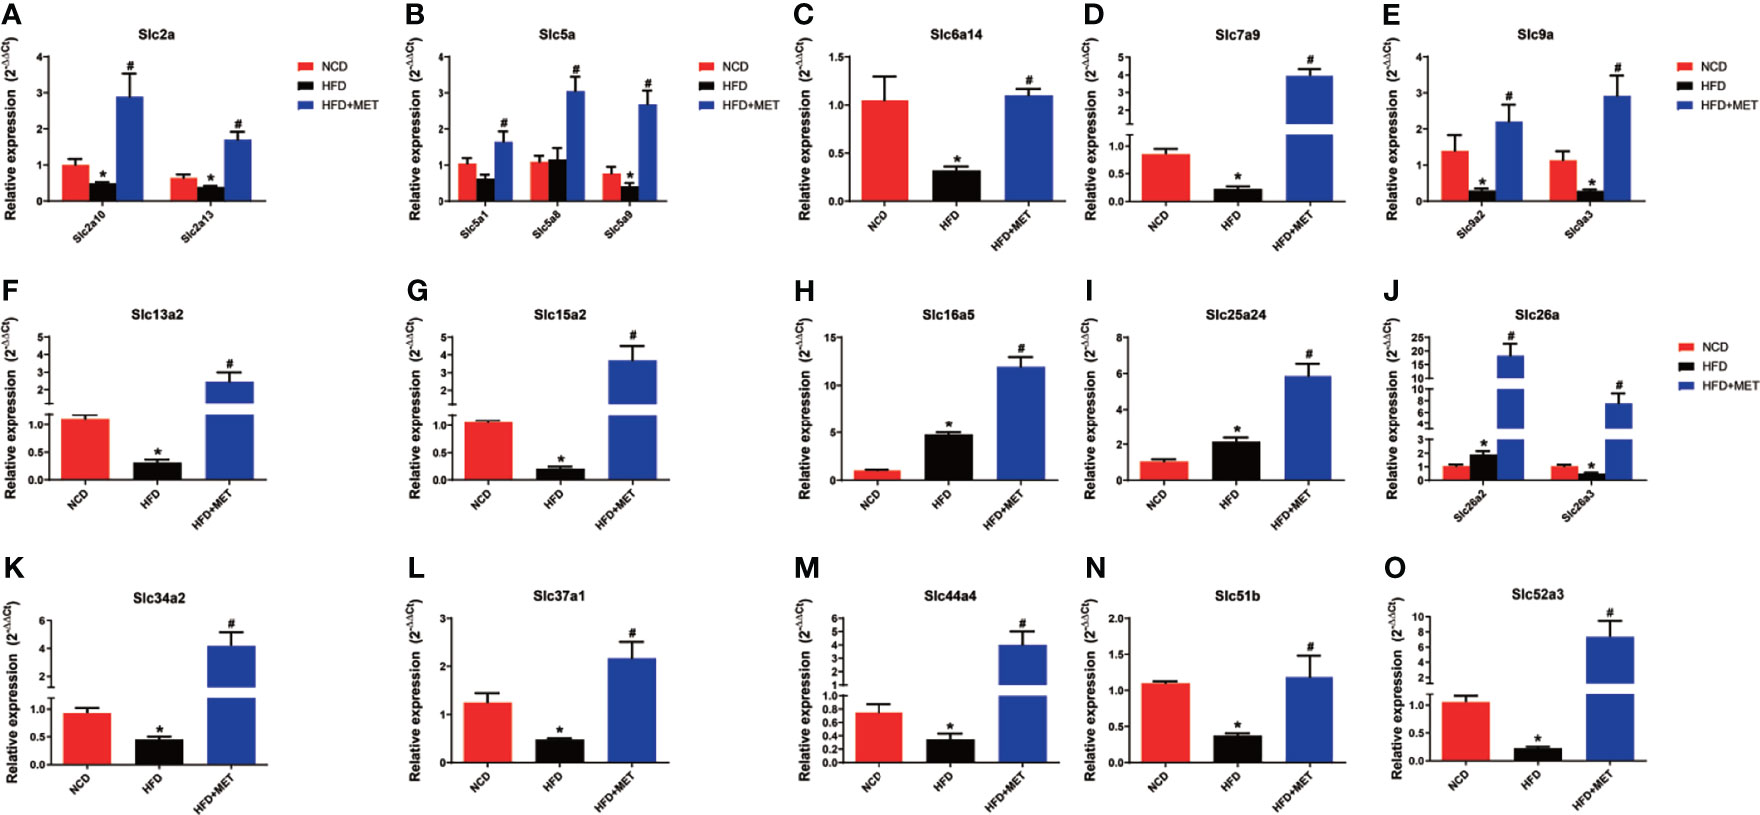
Figure 7 Expression validation of the 20 MET-responsive Slc genes in liver via RT-qPCR. The mRNA levels of the 20 common Slc DEGs were validated by RT-qPCR (2−ΔΔCT method) (A–O). The housekeeping gene GAPDH was used to normalize the relative expression level. Data are presented as the mean ± SEM (n = 3). *P < 0.05 HFD versus NCD, #P < 0.05 HFD+MET versus HFD.
Discussion
The transmembrane transporters are the gatekeeper proteins, which regulate the import and export of molecules, such as sugars, amino acids, fatty acids, nucleotides, metals, organic anions, inorganic ions, oligopeptides, and drugs (19). They are crucial for cellular homeostasis and their dysfunctions may contribute to the metabolic diseases. In fact, around 10% of all human genes encode the transporter proteins (20). The transporters include the ATP-binding cassette (ABC) transporters, ion channels, and solute carrier proteins (Slcs). The Slc transporters are the largest group of the transmembrane transporter proteins, which comprise over 60 subfamilies with more than 400 genes. Slcs are localized in the membrane surface to mediate passive and secondary active transportation of substrates (20). The Slc transporters are highly expressed in the metabolically active organs, such as the liver, kidney, brain, and intestine (9). Their roles in insulin resistance remains largely unknown.
Emerging evidence suggests that Slc transporters are closely associated with the metabolic diseases, and are potential candidates of drug targets for insulin resistance, T2DM, hypertension, chronic kidney disease (CKD), gout, asthma, inflammatory bowel disease (IBD), cancer, dementia, and anxiety disorders (9, 21–23). The activities are related to tissue specificity of the Slc genes. In our study, the Slc genes were examined in the liver and alteration in their expression was associated with hepatic steatosis, hyperlipidemia, obesity and insulin sensitivity in the DIO mice. We identified 20 MET-responsive Slc genes via transcriptome analysis, whose tissue distribution, physiological functions and pathological roles are shown in the Supplementary Table 3. Among them, expression of 15 Slc genes that were reduced in the liver of DIO mice was restored by MET. The 15 Slc members are Slc2a10, Slc2a13, Slc5a9, Slc6a14, Slc7a9, Slc9a2, Slc9a3, Slc13a2, Slc15a2, Slc26a3, Slc34a2, Slc37a1, Slc44a4, Slc51b and Slc52a3. Additionally, mRNA of 3 Slc genes (Slc16a5, Slc25a24, Slc26a2) were upregulated in DIO mice and further upregulated in MET-treated DIO mice. Expression of Slc5a1 and Slc5a8 were upregulated by MET although they were not altered in the liver of DIO mice. The data suggest that the 15 Slc genes may contribute to the mechanism of MET activity in insulin sensitization.
The exact functions of the MET-responsive Slc genes are largely unknown in obesity and type 2 diabetes. However, there are reports on six of Slc genes (Slc2a10, Slc5A1, Slc5a9, Slc6A14, Slc16A5, Slc25A24) in metabolic diseases including obesity, dyslipidemia, NAFLD, and T2DM. The Slc2a gene encodes the glucose transporter (GLUT) that has a family of 13 isoforms (24). Slc2a10 is also known as Glut10, whose expression was reduced in the liver of DIO mice in this study. Glut10 gene is highly expressed in the pancreas and liver with a function in transportation of glucose (25). However, GLUT10 is found to mediate ascorbic uptake in cells in a recent study. Glut10 was studied in adipocytes through genetic analysis, in which mutation-induced inactivation of Glut10 gene impaired adipogenesis and reduced adipose tissue development via an ascorbic acid-mediated pathway leading to insulin resistance, suggesting that Glut10 may mediate ascorbic acid uptake in cells (26). However, the role of Glut10 (Slc2a10) remains unknown in the control of insulin sensitivity in the liver. In our study, the downregulation of Glut10 gene in the liver of DIO mice was restored by MET-treatment, suggesting that MET may induce ascorbic acid uptake in the liver in the mechanism of insulin sensitization.
The Slc5a gene encodes the sodium-dependent glucose transporters (SLGTs) that has a family of 11 isoforms (27). SGLT2 is a well-known member in the kidney for glucose reabsorption from urine, and SGLT2 inhibitors are effective medicines in the treatment of type 2 diabetes for promotion of glucose discharge in urine. Slc5a1 gene encodes SGLT-1 in the intestine for absorption of glucose (Glc) and galactose (Gal) (28). Slc5a1 expression is reported to be reduced by the inhibitors of mitochondrial electron transport chain complexes (such as metformin, rotenone and antimycin A) in mouse ileal cultures mouse duodenal organoid derived 2D monolayer cultures (29). In human, Slc5a1 expression is increased in the duodenal of individuals with impaired glucose tolerance and T2DM (30). Slc5a1 activity remains unknown in the liver. We found that Slc5a1 expression was induced in the liver of DIO mice by MET, suggesting that glucose uptake by liver may be increased by MET in the improvement of insulin sensitivity. Slc5a1 expression was not changed in the colon of DIO mice and MET-treated DIO mice.
In this study, mRNA expression of Slc5a9 and Slc25a24 was elevated in the liver of DIO mice and the expression was further increased by MET. Slc5A9 is also known as SGLT4, a sodium-dependent glucose transporter, which acts as an essential transporter for mannose, fructose and 1,5-anhydro-D-glucitol in the intestine and kidney (31). A mutation within Slc5a9 gene is reported in the development of proliferative diabetic retinopathy (32). However, Slc5a9 activity remains unknown in the liver. We observed that Slc5a9 expression was induced by MET, suggesting that MET may promote uptake of mannose, fructose and 1,5-anhydro-D-glucitol in the liver through induction of Slc5a9. In DIO mice, it was reported that Slc25a24 expression was increased in the white adipose tissues (WAT) of DIO mice during tissue expansion, and Slc25a24-knockout mice exhibited an obesity-resistant phenotype (33). This study suggests that Slc25a24 may be required for adipose tissue expansion and a novel candidate gene in the control of obesity.
We found that Slc6a14 and Slc16a5 were upregulated by MET in the DIO mice, which is consistent with the published studies. Slc6a14 is a Na+ and Cl− dependent transporter for glutamine and other amino acids except glutamate and aspartate (34). Sathish Sivaprakasam, et al. suggested that the deficiency of Slc6a14 was related to obesity, and dietary/pharmacologic interventions-induced Slc6a14 expression in the intestinal tract might play a role in the prevention of obesity (35). Slc16a5 is known as monocarboxylate transporter 6 (MCT6), which transports bumetanide in a pH- and membrane potential-sensitive manner independently of proton gradient (36). Lu, et al. reported that the treatment of mice with fenofibrate resulted in 3- to 6-fold upregulation of Slc16a5 in the liver of mice, which was associated with an improvement in insulin sensitivity (37). After 24-hour fasting, Slc16a5 was also detected as the 6th most increased gene with about a 5-fold upregulation in gene expression, compared with gene expression after a normal diet (38). These studies confirm that Slc6a14 and Slc16a5 may play a role in lipid metabolism due to its differential regulation under various interventions. Our data suggest that MET may increase liver uptake of amino acids and bumetanide in the improvement of insulin sensitivity and obesity.
In the liver analysis by RNA-seq, there are three other studies in the literature. Those were designed to understand MET mechanism in the regulation of liver gene expression in the normal mice or human hepatocytes. These studies provide evidence for MET direct impact in gene transcription. Meng Y et al. revealed that metformin changed gene expression profile in the mouse liver, which was associated with the beneficial/deleterious effects in the healthy mice (39). Lien F et al. found that MET regulated the bile acid homeostasis through gene transcription mediated by the AMPK-FXR pathway in the liver of normal mice (40). Luizon MR et al. reported that the AMPK-ATF3 pathway was activated by MET to regulate gene transcription in the normal human hepatocytes in the cell culture, which was associated with inhibition of gluconeogenesis by MET (41). We analyzed the RNA-seq data in the study by Luizon, et al, to understand the MET direct and indirect effect in the expression of Slc genes. The result suggests that MET does not alter expression of the 15 Slc genes identified in the DIO mice. The negative result from the cellular model suggest that MET may use an indirect mechanism in the restoration of the 15 Slc genes in the liver of DIO mice in current study. The restoration may a secondary effect of improved insulin sensitivity or hepatocyte function in the liver of DIO mice.
Although the mechanism by which MET restored the 15 Slc gene expression remains unclear, significance of Slc genes in the pathogenesis of metabolic disease is supported by a couple of studies. A study suggests that Slc13a5 expression is required for development of diet- and aging-induced obesity. Slc13a5 gene inactivation were protected the knockout mice from high-fat diet (HFD)- and aging-induced obesity, hepatic steatosis, and insulin resistance (42). Consistently, knockdown of human Slc13a5 resulted in lower lipid levels in a human hepatocyte cell line (43). Slc25a24 seems to have the same activity in the knockout mice, which were protected from HFD-induced obesity and hepatic steatosis (33). Conversely, a reduction in Slc16a11 activity promoted T2DM and induction of the gene expression decreased the risk of T2DM (44, 45). Similarly, a reduction in Slc30a8 activity increased the risk of T2DM, and overexpression of Slc30a8 improved glucose tolerance in mice (46, 47). These studies were conducted in the global transgenic mice, and the results might reflect the Slc activities in organs other than the liver.
In summary, we observed that more Slc genes exhibited alteration in the liver over the colon under in the DIO mice. In the liver of DIO mice, there were 34 Slc genes with mRNA alteration, in which 15 Slc genes were downregulated in mRNA expression, and the reduced expressions were restored in the liver by MET. The restoration of the Slc gene expression may be a secondary effect of the improved insulin sensitivity in liver to promote uptake of glucose, amino acids, mannose, fructose, 1,5-anhydro-D-glucitol and bumetanide in the hepatocytes. The Slc genes may contribute to liver metabolism through regulation of substrate exchange in hepatocytes. However, the possibilities remain to be tested in experiments. The upstream events for the Slc gene restoration remain to be identified in the MET action.
Data Availability Statement
The datasets presented in this study can be found in online repositories. The names of the repository/repositories and accession number(s) can be found below: https://www.ncbi.nlm.nih.gov/, PRJNA735274.
Ethics Statement
The animal study was reviewed and approved by The Institutional Animal Care and Use Committee (IACUC) of Shanghai Jiaotong University.
Author Contributions
JY contributed to the concept and design of the study. JLe, YF, QH, XW, HJ, and XZ performed the experiments. JLe, YC, QW, PP, JLi, XL, and YZ processed the experimental data and prepared table and picture. JLe wrote the manuscript. JLe and JY revised the manuscript. JLe and JY are the guarantors of this work and, as such, had full access to all the data in the study and take responsibility for the integrity of the data and the accuracy of the data analysis. All authors contributed to the article and approved the submitted version.
Funding
The study was supported by National Natural Science Foundation of China (81903961 to JLe) and the Natural Science Foundation of Shanghai (19ZR1424000) to JLe, and Construction project of Shanghai Key Laboratory of Molecular Imaging (18DZ2260400).
Conflict of Interest
The authors declare that the research was conducted in the absence of any commercial or financial relationships that could be construed as a potential conflict of interest.
Publisher’s Note
All claims expressed in this article are solely those of the authors and do not necessarily represent those of their affiliated organizations, or those of the publisher, the editors and the reviewers. Any product that may be evaluated in this article, or claim that may be made by its manufacturer, is not guaranteed or endorsed by the publisher.
Supplementary Material
The Supplementary Material for this article can be found online at: https://www.frontiersin.org/articles/10.3389/fendo.2021.720784/full#supplementary-material
References
1. Sanchez-Rangel E, Inzucchi SE. Metformin: Clinical Use in Type 2 Diabetes. Diabetologia (2017) 60:1586–93. doi: 10.1007/s00125-017-4336-x
2. Marshall SM. 60 Years of Metformin Use: A Glance at the Past and a Look to the Future. Diabetologia (2017) 60:1561–5. doi: 10.1007/s00125-017-4343-y
3. Madiraju AK, Erion DM, Rahimi Y, Zhang X-M, Braddock DT, Albright RA, et al. Metformin Suppresses Gluconeogenesis by Inhibiting Mitochondrial Glycerophosphate Dehydrogenase. Nature (2014) 510:542–6. doi: 10.1038/nature13270
4. El-Mir MY, Nogueira V, Fontaine E, Avéret N, Rigoulet M, Leverve X. Dimethylbiguanide Inhibits Cell Respiration via an Indirect Effect Targeted on the Respiratory Chain Complex I. J Biol Chem (2000) 275:223–8. doi: 10.1074/jbc.275.1.223
5. Miller RA, Chu Q, Xie J, Foretz M, Viollet B, Birnbaum MJ. Biguanides Suppress Hepatic Glucagon Signalling by Decreasing Production of Cyclic AMP. Nature (2013) 494:256–60. doi: 10.1038/nature11808
6. Brønden A, Albér A, Rohde U, Rehfeld JF, Holst JJ, Vilsbøll T, et al. Single-Dose Metformin Enhances Bile Acid-Induced Glucagon-Like Peptide-1 Secretion in Patients With Type 2 Diabetes. J Clin Endocrinol Metab (2017) 102:4153–62. doi: 10.1210/jc.2017-01091
7. Forslund K, Hildebrand F, Nielsen T, Falony G, Le Chatelier E, Sunagawa S, et al. Disentangling Type 2 Diabetes and Metformin Treatment Signatures in the Human Gut Microbiota. Nature (2015) 528:262–6. doi: 10.1038/nature15766
8. Preiss D, Dawed A, Welsh P, Heggie A, Jones AG, Dekker J, et al. Sustained Influence of Metformin Therapy on Circulating Glucagon-Like Peptide-1 Levels in Individuals With and Without Type 2 Diabetes. Diabetes Obes Metab (2017) 19:356–63. doi: 10.1111/dom.12826
9. Schumann T, König J, Henke C, Willmes DM, Bornstein SR, Jordan J, et al. Solute Carrier Transporters as Potential Targets for the Treatment of Metabolic Disease. Pharmacol Rev (2020) 72:343–79. doi: 10.1124/pr.118.015735
10. Chen EC, Liang X, Yee SW, Geier EG, Stocker SL, Chen L, et al. Targeted Disruption of Organic Cation Transporter 3 Attenuates the Pharmacologic Response to Metformin. Mol Pharmacol (2015) 88:75–83. doi: 10.1124/mol.114.096776
11. Shu Y, Brown C, Castro RA, Shi RJ, Lin ET, Owen RP, et al. Effect of Genetic Variation in the Organic Cation Transporter 1, OCT1, on Metformin Pharmacokinetics. Clin Pharmacol Ther (2008) 83:273–80. doi: 10.1038/sj.clpt.6100275
12. Meyer zu Schwabedissen HE, Verstuyft C, Kroemer HK, Becquemont L, Kim RB. Human Multidrug and Toxin Extrusion 1 (MATE1/SLC47A1) Transporter: Functional Characterization, Interaction With OCT2 (SLC22A2), and Single Nucleotide Polymorphisms. Am J Physiol Renal Physiol (2010) 298:F997–1005. doi: 10.1152/ajprenal.00431.2009
13. García-Calzón S, Perfilyev A, Männistö V, de Mello VD, Nilsson E, Pihlajamäki J, et al. Diabetes Medication Associates With DNA Methylation of Metformin Transporter Genes in the Human Liver. Clin Epigenet (2017) 9:102. doi: 10.1186/s13148-017-0400-0
14. Musutova M, Elkalaf M, Klubickova N, Koc M, Povysil S, Rambousek J, et al. The Effect of Hypoxia and Metformin on Fatty Acid Uptake, Storage, and Oxidation in L6 Differentiated Myotubes. Front Endocrinol (Lausanne) (2018) 9:616. doi: 10.3389/fendo.2018.00616
15. Le J, Zhang X, Jia W, Zhang Y, Luo J, Sun Y, et al. Regulation of Microbiota-GLP1 Axis by Sennoside A in Diet-Induced Obese Mice. Acta Pharm Sin B (2019) 9:758–68. doi: 10.1016/j.apsb.2019.01.014
16. Li R, Li Y, Kristiansen K, Wang J. SOAP: Short Oligonucleotide Alignment Program. Bioinformatics (2008) 24:713–4. doi: 10.1093/bioinformatics/btn025
17. Love MI, Huber W, Anders S. Moderated Estimation of Fold Change and Dispersion for RNA-Seq Data With Deseq2. Genome Biol (2014) 15:550. doi: 10.1186/s13059-014-0550-8
18. Le JM, Fu Y, Han QQ, Ma YJ, Ji HL, Wei XD, et al. Transcriptome Analysis of the Inhibitory Effect of Sennoside A on the Metastasis of Hepatocellular Carcinoma Cells. Front Pharmacol (2021) 11:18. doi: 10.3389/fphar.2020.566099
19. Hediger MA, Romero MF, Peng J-B, Rolfs A, Takanaga H, Bruford EA. The ABCs of Solute Carriers: Physiological, Pathological and Therapeutic Implications of Human Membrane Transport Proteinsintroduction. Pflugers Arch (2004) 447:465–8. doi: 10.1007/s00424-003-1192-y
20. Hediger MA, Clémençon B, Burrier RE, Bruford EA. The ABCs of Membrane Transporters in Health and Disease (SLC Series): Introduction. Mol Aspects Med (2013) 34:95–107. doi: 10.1016/j.mam.2012.12.009
21. Rask-Andersen M, Masuram S, Fredriksson R, Schiöth HB. Solute Carriers as Drug Targets: Current Use, Clinical Trials and Prospective. Mol Aspects Med (2013) 34:702–10. doi: 10.1016/j.mam.2012.07.015
22. Lin L, Yee SW, Kim RB, Giacomini KM. SLC Transporters as Therapeutic Targets: Emerging Opportunities. Nat Rev Drug Discov (2015) 14:543–60. doi: 10.1038/nrd4626
23. Zhang Y, Zhang Y, Sun K, Meng Z, Chen L. The SLC Transporter in Nutrient and Metabolic Sensing, Regulation, and Drug Development. J Mol Cell Biol (2019) 11:1–13. doi: 10.1093/jmcb/mjy052
24. Uldry M, Thorens B. The SLC2 Family of Facilitated Hexose and Polyol Transporters. Pflugers Arch (2004) 447:480–9. doi: 10.1007/s00424-003-1085-0
25. Dawson PA, Mychaleckyj JC, Fossey SC, Mihic SJ, Craddock AL, Bowden DW. Sequence and Functional Analysis of GLUT10: A Glucose Transporter in the Type 2 Diabetes-Linked Region of Chromosome 20q12-13. 1 Mol Genet Metab (2001) 74:186–99. doi: 10.1006/mgme.2001.3212
26. Jiang C-L, Jen W-P, Tsao C-Y, Chang L-C, Chen C-H, Lee Y-C. Glucose Transporter 10 Modulates Adipogenesis via an Ascorbic Acid-Mediated Pathway to Protect Mice Against Diet-Induced Metabolic Dysregulation. PLoS Genet (2020) 16:e1008823. doi: 10.1371/journal.pgen.1008823
27. Wright EM, Turk E. The Sodium/Glucose Cotransport Family SLC5. Pflugers Arch (2004) 447:510–8. doi: 10.1007/s00424-003-1202-0
28. Hediger MA, Turk E, Wright EM. Homology of the Human Intestinal Na+/Glucose and Escherichia Coli Na+/Proline Cotransporters. Proc Natl Acad Sci USA (1989) 86:5748–52. doi: 10.1073/pnas.86.15.5748
29. Yang M, Darwish T, Larraufie P, Rimmington D, Cimino I, Goldspink DA, et al. Inhibition of Mitochondrial Function by Metformin Increases Glucose Uptake, Glycolysis and GDF-15 Release From Intestinal Cells. Sci Rep (2021) 11:2529. doi: 10.1038/s41598-021-81349-7
30. Fiorentino TV, Suraci E, Arcidiacono GP, Cimellaro A, Mignogna C, Presta I, et al. Duodenal Sodium/Glucose Cotransporter 1 Expression Under Fasting Conditions Is Associated With Postload Hyperglycemia. J Clin Endocrinol Metab (2017) 102:3979–89. doi: 10.1210/jc.2017-00348
31. Tazawa S, Yamato T, Fujikura H, Hiratochi M, Itoh F, Tomae M, et al. SLC5A9/SGLT4, a New Na+-Dependent Glucose Transporter, is an Essential Transporter for Mannose, 1,5-Anhydro-D-Glucitol, and Fructose. Life Sci (2005) 76:1039–50. doi: 10.1016/j.lfs.2004.10.016
32. Ung C, Sanchez AV, Shen L, Davoudi S, Ahmadi T, Navarro-Gomez D, et al. Whole Exome Sequencing Identification of Novel Candidate Genes in Patients With Proliferative Diabetic Retinopathy. Vision Res (2017) 139:168–76. doi: 10.1016/j.visres.2017.03.007
33. Urano T, Shiraki M, Sasaki N, Ouchi Y, Inoue S. SLC25A24 as a Novel Susceptibility Gene for Low Fat Mass in Humans and Mice. J Clin Endocrinol Metab (2015) 100:E655–63. doi: 10.1210/jc.2014-2829
34. Sloan JL, Mager S. Cloning and Functional Expression of a Human Na(+) and Cl(-)-Dependent Neutral and Cationic Amino Acid Transporter B(0+). J Biol Chem (1999) 274:23740–5. doi: 10.1074/jbc.274.34.23740
35. Sivaprakasam S, Sikder MOF, Ramalingam L, Kaur G, Dufour JM, Moustaid-Moussa N, et al. SLC6A14 Deficiency is Linked to Obesity, Fatty Liver, and Metabolic Syndrome But Only Under Conditions of a High-Fat Diet. Biochim Biophys Acta Mol Basis Dis (2021) 1867:166087. doi: 10.1016/j.bbadis.2021.166087
36. Murakami Y, Kohyama N, Kobayashi Y, Ohbayashi M, Ohtani H, Sawada Y, et al. Functional Characterization of Human Monocarboxylate Transporter 6 (SLC16A5). Drug Metab Dispos (2005) 33:1845–51. doi: 10.1124/dmd.105.005264
37. Lu Y, Boekschoten MV, Wopereis S, Müller M, Kersten S. Comparative Transcriptomic and Metabolomic Analysis of Fenofibrate and Fish Oil Treatments in Mice. Physiol Genomics (2011) 43:1307–18. doi: 10.1152/physiolgenomics.00100.2011
38. Zhang F, Xu X, Zhou B, He Z, Zhai Q. Gene Expression Profile Change and Associated Physiological and Pathological Effects in Mouse Liver Induced by Fasting and Refeeding. PLoS One (2011) 6:e27553. doi: 10.1371/journal.pone.0027553
39. Meng Y, Xiang R, Yan H, Zhou Y, Hu Y, Yang J, et al. Transcriptomic Landscape Profiling of Metformin-Treated Healthy Mice: Implication for Potential Hypertension Risk When Prophylactically Used. J Cell Mol Med (2020) 24:8138–50. doi: 10.1111/jcmm.15472
40. Lien F, Berthier A, Bouchaert E, Gheeraert C, Alexandre J, Porez G, et al. Metformin Interferes With Bile Acid Homeostasis Through AMPK-FXR Crosstalk. J Clin Invest (2014) 124:1037–51. doi: 10.1172/JCI68815
41. Luizon MR, Eckalbar WL, Wang Y, Jones SL, Smith RP, Laurance M, et al. Genomic Characterization of Metformin Hepatic Response. PLoS Genet (2016) 12:e1006449. doi: 10.1371/journal.pgen.1006449
42. Birkenfeld AL, Lee H-Y, Guebre-Egziabher F, Alves TC, Jurczak MJ, Jornayvaz FR, et al. Deletion of the Mammalian INDY Homolog Mimics Aspects of Dietary Restriction and Protects Against Adiposity and Insulin Resistance in Mice. Cell Metab (2011) 14:184–95. doi: 10.1016/j.cmet.2011.06.009
43. Li L, Li H, Garzel B, Yang H, Sueyoshi T, Li Q, et al. SLC13A5 Is a Novel Transcriptional Target of the Pregnane X Receptor and Sensitizes Drug-Induced Steatosis in Human Liver. Mol Pharmacol (2015) 87:674–82. doi: 10.1124/mol.114.097287
44. Stadler LKJ, Farooqi IS. A New Drug Target for Type 2 Diabetes. Cell (2017) 170:12–4. doi: 10.1016/j.cell.2017.06.024
45. Rusu V, Hoch E, Mercader JM, Tenen DE, Gymrek M, Hartigan CR, et al. Type 2 Diabetes Variants Disrupt Function of SLC16A11 Through Two Distinct Mechanisms. Cell (2017) 170:199–212. doi: 10.1016/j.cell.2017.06.011
46. da Silva Xavier G, Bellomo EA, McGinty JA, French PM, Rutter GA. Animal Models of GWAS-Identified Type 2 Diabetes Genes. J Diabetes Res (2013) 2013:906590. doi: 10.1155/2013/906590
Keywords: metformin, transcriptome, solute carrier transporter, insulin sensitivity, obesity
Citation: Le J, Fu Y, Han Q, Wei X, Ji H, Chen Y, Wang Q, Pi P, Li J, Lin X, Zhang X, Zhang Y and Ye J (2021) Restoration of mRNA Expression of Solute Carrier Proteins in Liver of Diet-Induced Obese Mice by Metformin. Front. Endocrinol. 12:720784. doi: 10.3389/fendo.2021.720784
Received: 05 June 2021; Accepted: 08 September 2021;
Published: 30 September 2021.
Edited by:
Guilherme Zweig Rocha, State University of Campinas, BrazilReviewed by:
Shunxing Rong, University of Texas Southwestern Medical Center, United StatesQin Yang, University of California, Irvine, United States
Copyright © 2021 Le, Fu, Han, Wei, Ji, Chen, Wang, Pi, Li, Lin, Zhang, Zhang and Ye. This is an open-access article distributed under the terms of the Creative Commons Attribution License (CC BY). The use, distribution or reproduction in other forums is permitted, provided the original author(s) and the copyright owner(s) are credited and that the original publication in this journal is cited, in accordance with accepted academic practice. No use, distribution or reproduction is permitted which does not comply with these terms.
*Correspondence: Jianping Ye, yejianping@zzu.edu.cn; yejianping@sjtu.edu.cn