 Chun-Ming Ma
 Fu-Zai Yin
- Department of Endocrinology, The First Hospital of Qinhuangdao, Qinhuangdao, China
Objective: The purpose of this study was to observe the relationship between impaired fasting glucose (IFG), impaired glucose tolerance (IGT), and bone mineral density (BMD) in different sites in adolescents.
Methods: A retrospective study was conducted on adolescents age 12–19 years of the United States. Data were extracted from the National Health and Nutrition Examination Survey (NHANES) 2005–2006, 2007–2008, and 2009–2010 cycles. IFG was defined as fasting plasma glucose (FPG) levels that were ≥5.6 and <7.0 mmol/L. IGT was defined as 2-h plasma glucose levels that were ≥7.8 and <11.1 mmol/L after the oral glucose tolerance test (OGTT).
Results: After controlling for age, gender, race, and body mass index (BMI) Z-score, adolescents in different categories of IGT had significantly different levels of areal BMD (aBMD) and bone mineral apparent density (BMAD) (IGT main effect: P < 0.05 for all, two-way ANOVA). There was no main effect between different categories of IFG with regard to aBMD and BMAD (P > 0.05). There was no interaction between IFG and IGT with regard to aBMD and BMAD (P > 0.05). In multiple regression analysis, the 2-h plasma glucose maintained an independent association with femoral neck aBMD (β = −0.011, 95% CI: −0.017~−0.006, P < 0.001, R2 = 0.012), total femur aBMD (β = −0.015, 95% CI: −0.021~−0.009, P < 0.001, R2 = 0.018), total spine aBMD (β = −0.015, 95% CI: −0.020~−0.010, P < 0.001, R2 = 0.018), and total spine BMAD (β = −0.002, 95% CI: −0.003~0.000, P = 0.006, R2 = 0.003).
Conclusion: The present study demonstrates that BMD was decreased in adolescents with IGT. Two-hour plasma glucose, not FPG, negatively correlated with BMD. The effect of 2-h plasma glucose was consistent across the sites of bone.
Introduction
Osteoporosis is a common public health problem that also imposes a tremendous burden. Diabetes is another major public health problem globally. A large number of studies have confirmed the effect of diabetes on bone metabolism. Bone mineral density (BMD) is decreased in type 1 diabetes but increased in T2DM, compared with controls. Both type 1 diabetes and type 2 diabetes are associated with decreased bone strength as well as increased fracture risk (1).
Prediabetes is an in-between condition where blood glucose levels are higher than normal, but not high enough yet to be diagnosed as diabetes. Prediabetes also impact bone metabolism. Bone turnover was lower in those with prediabetes (2). Trabecular bone score, an index of bone quality, was lower in prediabetes. Prediabetes was associated with deterioration of bone microarchitecture (3, 4). Chen et al. analyzed the data from the United States National Health and Nutrition Examination Surveys (NHANES) during the period from 2005 to 2014. The results showed that populations with prediabetes may be exposed to relatively higher BMD but a higher prevalence of fracture (5). In postmenopausal women, osteoporosis was more common in the prediabetes group than in the control group (6). A nationwide population-based cohort study of the Republic of Korea demonstrated that the risks of hip fractures started to increase in prediabetes (7).
Bone is a living tissue that changes throughout our lives. Childhood and adolescence are the most important time for building a strong skeleton. In children and adolescents, the studies about glucose metabolism and bone are focused on T1DM patients. T1DM plays a role in decreasing BMD Z-scores in the whole body and lumbar spine in children and adolescents (8). Hyperglycemia and insulin deficiency can affect bone cell functions, as well as the bone marrow fat, thus impairing the bone strength, geometry, and microarchitecture (9). With the epidemic of childhood obesity, the prevalence of prediabetes among children and adolescents has increased over the past decade (10). Unlike adults, Pollock et al. found that total body bone mineral content (BMC) was 4% lower in overweight children with prediabetes than in those without prediabetes (11). Conversely, Afghani et al. found that the levels of BMC or BMD between children with impaired glucose tolerance (IGT) or normal glucose tolerance were similar in overweight Latino children (12). The different results may be due to the different age, race, or definition of prediabetes.
However, some questions remain unclear in children and adolescents. First, the age ranges were 7 to 11 and 8 to 13 years in these two studies, respectively. There was no study about 14- to 19-year age ranges. Second, as we know, prediabetes includes impaired fasting glucose (IFG) and IGT. No study compared the effect of IFG and IGT on bone metabolism. Third, is the effect of prediabetes consistent across the sites of bone?
The NHANES is a survey research program conducted by the National Center for Health Statistics (NCHS) to assess the health and nutritional status of adults and children in the United States. The NHANES is conducted continuously and has a large sample size. We can obtain the results about the oral glucose tolerance test (OGTT) and femur and spine BMD in adolescents aged 12 to 19 years from NHANES. In our study, we analyzed the relationship between IFG, IGT, and BMD in different sites in adolescents by using the NHANES database.
Methods
Study Design
This cross-sectional study analyzed data from the NHANES. All NHANES data collection protocols were approved by the National Center of Health Statistics Research Ethics Review Board. From 2005 to 2016, the survey started including measurements of OGTT. The femur and spine BMD was not measured in 2011–2012 and 2015–2016 cycles and in subjects with age <40 years in the 2013–2014 cycle. Hence, only three cycles (2005–2006, 2007–2008, and 2009–2010) of data were included in the analysis for this study. This study included adolescents aged ≤19 years. The exclusion criteria were as follows: 1) data about femur and spine BMD missing, 2) data about OGTT missing, 3) subjects have previous medical history of diabetes or taking diabetic pills or insulin to lower blood sugar, 4) subjects had fasting plasma glucose (FPG) levels that were ≥7.0 mmol/L or 2-h plasma glucose levels that were ≥11.1 mmol/L after OGTT, and 5) data about covariates missing. Ethical approval was not required for this study because the study was based on secondary analyses of publicly available data.
Bone Mineral Density
The femur scans and spine scans were acquired with Hologic QDR-4500A fan-beam densitometers (Hologic, Inc., Bedford, MA, USA) and software version Discovery v12.4 in 2005–2006 through 2009–2010. Whole body scans were taken with Hologic QDR-4500A fan-beam densitometer (Hologic, Inc., Bedford, MA, USA) and Hologic software version 8.26:a3* in 2005–2006. Measurements include bone mineral content (BMC) (g) and bone area (cm2). Areal bone mineral density (aBMD) (g/cm2) was calculated as follows: aBMD (g/cm2) = BMC (g)/bone area (cm2). Total spine BMD included L1–L4 vertebra BMD. Total spine bone mineral apparent density (BMAD, g/cm3) was also calculated as follows: Total spine BMAD (g/cm3) = (BMC1 + BMC2 + BMC3 + BMC4)/(V1 + V2 + V3 + V4), where BMCn is the BMC of the nth vertebrae, and Vn is the volume of the nth individual vertebra = bone arean1.5 (13, 14).
Longitudinal monitoring was conducted through the daily spine phantom scans as required by the manufacturer and the once-weekly femur phantom scans in order to correct any scanner-related changes in participant data. The circulating HSP-Q96 and block phantoms, which were scanned at the start of operations at each site, provided additional data for use in longitudinal monitoring and cross calibration.
OGTT Test
Beginning in 2005, an OGTT was added to the laboratory protocol. A fasting glucose blood test was performed on all participants, 12 years and older, who were examined in the morning session, after a 9-h fast. After the initial venipuncture, participants were asked to drink a calibrated dose (generally 75 g of glucose) of Trutol and had a second venipuncture 2 h (plus or minus 15 min) after drinking the Trutol. Glucose concentration was determined by a hexokinase method. Insulin concentration was determined by the Merocodia Insulin ELISA. The following equation was used to calculate the homeostasis model assessment insulin resistance (HOMA-IR) index: (fasting insulin level × fasting glucose level)/22.5 (15).
Definition of the Types of Prediabetes
IFG was defined as FPG levels that were ≥5.6 and <7.0 mmol/L. IGT was defined as 2-h plasma glucose levels that were ≥7.8 and <11.1 mmol/L after OGTT (16). These subjects were divided into four groups according to the levels of glucose: 1) normal glucose regulation group (NGR group): normal FPG and 2-h plasma glucose; 2) IFG group: IFG and normal 2-h plasma glucose; 3) IGT group: normal FPG and IGT; and 4) impaired glucose regulation group (IGR group): both IFG and IGT.
Covariates
Sociodemographic covariates included age, gender, and ethnicity (white vs. non-white). Body measures included body mass index (BMI) and waist circumference (WC). Laboratory measures included triglyceride (TG), C-reactive protein (CRP), and 25-hydroxyvitamin D [25(OH)D].
In the 2005–2006 cycle, total 25(OH)D (sum of 25-hydroxyvitamin D2 and 25-hydroxyvitamin D3) was measured by a radioimmunoassay (DiaSorin) method. In the 2007–2010 cycles, 25(OH)D was measured by an ultra-high-performance liquid chromatography tandem mass spectrometric (LC-MS/MS) method. The following regression equation was used to convert RIA to LC-MS/MS-equivalents for NHANES 2005–2006: LC-MS/MSequivalent = 8.36753 + 0.97012 * RIAoriginal.
Z-score and percentile for BMI were calculated according to CDC curves (https://www.cdc.gov/growthcharts/percentile_data_files.htm). The data were stratified to underweight (<5th percentile), healthy weight (5th–84th percentile), overweight (85th–94th percentile), and obesity (≥95th percentile) based on BMI Z-score (17).
Statistical Analyses
Analyses were performed using the SPSS 24.0 statistical software (SPSS 24.0 for Windows; SPSS, Inc., Chicago, IL, USA) and STATA version 16.0 software (STATA Corporation, TX, USA). Quantitative data were expressed as mean with standard deviation. When not normally distributed, the data were ln-transformed for analysis and are expressed as medians with interquartile ranges. The four groups were compared using the analysis of variance (ANOVA). Categorical data were compared by using the chi-square test. We also ascertained age, gender, race, and BMI Z-score adjusted means of BMD across different phenotypes of prediabetes by using general linear models. Significant differences across different phenotypes of prediabetes were searched by using two-factor ANOVA (normal FPG vs. IFG and normal 2-h plasma glucose vs. IGT), and the main effects of IFG and IGT and the IFG × IGT interaction were tested. A Pearson correlation coefficient was used to measure the strength of association between variables. Multiple linear regression analyses were performed to examine the relationships between BMD, glucose, and other variables. WC was not used because of collinearity with BMI. The analysis was also stratified by BMI category. P <0.05 was considered statistically significant.
Results
Figure 1 summarizes the selection process of the study. Eventually, a total of 1,445 subjects (807 boys and 638 girls), aged 15.9 ± 2.3 years were enrolled in this study. Of these subjects, 230 (15.9%) had IFG only, 46 (3.2%) had IGT only, and 20 (1.4%) had both IFG and IGT.
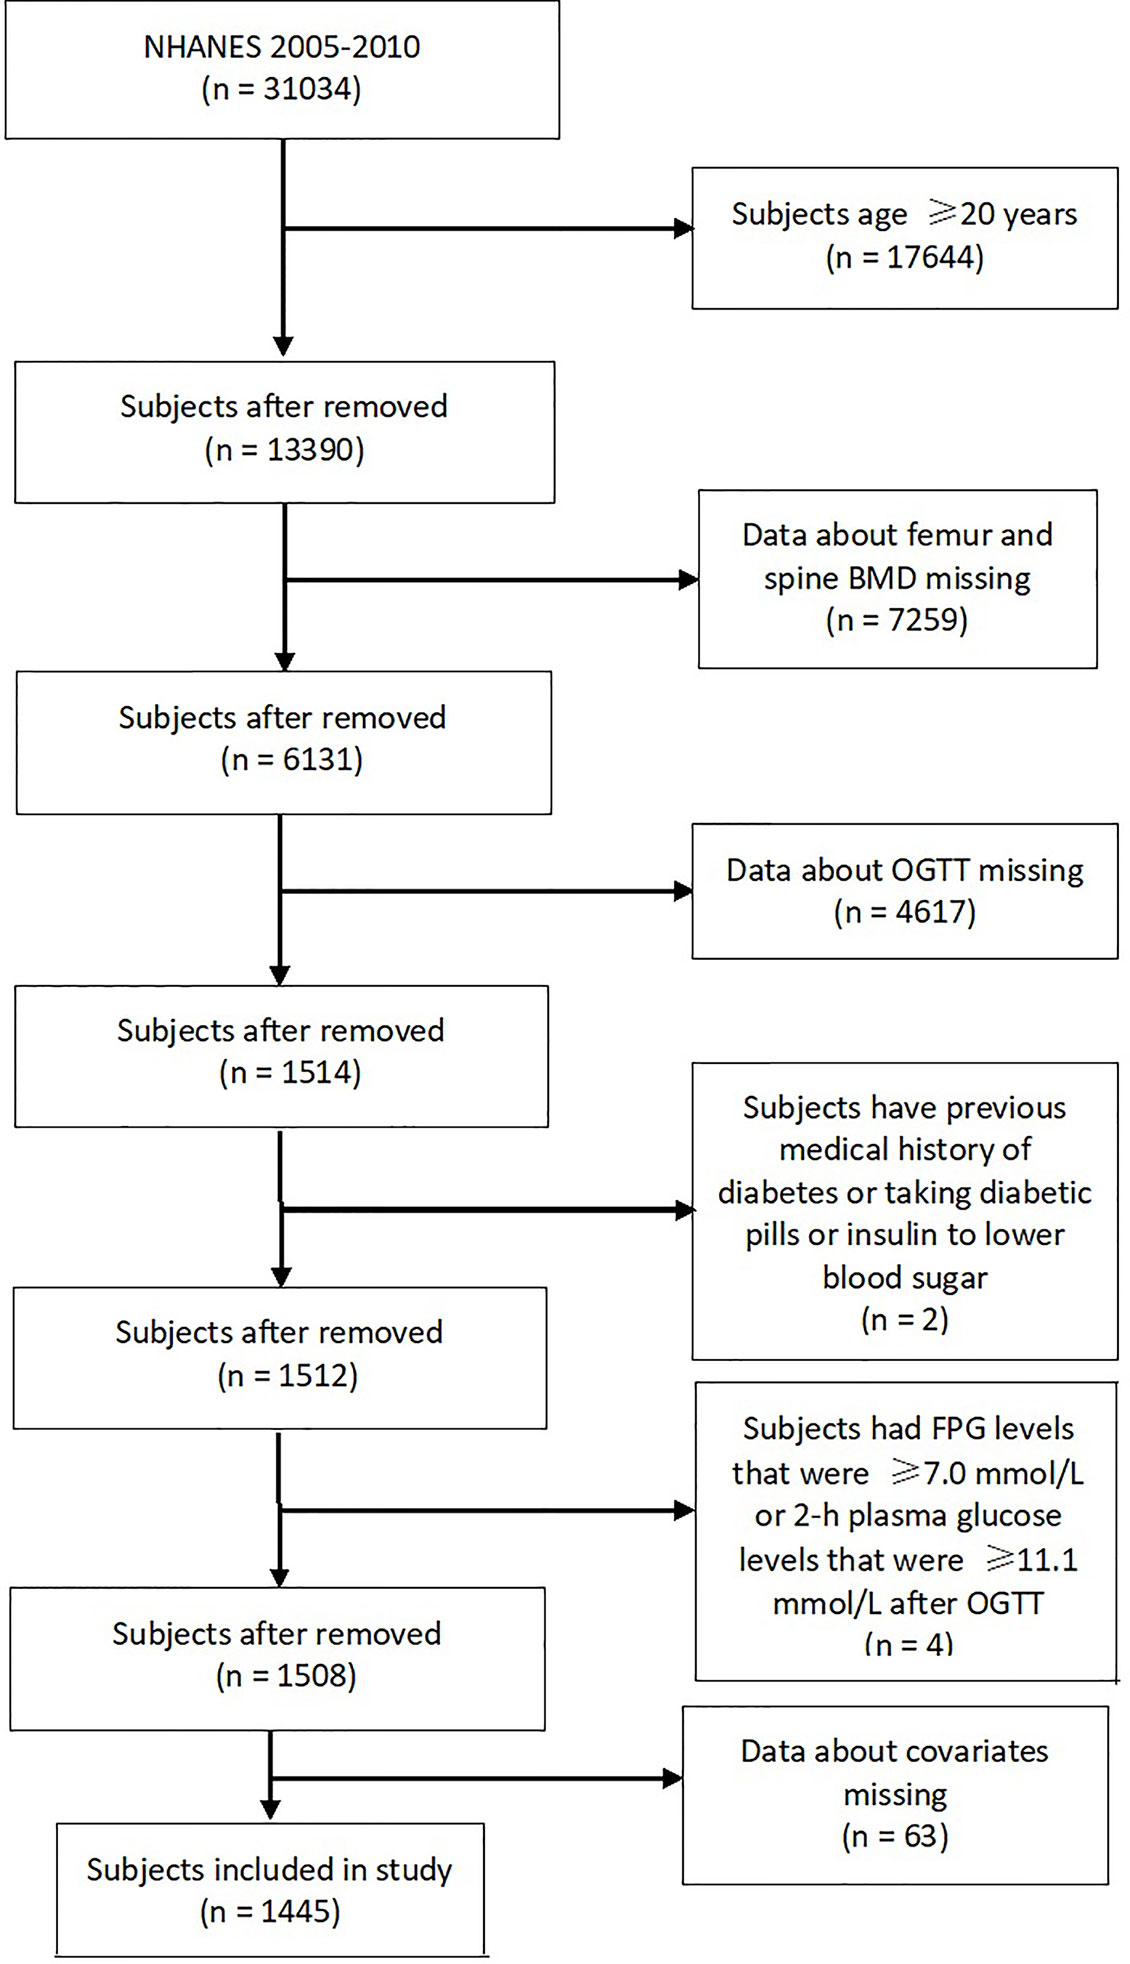
Figure 1 Flowchart of the selection of participants.
Demographic information, as well as anthropometric, biochemical, and BMD data, are presented in Table 1. The levels of age were lower in subjects in the IGT group than subjects in the NGR group and IFG group (P < 0.05). The frequencies of boys were higher in subjects in the IFG group than subjects in the NGR, IGT, and IGR groups (P < 0.05). The proportions of race were similar in the four groups (P > 0.05). BMI and WC were all significantly higher in the IGR than in the NGR, IFG, and IGT groups (P < 0.05). BMI Z-score was significantly higher in the IFG and IGR groups than in the NGR (P < 0.05). The levels of TG were higher in subjects in the IFG, IGT, and IGR groups than subjects in the NGR group (P < 0.05). The levels of CRP were higher in subjects in the IGT and IGR groups than subjects in the NGR group (P < 0.05). 25(OH)D was significantly lower in the IGR than in the NGR, IFG, and IGT groups (P < 0.05). The levels of HOMA-IR were higher in subjects in the IFG, IGT, and IGR groups than subjects in the NGR group and were higher in subjects in the IGR group than subjects in the IFG and IGT groups (P < 0.05). The levels of BMC were lower in subjects in the IGT group than subjects in the NGR and IFG groups (P < 0.05). The levels of femoral neck aBMD and total femur aBMD were lower in subjects in the IGT group than subjects in the NGR, IFG, and IGR groups (P < 0.05). The levels of total spine aBMD were lower in subjects in the IFG and IGT groups than subjects in the NGR group (P < 0.05). The levels of total spine BMAD were lower in subjects in the IFG group than subjects in the NGR group (P < 0.05).
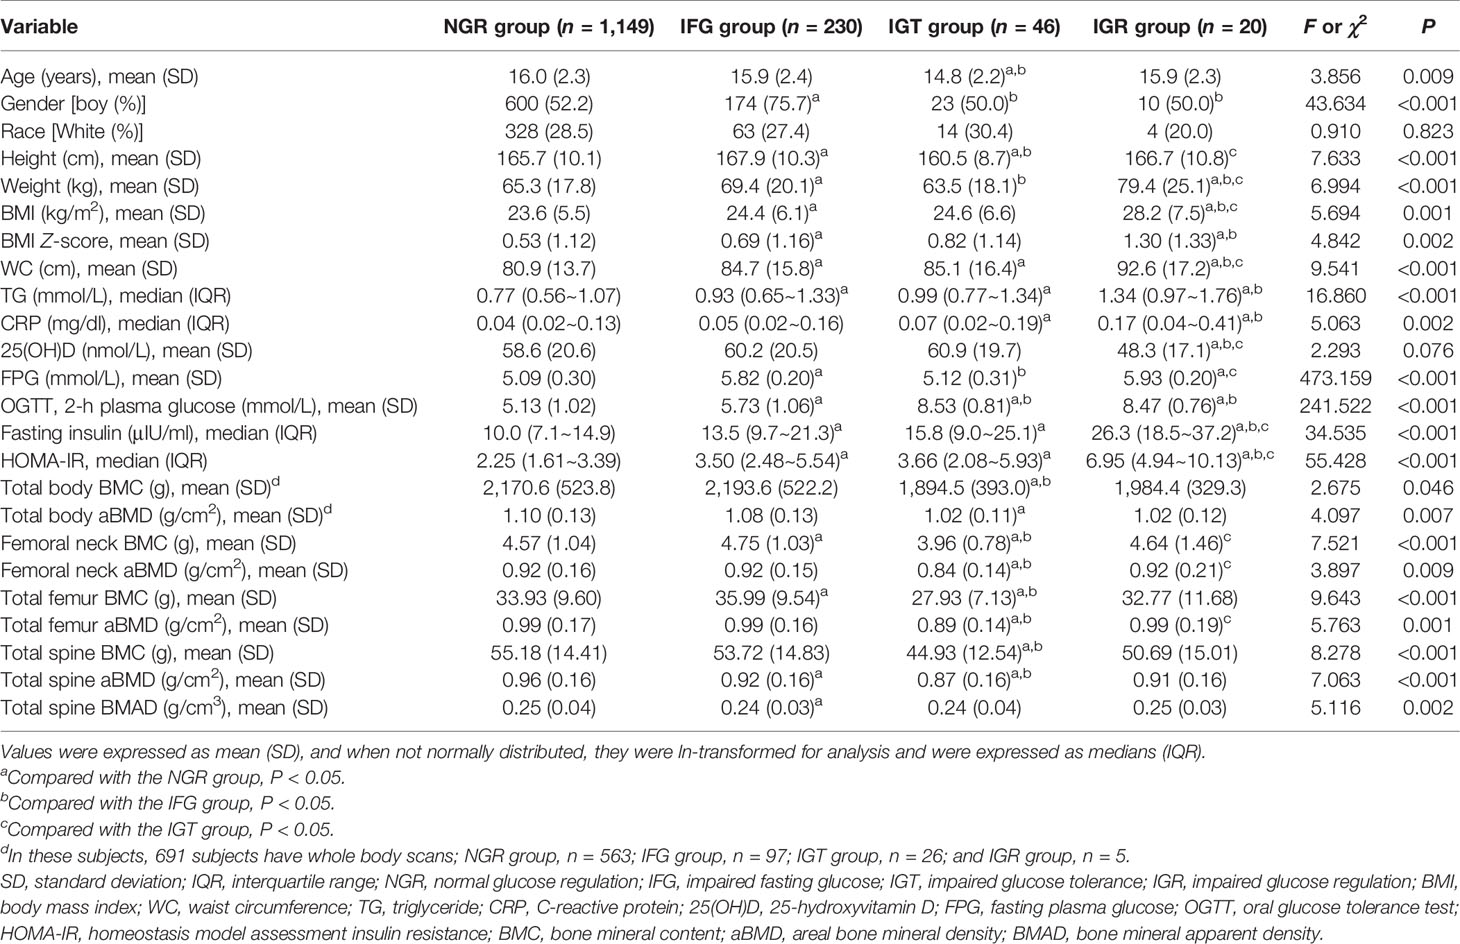
Table 1 Clinical and laboratory characteristics of the subjects in each group.
Multivariate-adjusted means of BMD across different phenotypes of prediabetes are given in Table 2. After controlling for age, gender, race, and BMI Z-score, adolescents in different categories of IGT had significantly different levels of aBMD and BMAD (IGT main effect: P < 0.05 for all, two-way ANOVA). After controlling for age, gender, race, and BMI Z-score, adolescents with IGT have lower levels of aBMD and BMAD than adolescents with normal 2-h plasma glucose. There was no main effect between different categories of IFG with regard to aBMD and BMAD (P > 0.05). There was no interaction between IFG and IGT with regard to aBMD and BMAD (P > 0.05).
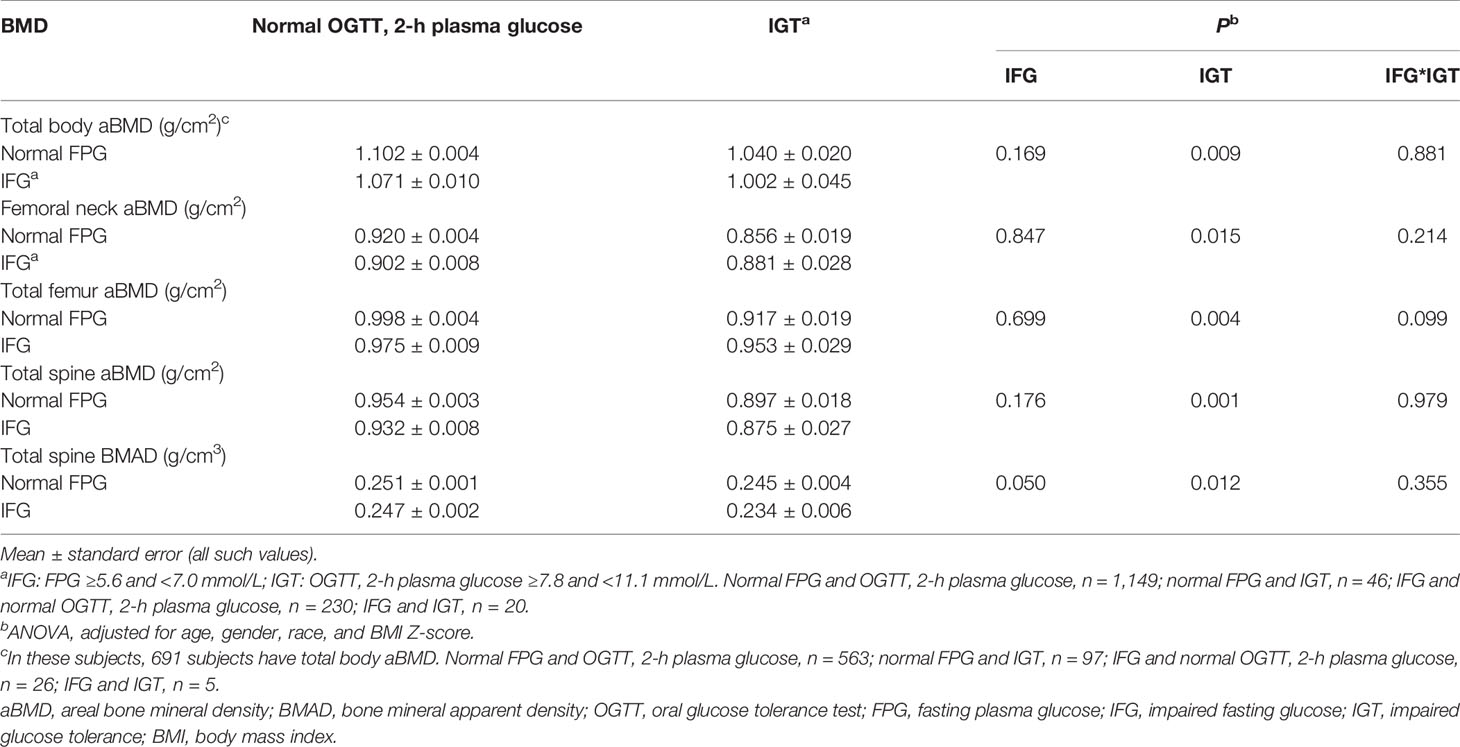
Table 2 Multivariate-adjusted means for bone mineral density across phenotypes of prediabetes.
The correlation coefficients between aBMD and BMAD and glucose for all of the subjects are shown in Table 3. FPG was negatively correlated with total spine aBMD (r = −0.077, P = 0.003) and total spine BMAD (r = −0.104, P = 0.003). Two-h plasma glucose was negatively correlated with femoral neck aBMD (r = −0.101, P < 0.001), total femur aBMD (r = −0.140, P < 0.001), total spine aBMD (r = −0.159, P < 0.001), and total spine BMAD (r = −0.060, P = 0.022). HOMA-IR was positively correlated with femoral neck aBMD (r = 0.088, P = 0.001), total femur aBMD (r = 0.058, P = 0.027), total spine aBMD (r = 0.060, P = 0.023), and total spine BMAD (r = 0.137, P < 0.001).
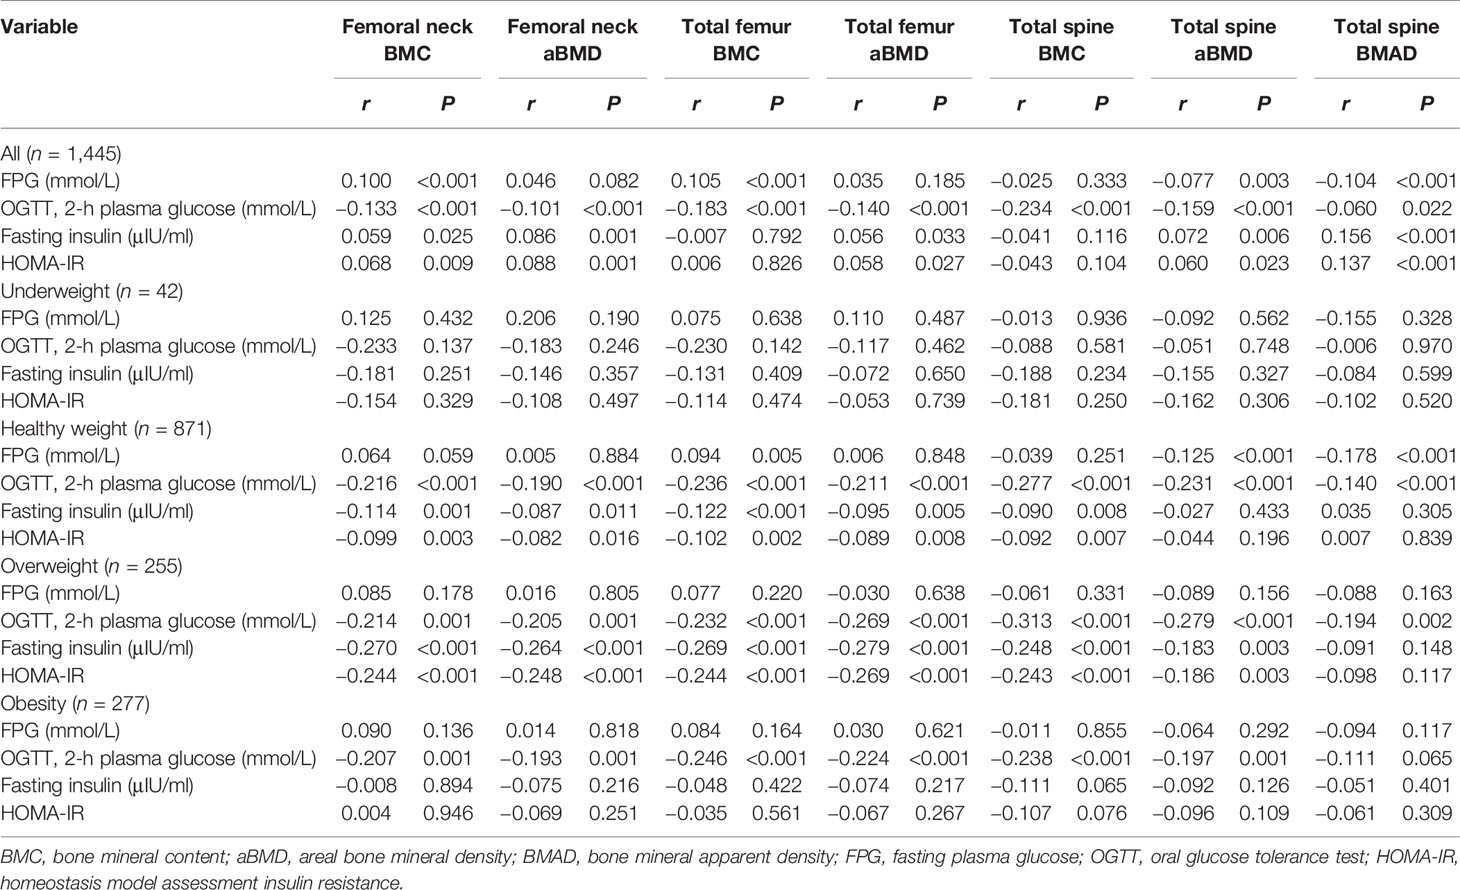
Table 3 Simple correlations between bone mineral density and glucose in adolescents.
When subjects were stratified by BMI category, 2-h plasma glucose was negatively correlated with femoral neck aBMD, total femur aBMD, and total spine aBMD in subjects with healthy weight, overweight, and obesity (P < 0.05). Two-hour plasma glucose was negatively correlated with total spine BMAD in subjects with healthy weight and overweight (P < 0.05) (Table 3).
When femoral neck aBMD, total femur aBMD, total spine aBMD, and total spine BMAD were considered as the dependent variables in a multiple regression analysis with age, gender, race, BMI Z-score, TG, CRP, 25(OH)D, FPG, and 2-h plasma glucose as independent variables (model 1), the 2-h plasma glucose maintained an independent association with femoral neck aBMD (β = −0.011, 95% CI: −0.017~−0.006, P < 0.001, R2 = 0.012), total femur aBMD (β = −0.015, 95% CI: −0.021~−0.009, P < 0.001, R2 = 0.018), total spine aBMD (β = −0.015, 95% CI: −0.020~−0.010, P < 0.001, R2 = 0.018), and total spine BMAD (β = −0.002, 95% CI: −0.003~0.000, P = 0.006, R2 = 0.003) (Supplementary Table 1).
When femoral neck aBMD, total femur aBMD, total spine aBMD, and total spine BMAD were considered as the dependent variables in a multiple regression analysis with age, gender, race, BMI Z-score, TG, CRP, 25(OH)D, HOMA-IR, and 2-h plasma glucose as independent variables (model 2), the 2-h plasma glucose maintained an independent association with femoral neck aBMD (β = −0.010, 95% CI: −0.015~−0.004, P < 0.001, R2 = 0.012), total femur aBMD (β = −0.014, 95% CI: −0.019~−0.008, P < 0.001, R2 = 0.018), total spine aBMD (β = −0.015, 95% CI: −0.020~−0.010, P < 0.001, R2 = 0.018), and total spine BMAD (β = −0.002, 95% CI: −0.003~0.000, P = 0.006, R2 = 0.003) (Supplementary Table 2).
In these subjects, 691 subjects have whole body scans. The levels of total body BMC and aBMD were lower in subjects in the IGT group than subjects in the NGR group (P < 0.05) (Table 1). After controlling for age, gender, race, and BMI Z-score, adolescents with IGT have lower levels of total body aBMD than adolescents with normal 2-h plasma glucose (IGT main effect: P < 0.05 for all, two-way ANOVA) (Table 2). Two-hour plasma glucose was negatively correlated with total body BMC (r = −0.219, P < 0.001) and aBMD (r = −0.213, P < 0.001). When 5total body aBMD was considered as the dependent variable in a multiple regression analysis with age, gender, race, BMI Z-score, lean mass, TG, CRP, 25(OH)D, FPG, and 2-h plasma glucose as independent variables (model 1), the 2-h plasma glucose maintained an independent association with total body aBMD (β = −0.008, 95% CI: −0.014~−0.003, P = 0.003, R2 = 0.007) (Supplementary Table 3). When total body aBMD was considered as the dependent variable in a multiple regression analysis with age, gender, race, BMI Z-score, lean mass, TG, CRP, 25(OH)D, HOMA-IR, and 2-h plasma glucose as independent variables (model 2), the 2-h plasma glucose maintained an independent association with total body aBMD (β = −0.006, 95% CI: −0.012~−0.001, P = 0.029, R2 = 0.004) (Supplementary Table 3).
Discussion
The results of the present study show that BMD levels were decreased in adolescents aged 12~19 years with IGT. The levels of BMD were lower in the IGT group, but not in the IGR group. BMD levels were affected by age, gender, race, and BMI (18, 19). Age, gender, and BMI Z-score were unmatched between the four groups. After adjusting for these confounding factor, we found that the means of BMD were lower in both the IGT and IGR groups. In the two-factor ANOVA, IGT, not IFG, had a main effect on BMD in adolescents.
The relationship between 2-h plasma glucose and aBMD has been analyzed in previous research. Jia et al. found that 2-h plasma glucose negatively correlated with femoral neck aBMD and lumbar spine aBMD in women (20). However, the negative correlation was not observed in two studies about children (11, 12). In our study, 2-h plasma glucose negatively correlated with aBMD, and no relationships were observed between FPG and aBMD. Two-hour plasma glucose can explain 1%–2% of the total variance of aBMD in adolescents. A relationship between FPG and aBMD was not found in this study.
Adolescent bone density is closely related to height, and low (or high) bone density relative to that of same-age peers may be attributed to short (or taller) stature (21). The International Society for Clinical Densitometry recommended BMAD as a suitable size adjustment technique (22). Total spine BMAD can eliminate the effect of height on BMD in children and adolescents (23). Some studies found the association between BMAD and risk of fracture in children and adolescents (24, 25). In our study, 2-h plasma glucose also negatively correlated with BMAD.
In previous studies (11, 12), the study populations were overweight. Weight status influenced BMD in children and adolescents. A meta-analysis showed that overweight and obese children have a significantly higher BMD compared with normal weight children (26). In our study, study population was stratified according to BMI Z-score. Two-hour plasma glucose negatively correlated with BMD across adolescents with healthy weight, overweight, and obesity. It means that the relationship between 2-h plasma glucose and BMD was independent of weight status.
Femur and spine are both common sites that measure BMD. However, there are some differences between femur BMD and spine BMD. Femoral neck reflects cortical bone and spine reflect trabecular bone. In our study, the effect of IGT is consistent across the sites of bone. Using multivariate regression models, we found that 1.2% of the total variance of femoral neck and 1.8% of the total variance of spine were due to 2-h plasma glucose.
Adolescents with IGT and IGR had higher levels of TG, CRP, and HOMA-IR. We observed an independent association of BMD with TG, CRP, and HOMA-IR levels. Kindler et al. found that HOMA-IR was negatively associated with lumbar spine BMC and total body areal BMD (27). Xiao et al. observed a significantly inverse association between TG level and calcaneus BMD in boys and girls aged 6–16 years in Beijing (28). In adolescent patients, systemic inflammation was also associated with bone health (29, 30). The results show that the presence of lipotoxicity, insulin resistance, and chronic inflammation may lead to a further decline of the BMD in adolescents with IGT.
There are limitations to our study. BMD is influenced by other factors in adolescents, such as age, gender, and pubertal development (31). The study was a secondary analysis. The raw data were downloaded from NHANES. BMD Z-score and Tanner stage were not evaluated in NHANES. In addition, the sample of the IGR group is small. It should be validated in a larger population.
In conclusion, the present study demonstrates that BMD was decreased in adolescents with IGT. Two-hour plasma glucose, not FPG, negatively correlated with BMD. The effect of 2-h plasma glucose was consistent across the sites of bone.
Data Availability Statement
Publicly available datasets were analyzed in this study. These can be found here: https://www.cdc.gov/nchs/nhanes/.
Author Contributions
C-MM analyzed the data and wrote the paper. F-ZY designed the study. All authors contributed to the article and approved the submitted version.
Conflict of Interest
The authors declare that the research was conducted in the absence of any commercial or financial relationships that could be construed as a potential conflict of interest.
Publisher’s Note
All claims expressed in this article are solely those of the authors and do not necessarily represent those of their affiliated organizations, or those of the publisher, the editors and the reviewers. Any product that may be evaluated in this article, or claim that may be made by its manufacturer, is not guaranteed or endorsed by the publisher.
Supplementary Material
The Supplementary Material for this article can be found online at: https://www.frontiersin.org/articles/10.3389/fendo.2021.749998/full#supplementary-material
References
1. Poiana C, Capatina C. Fracture Risk Assessment in Patients With Diabetes Mellitus. J Clin Densitometry Off J Int Soc Clin Densitometry (2017) 20:432–43. doi: 10.1016/j.jocd.2017.06.011
2. Holloway-Kew KL, De Abreu LLF, Kotowicz MA, Sajjad MA, Pasco JA. Bone Turnover Markers in Men and Women With Impaired Fasting Glucose and Diabetes. Calcif Tissue Int (2019) 104:599–604. doi: 10.1007/s00223-019-00527-y
3. Ho-Pham LT, Tran B, Do AT, Nguyen TV. Association Between Pre-Diabetes, Type 2 Diabetes and Trabecular Bone Score: The Vietnam Osteoporosis Study. Diabetes Res Clin Pract (2019) 155:107790. doi: 10.1016/j.diabres.2019.107790
4. Lui DTW, Lee CH, Chau VWK, Fong CHY, Yeung KMY, Lam JKY, et al. Potential Role of Fibroblast Growth Factor 21 in the Deterioration of Bone Quality in Impaired Glucose Tolerance. J Endocrinol Invest (2021) 44:523–30. doi: 10.1007/s40618-020-01337-y
5. Chen C, Chen Q, Nie B, Zhang H, Zhai H, Zhao L, et al. Trends in Bone Mineral Density, Osteoporosis, and Osteopenia Among U.S. Adults With Prediabetes, 2005-2014. Diabetes Care (2020) 43:1008–15. doi: 10.2337/dc19-1807
6. Topaloglu US, Erol K. Bone Mineral Density and Fracture Risk in Prediabetes: A Controlled Cross-Sectional Study. Acta Reumatol Port (2021) 46:32–9.
7. Park HY, Han K, Kim Y, Kim YH, Sur YJ. The Risk of Hip Fractures in Individuals Over 50 Years Old With Prediabetes and Type 2 Diabetes - A Longitudinal Nationwide Population-Based Study. Bone (2021) 142:115691. doi: 10.1016/j.bone.2020.115691
8. Zhu Q, Xu J, Zhou M, Lian X, Xu J, Shi J. Association Between Type 1 Diabetes Mellitus and Reduced Bone Mineral Density in Children: A Meta-Analysis. Osteoporosis Int J Established Result Coop Between Eur Foundation Osteoporosis Natl Osteoporosis Foundation USA (2021) 32:1143–52. doi: 10.1007/s00198-020-05715-3
9. Brunetti G, D’Amato G, De Santis S, Grano M, Faienza MF. Mechanisms of Altered Bone Remodeling in Children With Type 1 Diabetes. World J Diabetes (2021) 12:997–1009. doi: 10.4239/wjd.v12.i7.997
10. Kim JH, Lim JS. Trends of Diabetes and Prediabetes Prevalence Among Korean Adolescents From 2007 to 2018. J Korean Med Sci (2021) 36:e112. doi: 10.3346/jkms.2021.36.e112
11. Pollock NK, Bernard PJ, Wenger K, Misra S, Gower BA, Allison JD, et al. Lower Bone Mass in Prepubertal Overweight Children With Prediabetes. J Bone Mineral Res Off J Am Soc Bone Mineral Res (2010) 25:2760–9. doi: 10.1002/jbmr.184
12. Afghani A, Cruz ML, Goran MI. Impaired Glucose Tolerance and Bone Mineral Content in Overweight Latino Children With a Family History of Type 2 Diabetes. Diabetes Care (2005) 28:372–8. doi: 10.2337/diacare.28.2.372
13. Carter DR, Bouxsein ML, Marcus R. New Approaches for Interpreting Projected Bone Densitometry Data. J Bone Mineral Res Off J Am Soc Bone Mineral Res (1992) 7:137–45. doi: 10.1002/jbmr.5650070204
14. Crabtree NJ, Shaw NJ, Bishop NJ, Adams JE, Mughal MZ, Arundel P, et al. Amalgamated Reference Data for Size-Adjusted Bone Densitometry Measurements in 3598 Children and Young Adults-The ALPHABET Study. J Bone Mineral Res Off J Am Soc Bone Mineral Res (2017) 32:172–80. doi: 10.1002/jbmr.2935
15. Matthews DR, Hosker JP, Rudenski AS, Naylor BA, Treacher DF, Turner RC. Homeostasis Model Assessment: Insulin Resistance and Beta-Cell Function From Fasting Plasma Glucose and Insulin Concentrations in Man. Diabetologia (1985) 28:412–9. doi: 10.1007/BF00280883
16. American Diabetes A. 2. Classification and Diagnosis of Diabetes: Standards of Medical Care in Diabetes-2021. Diabetes Care (2021) 44:S15–33. doi: 10.2337/dc21-S002
17. Barlow SE, Expert C. Expert Committee Recommendations Regarding the Prevention, Assessment, and Treatment of Child and Adolescent Overweight and Obesity: Summary Report. Pediatrics (2007) 120(Suppl 4):S164–92. doi: 10.1542/peds.2007-2329C
18. Lopez-Gonzalez D, Wells JC, Cortina-Borja M, Fewtrell M, Partida-Gaytan A, Clark P. Reference Values for Bone Mineral Density in Healthy Mexican Children and Adolescents. Bone (2021) 142:115734. doi: 10.1016/j.bone.2020.115734
19. Seo YG, Kim Y, Lim H, Kang MJ, Park KH. Relationship Between Bone Mineral Density and Body Compositions According to Obesity Status in Children. Endocr Pract (2021) 27:983–91. doi: 10.1016/j.eprac.2021.06.006
20. Jia X, Liu L, Wang R, Liu X, Liu B, Ma N, et al. Relationship of Two-Hour Plasma Glucose and Abdominal Visceral Fat With Bone Mineral Density and Bone Mineral Content in Women With Different Glucose Metabolism Status. Diabetes Metab Syndr Obes (2020) 13:851–8. doi: 10.2147/DMSO.S245096
21. Zemel BS, Leonard MB, Kelly A, Lappe JM, Gilsanz V, Oberfield S, et al. Height Adjustment in Assessing Dual Energy X-Ray Absorptiometry Measurements of Bone Mass and Density in Children. J Clin Endocrinol Metab (2010) 95:1265–73. doi: 10.1210/jc.2009-2057
22. Crabtree NJ, Arabi A, Bachrach LK, Fewtrell M, El-Hajj Fuleihan G, Kecskemethy HH, et al. Dual-Energy X-Ray Absorptiometry Interpretation and Reporting in Children and Adolescents: The Revised 2013 ISCD Pediatric Official Positions. J Clin Densitometry Off J Int Soc Clin Densitometry (2014) 17:225–42. doi: 10.1016/j.jocd.2014.01.003
23. Duran I, Martakis K, Rehberg M, Semler O, Schoenau E. Individualized Evaluation of Lumbar Bone Mineral Density and Bone Mineral Apparent Density in Children and Adolescents. Arch Osteoporos (2018) 13:117. doi: 10.1007/s11657-018-0532-7
24. Jeddi M, Dabbaghmanesh MH, Kharmandar A, Ranjbar Omrani G, Bakhshayeshkaram M. Prevalence of Fracture in Healthy Iranian Children Aged 9-18 Years and Associated Risk Factors; A Population Based Study. Bull Emerg Trauma (2017) 5:29–35.
25. Goulding A, Jones IE, Taylor RW, Manning PJ, Williams SM. More Broken Bones: A 4-Year Double Cohort Study of Young Girls With and Without Distal Forearm Fractures. J Bone Mineral Res Off J Am Soc Bone Mineral Res (2000) 15:2011–8. doi: 10.1359/jbmr.2000.15.10.2011
26. van Leeuwen J, Koes BW, Paulis WD, van Middelkoop M. Differences in Bone Mineral Density Between Normal-Weight Children and Children With Overweight and Obesity: A Systematic Review and Meta-Analysis. Obes Rev (2017) 18:526–46. doi: 10.1111/obr.12515
27. Kindler JM, Lobene AJ, Vogel KA, Martin BR, McCabe LD, Peacock M, et al. Adiposity, Insulin Resistance, and Bone Mass in Children and Adolescents. J Clin Endocrinol Metab (2019) 104:892–9. doi: 10.1210/jc.2018-00353
28. Xiao P, Hou DQ, Gao AY, Zhu ZX, Yu ZC, Lin NX, et al. The Association Between Blood Lipids and Calcaneus Bone Mineral Density in Children and Adolescents Aged 6-16 Years in Beijing. Zhonghua Yu Fang Yi Xue Za Zhi (2019) 53:196–201. doi: 10.3760/cma.j.issn.0253-9624.2019.02.014
29. Kim SH, Kim KH, Kim MY, Hong YS, Kang KY. A 2-Year Longitudinal Study of Bone Health in Adolescent Patients With Axial Spondyloarthritis. Arch Osteoporos (2021) 16:12. doi: 10.1007/s11657-020-00860-y
30. Heilman K, Zilmer M, Zilmer K, Tillmann V. Lower Bone Mineral Density in Children With Type 1 Diabetes Is Associated With Poor Glycemic Control and Higher Serum ICAM-1 and Urinary Isoprostane Levels. J Bone Miner Metab (2009) 27:598–604. doi: 10.1007/s00774-009-0076-4
Keywords: prediabetes, impaired fasting glucose, impaired glucose tolerance, bone mineral density, adolescents
Citation: Ma C-M and Yin F-Z (2021) The Relationship Between Prediabetes and Bone Mass in Adolescents: Analysis of the National Health and Nutrition Examination Survey From 2005 to 2010. Front. Endocrinol. 12:749998. doi: 10.3389/fendo.2021.749998
Received: 30 July 2021; Accepted: 04 October 2021;
Published: 25 October 2021.
Edited by:
Giacomina Brunetti, University of Bari Aldo Moro, ItalyReviewed by:
Carla Caffarelli, University of Siena, ItalyDanilo Fintini, Bambino Gesù Children Hospital (IRCCS), Italy
Copyright © 2021 Ma and Yin. This is an open-access article distributed under the terms of the Creative Commons Attribution License (CC BY). The use, distribution or reproduction in other forums is permitted, provided the original author(s) and the copyright owner(s) are credited and that the original publication in this journal is cited, in accordance with accepted academic practice. No use, distribution or reproduction is permitted which does not comply with these terms.
*Correspondence: Fu-Zai Yin, yinfuzai62@163.com