 Xueke Song1,2†Yingqi Lv1,2†Nan Huang1,2†Jinfang Sun3Ting Yang1,2Xiaoyuan Wang1,2Jianan Zhang1,2Ziwei Zhou1,2Huihua Gao4Jie Li5Wei Zhang6
 Han Yin1,2Qiong Wei1,2Kun Wang7*
 Ling Li1,2*
- 1Department of Endocrinology, Zhongda Hospital, Southeast University, Nanjing, China
- 2Institute of Glucose and Lipid Metabolism, Southeast University, Nanjing, China
- 3MoE Key Laboratory of Environmental Medicine Engineering, School of Public Health, Southeast University, Nanjing, China
- 4Department of Internal Medicine, Xigang Community Health Service Center, Nanjing, China
- 5Department of Endocrinology, Nanjing Central Hospital, Nanjing, China
- 6Department of Endocrinology, Second People’s Hospital of Wuhu, Wuhu, China
- 7Department of Endocrinology, Nanjing Jiangning Hospital, Nanjing, China
Introduction: This study aimed to explore the novel classification of inpatients with new-onset diabetes in Eastern China by the cluster-based classification method and compare the clinical characteristics among the different subgroups.
Methods: A total of 1017 Inpatients with new-onset diabetes of five hospitals in Eastern China were included in the study. Clustering analysis was used to cluster the data into five subgroups according to six basic variables. The differences in clinical characteristics, treatments, and the prevalence of diabetes-related diseases among the five subgroups were analyzed by multiple groups comparisons and pairwise comparisons. The risk of diabetes-related diseases in the five subgroups was compared by calculating odd ratio (OR). P value < 0.05 was considered significant.
Results: Five subgroups were obtained by clustering analysis with the highest proportion of patients with severe insulin-deficient diabetes (SIDD) 451 (44.35%), followed by patients with mild age-related diabetes (MARD) 236 (23.21%), patients with mild obesity-related diabetes (MOD) 207 (20.35%), patients with severe insulin-resistant diabetes (SIRD) 81 (7.96%), and patients with severe autoimmune diabetes (SAID) 42 (4.13%). Five subtypes had their own unique characteristics and treatments. The prevalence and risk of diabetes-related complications and comorbidities were also significantly different among the five subtypes. Diabetic kidney disease (DKD) was the most common in SIRD group. Patients in SIDD, SIRD, and MARD groups were more likely to develop cardiovascular disease (CVD) and/or stroke, diabetic peripheral vascular disease (DPVD), and diabetic distal symmetric polyneuropathy (DSPN). The prevalence and risk of metabolic syndrome (MS) were the highest in MOD and SIRD groups. Patients in SAID group had the highest prevalence and risk of diabetic ketoacidosis (DKA). Patients with MOD were more likely to develop non-alcoholic fatty liver disease (NAFLD).
Conclusions: The inpatients with new-onset diabetes in Eastern China had the unique clustering distribution. The clinical characteristics, treatments, and diabetes-related complications and comorbidities of the five subgroups were different, which may provide the basis for precise treatments of diabetes.
1 Introduction
With the global economic development and population aging trend, the number of patients with diabetes mellitus has risen sharply worldwide (1). The disease has become a critical health concern all over the world owing to its high prevalence and related disability and mortality (2). However, existing treatment strategies have been unable to prevent the progression of the disease and the development of its related complications and comorbidities. In addition to gestational diabetes and other special types of diabetes, diabetes was conventionally classified into type 1 diabetes mellitus and type 2 diabetes mellitus, but type 2 diabetes mellitus were highly heterogeneous (3). The clinical manifestations, response to treatments, metabolic control, occurrence and development of complications and comorbidities, severity, and prognosis of type 2 diabetes mellitus might vary widely (4). The current classification system was far from meeting the needs of clinicians and patients for precise treatments of diabetes (5, 6). Therefore, the accurate classification of diabetes contributes to the individualized development of clinical treatment strategies and plays a crucial role in the management of chronic diseases. Findings of a Swedish cohort study challenged the current paradigm of classifying patients with diabetes (7). They used clustering analysis that identified five exclusive diabetes subgroups as severe autoimmune diabetes (SAID), severe insulin-deficient diabetes (SIDD), severe insulin-resistant diabetes(SIRD), mild obesity-related diabetes (MOD), and mild age-related diabetes (MARD) according to six variables including age at onset of diabetes, body mass index (BMI), glycated hemoglobin A1c (HbA1c), homoeostatic model assessment 2 estimates of β-cell function index (HOMA2-β), homoeostatic model assessment 2 estimates of insulin resistance index (HOMA2-IR), and presence or absence of glutamic acid decarboxylase antibody (GADA). The study also found that these five subgroups had different disease progression and the risk of diabetes-related complications (7). At present, the stability and applicability of this new cluster-based classification have been validated in populations of multiple regions, ethnicities, and disease backgrounds (8–12). This new cluster-based classification provided a new clinical idea that helped to bring personalized medicine to the forefront of treatments, and might reduce the risk of diabetes-related complications and comorbidities.
This multicenter study was a three-year cross-sectional observational study aimed at (1) exploring the new classification of hospitalized patients with diabetes in Eastern China by the novel cluster-based classification method, (2) comparing the differences in clinical characteristics, treatments, and diabetes-related complications and comorbidities among the five subgroups.
2 Methods
2.1. Study Population
Medical service institutions are divided into three levels according to their scales and functions in China. First level medical service institutions are community-centered primary health care institutions. Second level medical service institutions are regional hospitals centered on autonomous cities or districts to provide comprehensive medical services for multiple communities. Third level medical service institutions are large-scale hospitals that provide high-level specialized medical services for several regions and carry out higher education and scientific research tasks. This study enrolled hospitalized patients with new-onset diabetes in the Department of Endocrinology at Zhongda Hospital Affiliated to Southeast University (third level medical service institution), Affiliated Jiangning Hospital of Nanjing Medical University (third level medical service institution), The Second People’s Hospital of Wuhu (third level medical service institution), Nanjing Central Hospital (second level medical service institution), and Xigang Community Health Service Center (first level medical service institution) from July 2018 to July 2021. All patients included in the study met the following inclusion criteria: (1) patients were first diagnosed with diabetes (duration of diabetes ≤ 2 years) based on the 1999 criteria of the WHO (13), (2) Data of fasting plasma glucose (FPG) and postprandial blood glucose (PBG) at diagnosis was available, (3) Without any antihyperglycemic drugs before hospitalization. Exclusion criteria: (1) active infection, (2) serious other systemic diseases, (3) receiving glucocorticoid, (4) diagnosed as gestational diabetes and other special types of diabetes, (5) incomplete relevant clinical data. All patients were eligible for this study signed informed consent documents. The study was approved by the ethics committees of the hospitals.
2.2. Research Contents
Demographic information including age, sex, emaciation, symptoms of polydipsia, polyuria, and polyphagia (3P), smoking status, alcohol, and diabetic family history (DFH) were inquired and recorded by professional resident physicians on the day of hospitalization. After resting quietly for at least five minutes, systolic blood pressure (SBP) and diastolic blood pressure (DBP) were measured and recorded with the standard electronic sphygmomanometer by primary nurses. In the morning of the next day (at least eight hours after fasting), the height and weight of participants with thin clothes and trousers were measured and recorded by primary nurses.
In the morning of the next day (at least eight hours after fasting), peripheral venous blood samples of 5-10 ml were collected of all subjects to test related laboratory indexes. HbA1c was measured by high performance liquid chromatography with HbA1c analyzers (BIO-RAD D-10). The alanine aminotransferase (ALT), aspartate aminotransferase (AST), alkaline phosphatase (ALP), γ-glutamyl transpeptidase (GGT) were measured by rate assay with automatic biochemical analyzers (BECKMAN COULTER AU5821/BECKMAN COULTER AU5421/HITACHI 7180). The glycosylated albumin (GA), triglyceride (TG), total cholesterol (TC), high density lipoprotein cholesterol (HDL-C), low density lipoprotein choleste (LDL-C), serum uric acid (SUA) were measured by endpoint method with automatic biochemical analyzers (BECKMAN COULTER AU5821/BECKMAN COULTER AU5421/HITACHI 7180). The serum creatinine (SCr) was detected by picric acid with automatic biochemical analyzers (BECKMAN COULTER AU5821/BECKMAN COULTER AU5421/HITACHI 7180). The platelet (PLT) was detected by light scattering technique with automatic blood cell analyzers (BECKMAN COULTER DXH600/800). Diabetes-related auto-antibodies including GADA, zinc transporter 8 antibody (ZnT8A), protein tyrosine phosphatase 2 antibody (IA-2A), islet cell antibody-40KD (ICA-40KD), islet cell antibody-120KD (ICA-120KD), islet cell antibody-64KD (ICA-64KD), and insulin autoantibody-5.8KD (IAA-5.8KD) were measured by enzymelinked immunosorbent assay with Western blotting kit (BLOT). All participants underwent oral glucose tolerance test (OGTT) to measure fasting C-peptide (FC-p), 30-minute postprandial C-peptide (30-min PC-p), 60-minute postprandial C-peptide (60-min PC-p), 120-minute postprandial C-peptide (120-min PC-p), and 180-minute postprandial C-peptide (180-min PC-p) by electrochemiluminescence immunoassay with chemiluminescent analyzers (ROCHE COBASE 601) and FPG and PBG by endpoint method with automatic biochemical analyzers (BECKMAN COULTER AU5821/BECKMAN COULTER AU5421/HITACHI 7180). The above laboratory variables were analyzed in the centers of Clinical Laboratory of all participating hospitals according to the standard methods. All centers of Clinical Laboratory implements internal and external quality control procedures directed by a Chinese Quality Control Laboratory.
After completing the above laboratory tests, professional physicians formulated the baseline antihyperglycemic treatments for the first time based on clinical experience. Data was also collected on antihyperglycemic drugs of baseline treatments in each participant, including metformin, sulfonylureas (SU), glinides, thiazolidinedione (TZD), insulin, GLP-1 receptor agonists, SGLT-2 inhibitors, DPP-4 inhibitors, and α-glucosidase inhibitors. Data was collected by uniformly trained professional resident physicians at each center.
HOMA2-β and HOMA2-IR were calculated by FPG and FC-p using the following formulas: HOMA2-β = 0.27 × FC-p [pmol/L]/(FPG [mmol/L]—3.5) and HOMA2-IR = 1.5 + (FPG [mmol/L] × FC-p [pmol/L]/2800) (12, 14). Body mass index (BMI) was calculated using the following formula: BMI = body weight (kg)/body height (m2) (15). Two highly recognized noninvasive liver fibrosis indexes were calculated from routine laboratory variables as per the formulas given below: 1. aspartate aminotransferase to platelet ratio index (APRI) = [AST (U/L)/normal upper limit reference value × 100]/[PLT (× 109/L)] (16). 2. γ-glutamyl transpeptidase to platelet ratio (GPR) = [GGT (U/L)]/[PLT (× 109/L)] (17). The estimated glomerular filtration rate (eGFR) level was calculated using the modification of diet in renal disease (MDRD) equation for Chinese patients. The following formula was used: eGFR (ml/min/1.73 m2) = 175 × SCr (mg/dl)−1.234 × old (years)−0.179 × (0.79 if female) (18).
2.3. Definitions of Diabetes-Related Complications and Comorbidities
All participants were screened for diabetes-related complications. Diabetic retinopathy (DR) was diagnosed by professional ophthalmologists based on retina fundus photographs taken by non-mydriatic retina fundus cameras (19). The diagnostic criteria of diabetic kidney disease (DKD) were glomerular filtration rate (GFR) < 60 ml/min/1.73 m2 and/or urinary albumin to creatinine ratio (UACR) ≥ 30 mg/g for more than three months, excluding chronic kidney diseases due to other causes (20, 21). Ankle brachial index (ABI) and transcutaneous oxygen pressure (TcPO2) were measured by arteriosclerosis diagnostic instrument and transcutaneous oxygen pressure detector respectively. ABI < 0.9 and/or TcPO2 < 40 mmHg suggested diabetic peripheral vascular disease (DPVD) (22, 23). Diabetic distal symmetric polyneuropathy (DSPN) was diagnosed by measuring ankle reflex, acupuncture pain perception, vibration perception, pressure perception, and temperature perception according to the Chinese guideline for the prevention and treatment of type 2 diabetes mellitus (2017 edition) (24). Diabetic ketoacidosis (DKA) was characterized by hyperglycemia (blood glucose > 13.9mmol/L [250mg/dL]), hyperketonemia (serum ketone body ≥3 mmol/L), and metabolic acidosis. Specific diagnostic criteria were referred to the guidelines for diagnosis and therapy of hyperglycemic crisis in China (25). Diabetes-related comorbidities collected in this study included cardiovascular diseases (CVD) and/or stroke, metabolic syndrome (MS), and non-alcoholic fatty liver disease (NAFLD). The histories of CVD and/or stroke were determined by inquiring medical histories and collecting previous medical records. The diagnostic criteria of MS referred to the recommendations of Chinese Diabetes Society (26). NAFLD was diagnosed by experienced sonographers using the high-resolution ultrasound imaging system, after excluding excessive alcohol and previous history of related liver diseases (27).
2.4. Statistical Analyses
Statistical analyses were conducted using SPSS software version 26 (IBM NY). We used two step clustering analysis to cluster the data into five subgroups according to six variables, including age at diagnosis, BMI, HbA1c, HOMA2-β, HOMA2-IR, and presence or absence of diabetes-related auto-antibodies. Before this, the five numerical variables were normalized. These five continuous variables of clustering analysis were used as the main outcome indicators to estimate the sample size of comparisons among multiple groups using PASS software version 15 (REACHSOFT BEI JING). Data were presented as frequencies (percentages) for count data, means ± standard deviations for normally distributed continuous variables, and medians (interquartile ranges) for nonnormally distributed continuous variables. For normally distributed continuous variables, the analysis of variance (ANOVA) was performed to assess significant differences among multiple groups. Least significant difference (LSD) or Tamhane T2 test was used for pairwise comparisons based on the test for homogeneity of variance. If the continuous variables were nonnormally distributed, the Kruskal-Wallis test was used for comparisons among multiple groups and the Nemenyi test was used for pairwise comparisons. The chi-squared test and bonferroni correction method were performed to assess significant differences in multiple groups and pairwise groups for the count data, respectively. Logistic regression analysis was used to calculate odd ratio (OR) and 95% confidence interval (CI) of diabetes-related complications and comorbidities. P value < 0.05 was considered significant.
3 Results
3.1. Clustering Analysis
A total of 1017 inpatients with new-onset diabetes were eligible for this study. According to the clustering analysis, the participants were divided into five subgroups, including 42 (4.13%) patients with SAID, 451 (44.35%) patients with SIDD, 81 (7.96%) patients with SIRD, 207 (20.35%) patients with MOD, and 236 (23.21%) patients with MARD (Figure 1). The sample size estimates of comparisons among multiple groups showed that sample sizes of 7, 78, 14, 35, and 40 are obtained from the five groups whose means are to be compared. The total sample of 174 subjects achieves 91% power to detect differences among the means versus the alternative of equal means using an F test with a 0.05 significance level. It can be seen that the sample size of our study is sufficient.
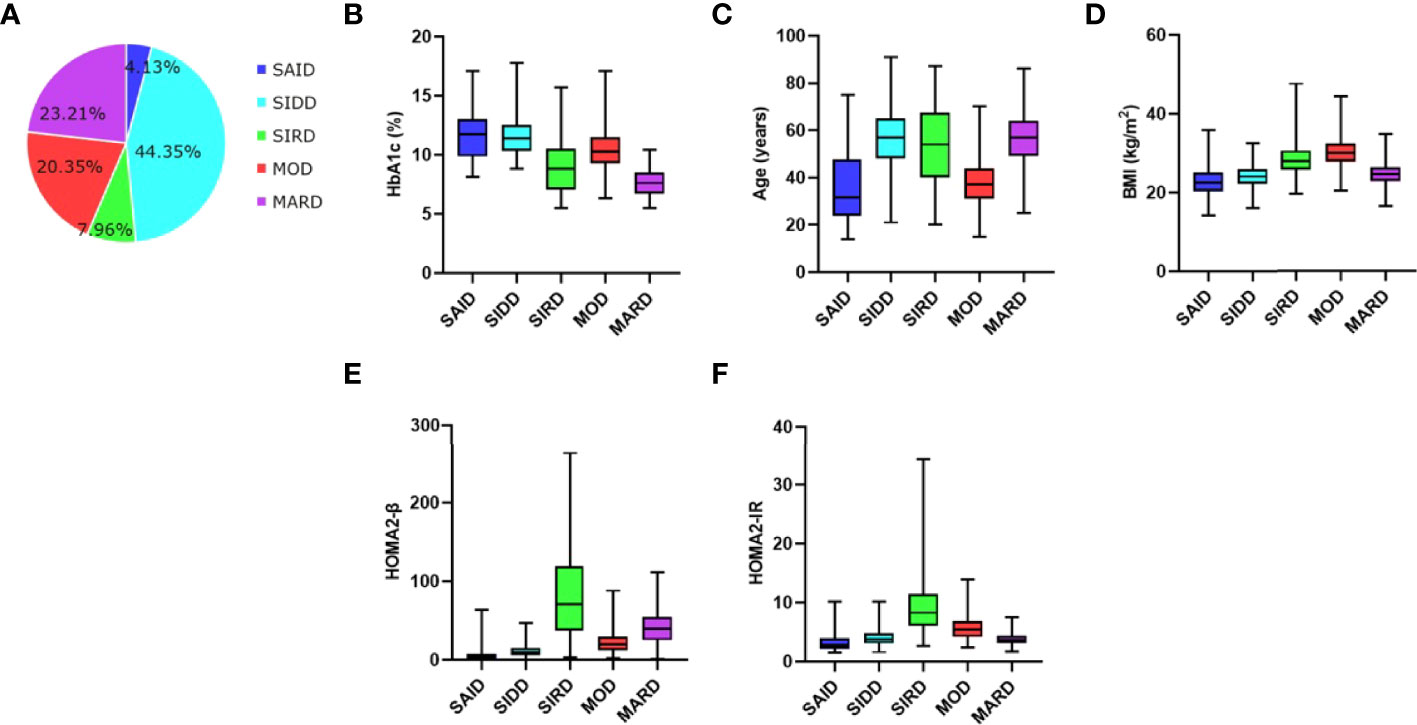
Figure 1 Distribution and clustering characteristics of patients (A) Distribution of patients (n, 1017) according to the clustering analysis. Distributions of (B) HbA1c, (C) age at diagnosis, (D) BMI, (E) HOMA2‐β, and (F) HOMA2‐IR in patients for each cluster of the study. SAID, severe autoimmune diabetes. SIDD, severe insulin-deficient diabetes. SIRD, severe insulin-resistant diabetes. MOD, mild obesity-related diabetes. MARD, mild age-related diabetes. BMI, body mass index. HOMA2-β, homeostasis model assessment 2 estimates of β cell function index. HOMA2-IR, homeostasis model assessment 2 estimates of insulin resistance index.
3.2. Clinical Characteristics of Different Subgroups
Clustering analysis with six variables revealed that the five subtypes had their own unique characteristics (Figure 1). SAID was equivalent to traditional type 1 diabetes mellitus and was characterized by poor metabolic control in blood glucose (the highest HbA1c), early-onset disease, relatively low BMI, overt insulin deficiency (the lowest HOMA2-β), no insulin resistance, and positive diabetes-related auto-antibodies. In the SAID group, there were 24 patients with only one kind of diabetes-related auto-antibodies for GADA, accounting for 57.14%, followed by 10 patients with only one kind of diabetes-related auto-antibodies for ICA-120, accounting for 23.81%, and a few patients with two or three different antibodies at the same time (Supplementary Table 1). SIDD was diabetes-related auto-antibodies negative and late-onset disease but otherwise similar to SAID. The characteristics of SIRD were severe insulin resistance (the highest HOMA2-IR), more insulin secretion (the highest HOMA2-β), relatively high BMI, and late-onset age. MOD was characterized by the highest BMI, mild insulin resistance, and early-onset disease. Patients with MARD were diagnosed at the latest age and they were only modest metabolic derangement in blood glucose (the lowest HbA1c) with better islet β-cell function.
The baseline characteristics of different subgroups in addition to the clustering variables were shown in Table 1. Among the five subgroups, no significant differences were observed in terms of sex, smoking status, and alcohol (P > 0.05). GA, FPG, and PBG were the highest in SAID and SIDD groups (P < 0.05 vs the other three groups), while the lowest in MARD group (P < 0.05 vs the other four groups). Patients with SAID were more likely to have symptoms of polydipsia, polyuria, polyphagia, and emaciation. Patients with MOD had the strongest genetic susceptibility of diabetes. Patients with SIRD and MOD seemed to have a higher lipid profile (TG), UA, liver function indexes (ALT, AST, and GGT), and recognized markers of noninvasive liver fibrosis (APRI and GPR) compared with those allocated to other clusters. Patients with SIRD and MARD had poor renal function (the lowest eGFR and the highest SCr).
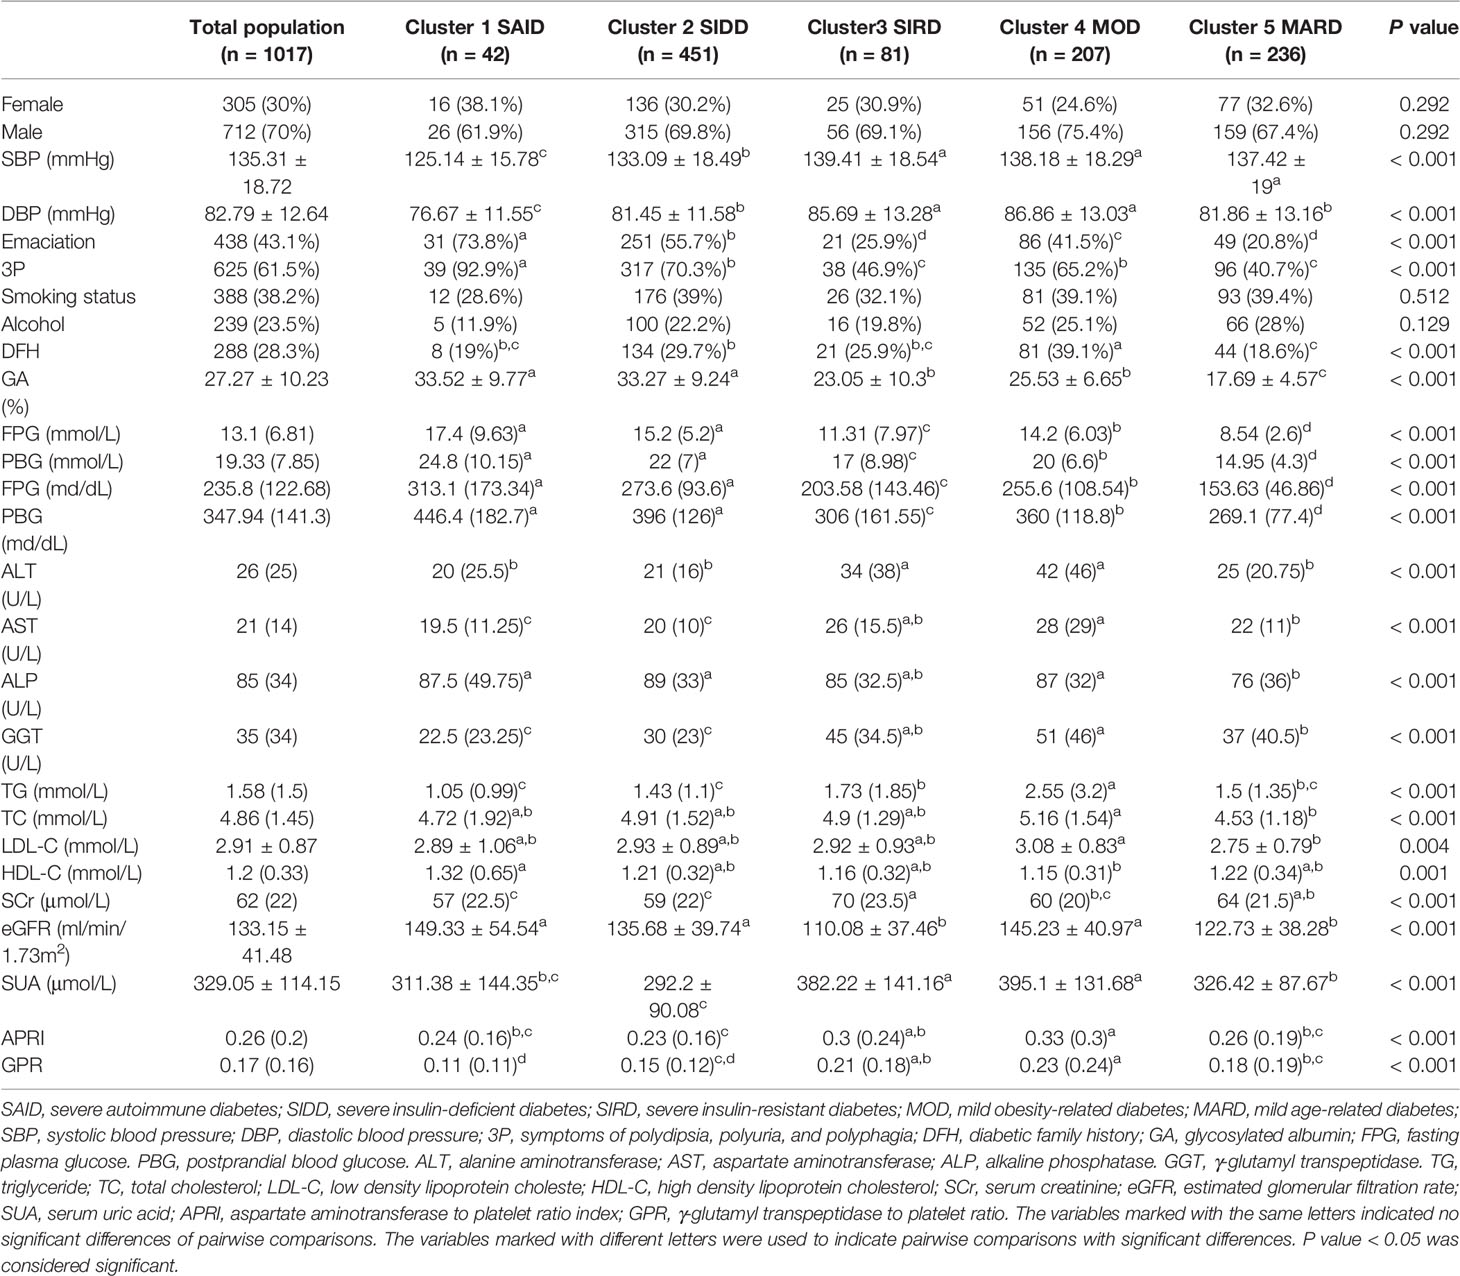
Table 1 Baseline characteristics of patients in the five subgroups.
Changes in C-p releasing levels during the OGTT of the five subgroups were shown in Figure 2. The total AUC (area under the curve) of 0-180min C-p was the highest in the SIRD group (13.19 [8.27]), followed by MARD, MOD, SIDD, and SAID groups (7.91 [3.88], 6.66[3.26], 4.21[2.54], 1.45[1.82], respectively). It showed significant statistical differences between any two groups in pairwise comparisons (P < 0.05).
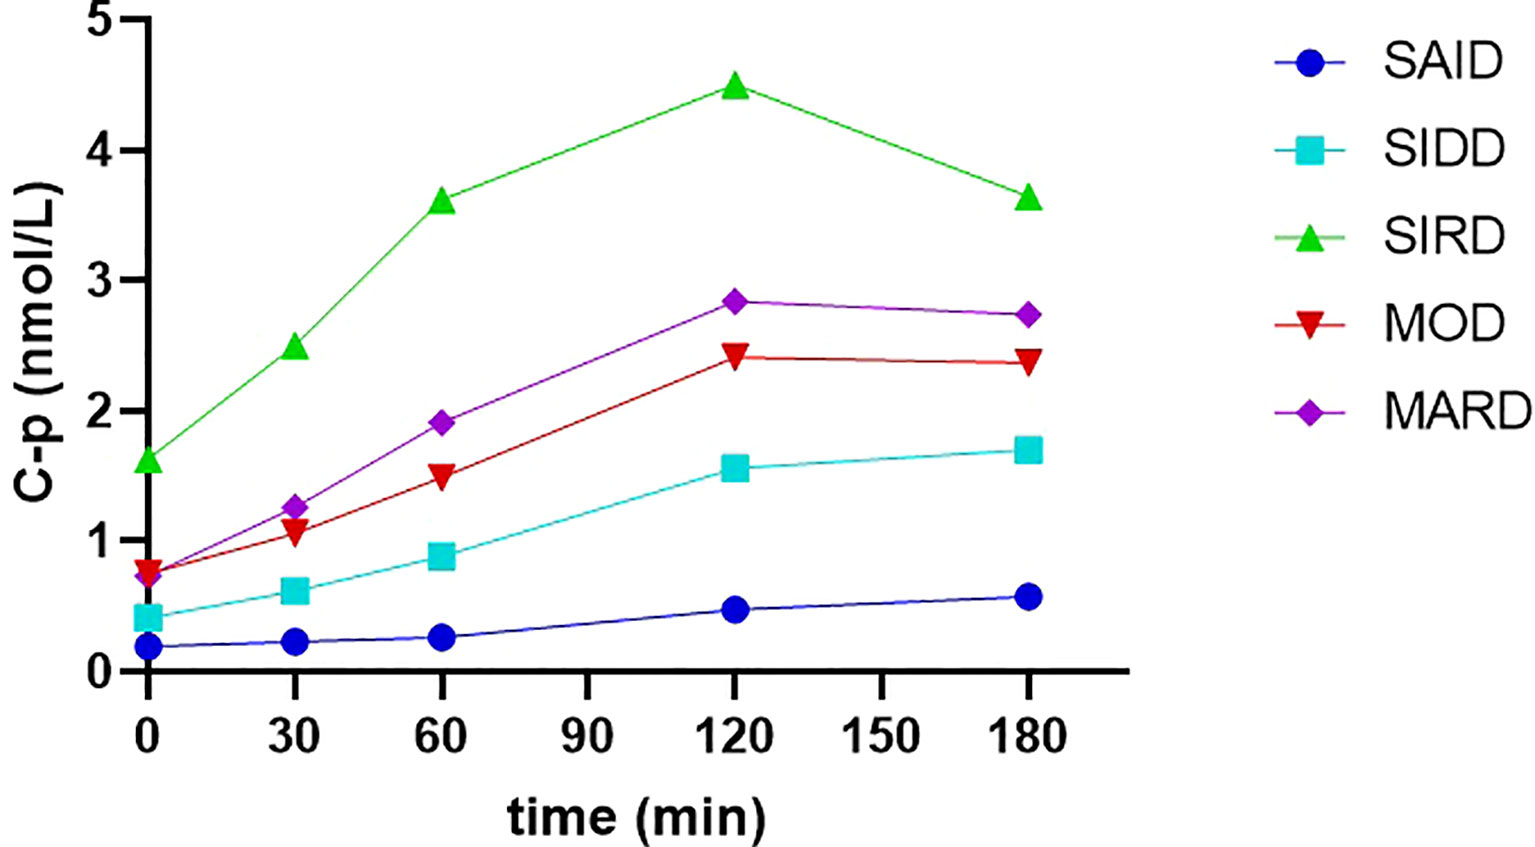
Figure 2 The releasing curves of C-p levels during the OGTT of the five subgroups C-p, C-peptide. SAID, severe autoimmune diabetes. SIDD, severe insulin-deficient diabetes. SIRD, severe insulin-resistant diabetes. MOD, mild obesity-related diabetes. MARD, mild age-related diabetes. C-p was presented as median.
3.3. Differences in Diabetes-Related Complications and Comorbidities Among the Five Subgroups
DKD was the most common in SIRD group (Figure 3). The risk of DKD was also the highest in the SIRD group, but no significant difference was seen among the five subgroups in HOMA2-IR-adjusted risk (Figure 3 and Supplementary Table 2). Patients in SIDD, SIRD, and MARD groups were more likely to develop CVD and/or stroke, DPVD, and DSPN (Figure 3). However, there was no significant difference in the risk of CVD and/or stroke, DPVD, and DSPN among the five subgroups in the adjusted model with age (Supplementary Table 2). The prevalence and risk of MS were the highest in MOD and SIRD groups, but the risk was no longer significantly higher in them after adjusting for HOMA2-IR and BMI (Figure 3 and Supplementary Table 2). There were no significant differences in the prevalence and risk of DR among the five subgroups (P > 0.05; Supplementary Table 3). Patients in SAID group had the highest prevalence of DKA (16 [38.1%], P < 0.05 vs the other four groups; Supplementary Table 3), but the risk was no longer significantly higher in them after adjusting for HOMA2-β and HbA1c (Supplementary Table 3). NAFLD was the most common in MOD group (190 [91.8%], P< 0.05 vs the other four groups; Supplementary Table 3). The risk of NAFLD was also the highest in MOD group even after adjusting for BMI and HOMA2-IR (Supplementary Table 3).
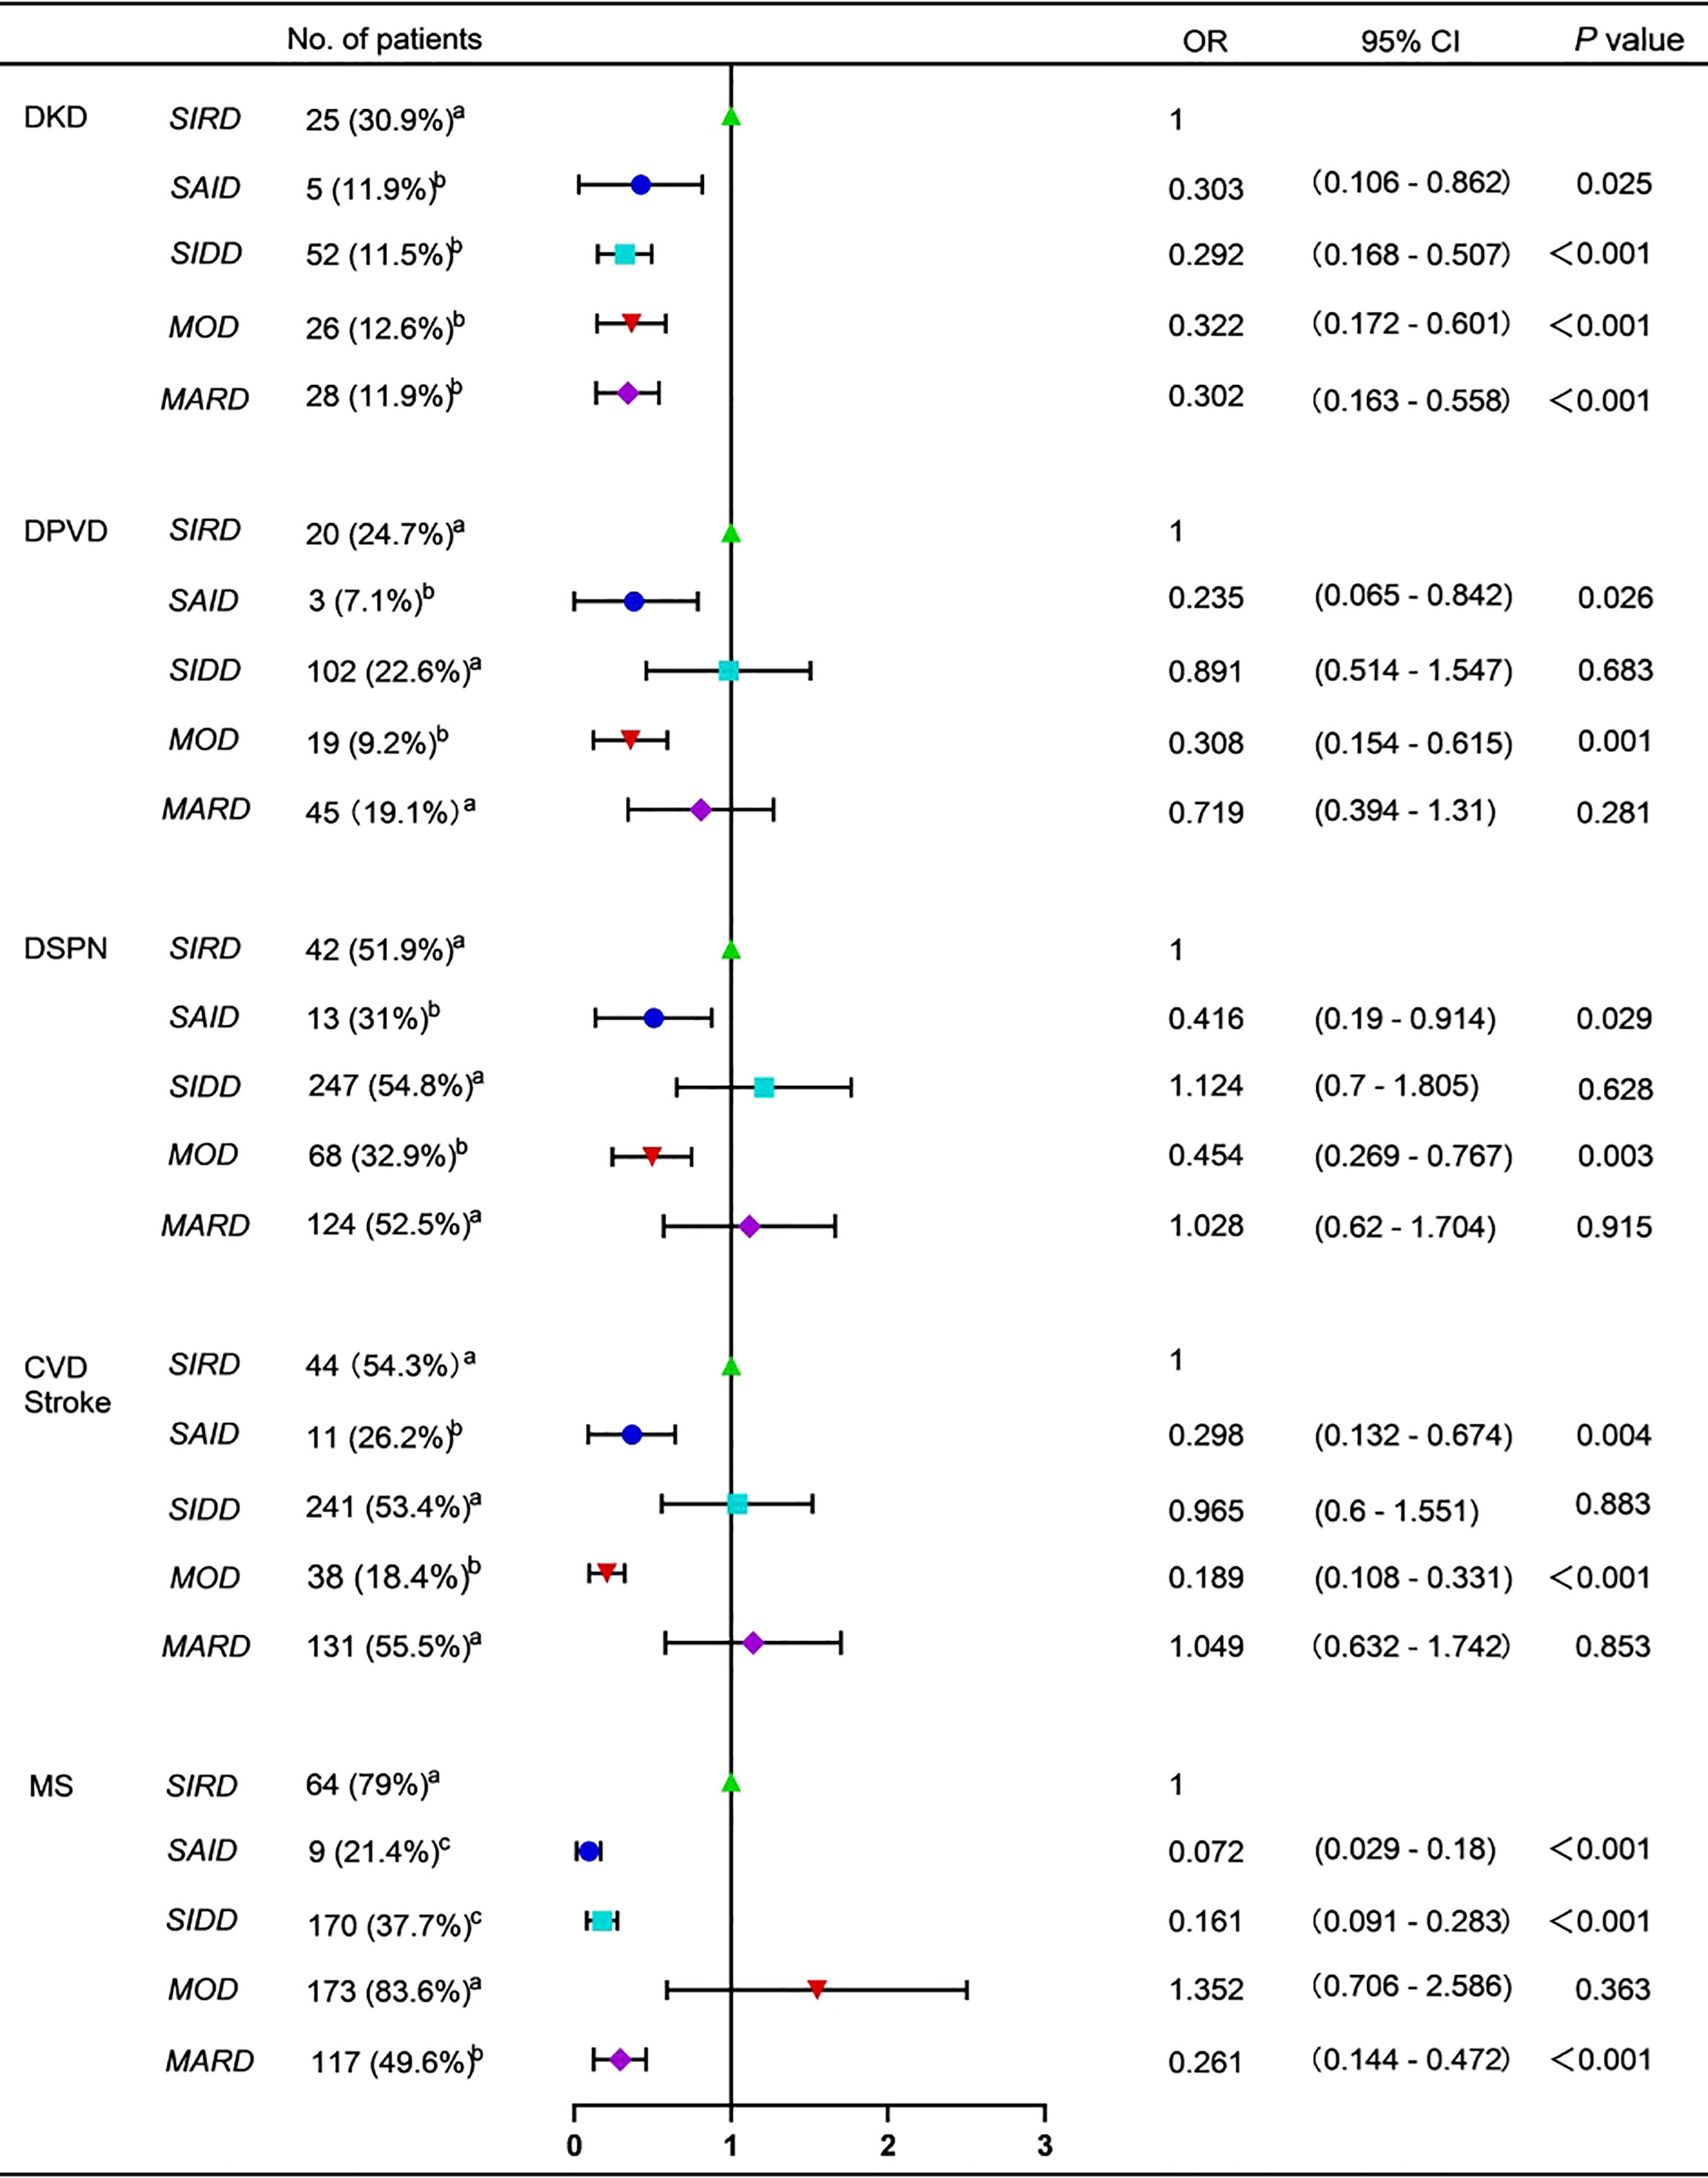
Figure 3 Forest plot for diabetes-related complications and comorbidities DKD, diabetic kidney disease. DPVD, diabetic peripheral vascular disease. DSPN, diabetic distal symmetric polyneuropathy. CVD, cardiovascular diseases. MS, metabolic syndrome. SAID, severe autoimmune diabetes. SIDD, severe insulin-deficient diabetes. SIRD, severe insulin-resistant diabetes. MOD, mild obesity-related diabetes. MARD, mild age-related diabetes. No. of patients with diabetes-related complications and comorbidities were presented as frequencies (percentages). The variables marked with the same letters indicated no significant differences in pairwise comparisons. The variables marked with different letters were used to indicate pairwise comparisons with significant differences. OR, odd ratio. 95% CI, 95% confidence interval. The SIRD group was decided as the control group. P value < 0.05 was considered significant.
3.4. Differences in Antihyperglycemic Drugs Among the Five Subgroups
Metformin was the most widely used of the nine types of antihyperglycemic drugs in all participants, followed by insulin (721 [70.9%] and 517 [50.8%], respectively). The usage rates of SU, glinides, and TZD were low and there were no significant differences among five subgroups (P > 0.05). MOD group had the highest proportion of GLP-1 receptor agonists and SGLT-2 inhibitors (P < 0.05 vs the other four groups; Figure 4). The utilization rate of DPP-4 inhibitors in SIDD, SIRD and MARD groups was significantly higher than that in SAID and MOD groups (P < 0.05; Figure 4). Insulin and α-glucosidase inhibitors were the most common in SAID and SIDD groups (P < 0.05 vs the other three groups; Figure 4).
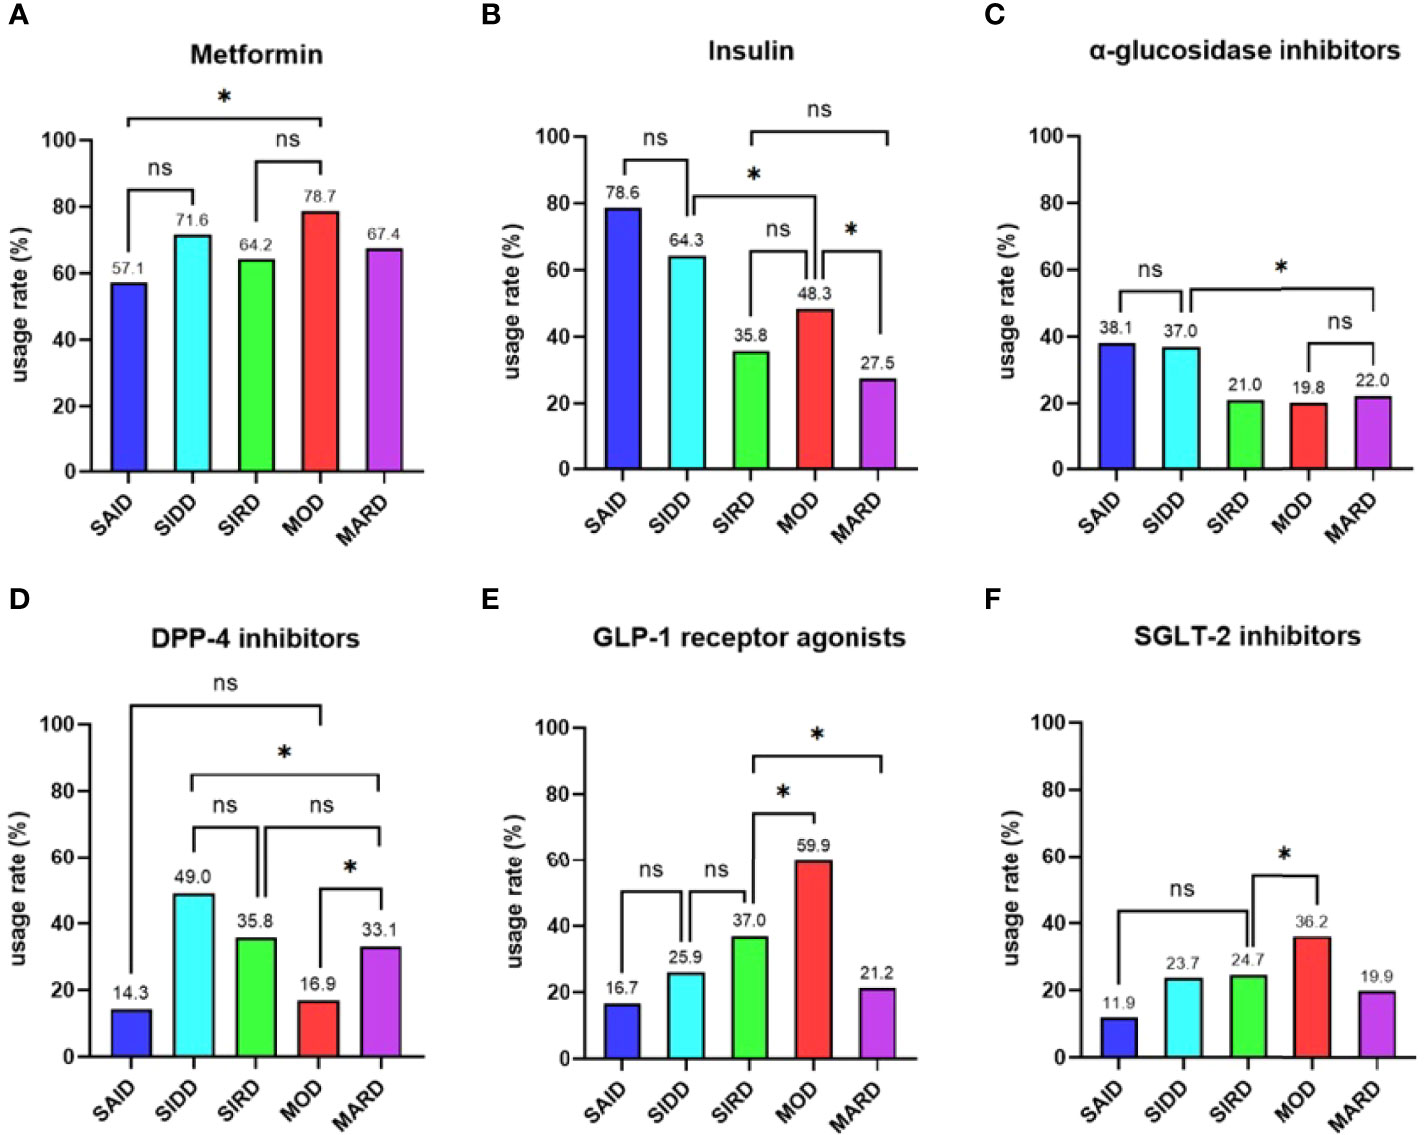
Figure 4 Comparisons of antihyperglycemic drugs among the five subgroups Differences in the usage rates of (A) metformin, (B) insulin, (C) α-glucosidase inhibitors, (D) DPP-4 inhibitors (E) GLP-1 receptor agonists, and (F) SGLT-2 inhibitors among the five subgroups. SAID = severe autoimmune diabetes. SIDD = severe insulin-deficient diabetes. SIRD = severe insulin-resistant diabetes. MOD = mild obesity-related diabetes. MARD = mild age-related diabetes. * indicated pairwise comparisons with significant differences. ns indicated pairwise comparisons without significant differences. P value < 0.05 was considered significant.
4 Discussion
The novel classification method with a data-driven clustering analysis of six variables in patients with new-onset diabetes was first used in the Nordic population, and its stability was validated in Chinese, US, German, and Japanese populations (7–11). Recently, a study found that this cluster‐based classification could also be applied to hospitalized adult patients with new-onset diabetes in Beijing, China (12). As far as we know, this is the first study to implement this new classification method for inpatients with new-onset diabetes in Eastern China. In comparison with previous studies, our study included six other diabetes-related auto-antibodies besides GADA and compared the differences of treatments in China for the first time.
The cluster‐based classification can achieve more refined and balanced diabetes typing. Most of the previous studies observed MARD was the most common subtype (7–11). As for hospitalized adult patients with new-onset diabetes in Beijing, China, Wang et al. found that the proportion of MOD was the highest followed by MARD, SIDD, SIRD, and SAID (12). However, the results of our study differ from previous studies as SIDD was the most common subtype, followed by MARD, MOD, SIRD, and SAID. This may be due to the fact that all of the subjects of our study were hospitalized patients. The blood glucose control of SIDD group was the poorest so that they may prefer hospitalization. Patients in the MARD group had the best blood glucose control, which may reduce the possibility of hospitalization. In the SWAN study, the HOMA-β was lower in Chinese Americans and Japanese Americans when compared with non-Hispanic whites and non-Mexican-American Latinos, suggesting that the β-cell secretion capacity of Asians was lower than that of westerners (28). A study of a comparison of different accelerators to early-onset type 2 diabetes mellitus between Anglo-Celtic and Chinese patients suggested that early β-cell deficiency was an important accelerator for type 2 diabetes mellitus in Chinese population (29). These results suggested that β-cell failure was more significant in Chinese patients than in western patients in the early phase of type 2 diabetes mellitus, further to result in a higher proportion of SIDD patients in the Chinese population than in the Western population. Our study found that GADA was the most common diabetes-related autoantibodies in the SAID group. Previous studies suggested that 70%-80% of newly diagnosed patients with type 1 diabetes mellitus were GADA positive and had a longer duration and higher positive rate of GADA rather than the other antibodies (30, 31). The incidence of type 1 diabetes mellitus varied greatly according to the reports all over the world (32). Western countries, especially Northern Europe, had a high incidence of type 1 diabetes mellitus, while the prevalence among Asian countries including China was low (32, 33). The study also reported that the incidence of type 1 diabetes mellitus in children under 15 years old was positively correlated with latitude, with a higher incidence in Northern China and a lower incidence in Southern China (33). The above three results explained why the incidence of SAID in our study was very low even though we included six other diabetes-related auto-antibodies besides GADA. The clustering characteristics of each subgroup in our study were consistent with the results of Ahlqvist et al. except that SIDD was a late-onset disease. This could be due to the fact that in the study of Ahlqvist et al. patients with other diabetes-related auto-antibodies positive besides GADA might be classified as SIDD, which may lead to patients with SIDD showed lower in age.
HOMA2-β was difficult to reflect the dynamic process of insulin secretion stimulated by glucose. The results of comparisons of C-p levels at five time points and the AUC of 0-180 min C-p levels in our study more strongly confirmed the differences in islet β-cell function among the five subgroups.
The previous studies all found that patients with SIRD were the most likely to develop DKD despite not too bad blood glucose control (7, 9–12). The same was true in our study, but the difference was no longer significant in HOMA2-IR-adjusted risk, further reinforcing the association between insulin resistance and DKD. Patients with MOD and SIRD had a higher levels of TG, blood pressure, and SUA and were prone to get MS. This further proved that insulin resistance and obesity were the core mechanisms of MS. Moreover, Our study found that Patients with SIDD, SIRD, and MARD were more likely to develop CVD and/or stroke, DPVD, and DSPN due to their older age. From what has been discussed above, the SIRD group may be the most serious type among the five subgroups because it was prone to have many serious complications and comorbidities.
Both Wang et al. and Ahlqvist et al. found that DKA was the major complication of SAID and SIDD groups and HbA1c was considered as the strongest predictor (7, 12). We also found that the risk of DKA in SAID group was no longer significantly high after adjusting for HOMA2-β and HbA1c. Both in Nordic and German studies, the SIRD group was more likely to have NAFLD because the TM6SF2 gene usually associated with NAFLD was in SIRD group, but not in MOD group (7, 10). However, our research showed that the highest risk of NAFLD was in the MOD group. The risk was still more than twice as high as the other four groups even after adjusting for HOMA2-IR and BMI, indicating that excluding the effects of BMI and HOMA2-IR, the clustering itself still had a high predictive value for NAFLD. This may be due to the complex pathogenesis of NAFLD, and its intrinsic pathophysiological basis still needed to be further explored.
As for treatments, our study found that as the recognized first-line antihyperglycemic drug, metformin was the most commonly used in all participants. Considering that our study subjects were all inpatients, their blood glucose levels may be higher than those in the whole diabetic population, which leaded to a higher use of insulin in our study. Both Nordic and our studies found that SAID and SIDD groups had the highest usage rate of insulin (7). Patients in these two groups were characterized by poor metabolic control in blood glucose and overt insulin deficiency, so early use of insulin was appropriate. Our study found that α-glycosidase inhibitors were also the most commonly used in patients with SAID and SIDD, because of the higher PBG in these two groups. A study showed that DPP-4 inhibitors with good safety and low incidence of hypoglycemia could be a great choice for elderly type 2 diabete mellitus patients (34). In our study, the usage rate of DPP-4 inhibitors in patients with SIDD, SIRD, and MARD which were characterized by late-onset age was significantly higher than that in patients with SAID and MOD which were characterized by early-onset age. In our study, MOD patients were more likely to use SGLT-2 inhibitors and GLP-1 receptor agonists, which also had weight loss effects. To sum up, according to the results of cluster‐based classification, the current treatments were relatively reasonable. There were researches that showed SGLT-2 inhibitors significantly reduce the risk of major adverse cardiovascular events and related kidney diseases (35, 36). Some studies suggested that GLP-1 receptor agonists can not only reduce weight, but also prevent cardiovascular diseases (37, 38). It reminded us that the initial treatment of SGLT-2 inhibitors may be more effective for patients with SIRD to improve late prognosis. However, in our study, only 24.7% of patients in the SIRD group used SGLT-2 inhibitors, and there was no significant difference in the utilization rate compared with SAID, SIDD, and MARD groups. SIDD and MARD groups with a higher risk of CVD and/or stroke, the utilization rates of SGLT-2 inhibitors and GLP-1 receptor agonists were also about 20%. It showed that although the traditional classification method considered the external characteristics of disease in guiding the formulation of treatment options, it could not identify the potential risk of different patients in the early stage. The cluster‐based classification of diabetes could help to predict the risk of diabetes-related complications and comorbidities and guide treatments, which may make up for the long-term clinical needs that cannot be met by the traditional classification.
Considering that the precise diagnosis and classification of diabetes is still in its infancy, although clustering classification fails to achieve precision in the true sense, it can progress from the original fuzzy typing to relatively precise typing. Clustering classification is a complement to the traditional classification rather than a substitute. The traditional classification is the etiological classification and will continue to be used in the future. These two classifications are not contradictory and can complement each other to better guide treatments.
The cluster‐based classification has been applied to inpatients in National Center of Gerontology, suggesting that the classification system was also applicable to inpatients with diabetes in China (12). This has laid a solid theoretical foundation for our research. However, most of the inpatients in National Center of Gerontology were the elderly, so we further tracked and explored on this basis. Under the three-level medical service system in China, our study included patients from five hospitals at these three levels, so the age of subjects may be more balanced. However, our study also had some limitations. Firstly, Sterling et al. found that patients can move between clusters from baseline to 5-year follow-up (10). However, our study is a cross-sectional study. With the progression of diabetes, the stability of cluster‐based classification and the occurrence or development of diabetes-related diseases were not fully verified. Secondly, differences in response to various treatments among the five subgroups were not explored. Thirdly, GADA and C-peptide assays are expensive, which limits their use in the developing countries. Finally, the small sample size of patients with SAID may lead to be prone to class II errors, so the results of pairwise comparisons between SAID group and the other groups were biased. More prospective studies in larger and more diverse populations are needed to confirm the results of our study in the future. RCTs are also required to assess the clinical utility of any reclassification effort.
5 Conclusions
Clustering distribution of inpatients with new-onset diabetes in Eastern China was different to that of participants from other regions and sources. The clustering characteristics of patients in different subgroups were basically consistent with the results of Ahlqvist et al. The clinical characteristics, treatments, and the prevalence and risk of diabetes-related complications and comorbidities of patients in five subtypes were apparently different. Due to late-onset age, severe insulin resistance, and obesity, SIRD was the most severe type and may require early intensive and precise therapies. The current treatment strategies only considered the external characteristics of the patients and had some defects. The new cluster‐based classification might be an important step towards precise treatments for diabetes, which is helpful to realize the personalized managements and treatments of diabetes.
Data Availability Statement
The raw data supporting the conclusions of this article will be made available by the authors, without undue reservation.
Ethics Statement
The studies involving human participants were reviewed and approved by The ethics committee of Zhongda hospital (2018ZDSYLL143-P01). Written informed consent to participate in this study was provided by the participants’ legal guardian/next of kin.
Author Contributions
XS contributed to the conception of the work, data analyses, and drafting the manuscript. Yl revised the manuscript. JS guided the statistical analyses of this study. XS, NH, TY, XW, JZ, ZZ, HG, JL, WZ, HY, QW, and KW made contributions to acquisition of data. LL and KW revised it critically for important intellectual content. All authors approved the final version.
Funding
This work was supported by National Natural Science Foundation of China (81970717 and 82170845) and Scientific Research Project of Jiangsu Provincial Health Commission (ZD2021007).
Conflict of Interest
The authors declare that the research was conducted in the absence of any commercial or financial relationships that could be construed as a potential conflict of interest.
Publisher’s Note
All claims expressed in this article are solely those of the authors and do not necessarily represent those of their affiliated organizations, or those of the publisher, the editors and the reviewers. Any product that may be evaluated in this article, or claim that may be made by its manufacturer, is not guaranteed or endorsed by the publisher.
Acknowledgments
The authors thank the staff in Affiliated Jiangning Hospital of Nanjing Medical University, The Second People’s Hospital of Wuhu, Nanjing Central Hospital, and Xigang Community Health Service Center for support with this work.
Supplementary Material
The Supplementary Material for this article can be found online at: https://www.frontiersin.org/articles/10.3389/fendo.2022.927661/full#supplementary-material
References
1. Saeedi P, Petersohn I, Salpea P, Malanda B, Karuranga S, Unwin N, et al. Global and Regional Diabetes Prevalence Estimates for 2019 and Projections for 2030 and 2045: Results From the International Diabetes Federation Diabetes Atlas, 9th Edition. Diabetes Res Clin Pract (2019) 157:107843. doi: 10.1016/j.diabres.2019.107843
2. GBD 2016 Disease and Injury Incidence and Prevalence Collaborators. Global, Regional, and National Incidence, Prevalence, and Years Lived With Disability for 328 Diseases and Injuries for 195 Countries, 1990-2016: A Systematic Analysis for the Global Burden of Disease Study 2016. Lancet (2017) 390:1211–59. doi: 10.1016/S0140-6736(17)32154-2
3. American Diabetes Association. 2. Classification and Diagnosis of Diabetes: Standards of Medical Care in Diabetes-2020. Diabetes Care (2020) 43:S14–31. doi: 10.2337/dc20-S002
4. Weng J, Zhu D, Mu Y, Zhao J, Ji L, Groop L, et al. Future of Diabetes: Precision Medicine in Prediction, Diagnosis and Treatment. Chin J Diabetes Mellitus (2019) 11:369–73. doi: 10.3760/cma.j.issn.1674-5809.2019.06.001
5. Bowman P, Flanagan SE, Hattersley AT. Future Roadmaps for Precision Medicine Applied to Diabetes: Rising to the Challenge of Heterogeneity. J Diabetes Res (2018) 2018:1–12. doi: 10.1155/2018/3061620
6. Prasad RB, Groop L. Precision Medicine in Type 2 Diabetes. J Intern Med (2019) 285:40–8. doi: 10.1111/joim.12859
7. Ahlqvist E, Storm P, Käräjämäki A, Martinell M, Dorkhan M, Carlsson A, et al. Novel Subgroups of Adult-Onset Diabetes and Their Association With Outcomes: A Data-Driven Cluster Analysis of Six Variables. Lancet Diabetes Endocrinol (2018) 6:361–9. doi: 10.1016/S2213-8587(18)30051-2
8. Zou X, Zhou X, Zhu Z, Ji L. Novel Subgroups of Patients With Adult-Onset Diabetes in Chinese and US Populations. Lancet Diabetes Endocrinol (2019) 7:9–11. doi: 10.1016/S2213-8587(18)30316-4
9. Dennis JM, Shields BM, Henley WE, Jones AG, Hattersley AT. Disease Progression and Treatment Response in Data-Driven Subgroups of Type 2 Diabetes Compared With Models Based on Simple Clinical Features: An Analysis Using Clinical Trial Data. Lancet Diabetes Endocrinol (2019) 7:442–51. doi: 10.1016/S2213-8587(19)30087-7
10. Zaharia OP, Strassburger K, Strom A, Bönhof GJ, Karusheva Y, Antoniou S, et al. Risk of Diabetes-Associated Diseases in Subgroups of Patients With Recent-Onset Diabetes: A 5-Year Follow-Up Study. Lancet Diabetes Endocrinol (2019) 7:684–94. doi: 10.1016/S2213-8587(19)30187-1
11. Tanabe H, Saito H, Kudo A, Machii N, Hirai H, Maimaituxun G, et al. Factors Associated With Risk of Diabetic Complications in Novel Cluster-Based Diabetes Subgroups: A Japanese Retrospective Cohort Study. J Clin Med (2020) 9:2083. doi: 10.3390/jcm9072083
12. Wang W, Pei X, Zhang L, Chen Z, Lin D, Duan X, et al. Application of New International Classification of Adult-Onset Diabetes in Chinese Inpatients With Diabetes Mellitus. Diabetes Metab Res Rev (2020) 37:e3427. doi: 10.1002/dmrr.3427
13. Alberti KG, Zimmet PZ. Definition, Diagnosis and Classification of Diabetes Mellitus and Its Complications. Part 1: Diagnosis and Classification of Diabetes Mellitus Provisional Report of a WHO Consultation. Diabetes Med (1998) 15:539–53. doi: 10.1002/(SICI)1096-9136(199807)15:7<539::AID-DIA668>3.0.CO;2-S
14. Li X, Zhou Z, Qi H, Chen X, Huang G. Replacement of Insulin by Fasting C-Peptide in Modified Homeostasis Model Assessment to Evaluate Insulin Resistance and Islet β Cell Function. J Cent South Univ (medical sciences) (2004) 29:419–23. doi: 10.3321/j.issn:1672-7347.2004.04.012
15. Risk Factor Collaboration NCD. Worldwide Trends in Body-Mass Index, Underweight, Overweight, and Obesity From 1975 to 2016: A Pooled Analysis of 2416 Population-Based Measurement Studies in 128.9 Million Children, Adolescents, and Adults. Lancet (2017) 390(10113):2627–42. doi: 10.1016/S0140-6736(17)32129-3
16. Wai CT, Greenson JK, Fontana RJ, Kalbfleisch JD, Marrero JA, Conjeevaram HS, et al. A Simple Noninvasive Index can Predict Both Significant Fibrosis and Cirrhosis in Patients With Chronic Hepatitis C. Hepatology (2003) 38:518–26. doi: 10.1053/jhep.2003.50346
17. Lemoine M, Shimakawa Y, Nayagam S, Khalil M, Suso P, Lloyd J, et al. The Gamma-Glutamyl Transpeptidase to Platelet Ratio (GPR) Predicts Significant Liver Fibrosis and Cirrhosis in Patients With Chronic HBV Infection in West Africa. Gut (2016) 65:1369–76. doi: 10.1136/gutjnl-2015-309260
18. Ma Y, Zuo L, Chen J, Luo Q, Yu X, Li Y, et al. Modified Glomerular Filtration Rate Estimating Equation for Chinese Patients With Chronic Kidney Disease. J Am Soc Nephrol (2006) 17:2937–44. doi: 10.1681/ASN.2006040368
19. Martinell M, Dorkhan M, Stålhammar J, Storm P, Groop L, Gustavsson C. Prevalence and Risk Factors for Diabetic Retinopathy at Diagnosis (DRAD) in Patients Recently Diagnosed With Type 2 Diabetes (T2D) or Latent Autoimmune Diabetes in the Adult (LADA). J Diabetes Complications (2016) 30:1456–61. doi: 10.1016/j.jdiacomp.2016.08.009
20. Kidney Disease: Improving Global Outcomes (KDIGO) Diabetes Work Group. KDIGO 2020 Clinical Practice Guideline for Diabetes Management in Chronic Kidney Disease. Kidney Int (2020) 98:S1–S115. doi: 10.1016/j.kint.2020.06.019
21. Microvascular Complications Group of Chinese Diabetes Society. Clinical Guideline for the Prevention and Treatment of Diabetic Kidney Disease in China (2021 Edition). Chin J Diabetes Mellitus (2021) 13:762–84. doi: 10.3760/cma.j.cn115791-20210706-00369
22. American Diabetes Association. Peripheral Arterial Disease in People with Diabetes. Diabetes Care (2003) 26:3333–41. doi: 10.2337/diacare.26.12.3333
23. Fife CE, Smart DR, Sheffield PJ, Hopf HW, Clarke D. Transcutaneous Oximetry in Clinical Practice: Consensus Statements From an Expert Panel Based on Evidence. Undersea Hyperb Med (2009) 36:43–53. doi: 10.1095/biolreprod57.2.320
24. Chinese Diabetes Society. Chinese Guideline for the Prevention and Treatment of Type 2 Diabetes Mellitus (2017 Edition). Chin J Diabetes Mellitus (2018) 10:4–67. doi: 10.3760/cma.j.issn.1674-5809.2018.01.003
25. Chinese Diabetes Society. Guidelines for Diagnosis and Therapy of Hyperglycemic Crisis in China. Chin J Diabetes Mellitus (2013) 5:449–61. doi: 10.3760/cma.j.issn.1674-5809.2013.08.001
26. Metabolic syndrome research Cooperative Group of Chinese Diabetes Society. Recommendations of Chinese Diabetes Society on Metabolic Syndrome. Chin J Diabetes Mellitus (2004) 12:156–61. doi: 10.3321/j.issn:1006-6187.2004.03.002
27. Wang L, Li M, Zhao Z, Xu M, Lu J, Wang T, et al. Ideal Cardiovascular Health is Inversely Associated With non-Alcoholic Fatty Liver Disease: A Prospective Analysis. Am J Med (2018) 131:1515.e1–1515.e10. doi: 10.1016/j.amjmed.2018.07.011
28. Torréns JI, Skurnick J, Davidow AL, Korenman SG, Santoro N, Soto-Greene M, et al. Ethnic Differences in Insulin Sensitivity and β-Cell Function in Premenopausal or Early Perimenopausal Women Without Diabetes: The Study of Women's Health Across the Nation (SWAN). Diabetes Care (2004) 27:354–61. doi: 10.2337/diacare.27.2.354
29. Wong J, Molyneaux L, Deming Z, Constantino M, Gray RS, Twigg SM, et al. Different Accelerators to Early-Onset Type 2 Diabetes: A Comparison of Anglo-Celtic and Chinese Patients. J Diabetes Complications (2008) 22:389–94. doi: 10.1016/j.jdiacomp.2007.04.003
30. Yang B, Sun G. Clinical Research Progress of Autoantibodies in Type 1 Diabetes. Med Recapitulate (2007) 13:944–6. doi: 10.3969/j.issn.1006-2084.2007.12.030
31. Zhang S, Li Y. Research Progress of Autoantibodies in Type 1 Diabetes. Chin J Clin Lab Sci (2009) 27:148–50. doi: 10.13602/j.cnki.jcls.2009.02.026
32. Karvonen M, Viik-Kajander M, Moltchanova E, Laporte R, Tuomilehto J. Incidence of Childhood Type 1 Diabetes Worldwide. Diabetes Care (2000) 23:1516–26. doi: 10.2337/diacare.23.10.1516
33. Weng J, Zhou Z, Guo L, Zhu D, Ji L, Luo X, et al. Incidence of Type 1 Diabetes in China, 2010-13: Population Based Study. BMJ (2018) 360:j5295. doi: 10.1136/bmj.j5295
34. Liu X, Wang L, Xing Y, Engel SS, Zeng L, Yao B, et al. Efficacy and Safety of Metformin and Sitagliptin-Based Dual and Triple Therapy in Elderly Chinese Patients With Type 2 Diabetes: Subgroup Analysis of STRATEGY Study. J Diabetes Investig (2020) 11:1532–41. doi: 10.1111/jdi.13277
35. Zinman B, Wanner C, Lachin JM, Fitchett D, Bluhmki E, Hantel S, et al. Empagliflozin, Cardiovascular Outcomes, and Mortality in Type 2 Diabetes. N Engl J Med (2015) 373:2117–28. doi: 10.1056/NEJMoa1504720
36. Neal B, Perkovic V, Mahaffey KW, de Zeeuw D, Fulcher G, Erondu N, et al. Canagliflozin and Cardiovascular and Renal Events in Type 2 Diabetes. N Engl J Med (2017) 377:644–57. doi: 10.1056/NEJMoa1611925
37. Marso SP, Daniels GH, Brown-Frandsen K, Kristensen P, Mann JFE, Nauck MA, et al. Liraglutide and Cardiovascular Outcomes in Type 2 Diabetes. N Engl J Med (2016) 375:311–22. doi: 10.1056/NEJMoa1603827
Keywords: clustering analysis, diabetes, precise treatments, Eastern China, inpatients
Citation: Song X, Lv Y, Huang N, Sun J, Yang T, Wang X, Zhang J, Zhou Z, Gao H, Li J, Zhang W, Yin H, Wei Q, Wang K and Li L (2022) Clinical Characteristics of Inpatients With New-Onset Diabetes Mellitus in Eastern China: Based on Novel Clustering Analysis. Front. Endocrinol. 13:927661. doi: 10.3389/fendo.2022.927661
Received: 24 April 2022; Accepted: 13 June 2022;
Published: 27 July 2022.
Edited by:
Katsumi Iizuka, Fujita Health University, JapanReviewed by:
Abdurezak Ahmed Abdela, Addis Ababa University, EthiopiaSudhanshu Kumar Bharti, Patna University, India
Copyright © 2022 Song, Lv, Huang, Sun, Yang, Wang, Zhang, Zhou, Gao, Li, Zhang, Yin, Wei, Wang and Li. This is an open-access article distributed under the terms of the Creative Commons Attribution License (CC BY). The use, distribution or reproduction in other forums is permitted, provided the original author(s) and the copyright owner(s) are credited and that the original publication in this journal is cited, in accordance with accepted academic practice. No use, distribution or reproduction is permitted which does not comply with these terms.
*Correspondence: Kun Wang, doc_kunwang@163.com; Ling Li, dr_liling@126.com
†These authors have contributed equally to this work and share first authorship